how to use rapid rural appraisal (rra) and forestry to … · how to use rapid rural appraisal...
TRANSCRIPT
1 Introduction
2 Preparing for field research
3 Conducting field research
4 RRA tools and how to use them
5 Documenting the case study
References
How to useRapid ruralappraisal(RRA) to developcase studies
GENDER ANALYSISAND FORESTRY
PAGE 3
1 Introduction
This section describes how to develop case studiesespecially adapted for training workshops in gender
analysis and forestry by using rapid rural appraisal (RRA).It includes a selection of RRA tools which may be useful inconducting field research. The section has been writtenfor researchers who are already familiar with the processof rapid rural appraisal.1
These examples of tools for developing case studies fortraining are intended for use in a process which is asparticipatory as possible, although it is recognized thatusing RRA tools alone does not lead to long termparticipatory development in the case study area. Despitethis, using the RRA tools can be a catalyst toempowerment of rural women and men becauseopportunities are created, and arise, for them to voicetheir concerns and priorities; therefore, these tools shouldbe seen as part of a larger process, not a substitute for it.
Developing case studies based on the immediateworking environment of the trainees, such as foresters,has distinct advantages for training. Trainees are likely torespond with more concrete and realisticrecommendations when they themselves will beimplementing the changes they suggest, based on a casestudy during a workshop.
As an alternative to developing specialized case studies,a selection of case studies from the Asia Programme areprovided in Section D of this Package. Using case studiesthat are removed from the work of the trainees has theadvantage of being less controversial.
AuthorsVicki L. WildeArja Vainio-Mattila
EditorBonita Brindley
Design and layoutGiulio Sansonetti Graeme Thomas
IllustrationsPulika Calzini
The designations employed and thepresentation of material in thispublication do not imply the expressionof any opinion whatsoever on the partof the Food and AgricultureOrganization of the United Nationsconcerning the legal status of anycountry, territory, city or area or of itsauthorities, or concerning thedelimitation of its frontiers orboundaries.
The Food and Agriculture Organizationof the United Nations encourages thedissemination of the material containedin this publication, provided thatreference is made to the source.
© FAO 1995
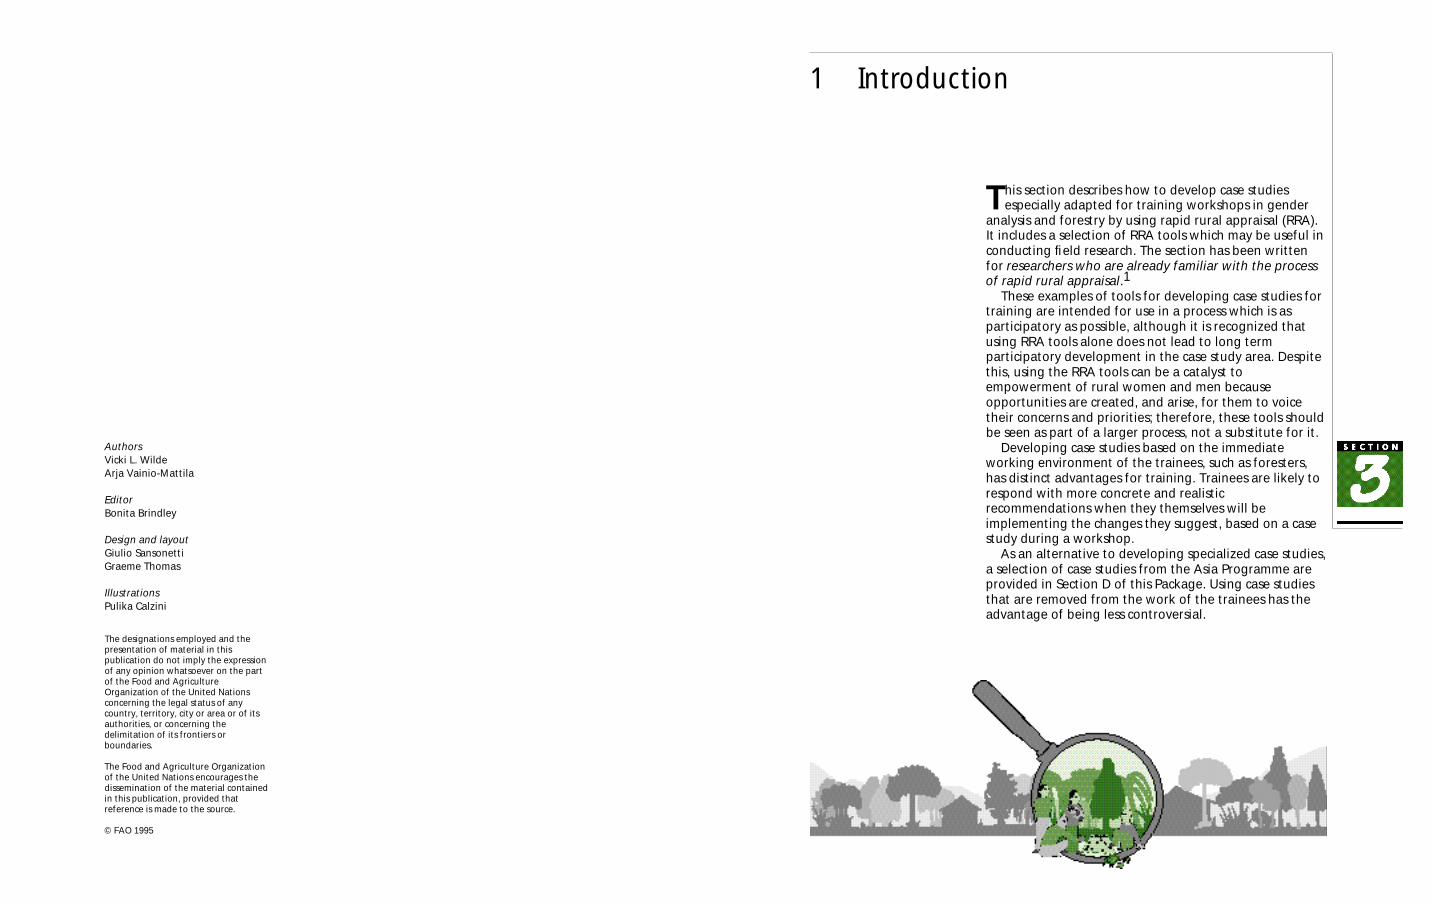
DEFINITION OF PA RT I C I PA N T S
The participants in the research process include:
Villagers who participate as experts on living conditionsin the case study area. They have most of theinformation.
People who work in the area and who participate assectoral managers (forestry, agriculture, etc.) ortechnical professionals who work for the government,private enterprise, or development agencies. They cancontribute by linking micro and macro information.
The researchers who depend on the other participantsfor accurate information and who participate by usingparticipatory research tools to collect or organize andpresent information for discussion by all participants.
Common considerations related to using RRA forproducing case studies specifically for gender analysis andforestry training are presented here. This section describesthree stages of case study development based on ourexperience in Asia—preparing for field research,conducting field research, and writing a case study.
PAGE 5
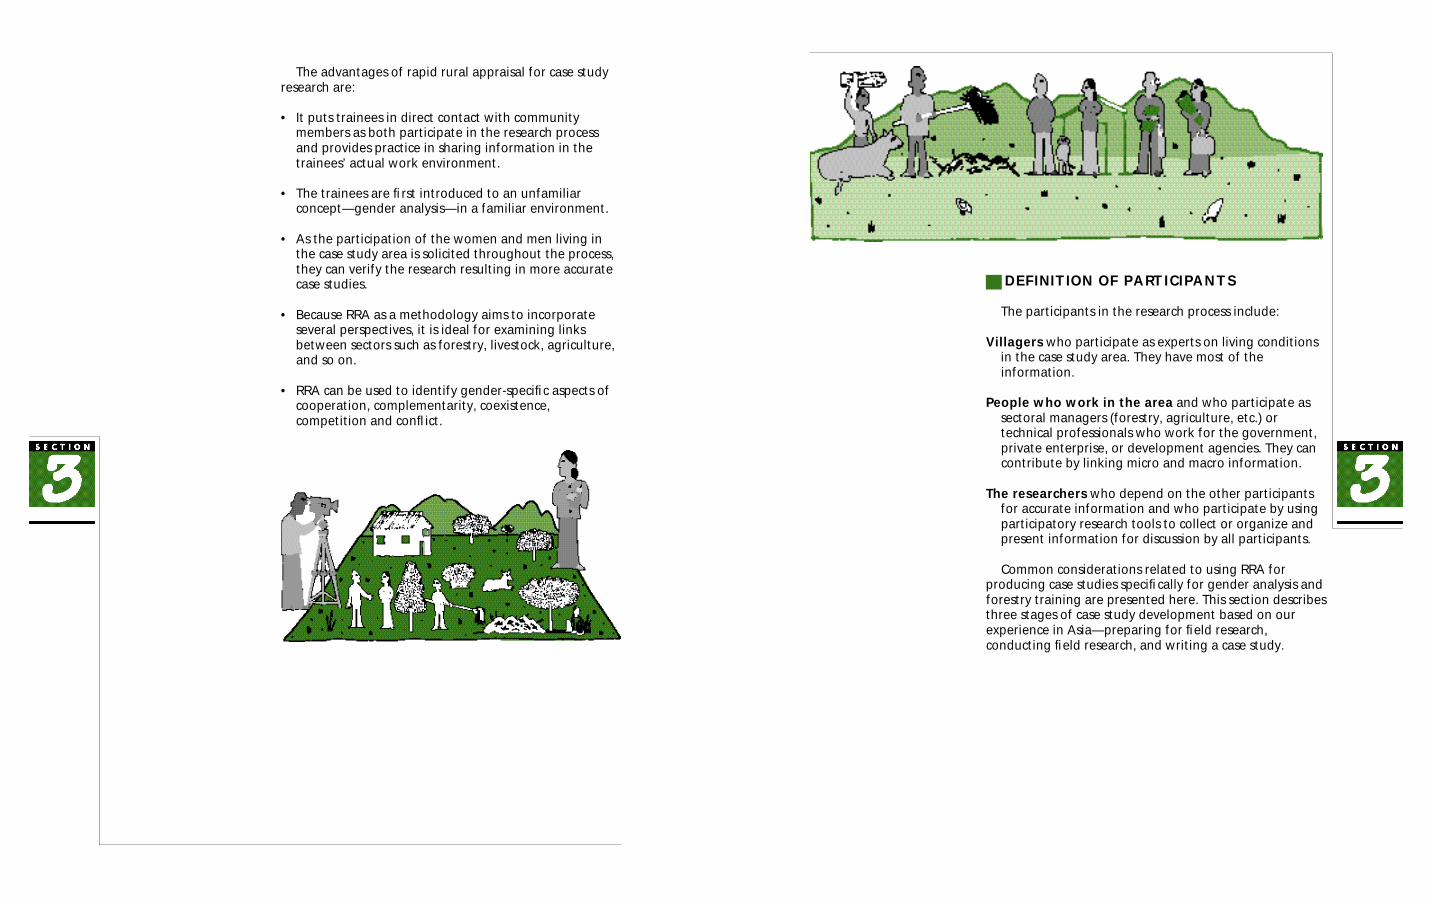
The advantages of rapid rural appraisal for case studyresearch are:
• It puts trainees in direct contact with communitymembers as both participate in the research processand provides practice in sharing information in thetrainees’ actual work environment.
• The trainees are first introduced to an unfamiliarconcept—gender analysis—in a familiar environment.
• As the participation of the women and men living inthe case study area is solicited throughout the process,they can verify the research resulting in more accuratecase studies.
• Because RRA as a methodology aims to incorporateseveral perspectives, it is ideal for examining linksbetween sectors such as forestry, livestock, agriculture,and so on.
• RRA can be used to identify gender-specific aspects ofcooperation, complementarity, coexistence,competition and conflict.
PAGE 4
PAGE 7
CHARACTERISTICS OF RAPID RURALAPPRAISAL FOR TRAINING CASE STUDY RESEARCH
Both practice and theory of RRA vary greatly accordingto the context in which it is used. It should be stressedthat RRA at its most participatory has the followingcharacteristics:
PAGE 6
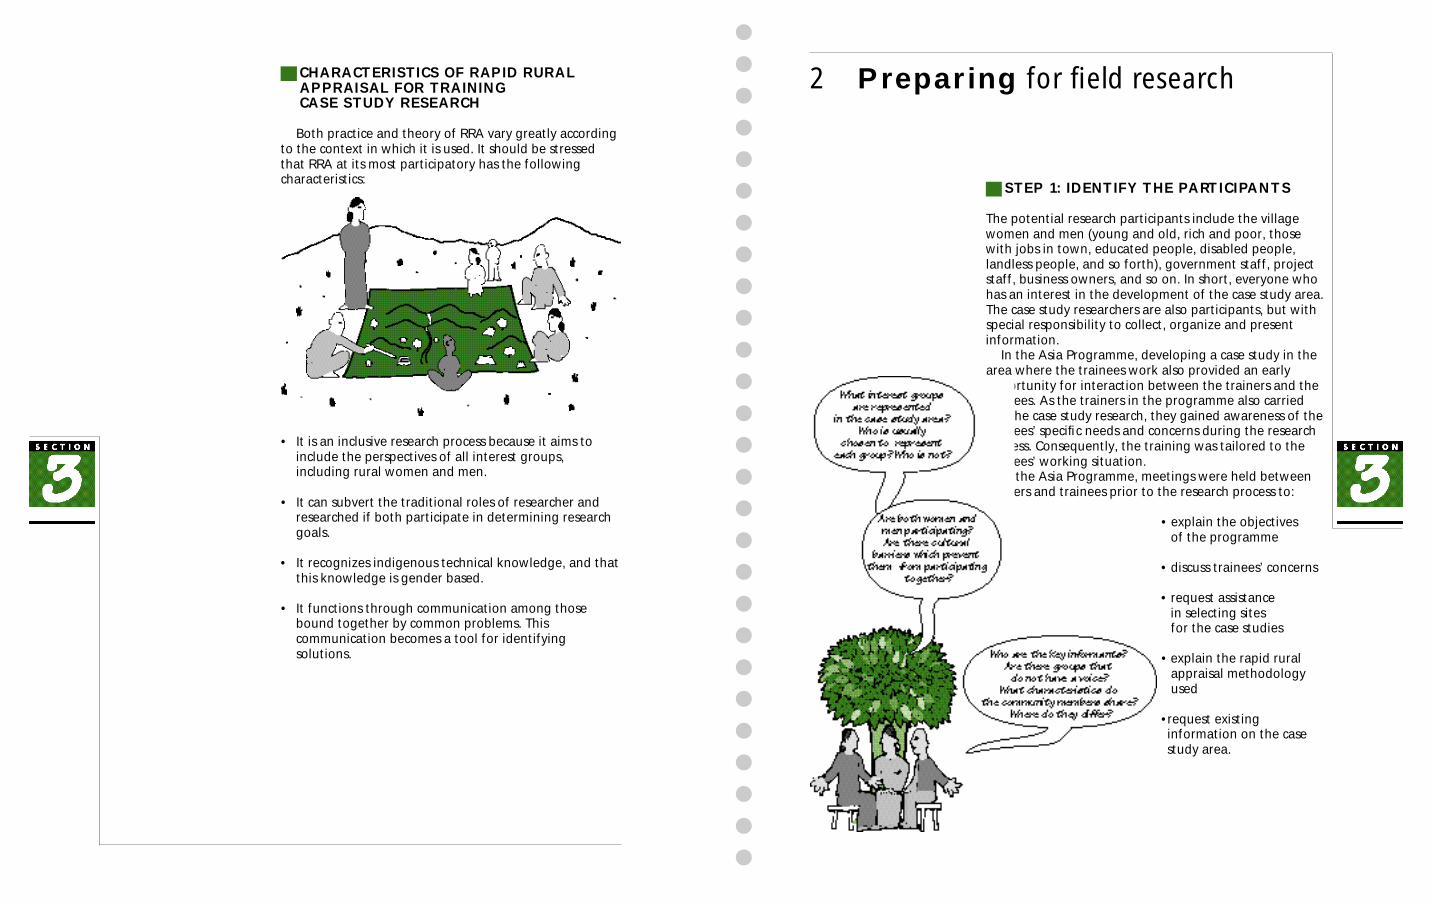
STEP 1: IDENTIFY THE PA RT I C I PA N T S
The potential research participants include the villagewomen and men (young and old, rich and poor, thosewith jobs in town, educated people, disabled people,landless people, and so forth), government staff, projectstaff, business owners, and so on. In short, everyone whohas an interest in the development of the case study area.The case study researchers are also participants, but withspecial responsibility to collect, organize and presentinformation.
In the Asia Programme, developing a case study in thearea where the trainees work also provided an earlyopportunity for interaction between the trainers and thetrainees. As the trainers in the programme also carriedout the case study research, they gained awareness of thetrainees’ specific needs and concerns during the researchprocess. Consequently, the training was tailored to thetrainees’ working situation.
In the Asia Programme, meetings were held betweentrainers and trainees prior to the research process to:
• explain the objectives of the programme
• discuss trainees’ concerns
• request assistance in selecting sites for the case studies
• explain the rapid ruralappraisal methodologyused
•request existinginformation on the casestudy area.
2 Preparing for field research
• It is an inclusive research process because it aims toinclude the perspectives of all interest groups,including rural women and men.
• It can subvert the traditional roles of researcher andresearched if both participate in determining researchgoals.
• It recognizes indigenous technical knowledge, and thatthis knowledge is gender based.
• It functions through communication among thosebound together by common problems. Thiscommunication becomes a tool for identifyingsolutions.

PAGE 9
STEP 3: DISCUSS THE INFORMAT I O NNEEDS
Using RRA as a methodology for case study research hasimplications for both content and process. It is a difficulttask to reconcile the requirements of producing a casestudy with the concerns and priorities of all theparticipants. Ideally, the women and men of the casestudy area have opportunities to influence the researchprocess by participating in the decision-making on priorityissues, research tools, timing, location, and so forth,throughout every stage of RRA.
STEP 2: IDENTIFY PA RT I C I PA N T S ’E X P E C TATIONS OF THE RESEARCH
Each person participating in the research process willexpect to benefit from it in different ways. The villagersmay hope that the research heralds some specificimprovement in their lives (such as roads, woodlots,schools, etc.) and the project staff may hope that theresearch process will increase interest among the villagersto participate in project activities through a better mutualunderstanding.
Although RRA can result in changes, these cannot bedetermined in advance. Through the research process,obstacles to satisfying the concerns of different interestgroups are identified, solutions are explored, and someconflicts are resolved as dialogue develops.
During the weeks and even months before the fieldresearch begins, the researchers speak directly toindividuals and groups about their priorities and concerns.The researchers can create opportunities for dialoguebetween the interest groups by inviting all of them tomeetings about the research. At the meetings it isimportant to note who is not talking. For example, inmany cultures, women are not invited to village meetings.A special effort may have to be made to go to women’shomes, or to meet with a women’s group to learn theirpoint of view.
PAGE 8
PAGE 1 1
STEP 5: DESIGN FIELD RESEARCH
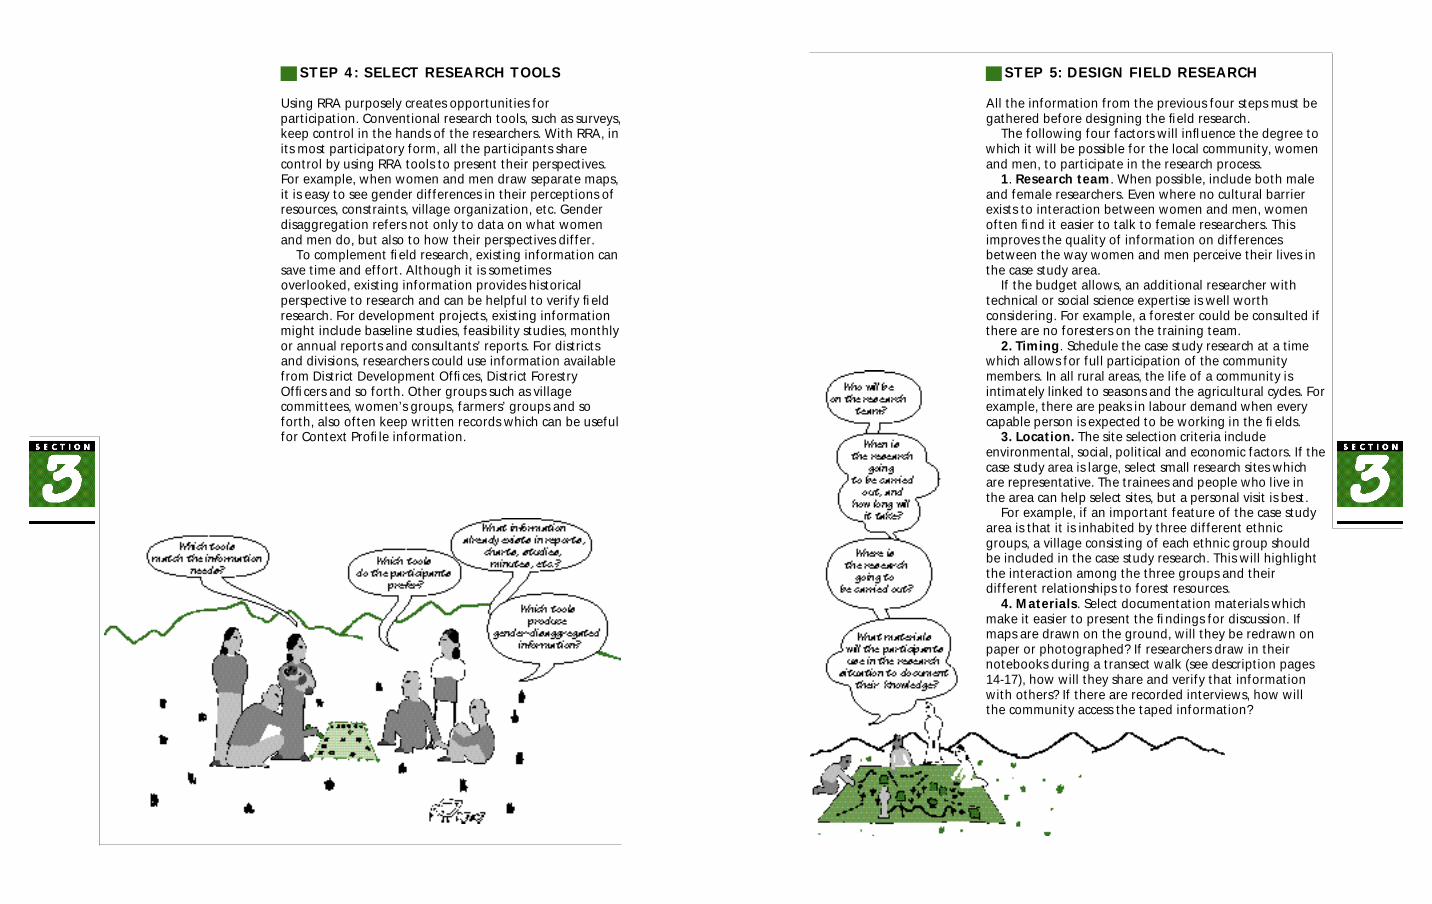
All the information from the previous four steps must begathered before designing the field research.
The following four factors will influence the degree towhich it will be possible for the local community, womenand men, to participate in the research process.
1. Research team. When possible, include both maleand female researchers. Even where no cultural barrierexists to interaction between women and men, womenoften find it easier to talk to female researchers. Thisimproves the quality of information on differencesbetween the way women and men perceive their lives inthe case study area.
If the budget allows, an additional researcher withtechnical or social science expertise is well worthconsidering. For example, a forester could be consulted ifthere are no foresters on the training team.
2 . T i m i n g. Schedule the case study research at a timewhich allows for full participation of the communitymembers. In all rural areas, the life of a community isintimately linked to seasons and the agricultural cycles. Forexample, there are peaks in labour demand when everycapable person is expected to be working in the fie l d s .
3 . L o c a t i o n . The site selection criteria includeenvironmental, social, political and economic factors. If thecase study area is large, select small research sites whichare representative. The trainees and people who live inthe area can help select sites, but a personal visit is best.
For example, if an important feature of the case studyarea is that it is inhabited by three different ethnicgroups, a village consisting of each ethnic group shouldbe included in the case study research. This will highlightthe interaction among the three groups and theirdifferent relationships to forest resources.
4. Materials. Select documentation materials whichmake it easier to present the findings for discussion. Ifmaps are drawn on the ground, will they be redrawn onpaper or photographed? If researchers draw in theirnotebooks during a transect walk (see description pages14-17), how will they share and verify that informationwith others? If there are recorded interviews, how willthe community access the taped information?
STEP 4: SELECT RESEARCH TOOLS
Using RRA purposely creates opportunities forparticipation. Conventional research tools, such as surveys,keep control in the hands of the researchers. With RRA, inits most participatory form, all the participants sharecontrol by using RRA tools to present their perspectives.For example, when women and men draw separate maps,it is easy to see gender differences in their perceptions ofresources, constraints, village organization, etc. Genderdisaggregation refers not only to data on what womenand men do, but also to how their perspectives differ.
To complement field research, existing information cansave time and effort. Although it is sometimesoverlooked, existing information provides historicalperspective to research and can be helpful to verify fieldresearch. For development projects, existing informationmight include baseline studies, feasibility studies, monthlyor annual reports and consultants’ reports. For districtsand divisions, researchers could use information availablefrom District Development Offices, District ForestryOfficers and so forth. Other groups such as villagecommittees, women’s groups, farmers’ groups and soforth, also often keep written records which can be usefulfor Context Profile information.
PAGE 1 0

PAGE 1 3
3 Conducting field research
Developing case studies for gender analysis requiresadapting some rapid rural appraisal (RRA) tools to
collect gender-disaggregated information. Using thesetools, rural women and men are able to teach outsidersabout their lives.
The table below indicates which RRA tool can be usedto collect the information required by each Step or Profileof the gender analysis and forestry Framework.
Researchers should:• Identify people who know about their village and are
willing to share their knowledge.• Reach agreement with the villagers on method, time,
place, materials, etc.• Probe, check and encourage discussion and debate.• Be patient, not controlling.• Observe and document the information.• Record the names of the women and men who share
their knowledge on the presentations of information,e.g. indicate on maps who drew them. This recognitiongives credit where credit is due.
Researchers should not:• Overlook the silent participants• Take on the role of a teacher• Interrupt an explanation
To o lPro file C o n t e x t A c t i v i t y R e s o u rc e s A c t i o n
Mapping or modelling • •
Tra n s e c t • •
Seasonal analysis • •
Trend diagra m m i n g •
Matrix ra n k i n g • • •
Wealth ra n k i n g •
Chapatti diagra m s • •
S . W. O . L . •
STEP 6: EVA L U ATE THE COLLECTEDI N F O R M AT I O N
The researchfindings should bereviewed each daywith all participants,including thecommunitymembers, to revealgaps, uncovermisunderstandings,and correctmisconceptionsbased on limitedinformation sources.Because villagewomen and men arethe experts, theycritique and discussthe researchers’perceptions. Thesereviews may redirectplans for the next
day’s research if new sources of information arediscovered.
For example, researchers may want to photograph thecase study area to produce a set of slides for use in thegender analysis workshop. In this case, the people wholive in the area and who participated in the case studyresearch should be consulted to check whether theresearchers have understood the situation.
PAGE 1 2

What is needed for making transects?The participants are groups of women and men, who
are willing to walk and talk with researchers through atransect walk.
With the participants, decide on a route for thetransect. Try to choose a route with varied environmentaland topographical features. This route might be based ona map produced earlier.
During the walk, researchers discuss what they areseeing (soils, rivers, crops, housing, etc.) with the villagers.It may be useful for the research team to divideresponsibilities for documenting specific information(forestry, livestock, soils, etc.) to collect information forResources and Context Profiles. Researchers observe, askquestions, and listen. They try to discover problems andopportunities related to what they see, and notecontrasts and changes. They identify different zones. Theinformation collected during the transect walk is used todraw the diagram.
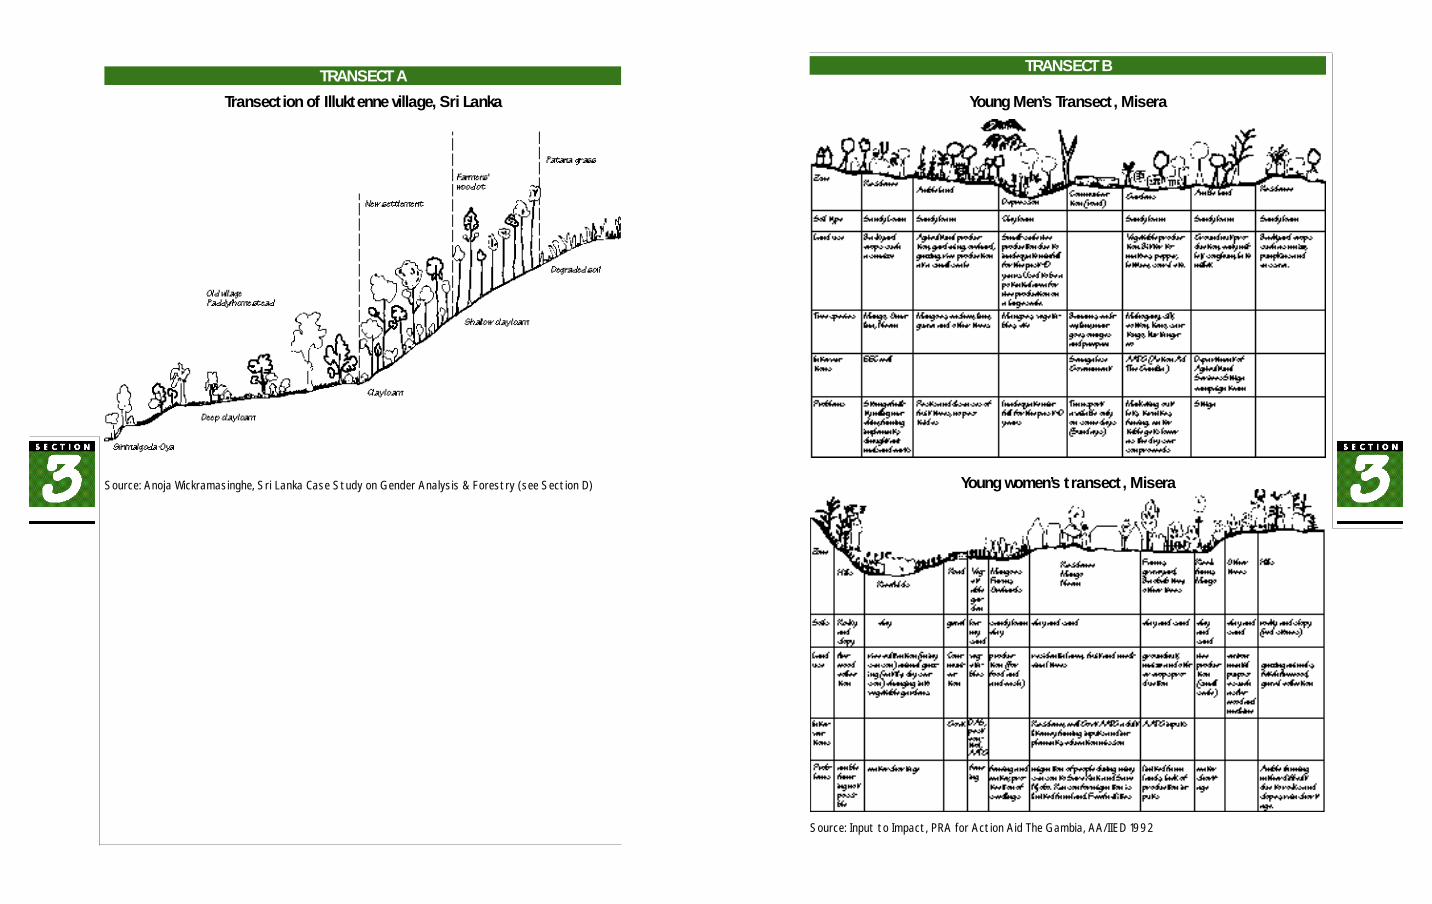
Examples of Transect WalksTransect A shows a simple transect of a Sri Lankan
village located on a hill side. Tree cover and soilconditions are highlighted in relation to the location ofvillage settlements. Due to the steep gradient, farmers’woodlots are located on the upper segments of the hill,while home gardens are located in the mid and lowsegments. Paddy fields are interspersed in the foot slopes.Both women and men must spend a great deal of timeand energy going up and down the hill side to carry outtheir and forestry activities.
Transect B shows how this simple tool can provide agreat deal of gender-disaggregated information. In theGambia, transects were produced on separate walks withyoung men, old men, young women and old women sothat priorities by both gender and age could be betterunderstood. Shown here are the transects produced byyoung men and young women, both giving attention tosoil types, land use, interventions and problems. Thedifferences between the two transects reflect theirdifferent needs. For example, the women’s transectemphasizes the rice fields because rice is an importantsource of food and income for women in the Gambia.
PAGE 1 5
4 RRA tools and how to use them
Each RRA tool described here is followed by an exampleof how it can be used and of how it was used in
different research situations all over the world. These areexamples, not models, because they are not perfect, nor isthe described procedure the only correct one. They areincluded here as suggestions. RRA tools developcontinuously and part of that process is adapting existingtools and inventing new ones. The case study researchprocess provides that opportunity.
1. TRANSECT WA L K S
What are transect walks?A transect walk is a walk taken by researchers with
villagers during which problems and opportunities relatedto the physical geography and topography of acommunity are documented, producing a type of map. Itusually presents a “summary” of a larger area than avillage map does.
Why do transects?Transects identify zones, contrasts, changes, conditions,
and physical features such as soils, trees, and streams inthe village environment. Transects are an ideal point ofdeparture for a rapid research/planning process in avillage, because they establish the villagers as the expertson living conditions in the case study area. As theresearchers walk through the villagescape they canobserve both natural and built aspects of theenvironment. Conducting a separate transect walk withwomen, and then with men, clarifies the gender-baseddifferences in their relationships with the naturalenvironment.
PAGE 1 4
PAGE 1 7
TRANSECT A
PAGE 1 6
Source: Anoja Wickramasinghe, Sri Lanka Case Study on Gender Analysis & Forestry (see Section D)
Transection of Illuktenne village, Sri Lanka
TRANSECT B
Source: Input to Impact, PRA for Action Aid The Gambia, AA/IIED 1992
Young Men’s Transect, Misera
Young women’s transect, Misera
PAGE 1 9
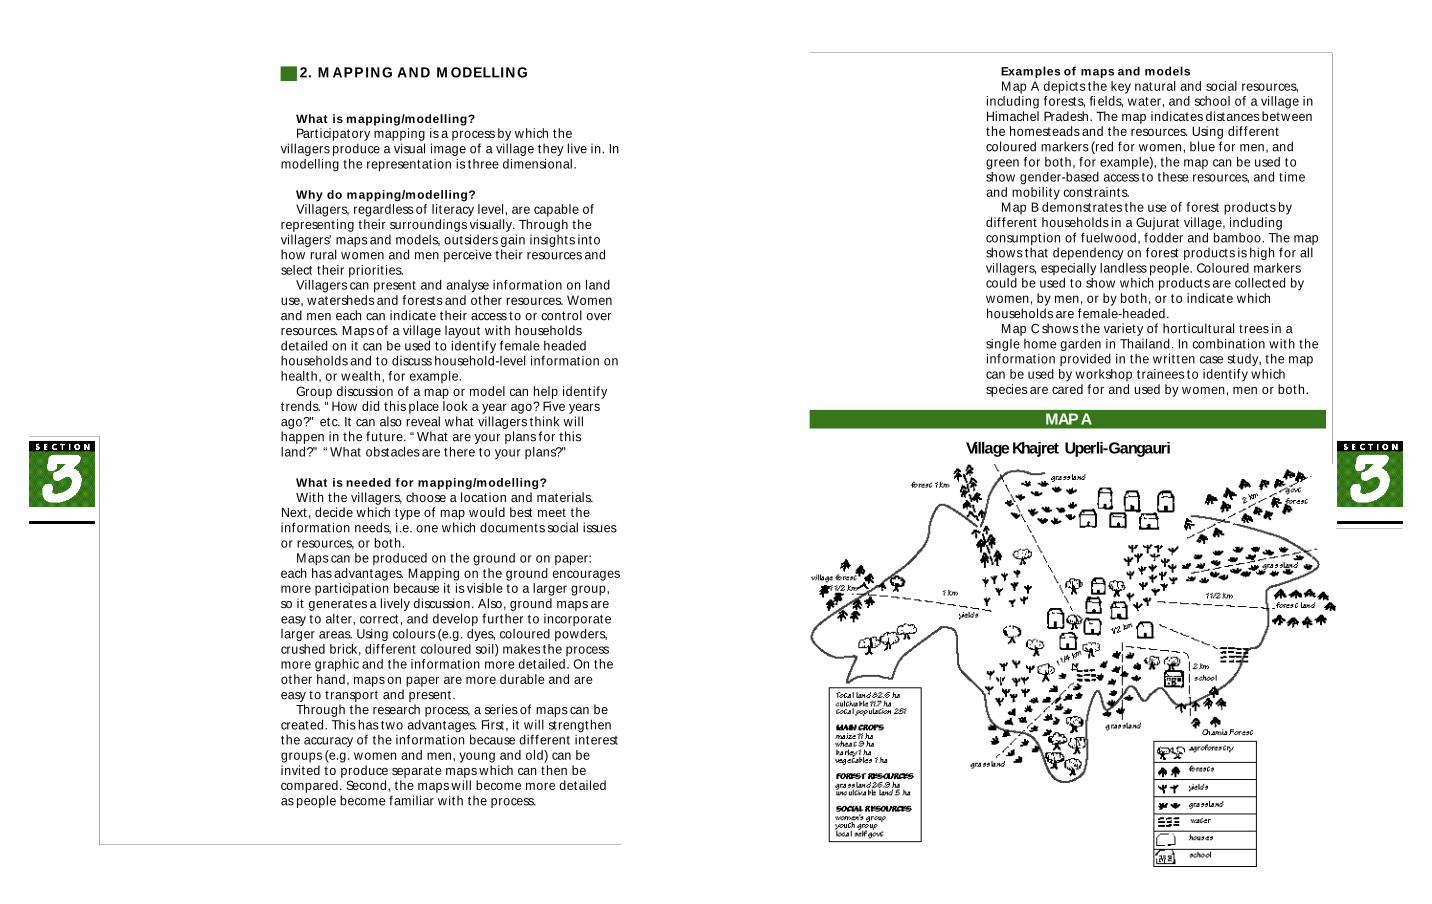
Examples of maps and modelsMap A depicts the key natural and social resources,
including forests, fields, water, and school of a village inHimachel Pradesh. The map indicates distances betweenthe homesteads and the resources. Using differentcoloured markers (red for women, blue for men, andgreen for both, for example), the map can be used toshow gender-based access to these resources, and timeand mobility constraints.
Map B demonstrates the use of forest products bydifferent households in a Gujurat village, includingconsumption of fuelwood, fodder and bamboo. The mapshows that dependency on forest products is high for allvillagers, especially landless people. Coloured markerscould be used to show which products are collected bywomen, by men, or by both, or to indicate whichhouseholds are female-headed.
Map C shows the variety of horticultural trees in asingle home garden in Thailand. In combination with theinformation provided in the written case study, the mapcan be used by workshop trainees to identify whichspecies are cared for and used by women, men or both.
2. MAPPING AND MODELLING
What is mapping/modelling?Participatory mapping is a process by which the
villagers produce a visual image of a village they live in. Inmodelling the representation is three dimensional.
Why do mapping/modelling?Villagers, regardless of literacy level, are capable of
representing their surroundings visually. Through thevillagers’ maps and models, outsiders gain insights intohow rural women and men perceive their resources andselect their priorities.
Villagers can present and analyse information on landuse, watersheds and forests and other resources. Womenand men each can indicate their access to or control overresources. Maps of a village layout with householdsdetailed on it can be used to identify female headedhouseholds and to discuss household-level information onhealth, or wealth, for example.
Group discussion of a map or model can help identifytrends. “How did this place look a year ago? Five yearsago?” etc. It can also reveal what villagers think willhappen in the future. “What are your plans for thisland?” “What obstacles are there to your plans?”
What is needed for mapping/modelling?With the villagers, choose a location and materials.
Next, decide which type of map would best meet theinformation needs, i.e. one which documents social issuesor resources, or both.
Maps can be produced on the ground or on paper:each has advantages. Mapping on the ground encouragesmore participation because it is visible to a larger group,so it generates a lively discussion. Also, ground maps areeasy to alter, correct, and develop further to incorporatelarger areas. Using colours (e.g. dyes, coloured powders,crushed brick, different coloured soil) makes the processmore graphic and the information more detailed. On theother hand, maps on paper are more durable and areeasy to transport and present.
Through the research process, a series of maps can becreated. This has two advantages. First, it will strengthenthe accuracy of the information because different interestgroups (e.g. women and men, young and old) can beinvited to produce separate maps which can then becompared. Second, the maps will become more detailedas people become familiar with the process.
PAGE 1 8
MAP A
Village Khajret Uperli-Gangauri

PAGE 2 1PAGE 2 0
MAP BForest land users map, showing products used by different sections of
village community, Bharuch District, Gujarat.
MAP C
Source: Parmesh Shah, Girish Bharadwaj & Ransit Ambastha, Aga Khan Rural Support Program. RRANotes No 13, August 1991, IIED. (Household names were on the original map.)
Source: Uraivan Tan-Kim-Yong &Uthaiwan Sangwanit, Thailand Case Study on Gender Analysis andForestry (see Section D)
PAGE 2 3
3. SEASONAL ANALY S I S
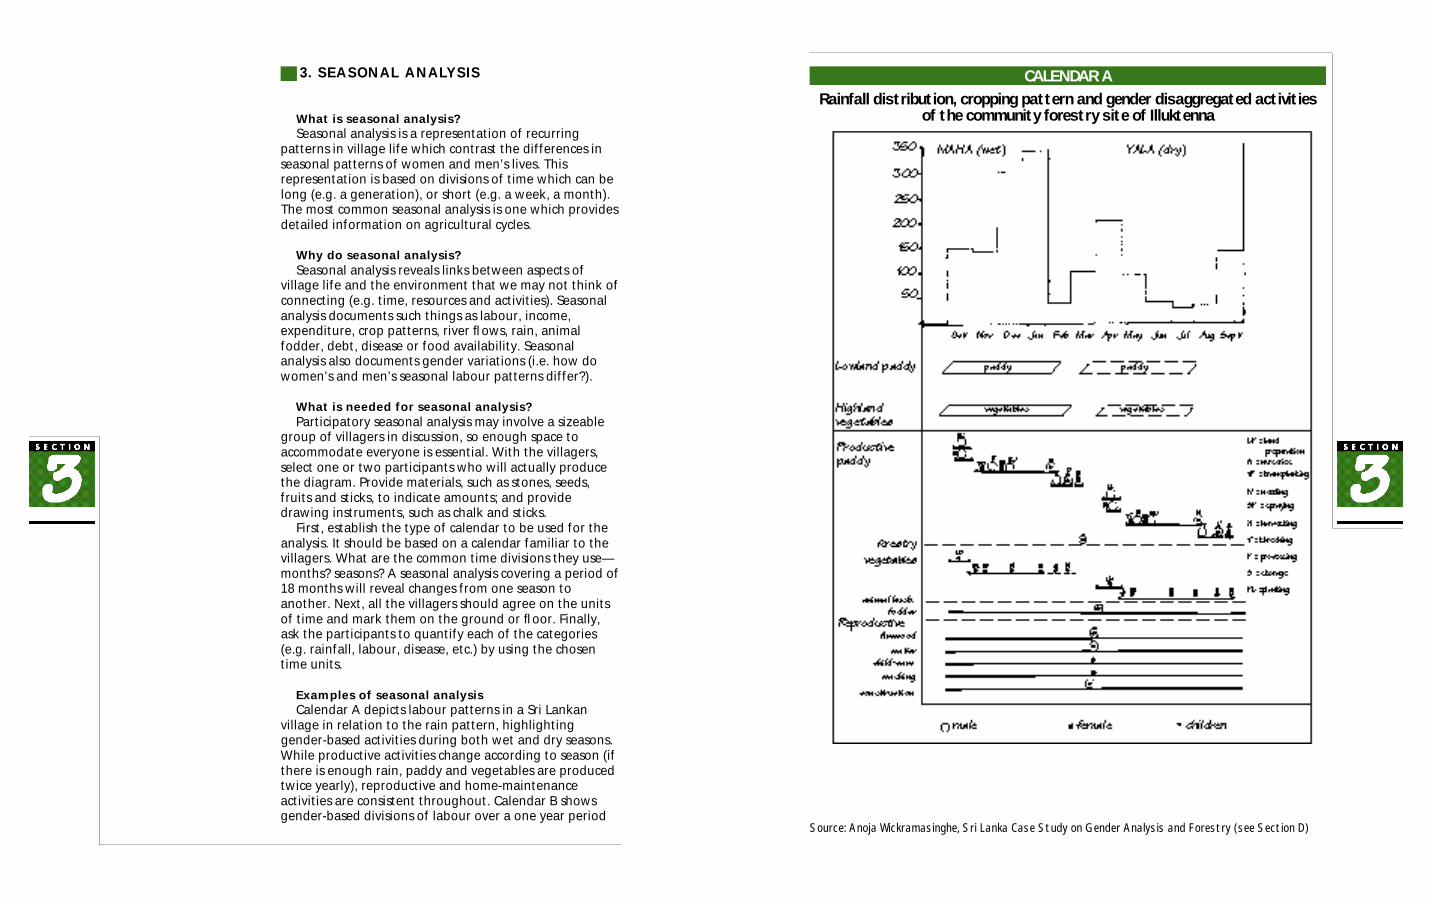
What is seasonal analysis?Seasonal analysis is a representation of recurring
patterns in village life which contrast the differences inseasonal patterns of women and men’s lives. Thisrepresentation is based on divisions of time which can belong (e.g. a generation), or short (e.g. a week, a month).The most common seasonal analysis is one which providesdetailed information on agricultural cycles.
Why do seasonal analysis?Seasonal analysis reveals links between aspects of
village life and the environment that we may not think ofconnecting (e.g. time, resources and activities). Seasonalanalysis documents such things as labour, income,expenditure, crop patterns, river flows, rain, animalfodder, debt, disease or food availability. Seasonalanalysis also documents gender variations (i.e. how dowomen’s and men’s seasonal labour patterns differ?).
What is needed for seasonal analysis?Participatory seasonal analysis may involve a sizeable
group of villagers in discussion, so enough space toaccommodate everyone is essential. With the villagers,select one or two participants who will actually producethe diagram. Provide materials, such as stones, seeds,fruits and sticks, to indicate amounts; and providedrawing instruments, such as chalk and sticks.
First, establish the type of calendar to be used for theanalysis. It should be based on a calendar familiar to thevillagers. What are the common time divisions they use—months? seasons? A seasonal analysis covering a period of18 months will reveal changes from one season toanother. Next, all the villagers should agree on the unitsof time and mark them on the ground or floor. Finally,ask the participants to quantify each of the categories(e.g. rainfall, labour, disease, etc.) by using the chosentime units.
Examples of seasonal analysisCalendar A depicts labour patterns in a Sri Lankan
village in relation to the rain pattern, highlightinggender-based activities during both wet and dry seasons.While productive activities change according to season (ifthere is enough rain, paddy and vegetables are producedtwice yearly), reproductive and home-maintenanceactivities are consistent throughout. Calendar B showsgender-based divisions of labour over a one year period
PAGE 2 2
CALENDAR ARainfall distribution, cropping pattern and gender disaggregated activities
of the community forestry site of Illuktenna
Source: Anoja Wickramasinghe, Sri Lanka Case Study on Gender Analysis and Forestry (see Section D)
PAGE 2 5PAGE 2 4
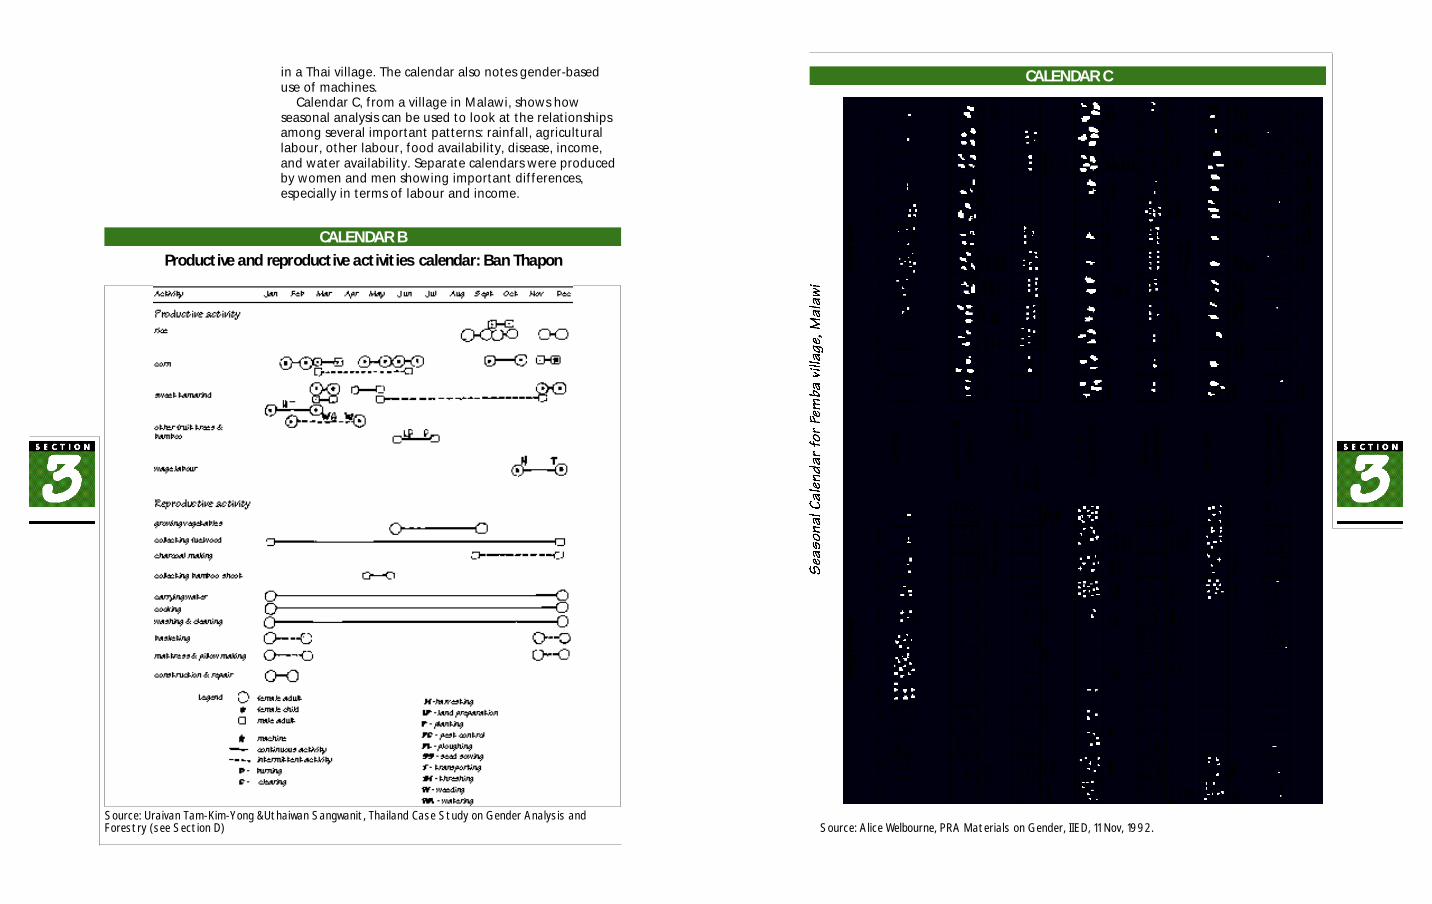
CALENDAR BProductive and reproductive activities calendar: Ban Thapon
in a Thai village. The calendar also notes gender-baseduse of machines.
Calendar C, from a village in Malawi, shows howseasonal analysis can be used to look at the relationshipsamong several important patterns: rainfall, agriculturallabour, other labour, food availability, disease, income,and water availability. Separate calendars were producedby women and men showing important differences,especially in terms of labour and income.
CALENDAR C
Source: Uraivan Tam-Kim-Yong &Uthaiwan Sangwanit, Thailand Case Study on Gender Analysis andForestry (see Section D) Source: Alice Welbourne, PRA Materials on Gender, IIED, 11 Nov, 1992.
PAGE 2 7
4. TREND DIAGRAMMING
What is trend diagramming?Trend diagramming is a representation of the changes
in village life and the community’s resource base. It is alsoan analysis of gender-specific changes in who has accessto resources or control over them.
Why do trend diagramming?Trend diagramming is used for identifying changes in
areas such as forestry resources, fuel economy (fuels used,time constraints, distances covered, changes in labourpatterns), price development, marketing opportunities,land use patterns, and so forth.
What is needed for trend diagramming?Trend diagramming may involve a sizeable group of
villagers in discussion, so enough space to accommodateeveryone is essential. With the villagers, select one or twoparticipants who will actually produce the diagram.Provide materials, such as stones, seeds, fruits and sticks,to indicate amounts; and provide drawing instruments,such as chalk or sticks.
First, establish the timeline for the trend diagram.Building on historical timelines is useful because theyestablish what the great “milestones” of the communityhave been (e.g. floods, droughts, revolutions, building ofa school, etc.) Next, all the villagers should agree on whattrends are being represented (e.g. labour, migration,prices, etc.). Finally, ask the participants to quantify eachof the trends on the diagram.
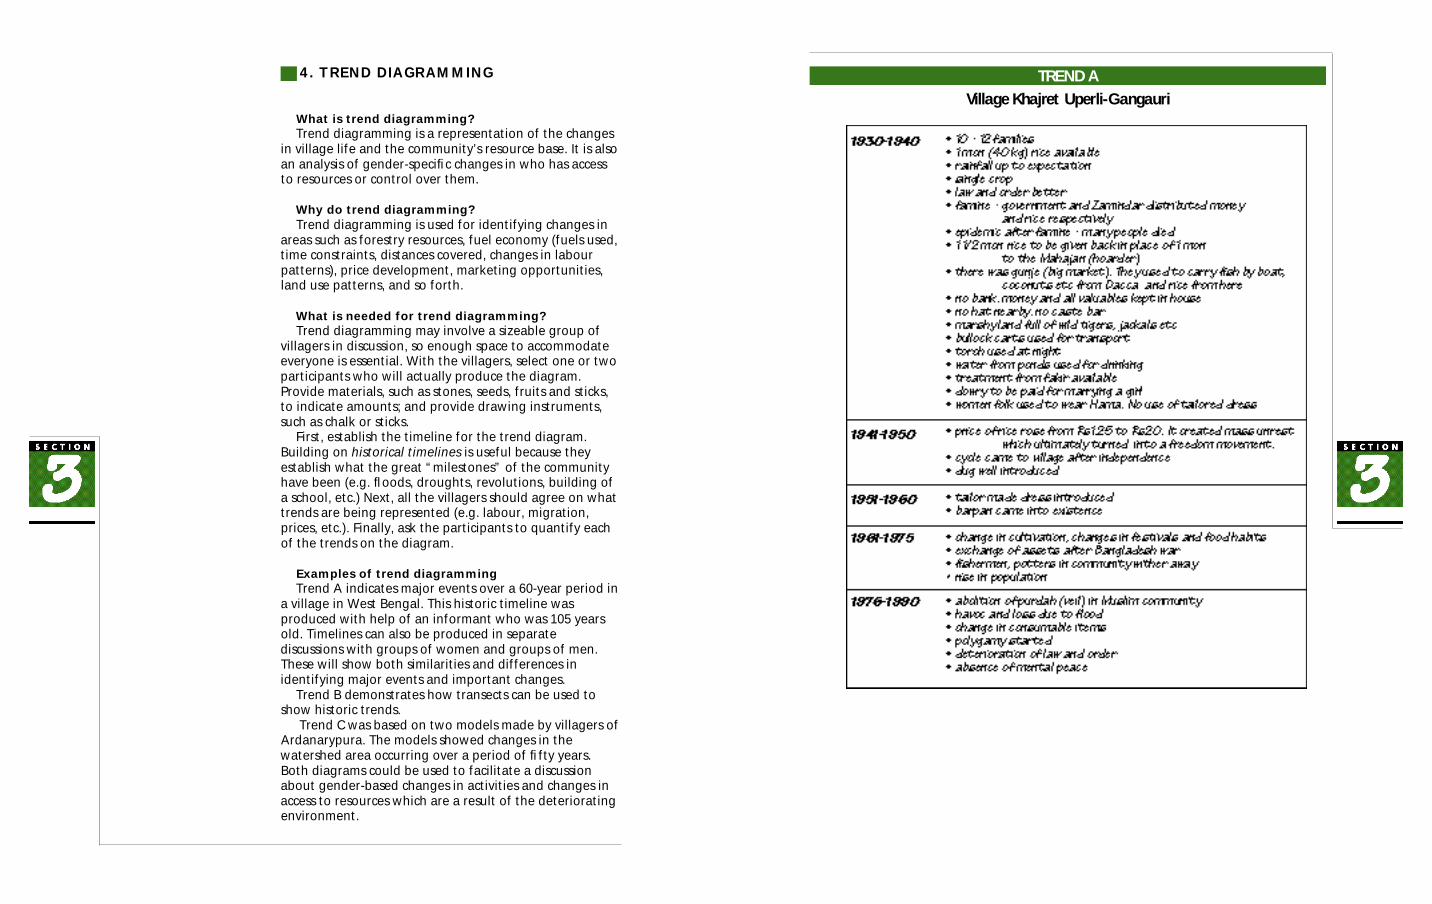
Examples of trend diagrammingTrend A indicates major events over a 60-year period in
a village in West Bengal. This historic timeline wasproduced with help of an informant who was 105 yearsold. Timelines can also be produced in separatediscussions with groups of women and groups of men.These will show both similarities and differences inidentifying major events and important changes.
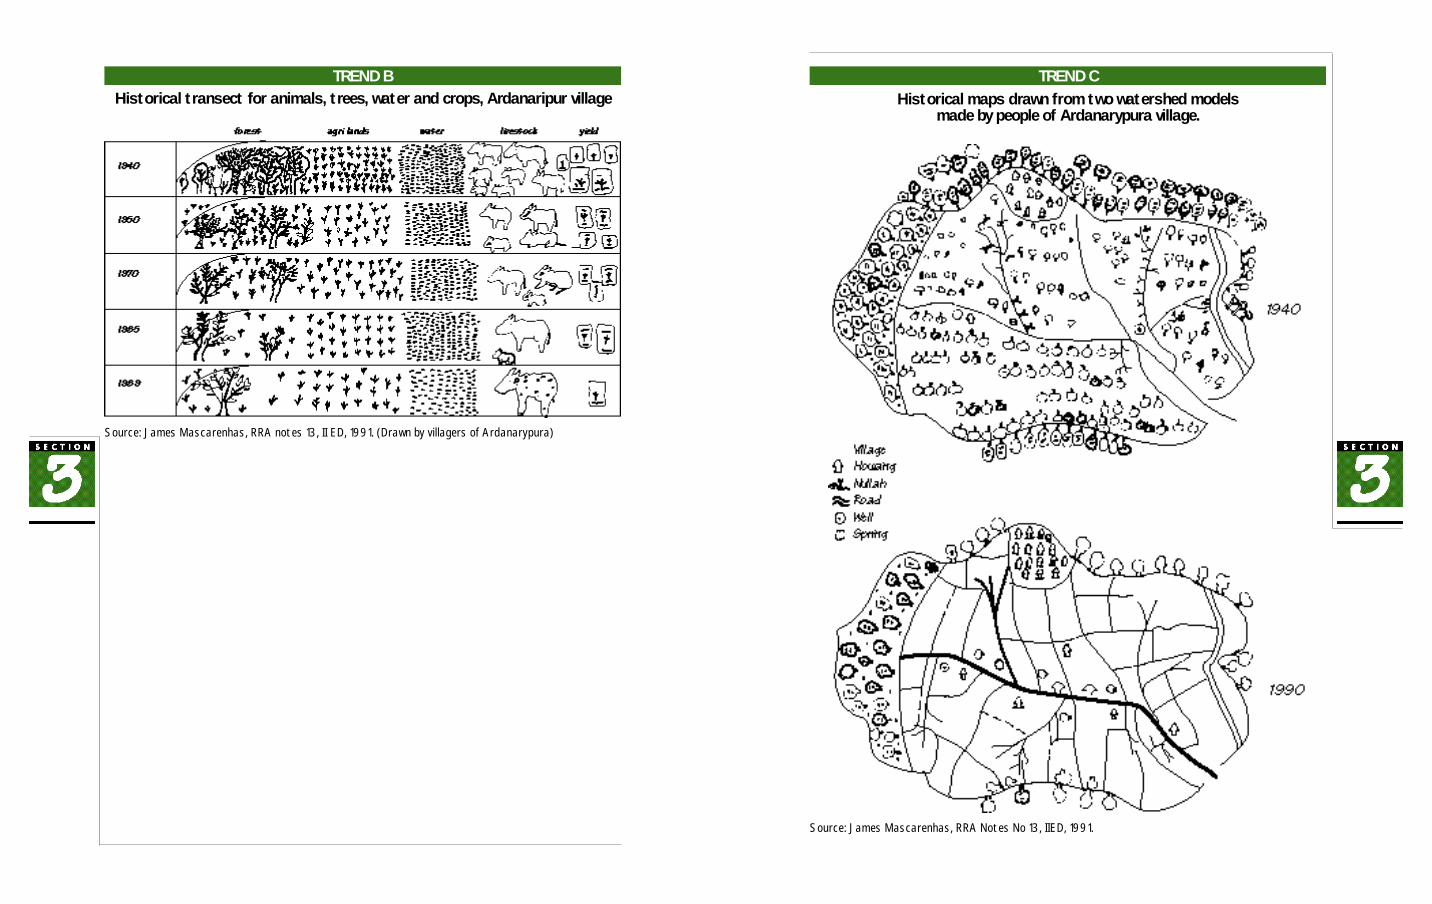
Trend B demonstrates how transects can be used toshow historic trends.
Trend C was based on two models made by villagers ofArdanarypura. The models showed changes in thewatershed area occurring over a period of fifty years.Both diagrams could be used to facilitate a discussionabout gender-based changes in activities and changes inaccess to resources which are a result of the deterioratingenvironment.
PAGE 2 6
TREND AVillage Khajret Uperli-Gangauri
PAGE 2 9PAGE 2 8
TREND CHistorical maps drawn from two watershed models
made by people of Ardanarypura village.
Source: James Mascarenhas, RRA Notes No 13, IIED, 1991.
TREND BHistorical transect for animals, trees, water and crops, Ardanaripur village
Source: James Mascarenhas, RRA notes 13, II ED, 1991. (Drawn by villagers of Ardanarypura)
PAGE 3 1
5. MATRIX RANKING
What is matrix ranking?Matrix ranking is a grid which represents relative value
or preferences, by creating hierarchies of activities oritems. It reveals the categories villagers use for ranking.Often women and men have different categories.
Why do matrix ranking?Participatory matrix ranking is used to check or probe
for information. During the ranking exercise theresearchers begin to understand the villagers’ alternativesand options. They may wish to probe further and askwhat their preferences would be if they had more choices(e.g. varieties of tree seedlings available). Tree species,fuels, crop varieties, and so forth, can be ranked.
What is needed for matrix ranking?With the villagers, choose materials to be used (e.g.
paper or ground, seeds, stones, sticks, etc.). Next, decidewhat is to be ranked and list the items (e.g. tree species,agroforestry crops, community forestry plots, etc.). Then,for each item ask what is good about it and what is badabout it. Repeat the question to get more characteristics.List the ranking criteria in the chart. Ask the women andmen to rank each item (1=best, 2=second best etc.). Otherquestions to be asked are: “Which criteria are mostimportant?” “If you could only have one, which wouldyou choose?” “How many of each do you have?” “Howmany would you like to have?” Researchers should bewary of using their own criteria unless it is clearlydifferent from the villagers.
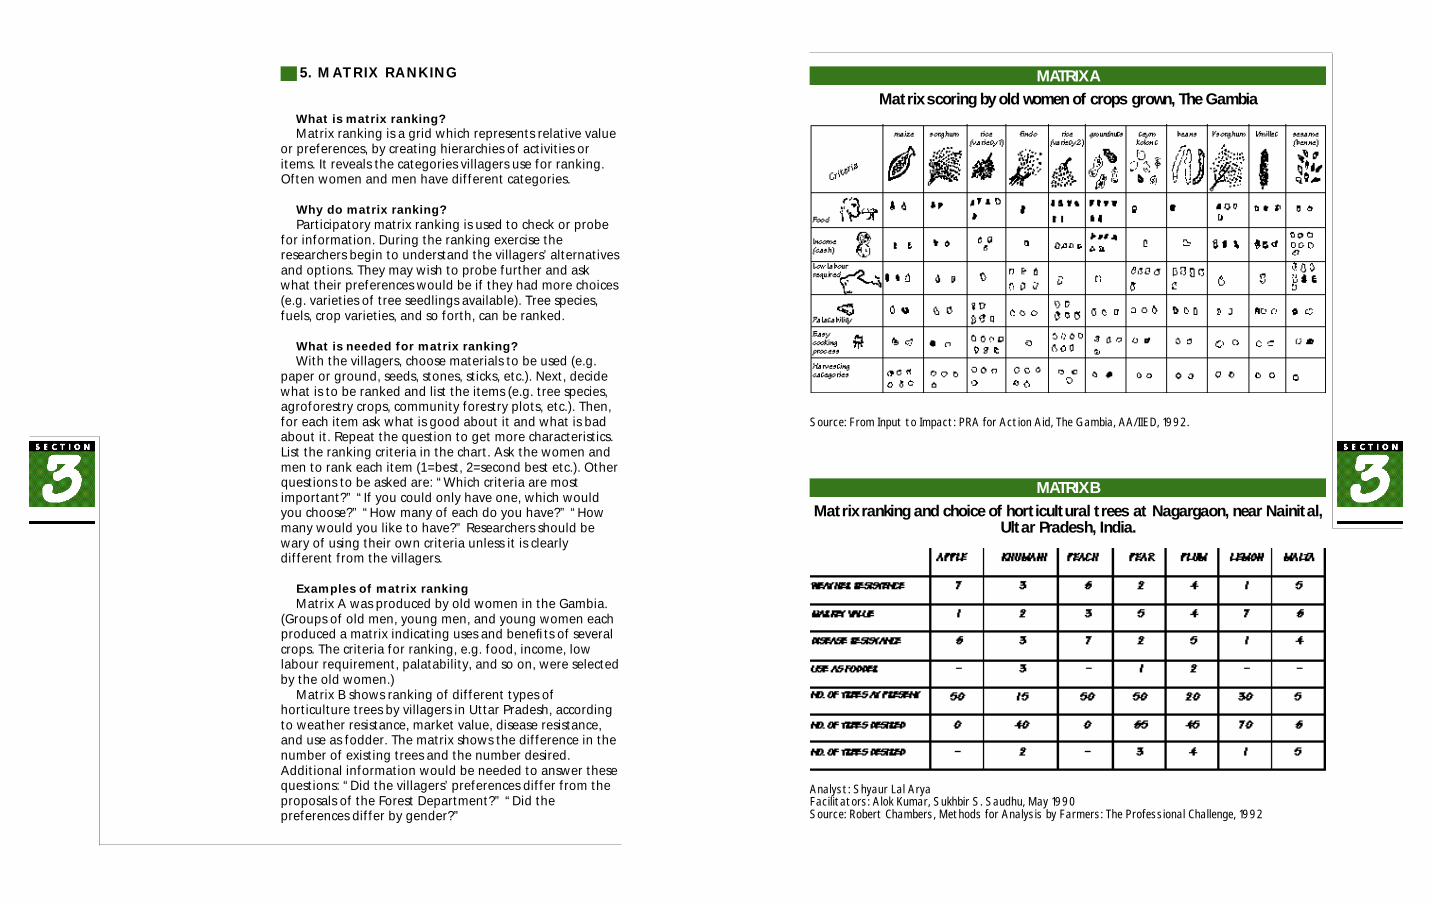
Examples of matrix rankingMatrix A was produced by old women in the Gambia.
(Groups of old men, young men, and young women eachproduced a matrix indicating uses and benefits of severalcrops. The criteria for ranking, e.g. food, income, lowlabour requirement, palatability, and so on, were selectedby the old women.)
Matrix B shows ranking of different types ofhorticulture trees by villagers in Uttar Pradesh, accordingto weather resistance, market value, disease resistance,and use as fodder. The matrix shows the difference in thenumber of existing trees and the number desired.Additional information would be needed to answer thesequestions: “Did the villagers’ preferences differ from theproposals of the Forest Department?” “Did thepreferences differ by gender?”
PAGE 3 0
MATRIX AMatrix scoring by old women of crops grown, The Gambia
MATRIX BMatrix ranking and choice of horticultural trees at Nagargaon, near Nainital,
Ultar Pradesh, India.
Source: From Input to Impact: PRA for Action Aid, The Gambia, AA/IIED, 1992.
Analyst: Shyaur Lal AryaFacilitators: Alok Kumar, Sukhbir S. Saudhu, May 1990Source: Robert Chambers, Methods for Analysis by Farmers: The Professional Challenge, 1992
PAGE 3 3PAGE 3 2
6. WEALTH RANKING
What is wealth ranking?Wealth ranking is a tool to determine relative wealth
of each community member, including gender-baseddifferences in wealth. Relative wealth information isoften easier to obtain because participants are lesssensitive about revealing their wealth in relation to othercommunity members, than they would be if they wereasked to give absolute figures.
Why do wealth ranking?Relative wealth ranking is used to analyse what
proportion of the community members are rich anddetermine who they are, what proportion of thecommunity members are poor and determine who theyare. It aims to discover reasons for relative wealth orpoverty rather than looking at exact earnings. Wealthranking reveals the community’s criteria for “poor” and“rich”.
What is needed for wealth ranking?For wealth ranking, researchers need a master list of
houses. If a village map has been produced, it can be used(see #1 in the example which follows on page 34).Number as many cards as there are houses, then on eachcard write the name of a household (see #2). Withvillagers, select key informants, and ask each one in turnto sort the cards in stacks according to wealth categories(see #3). Through discussion with the villagers, determinetheir criteria for wealth and poverty, but do not discussindividual households (see #4).
To calculate scores, count the cards in each stack (see#5) and assign a percentage to each category according tohow many categories the key informant has used. Forexample:
If there are three categories A=33, B=66, C=100, whereA represents the richest, and C the poorest households.
If there are four categories A=25, B=50, C=75 andD=100.
Add up all the scores, divide by the number ofinformants, and record the results (see #6). Finally,arrange the houses from richest to poorest. The richestwill have low scores, the poorest will have high scores.
Examples of wealth rankingExample A shows a simple method of wealth ranking.
Using their village map, villagers from West Bengaldevised a three-point system for indicating three separate
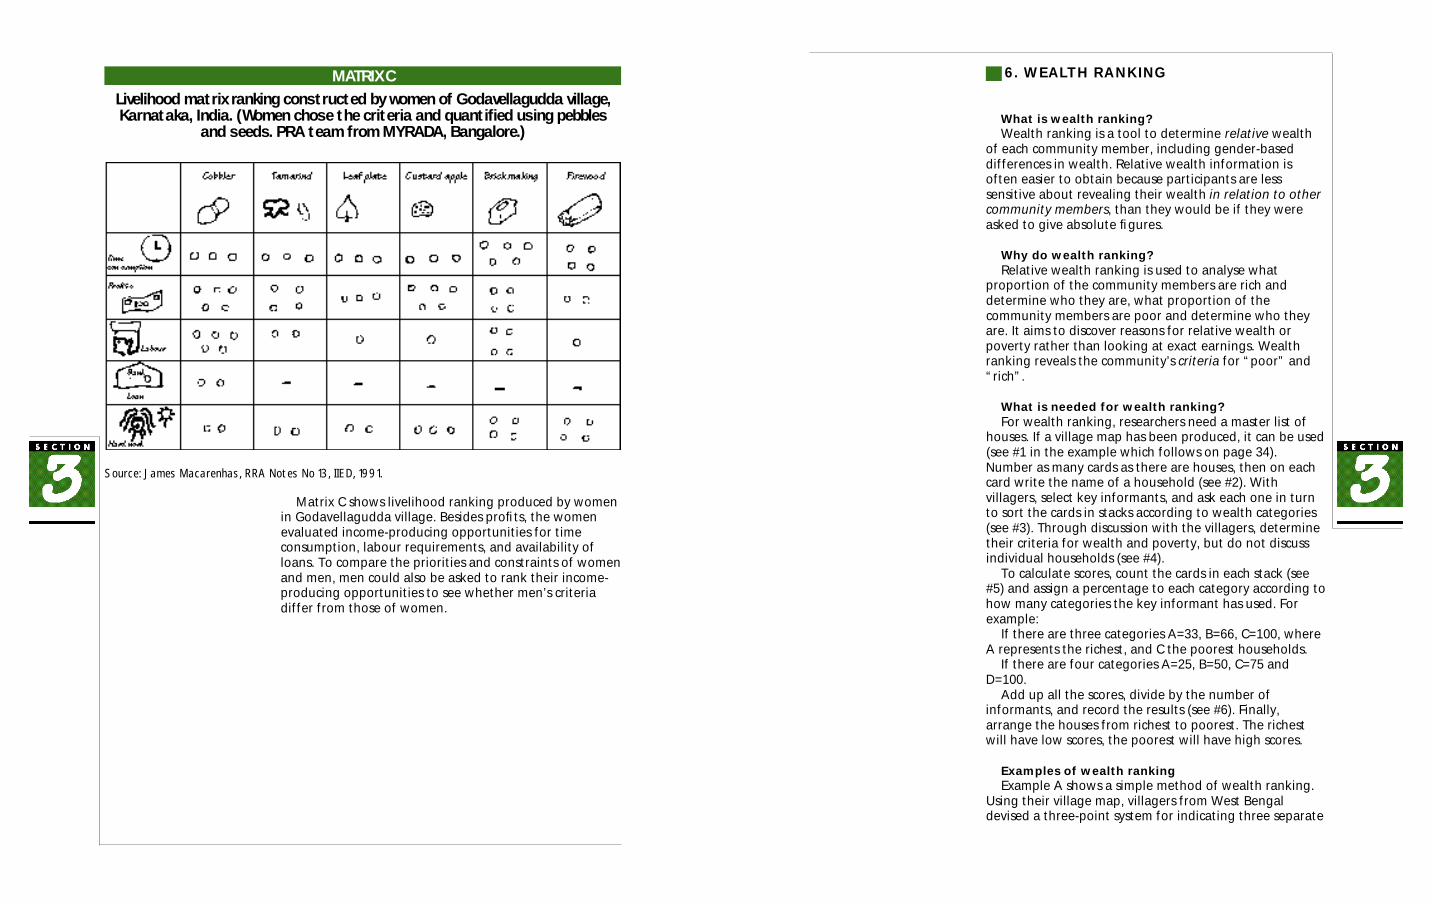
MATRIX CLivelihood matrix ranking constructed by women of Godavellagudda village,Karnataka, India. (Women chose the criteria and quantified using pebbles
and seeds. PRA team from MYRADA, Bangalore.)
Matrix C shows livelihood ranking produced by womenin Godavellagudda village. Besides profits, the womenevaluated income-producing opportunities for timeconsumption, labour requirements, and availability ofloans. To compare the priorities and constraints of womenand men, men could also be asked to rank their income-producing opportunities to see whether men’s criteriadiffer from those of women.
Source: James Macarenhas, RRA Notes No 13, IIED, 1991.

PAGE 3 5PAGE 3 4
WEALTH RANKING: EXAMPLE AVillage mapping and wealth ranking, Village Berapal,
District Midnapore, West Bengal, India.
WEALTH RANKING: EXAMPLE BSummary of wealth ranking by old women, The Gambia
Source: Neela Mukherjee, RRA Notes No 15, IIED, May 1992
Source: From Input to Impact: PRA for Action Aid, The Gambia. AA/IIED, 1992.
WEALTH RANKING WITH CARDS
PAGE 3 7PAGE 3 6
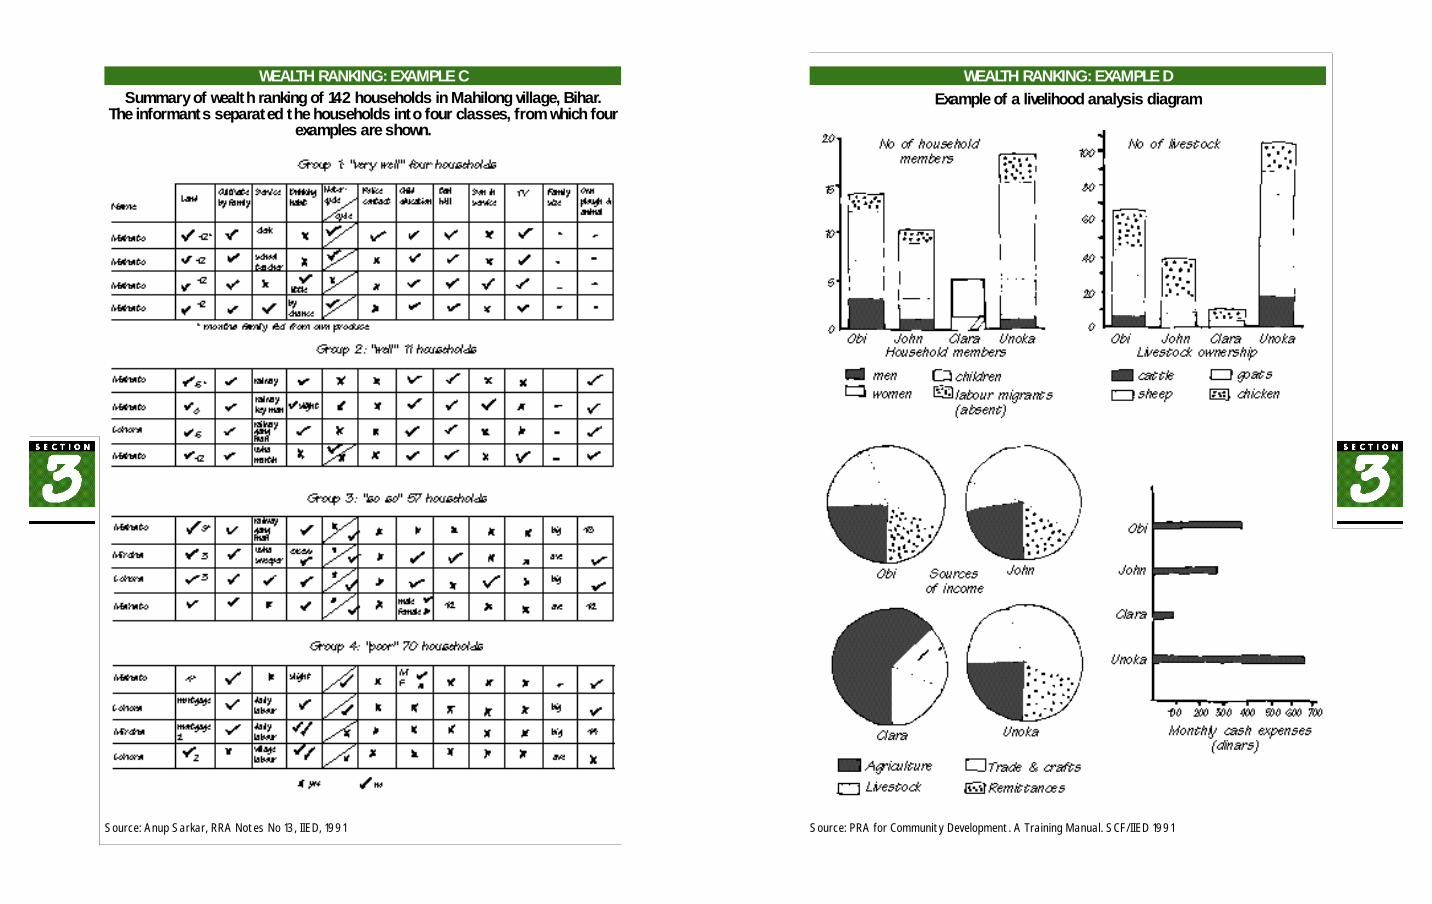
WEALTH RANKING: EXAMPLE DExample of a livelihood analysis diagram
Source: PRA for Community Development. A Training Manual. SCF/IIED 1991
WEALTH RANKING: EXAMPLE CSummary of wealth ranking of 142 households in Mahilong village, Bihar.
The informants separated the households into four classes, from which fourexamples are shown.
Source: Anup Sarkar, RRA Notes No 13, IIED, 1991
PAGE 3 9
groups of poor households. The poorest group (one dotmarking their houses) had no land, little food, fewworkers and many dependents. The next group (two dotsmarking their houses) had little land (one or twoacres/0.4-0.8 ha), and were just able to fulfil theirconsumption requirements. The third group (three dotsmarking their houses) had about four acres of land, somehousehold members holding jobs outside the village, andwere better off in household income, food availabilityand purchasing power. Coloured markers could be usedto indicate female-headed households on the map.
Example B shows wealth ranking produced by oldwomen in the Gambia. They developed criteria todistinguish five types of households, ranging from richestto poorest, noted caste distribution among thesehouseholds and those who had received developmentassistance. Wealth rankings were also produced by youngwomen, young men and old men. When comparing thewealth rankings of the old women and young women,with those of the old men and young men, it becomesapparent that men put most emphasis on livestock andfarm implements as wealth indicators, whereas womenput most emphasis on poor housing, large families, andfood shortages as poverty indicators.
Example C is a summary of wealth ranking from 142households in Mahilong village. Identified are fourtypes—very well off, well off, average, and poor, usingboth assets and social conditions as criteria. Importantassets included cycles, water wells, televisions, ploughsand animals. Important social conditions includeddrinking habits, child education and family size.
Example D is a livelihood analysis, a type of wealthranking at the intra-household level. For each of two menand two women, household dependents, livestock assets,sources of income, and monthly expenses, are shown inbar charts and pie charts. The poorest of these householdsevidently is Clara’s; she is a female head of household,with only a few chickens and goats, and is largelydependent on agriculture for income.
PAGE 3 8
7. CHAPATTI DIAGRAMS
What are chapatti diagrams?Chapatti diagrams (or Venn diagrams) are
representations of social relationships in a community.The round shapes, which resemble chapattis, are used toindicate the relative importance of individuals and groupswithin a community.
Why do chapatti diagrams?Chapatti diagrams are used to identify the main
“actors” in the community, whether organizations orindividuals, and to identify the links between these“actors” and community activities. Chapatti diagrammingcan reveal inconspicuous sources of influence. Forexample, religious leaders and traditional midwives mayhave special knowledge of forest resources but they donot usually have a role in planning forestry developmentas do more recognized sources of influence.
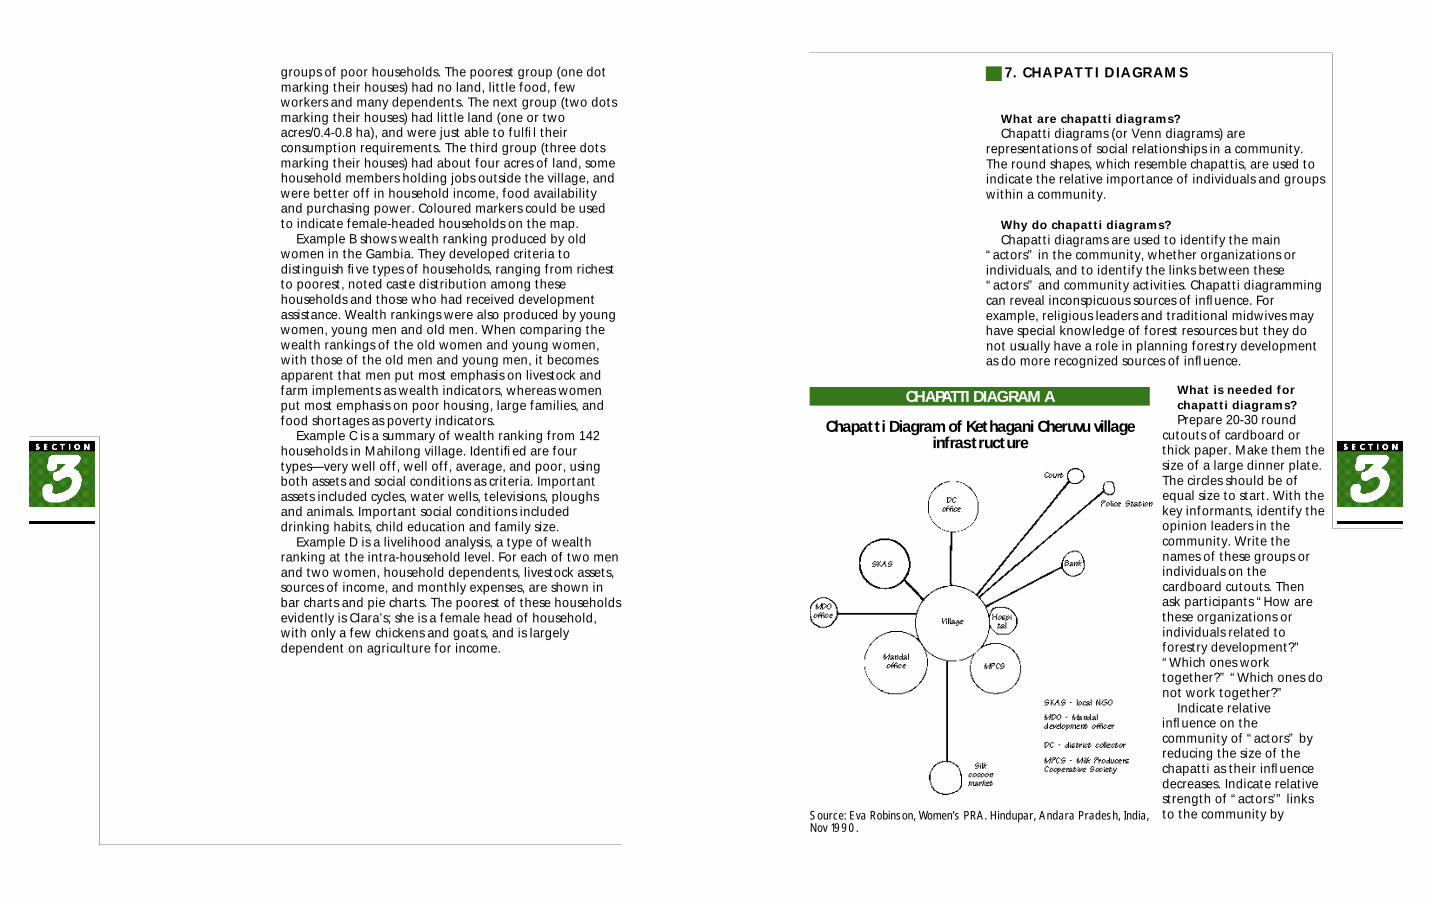
CHAPATTI DIAGRAM A
Chapatti Diagram of Kethagani Cheruvu villageinfrastructure
What is needed forchapatti diagrams?Prepare 20-30 round
cutouts of cardboard orthick paper. Make them thesize of a large dinner plate.The circles should be ofequal size to start. With thekey informants, identify theopinion leaders in thecommunity. Write thenames of these groups orindividuals on thecardboard cutouts. Thenask participants “How arethese organizations orindividuals related toforestry development?”“Which ones worktogether?” “Which ones donot work together?”
Indicate relativeinfluence on thecommunity of “actors” byreducing the size of thechapatti as their influencedecreases. Indicate relativestrength of “actors’” linksto the community bySource: Eva Robinson, Women’s PRA. Hindupar, Andara Pradesh, India,
Nov 1990.
8. STRENGTHS, WEAKNESSES,O P P O RTUNITIES AND LIMITAT I O N S( S . W.O.L.) ANALY S I S
What is S.W.O.L. analysis?S.W.O.L. analysis is a tool to document villagers’
evaluation of an activity, including its Strengths,Weaknesses, Opportunities and Limitations.
Why do S.W.O.L. analysis?S.W.O.L. is a tool used to evaluate the strengths and
weaknesses of activities, and identify possible solutionsand constraints. S.W.O.L. can also be used to identifygender-based differences in activity preferences.
What is needed for S.W.O.L. analysis?With the participants, choose the materials (e.g. large
sheet of paper, chalkboard, markers, chalk, etc.). Then,draw four vertical columns, one each for “strengths”,“weaknesses”, “opportunities” and “limitations”. Withthe participants, identify the activities to evaluate andindicate these in the left hand column (e.g. training,vegetable plots, bee keeping, etc.). Avoid listing morethan three or four items so that there is enough time todiscuss each item thoroughly.
Next, with the participants, fill in each column. In the“strengths” column list all the good aspects (e.g. moretraining available, training takes place close to home). Inthe “weaknesses” column, list all the negative aspects(e.g. training fees are too high, only men are invited toparticipate). In the “opportunities” column, list possiblesolutions to get rid of, or diminish, the negative aspects(e.g. making invitations explicitly welcoming to women).In the “limitations” column, list possible constraints (e.g.lack of funds).
Finally, discuss the evaluation with other villagers. “Didboth women and men participate in the evaluation?”“Did their evaluations differ?”
PAGE 4 1PAGE 4 0
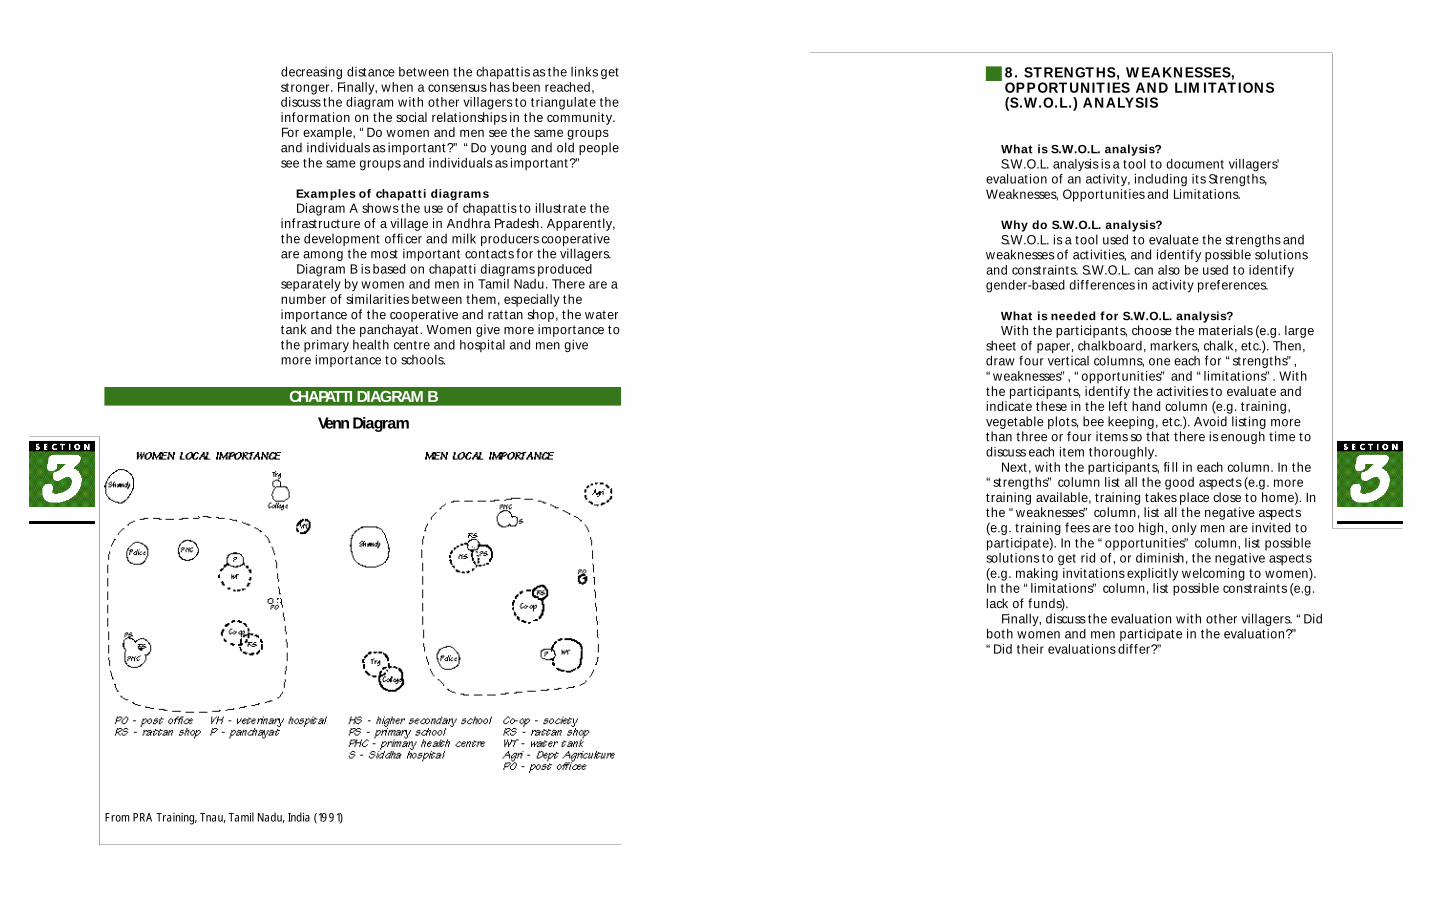
CHAPATTI DIAGRAM B
Venn Diagram
decreasing distance between the chapattis as the links getstronger. Finally, when a consensus has been reached,discuss the diagram with other villagers to triangulate theinformation on the social relationships in the community.For example, “Do women and men see the same groupsand individuals as important?” “Do young and old peoplesee the same groups and individuals as important?”
Examples of chapatti diagramsDiagram A shows the use of chapattis to illustrate the
infrastructure of a village in Andhra Pradesh. Apparently,the development officer and milk producers cooperativeare among the most important contacts for the villagers.
Diagram B is based on chapatti diagrams producedseparately by women and men in Tamil Nadu. There are anumber of similarities between them, especially theimportance of the cooperative and rattan shop, the watertank and the panchayat. Women give more importance tothe primary health centre and hospital and men givemore importance to schools.
From PRA Training, Tnau, Tamil Nadu, India (1991)

PAGE 4 3PAGE 4 2
For use in gender analysis training, the case study mustpresent factual information, disaggregated by gender,
on the roles, resources and constraints of communitymembers in the case study area.
It is often assumed that case studies should be written.In fact, case studies can also be presented visually by usingslide sets and videos, and by using maps, diagrams, tables,and photographs. Many of the RRA tools will providemost of the information in a visual form. Combiningvisual and written presentations adds interest and fun toa case study. On their own, visual presentations are usefulif participants have low literacy levels.
To be effective for gender analysis and forestry trainingboth written and visual case studies should:
Balance gender and forestry informationA gender analysis training case study is a bifocal look at
a forestry programme and its context. The case studymust balance information between forestry and genderissues, and relate these to each other, and to othersectors, such as agriculture, livestock, nutrition,subsistence cultivation and so forth. The information mustbe disaggregated by gender and sufficient to analyse thedifferential impacts on women and men.
Balance general and specific informationA good training case study contains sufficient detail on
the specific context of the case study, such as detailedgender-disaggregated information on forestry andagricultural tasks. This should be balanced by informationwhich reveals links to more general issues, such assustainable forestry development.
Provoke questionsA good case study does not provide answers, but
provokes discussion and demonstrates the need tounderstand, “Who is doing this?” “Who benefits?” “Whoshould be included?” The case study should challenge thetrainees to question the basis of decisions they makerelated to forestry development.
5 Documenting the case study
Examples of S.W.O.L. analysisChart A shows a simple example of how S.W.O.L. can
be used. The advantage of S.W.O.L. is its recognition thatevery issue has positive and negative aspects. S.W.O.L. ismost effective when used to further discussion of keyissues arising from other tools. For example, it can beused to explore opportunities for reversing environmentaldegradation revealed during a trend diagram, or toexplore limitations of focusing on the preferred cropsidentified during matrix rankings. It is a tool for lookinginto the future.
Triangulation is an important aspect of RRA.Triangulation is the process of checking the accuracy ofinformation by using at least three differentmethodologies, e.g. document reviews, seasonalmapping, trend diagramming.
CHART SWOLVillage Khajret Uperli-Gangauri

PAGE 4 5
References
AA/IIED (1992). From Input to Impact. PRA for Action Aid, TheGambia. IIED.
Anon. (1991). PRA Training. TNAU, Tamil Nadu.Bruce, J. (1989). Rapid Appraisal of Land and Tree Tenure.
Community Forestry Note 5. Food and AgricultureOrganization, Rome.
Chambers, R. (1990). “How to do participatory mapping”;“How to do a transect”; “How to do seasonal analysis”;“How to do matrix ranking or scoring”; “How to do trenddiagramming”. Unpublished.
Chambers, R. (1992). “Methods for Analysis by Farmers: TheProfessional Challenge” Paper for the Association forFarming Systems research/Extension 1991-1992 Symposium,11 Sept. Michigan State University, East Lansing, MI.
Davis-Case, D. (1990). The Community’s Toolbox: The Idea,Methods and Tools for Participatory Assessment, Monitoringand Evaluation in Community Forestry. Community ForestryField Manual 2. Food and Agriculture Organization, Rome.
Forests, Trees and People Newsletter, No. 15/16. Food andAgriculture Organization and the Swedish University ofAgricultural Sciences (SUAS).
Freudenberger, K. Schoonmaker. (1994). “Tree and landtenure: Rapid appraisal tools”. Field Manual. Food andAgriculture Organization, Rome
Guijt, I. (1992). Gender differences and PRA. IIED, London.IIED (Aug. 1991). “Participatory Rural Appraisal”. RRA Notes 13IIED. (1992). “Special Issue on Applications of Wealth
Rankings”. RRA Notes 15 (May). Jackson, C., J. McCracken, C. Kabutha and W. Ogana (1992).
Women, Conservation and Agriculture: A Manual forTrainers. Commonwealth Secretariat. WID Programme.Human Resource Development Group. Marlborough House,Pall Mall. London.
Khon Kaen University (1987). Rapid Rural Appraisal.Proceedings of the 1985 International Conference.
Mascarenhas, J. and P.D.P. Kumar (n.d.). “ParticipatoryMapping & Modelling – User’s Note” (unpublished).
Molnar, A. (1988). Rapid Appraisal. Community Forestry Note3. Food and Agriculture Organization, Rome.
Robinson, E. (Nov. 1990). “Women’s PRA”. Hindupur, AndhraP r a d e s h .
Welbourne, A. (1992). “PRA Materials on Gender”. IIED, 11Nov. (unpublished).
You can order FAO publications from:FAO/Community Forestry Unit
Via delle Terme di Caracalla00100 Rome, Italy
You can order IIED publications from:IIED/RRA Network
3, Endsleigh StreetLondon WC 1H 0DD, UK
Be realisticA good case study simulates a situation the trainees
recognize from their own experience. When the casestudy information is credible to the trainees they can seethat gender analysis is an effective tool for forestrydevelopment.
Provide complete informationA good case study provides all the information
necessary for completing the four Steps or Profiles of thegender analysis and forestry Framework. The informationis accurate; there are no factual inconsistencies and thecase study does not contain assumptions or opinions.
PAGE 4 4