how to trade forex using fibonacci price relationships
TRANSCRIPT

8/6/2019 How to Trade Forex Using Fibonacci Price Relationships
http://slidepdf.com/reader/full/how-to-trade-forex-using-fibonacci-price-relationships 1/4
TECHNICAL ANALYSIS
Figure 1
Carolyn Boroden shows how to use Fibonacci price
relationships and the ‘clustering’ of Fibonacci
relationships to identify low risk trade setups
HowtoTradeForexusingFibonacciPrice
Relationships
CAROLYN BORODEN
Most traders who use technical analysis are amiliar with using single Fibonacciprice relationships (such as price retracements) to help dene potential sup-port and resistance points in a market. However, many traders are less amiliar
with the concept o “clustering” Fibonacci price relationships to identiy high probabil-ity, relatively low risk trade setups.
In this article, I will explain what this trade setup is, and then provide examples to show how you might use this strategy in your trading.
When Fibonacci price clusters are used as a trading strategy, a setup or possible trad-ing opportunity occurs when the analyst sees a coincidence o at least three Fibonacciprice relationships coming together within a relatively tight price range on the chart.
Tis coincidence o price relationshipsdenes a key price support or resistancezone or a potential trade entry. Fibon-acci price retracements, price extensionsand price projections are made rom key swing highs and lows that are obvious onthe chart being analyzed. Tere is a bito an ‘art’ to selecting the key highs andlows that are relevant or creating these
clusters, but the examples should give youa good idea where you can start.
o make projections, we use the ratiosdened by the Fibonacci number series.Te generally used ratios are: .382, .50,.618, .786, 1.00, 1.272 and 1.618. Attimes, .236, 2.618 and 4.236 are used asratios to conrm other levels. Note that these same key ratios can be applied directly to the time axis of the market to identify times when the market is more likely to re-verse trend. Tis may be the subject of a
future article.
14 NOVEMBER 2007

8/6/2019 How to Trade Forex Using Fibonacci Price Relationships
http://slidepdf.com/reader/full/how-to-trade-forex-using-fibonacci-price-relationships 2/4
TECHNICAL ANALYSIS
Figure 2
Figure 3
Let’s look at some examples o individualFibonacci price relationships beore look-ing at an example o a ‘price cluster.’
First, we will look at price retracementsthat many technical traders should al-ready be amiliar with. When runningretracements, the measure is taken rom
a low to a high swing looking or possi-ble support or it is taken rom a high tolow swing looking or possible resistance.o dene possible support or resistance, we are measuring the length o the swingand then allowing our trading program toproportion this prior swing by the ratioso .382, .50, .618 and .786. When themarket pulls back to these ratios o theprior swing, we watch or possible sup-port or resistance.
Figure 1 shows an example o price re-tracement on a daily JPY chart. All o thecharts in this article are provided courtesy o the Dynamic rader sotware. Here weare measuring a prior low to high romthe May 17, 2006 low to the October13, 2006 high. By clicking on the low and then the high o this swing, the pro-gram ran the potential retracement levelsor possible support o this swing as JPY started to pull back rom the October 13,2006 high. Note: In this case, the 50%retracement level provided support rom where the rally resumed.
Now, let’s take a look at an example o aprice extension, which is also measuredrom a prior swing low to high or highto low to project possible support or re-sistance in a particular market. However,rather than retracing a prior swing, weuse the Fibonacci ratios that EXENDbeyond 100% o that prior swing by us-ing the ratios o 1.272 and 1.618.
Figure 2, is a daily chart o the Euro.Here, we measured a prior high madeon December 6, 2006 to the low madeon January 12, 2007 and ran the exten-sion ratios looking or possible resistanceto the rally rom the January low. In thisexample, the extension drawn rom 1.272ofered no resistance, though the marketdid terminate the rally within a couple o pips o the 1.618 extension o that priorswing.
Last, we want to look at price projectionso prior swings. Te price projection tool
that I use in the Dynamic rader programis the alternate price projection, or APP.It is typically considered an ‘extensiontool’ in other well-known programs. Bot-tom line, projections are made so priorswings in the market can be compared with current swings in the same direction.For this reason, we need a price tool that
can project using three points on a chart.Te ratios that I use or projections are1.0 and 1.618.
Figure 3 is an example o a projectionon a daily chart o CHF. First, I selectedthe August 21, 2006 low to the August25, 2006 high and projected the 1.0 and1.618 ratios upward rom the low on Au-gust 31, 2006 looking or possible resist-ance at either o the projection points. Inthis case, the high at 1.2623 was 6 pips
above the 1.618 projection o 12617 while the 1.0 projection was essentially ignored. Keep in mind when runningthese levels that you will not always see a
16 NOVEMBER 2007
8/6/2019 How to Trade Forex Using Fibonacci Price Relationships
http://slidepdf.com/reader/full/how-to-trade-forex-using-fibonacci-price-relationships 3/4
Figure 5
Figure 4
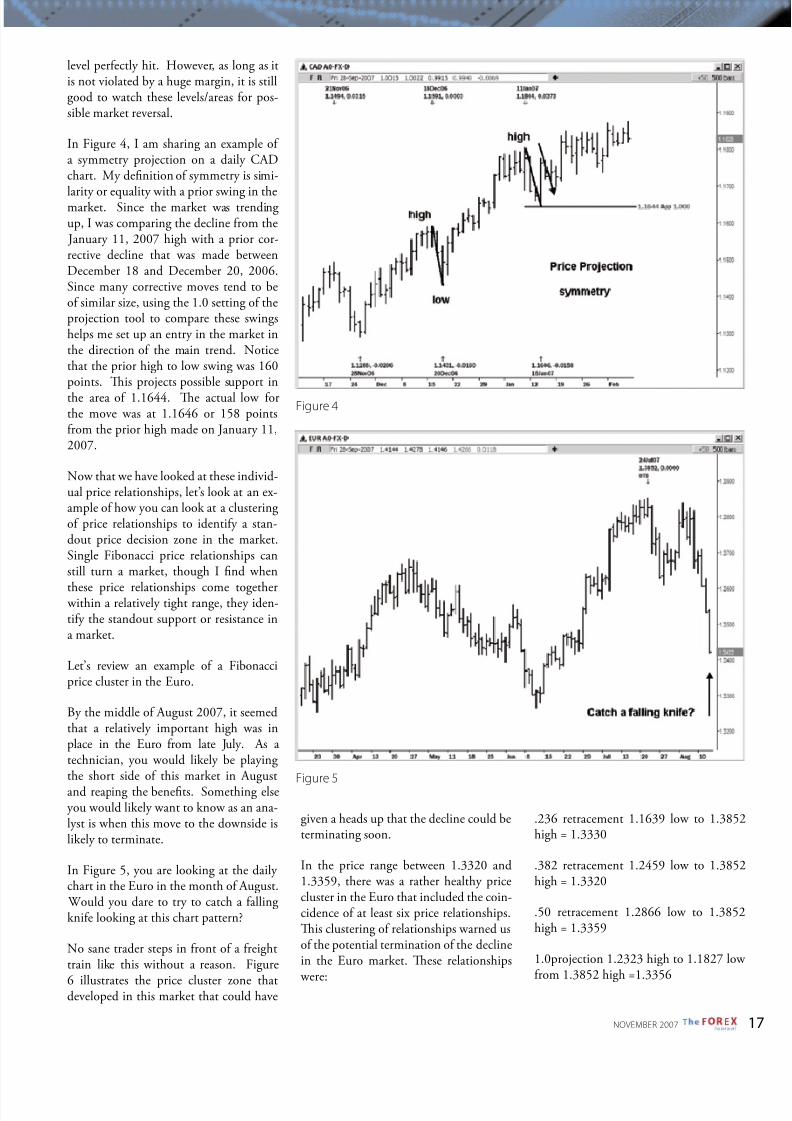
level perectly hit. However, as long as itis not violated by a huge margin, it is stillgood to watch these levels/areas or pos-sible market reversal.
In Figure 4, I am sharing an example o a symmetry projection on a daily CADchart. My denition o symmetry is simi-
larity or equality with a prior swing in themarket. Since the market was trendingup, I was comparing the decline rom the January 11, 2007 high with a prior cor-rective decline that was made betweenDecember 18 and December 20, 2006.Since many corrective moves tend to beo similar size, using the 1.0 setting o theprojection tool to compare these swingshelps me set up an entry in the market inthe direction o the main trend. Noticethat the prior high to low swing was 160points. Tis projects possible support in
the area o 1.1644. Te actual low orthe move was at 1.1646 or 158 pointsrom the prior high made on January 11,2007.
Now that we have looked at these individ-ual price relationships, let’s look at an ex-ample o how you can look at a clusteringo price relationships to identiy a stan-dout price decision zone in the market.Single Fibonacci price relationships canstill turn a market, though I nd when
these price relationships come together within a relatively tight range, they iden-tiy the standout support or resistance ina market.
Let’s review an example o a Fibonacciprice cluster in the Euro.
By the middle o August 2007, it seemedthat a relatively important high was inplace in the Euro rom late July. As atechnician, you would likely be playingthe short side o this market in Augustand reaping the benets. Something elseyou would likely want to know as an ana-lyst is when this move to the downside islikely to terminate.
In Figure 5, you are looking at the daily chart in the Euro in the month o August. Would you dare to try to catch a allingknie looking at this chart pattern?
No sane trader steps in ront o a reighttrain like this without a reason. Figure
6 illustrates the price cluster zone thatdeveloped in this market that could have
given a heads up that the decline could beterminating soon.
In the price range between 1.3320 and1.3359, there was a rather healthy pricecluster in the Euro that included the coin-cidence o at least six price relationships.Tis clustering o relationships warned uso the potential termination o the declinein the Euro market. Tese relationships
were:
.236 retracement 1.1639 low to 1.3852high = 1.3330
.382 retracement 1.2459 low to 1.3852high = 1.3320
.50 retracement 1.2866 low to 1.3852high = 1.3359
1.0projection 1.2323 high to 1.1827 low rom 1.3852 high =1.3356
17NOVEMBER 2007

8/6/2019 How to Trade Forex Using Fibonacci Price Relationships
http://slidepdf.com/reader/full/how-to-trade-forex-using-fibonacci-price-relationships 4/4
TECHNICAL ANALYSIS
Figure 6
Figure 7
Tis particular example of a pricecluster zone included only price re-tracements and projections. Tere
were no price extensions. Note thata price cluster can include the coin-cidence of any of these three types of price relationships. It can be threeretracements or a retracement, an ex-
tension and a projection. It can alsobe more than three price relation-ships. Let’s say a price cluster zoneincludes six price relationships as inthe Euro example. Tis does notmean that the zone is any more likely to hold. It just means that this is animportant decision area in the mar-ket. If such a large zone holds, it islikely to produce a tradable reaction.If this same type of zone is violated,it votes for a continuation and possi-ble acceleration of the trend until thenext meaningful price decision is metand tested.
Carolyn Boroden is a commodity tradingadvisor and technical analyst specializingin Fibonacci time and price analysis. Her ocus is on the “synchronicity” or confuenceso both price and time relationships that set up relatively low risk, high probability trading setups. Ms. Boroden has beeninvolved in the trading industry since 1978.Her background includes working on the
major trading foors including the ChicagoMercantile Exchange, the Chicago Board o Trade, NYFE, and COMEX.
Ms. Boroden taught a segment o the Chicago Commodity Boot Campseminars or our years on advanced trading techniques using Fibonacci ratioson both the time and price axis o themarket. She has been a eatured speaker on Fibonacci analysis or venues such asthe Market Technicians Association, theOnline Trading Expo, TradingMarkets,
and Cornerstone Investments Group. Ms.Boroden currently runs an intraday tradingadvisory/chatroom service which includesend o day video updates ocusing on Stock Index Futures. She mentors individuals onher analysis technique and also conductsgroup seminars on this same technique.Her rst book is to be published and released by McGraw-Hill in January 2008. Its title isFibonacci Trading, How to Master the Timeand Price Advantage.
Carolyn can be reached at [email protected]
or via her website www.bonacciqueen.com
1.0projection 1.2980 high to 1.2459 low rom 1.3852 high = 1.3331
1.0projection 1.3369 high to 1.2866 low rom 1.3852 high = 1.3349
Even though this price cluster zone wasidentied early, it is still not a good ideato step in ront o the proverbial reighttrain. First, we would see i the decline
stalled or stopped around this key pricedecision zone. Ten, we would look to
see i there was a price reversal trigger toenter the market on the buy side. Figure7 illustrates the result o the price clustersetup. Te actual low was made at 1.3361, which was just two pips above the highend o the zone and as they say this was“close enough or government work”.
As o the submission o this article, theEuro has rallied 917 pips rom the price
cluster low.
18 NOVEMBER 2007