how to select the right fertilizer for hydroponics · ca:1 mg, the high magnesium proportion can...
TRANSCRIPT

1
How to Select the Right Fertilizer for Hydroponics
Petrus Langenhoven, Ph.D.Horticulture and Hydroponics Crops Specialist
Greenhouse and Indoor Hydroponics Workshop, West Lafayette IN, September 5, 2018
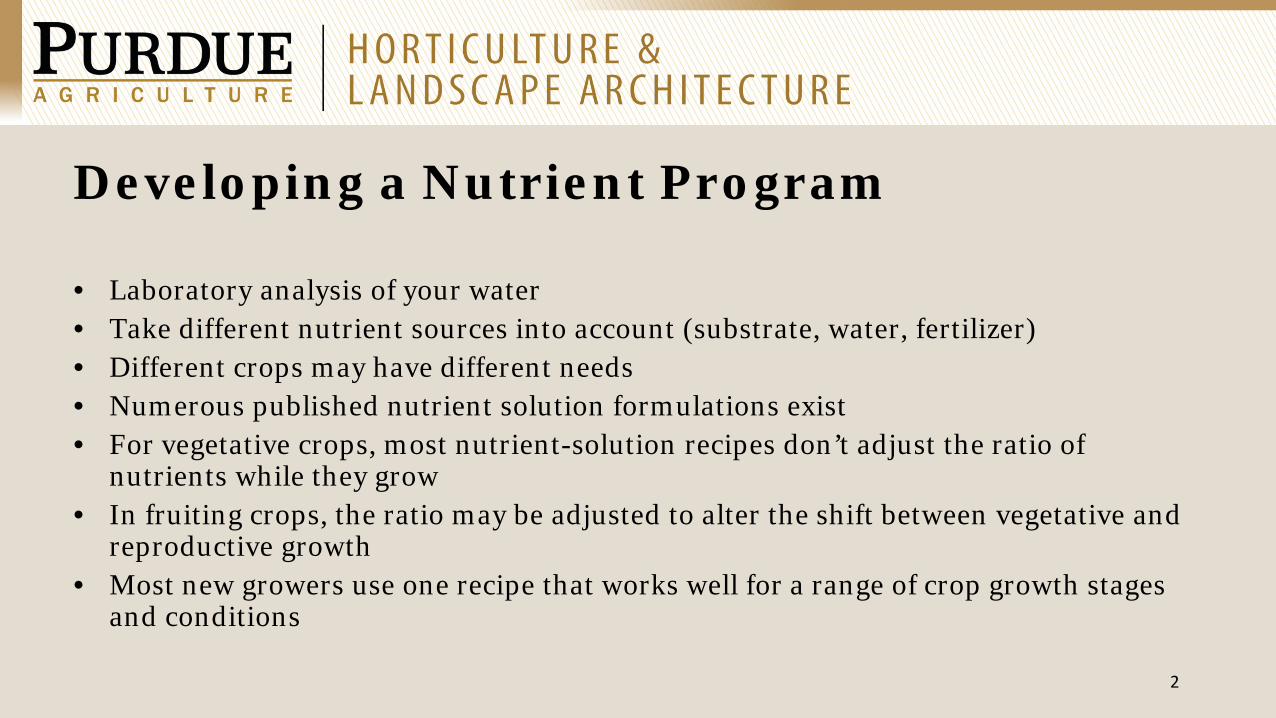
Developing a Nutrient Program
2
• Laboratory analysis of your water• Take different nutrient sources into account (substrate, water, fertilizer)• Different crops may have different needs• Numerous published nutrient solution formulations exist• For vegetative crops, most nutrient-solution recipes don’t adjust the ratio of
nutrients while they grow• In fruiting crops, the ratio may be adjusted to alter the shift between vegetative and
reproductive growth• Most new growers use one recipe that works well for a range of crop growth stages
and conditions
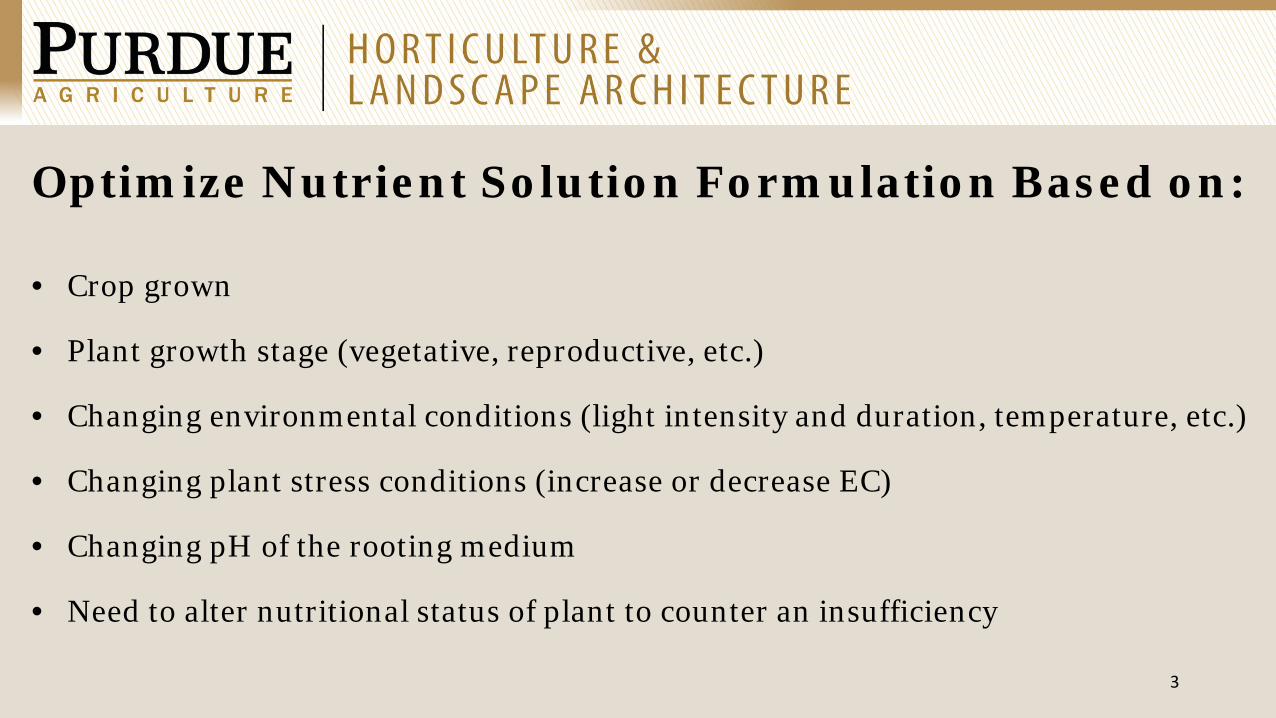
Optimize Nutrient Solution Formulation Based on:
3
• Crop grown
• Plant growth stage (vegetative, reproductive, etc.)
• Changing environmental conditions (light intensity and duration, temperature, etc.)
• Changing plant stress conditions (increase or decrease EC)
• Changing pH of the rooting medium
• Need to alter nutritional status of plant to counter an insufficiency
4
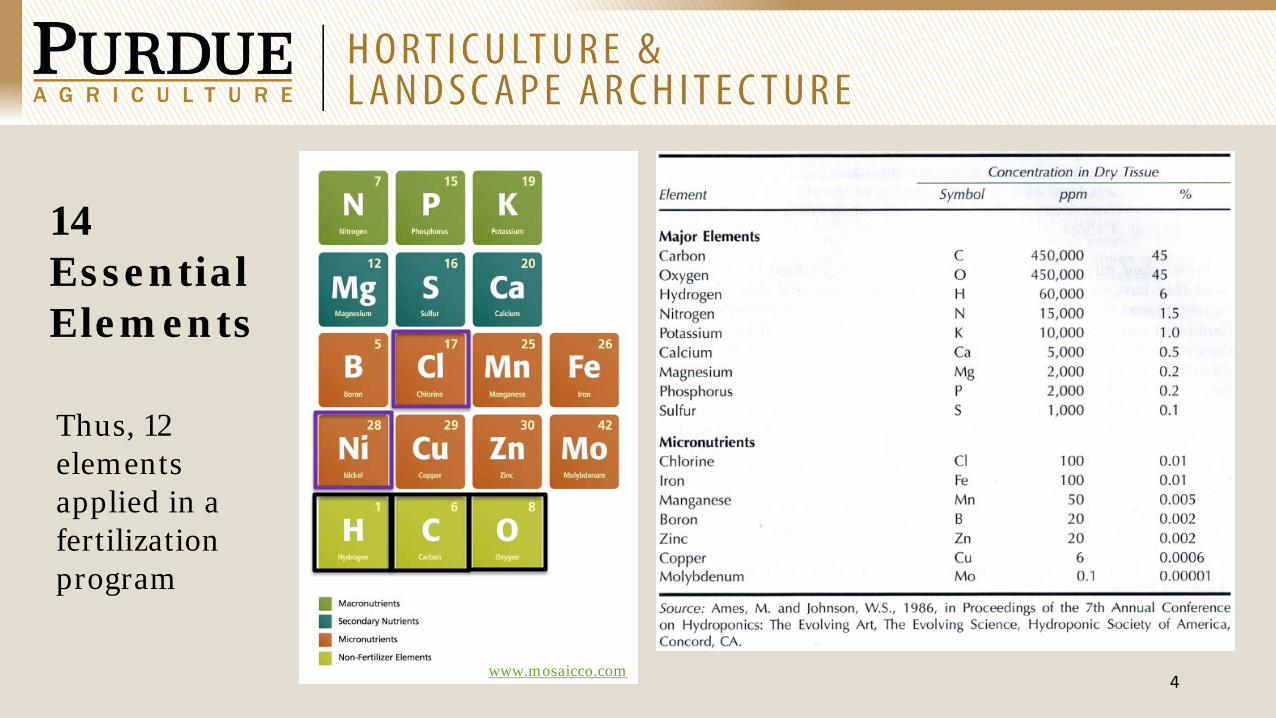
14 Essential Elements
www.mosaicco.com
Thus, 12 elements applied in a fertilization program
5
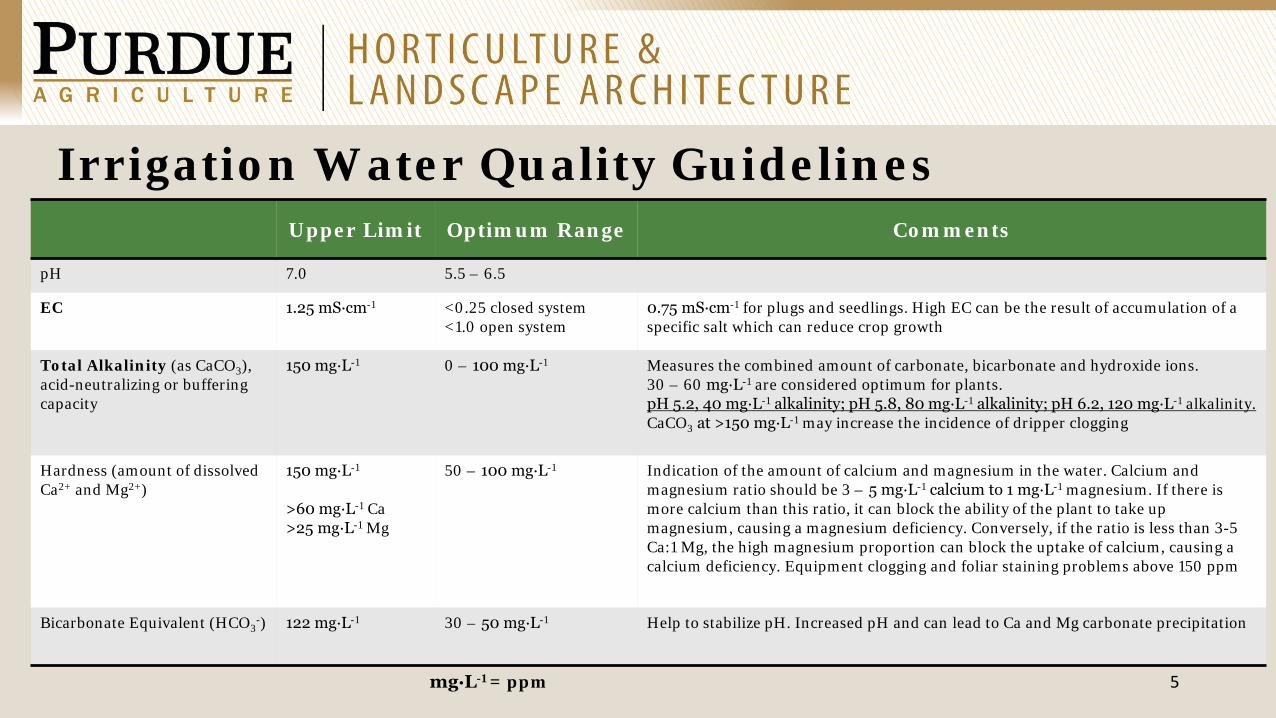
Irrigation Water Quality GuidelinesUpper Limit Optimum Range Comments
pH 7.0 5.5 – 6.5
EC 1.25 mS∙cm-1 <0.25 closed system<1.0 open system
0.75 mS∙cm-1 for plugs and seedlings. High EC can be the result of accumulation of a specific salt which can reduce crop growth
Total Alkalinity (as CaCO3), acid-neutralizing or buffering capacity
150 mg∙L-1 0 – 100 mg∙L-1 Measures the combined amount of carbonate, bicarbonate and hydroxide ions.30 – 60 mg∙L-1 are considered optimum for plants.pH 5.2, 40 mg∙L-1 alkalinity; pH 5.8, 80 mg∙L-1 alkalinity; pH 6.2, 120 mg∙L-1 alkalinity.CaCO3 at >150 mg∙L-1 may increase the incidence of dripper clogging
Hardness (amount of dissolvedCa2+ and Mg2+)
150 mg∙L-1
>60 mg∙L-1 Ca>25 mg∙L-1 Mg
50 – 100 mg∙L-1 Indication of the amount of calcium and magnesium in the water. Calcium and magnesium ratio should be 3 – 5 mg∙L-1 calcium to 1 mg∙L-1 magnesium. If there is more calcium than this ratio, it can block the ability of the plant to take up magnesium, causing a magnesium deficiency. Conversely, if the ratio is less than 3-5 Ca:1 Mg, the high magnesium proportion can block the uptake of calcium, causing a calcium deficiency. Equipment clogging and foliar staining problems above 150 ppm
Bicarbonate Equivalent (HCO3-) 122 mg∙L-1 30 – 50 mg∙L-1 Help to stabilize pH. Increased pH and can lead to Ca and Mg carbonate precipitation
mg∙L-1 = ppm
Alkalinity
6
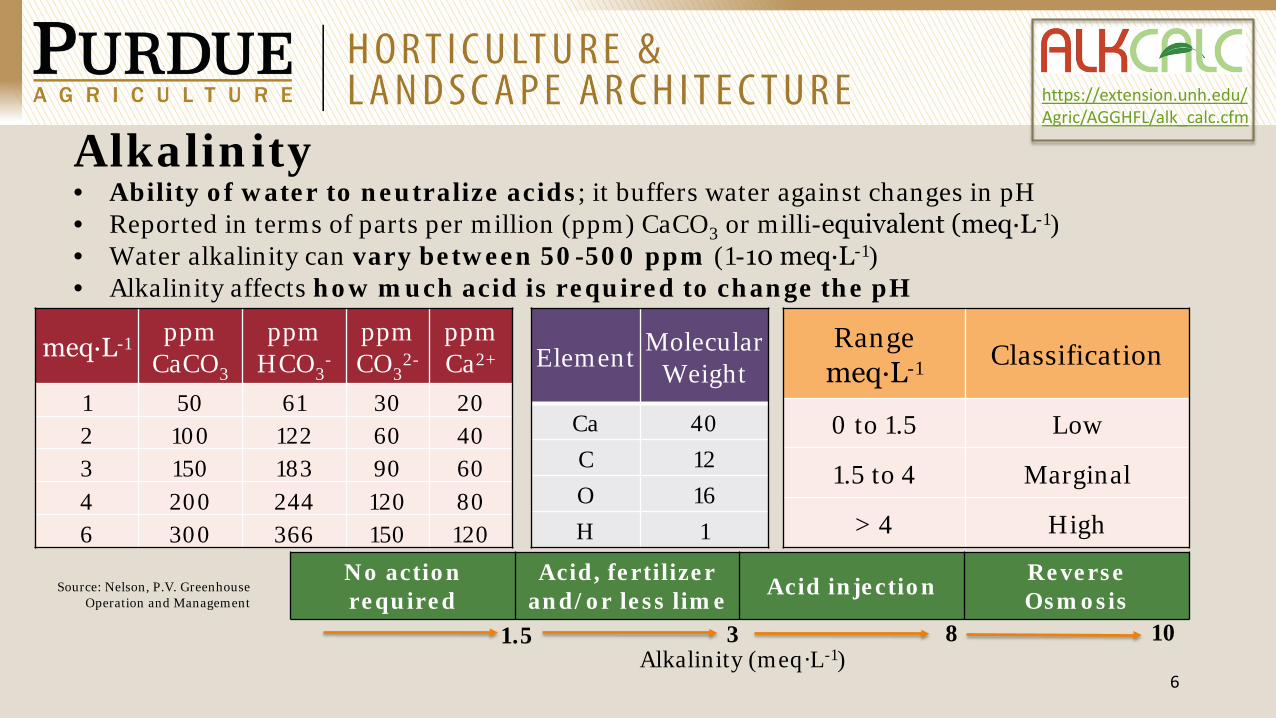
• Ability of water to neutralize acids; it buffers water against changes in pH• Reported in terms of parts per million (ppm) CaCO3 or milli-equivalent (meq∙L-1)• Water alkalinity can vary between 50-500 ppm (1-10 meq∙L-1)• Alkalinity affects how much acid is required to change the pH
meq∙L-1 ppm CaCO3
ppm HCO3
-ppm CO3
2-ppm Ca2+
1 50 61 30 202 100 122 60 403 150 183 90 604 200 244 120 806 300 366 150 120
Element Molecular Weight
Ca 40C 12O 16H 1
Rangemeq∙L-1 Classification
0 to 1.5 Low
1.5 to 4 Marginal
> 4 High
No action required
Acid, fertilizer and/or less lime Acid injection Reverse
Osmosis
Alkalinity (meq·L-1)1.5 8 103
Source: Nelson, P.V. Greenhouse Operation and Management
https://extension.unh.edu/Agric/AGGHFL/alk_calc.cfm
7
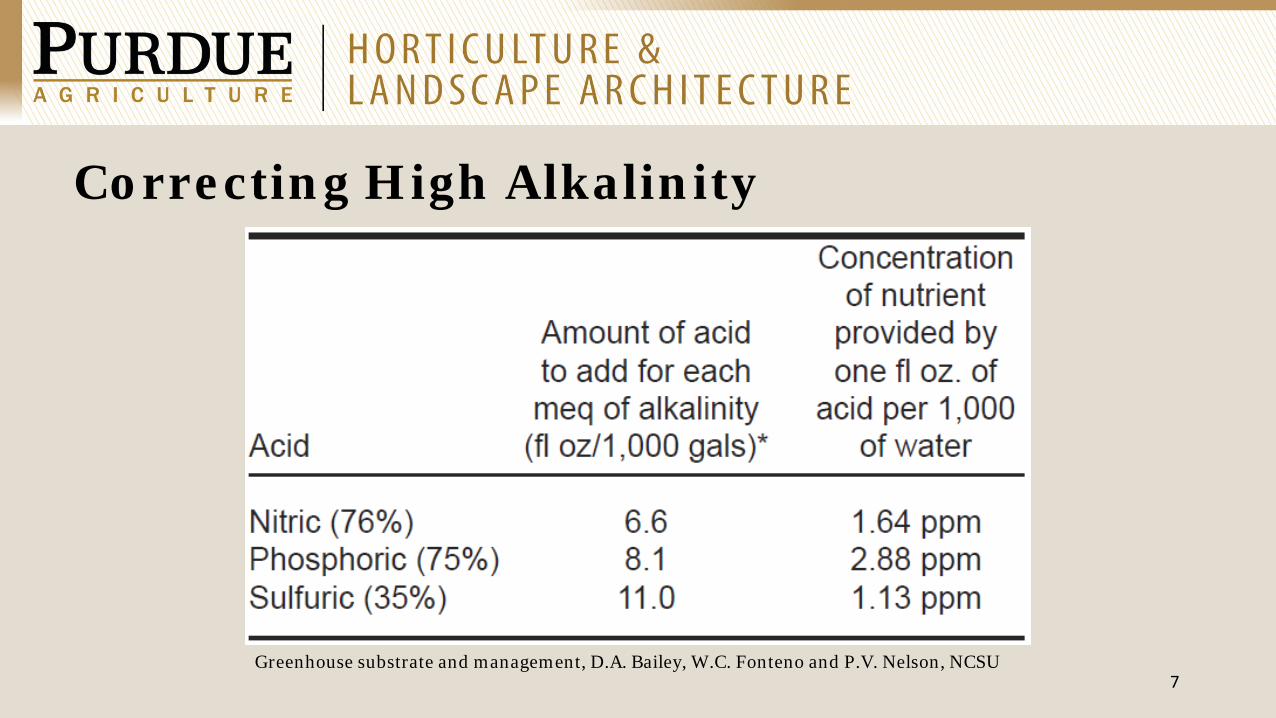
Correcting High Alkalinity
Greenhouse substrate and management, D.A. Bailey, W.C. Fonteno and P.V. Nelson, NCSU
8
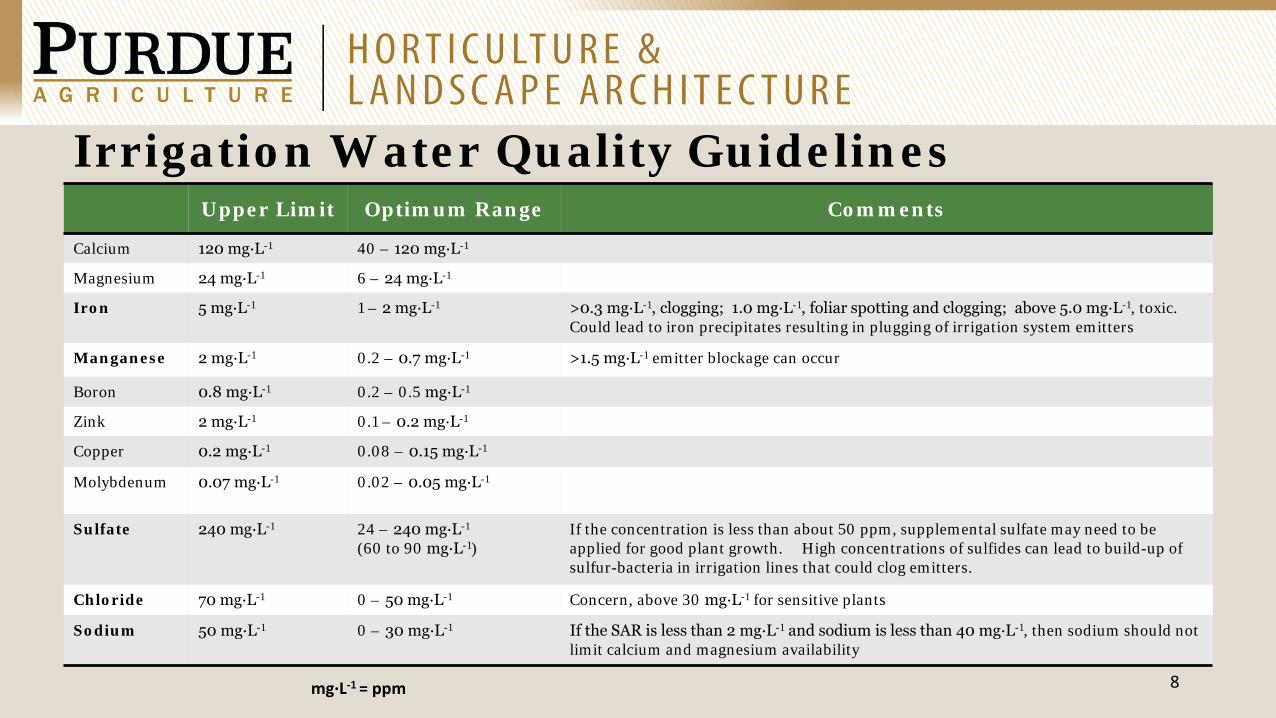
Irrigation Water Quality GuidelinesUpper Limit Optimum Range Comments
Calcium 120 mg∙L-1 40 – 120 mg∙L-1
Magnesium 24 mg∙L-1 6 – 24 mg∙L-1
Iron 5 mg∙L-1 1 – 2 mg∙L-1 >0.3 mg∙L-1, clogging; 1.0 mg∙L-1, foliar spotting and clogging; above 5.0 mg∙L-1, toxic. Could lead to iron precipitates resulting in plugging of irrigation system emitters
Manganese 2 mg∙L-1 0.2 – 0.7 mg∙L-1 >1.5 mg∙L-1 emitter blockage can occur
Boron 0.8 mg∙L-1 0.2 – 0.5 mg∙L-1
Zink 2 mg∙L-1 0.1 – 0.2 mg∙L-1
Copper 0.2 mg∙L-1 0.08 – 0.15 mg∙L-1
Molybdenum 0.07 mg∙L-1 0.02 – 0.05 mg∙L-1
Sulfate 240 mg∙L-1 24 – 240 mg∙L-1
(60 to 90 mg∙L-1)If the concentration is less than about 50 ppm, supplemental sulfate may need to be applied for good plant growth. High concentrations of sulfides can lead to build-up of sulfur-bacteria in irrigation lines that could clog emitters.
Chloride 70 mg∙L-1 0 – 50 mg∙L-1 Concern, above 30 mg∙L-1 for sensitive plants
Sodium 50 mg∙L-1 0 – 30 mg∙L-1 If the SAR is less than 2 mg∙L-1 and sodium is less than 40 mg∙L-1, then sodium should not limit calcium and magnesium availability
mg∙L-1 = ppm
9
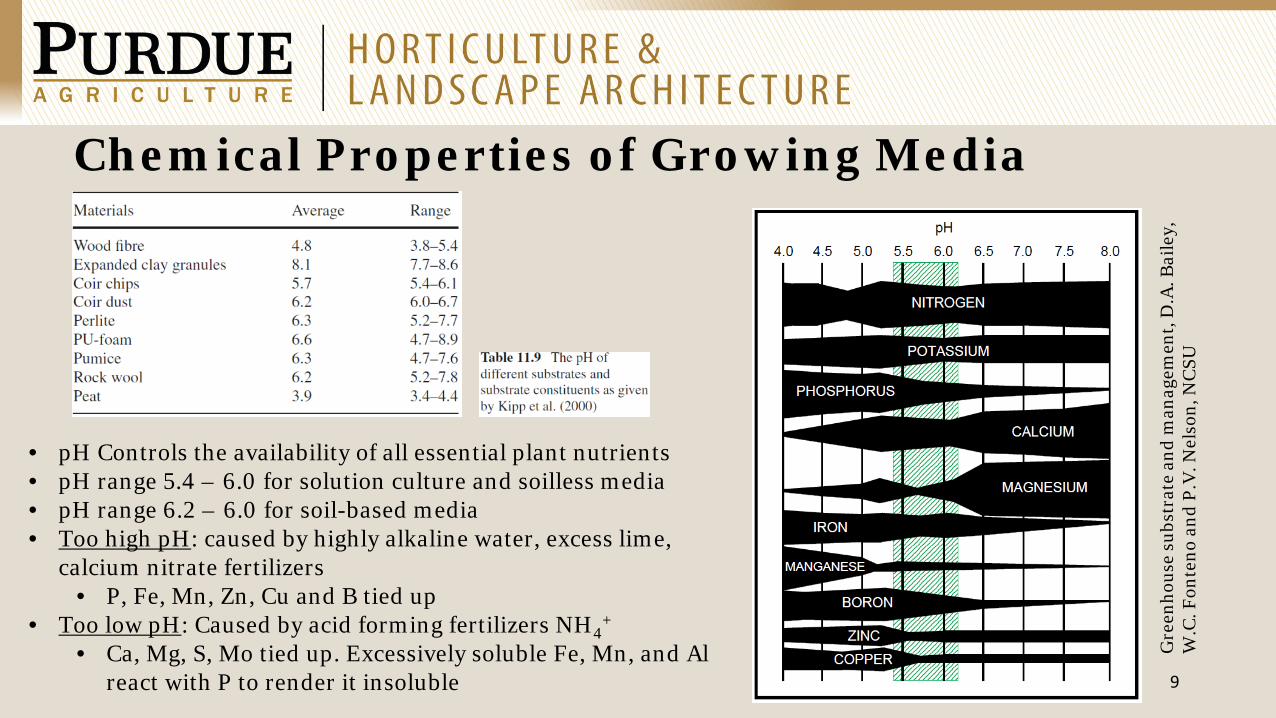
Chemical Properties of Growing Media
• pH Controls the availability of all essential plant nutrients• pH range 5.4 – 6.0 for solution culture and soilless media• pH range 6.2 – 6.0 for soil-based media• Too high pH: caused by highly alkaline water, excess lime,
calcium nitrate fertilizers• P, Fe, Mn, Zn, Cu and B tied up
• Too low pH: Caused by acid forming fertilizers NH4+
• Ca, Mg, S, Mo tied up. Excessively soluble Fe, Mn, and Al react with P to render it insoluble
Gre
enho
use
subs
trat
e an
d m
anag
emen
t, D
.A. B
aile
y,
W.C
. Fon
teno
and
P.V
. Nel
son,
NC
SU
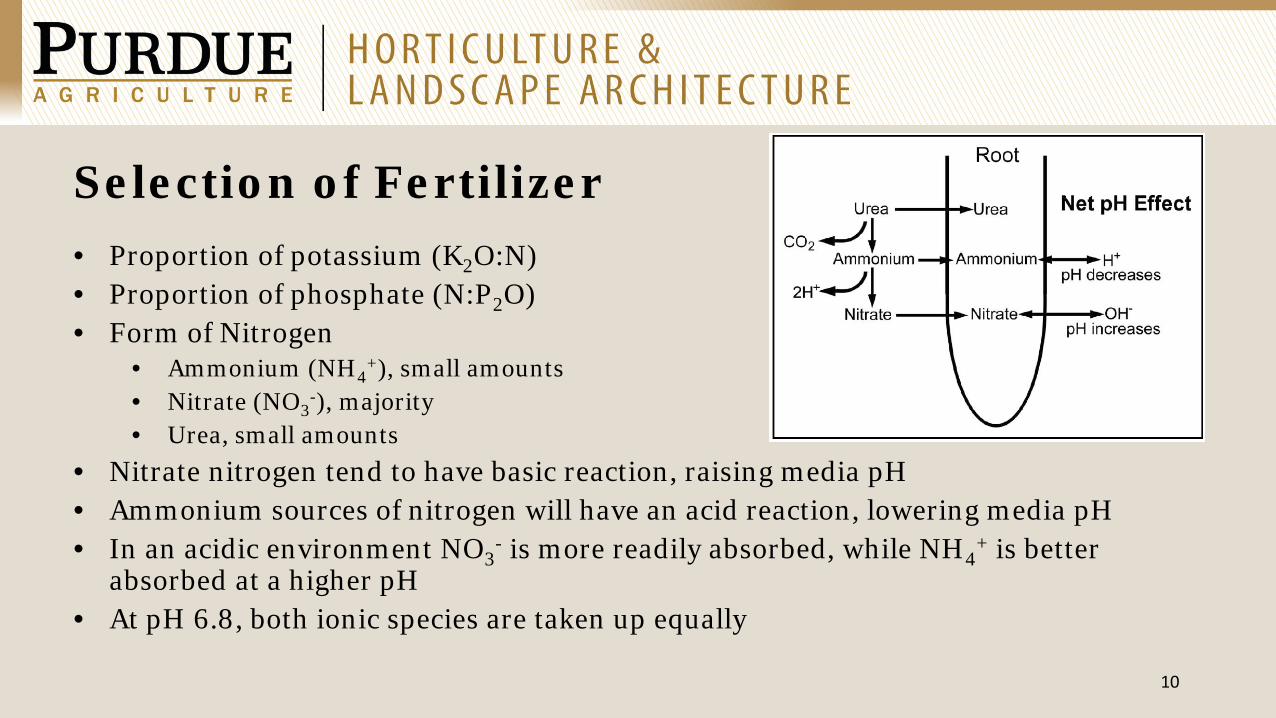
• Proportion of potassium (K2O:N)• Proportion of phosphate (N:P2O)• Form of Nitrogen
• Ammonium (NH4+), small amounts
• Nitrate (NO3-), majority
• Urea, small amounts• Nitrate nitrogen tend to have basic reaction, raising media pH• Ammonium sources of nitrogen will have an acid reaction, lowering media pH• In an acidic environment NO3
- is more readily absorbed, while NH4+ is better
absorbed at a higher pH• At pH 6.8, both ionic species are taken up equally
10
Selection of Fertilizer
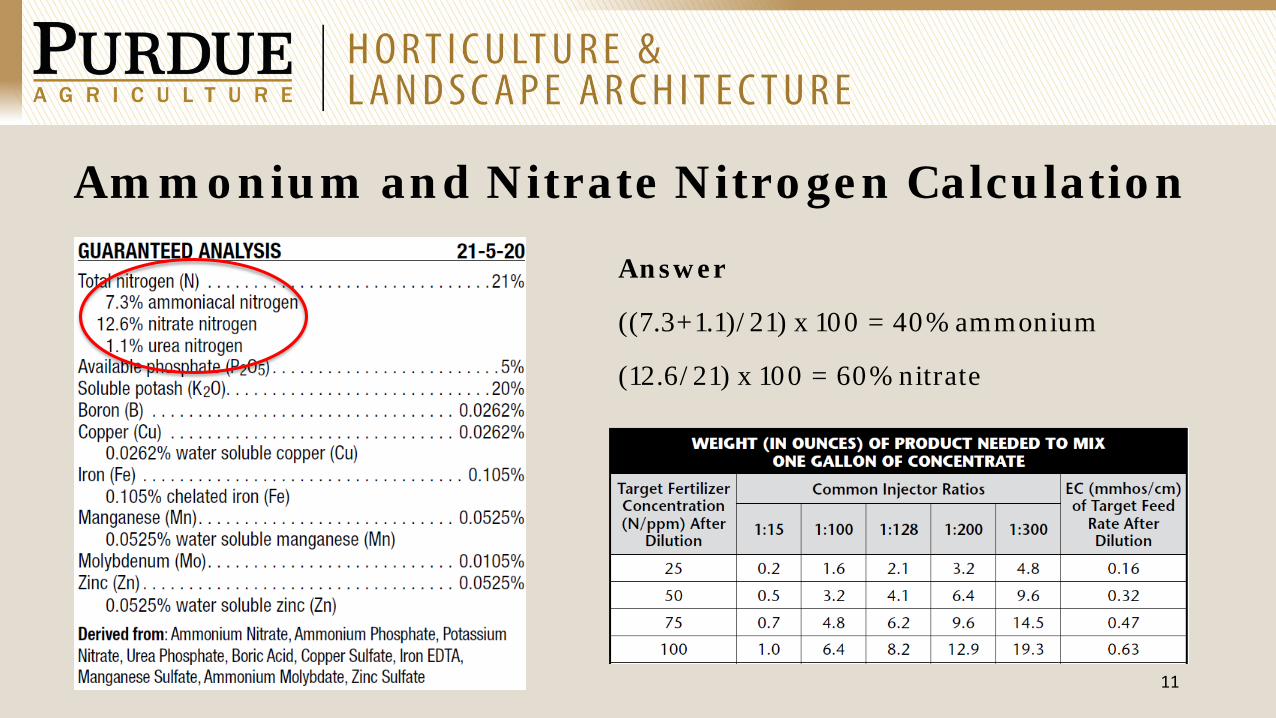
Ammonium and Nitrate Nitrogen Calculation
11
Answer
((7.3+1.1)/21) x 100 = 40% ammonium
(12.6/21) x 100 = 60% nitrate
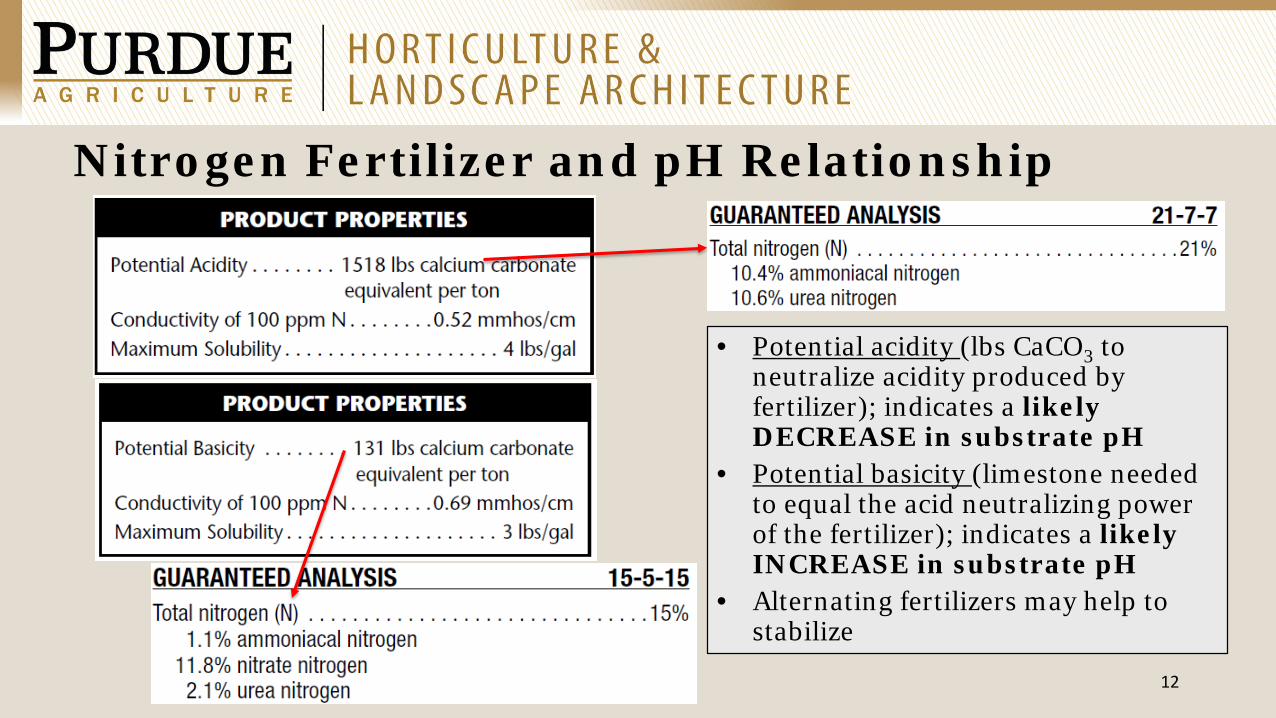
Nitrogen Fertilizer and pH Relationship
12
• Potential acidity (lbs CaCO3 to neutralize acidity produced by fertilizer); indicates a likely DECREASE in substrate pH
• Potential basicity (limestone needed to equal the acid neutralizing power of the fertilizer); indicates a likely INCREASE in substrate pH
• Alternating fertilizers may help to stabilize
13
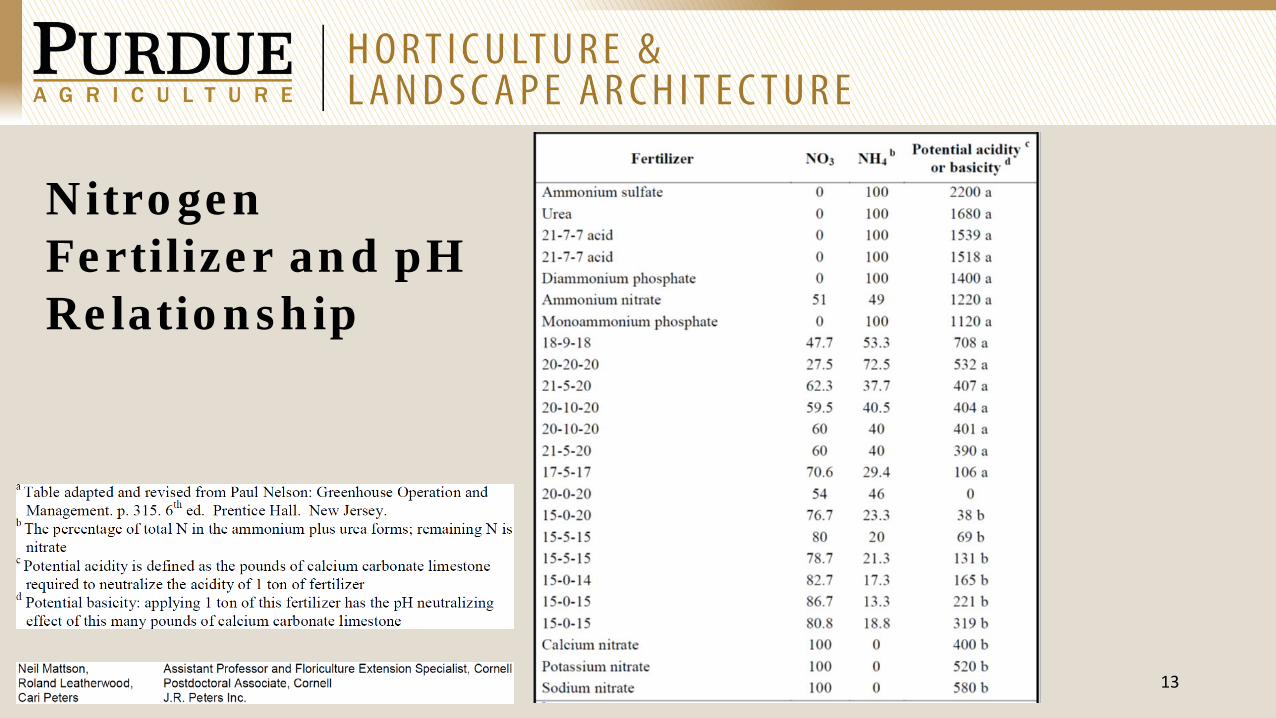
Nitrogen Fertilizer and pH Relationship
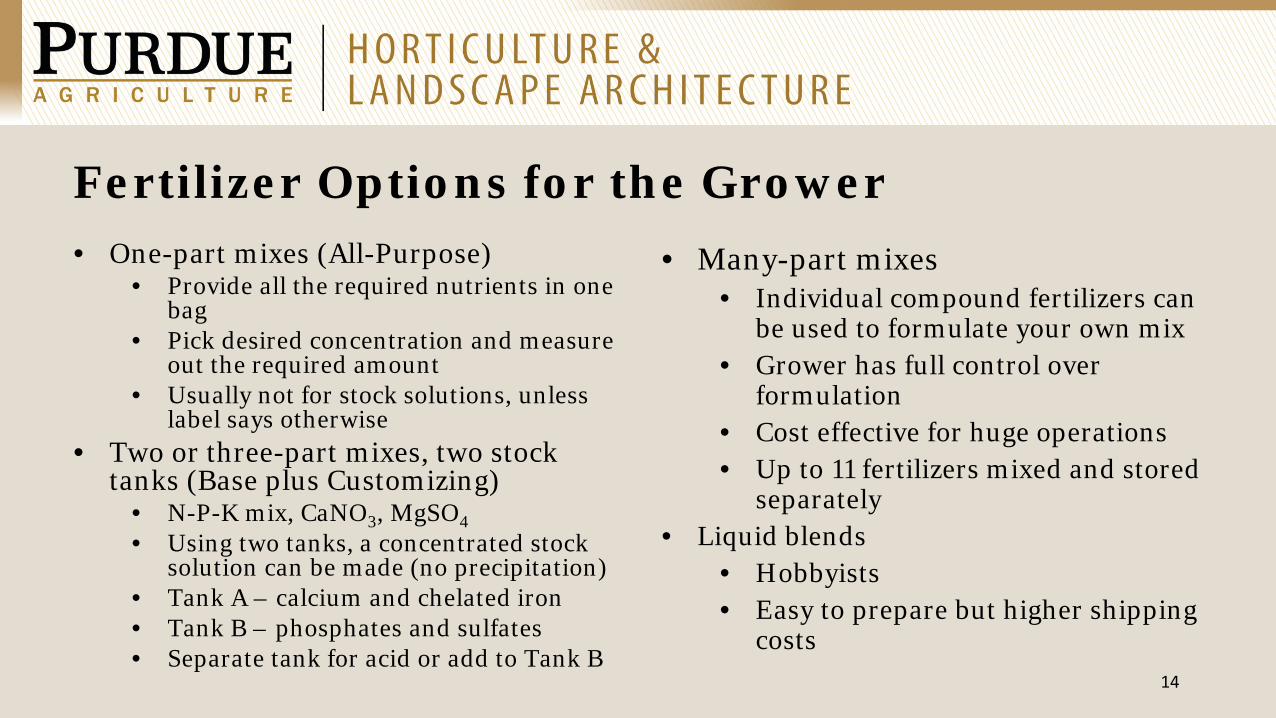
Fertilizer Options for the Grower
14
• One-part mixes (All-Purpose) • Provide all the required nutrients in one
bag• Pick desired concentration and measure
out the required amount• Usually not for stock solutions, unless
label says otherwise• Two or three-part mixes, two stock
tanks (Base plus Customizing)• N-P-K mix, CaNO3, MgSO4• Using two tanks, a concentrated stock
solution can be made (no precipitation)• Tank A – calcium and chelated iron• Tank B – phosphates and sulfates• Separate tank for acid or add to Tank B
• Many-part mixes• Individual compound fertilizers can
be used to formulate your own mix• Grower has full control over
formulation• Cost effective for huge operations• Up to 11 fertilizers mixed and stored
separately• Liquid blends
• Hobbyists• Easy to prepare but higher shipping
costs
15
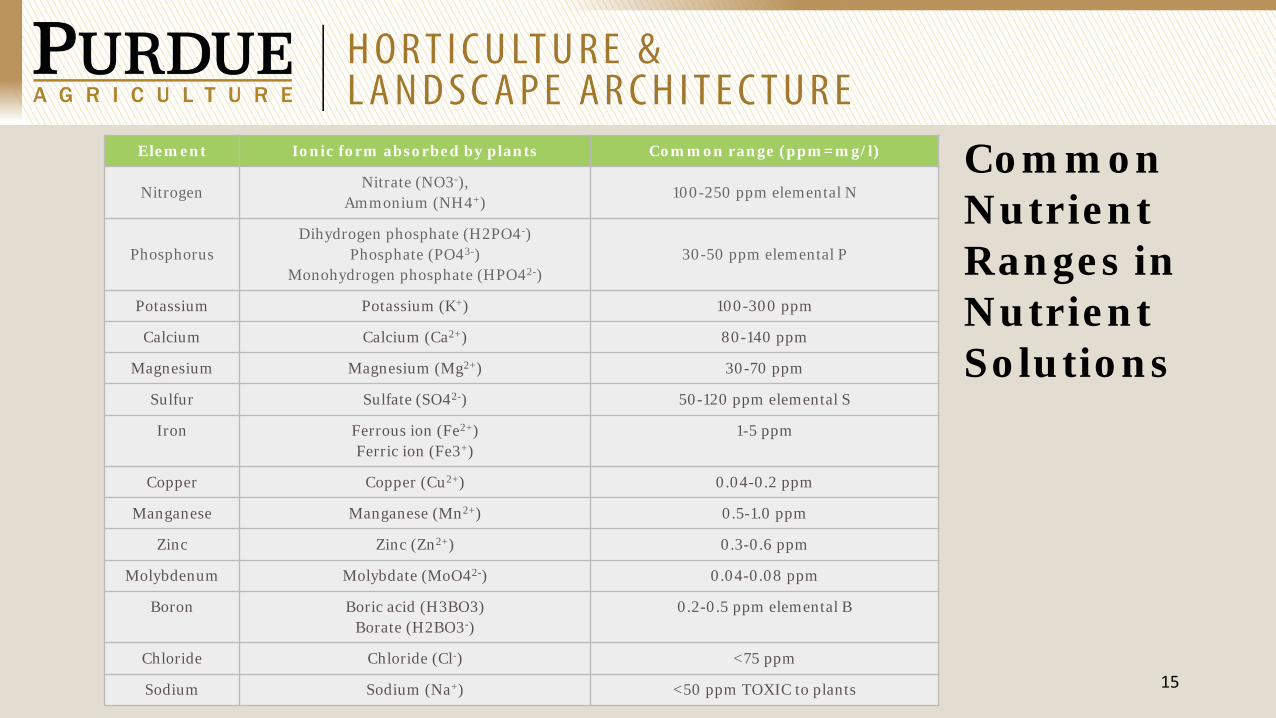
Common Nutrient Ranges in Nutrient Solutions
Element Ionic form absorbed by plants Common range (ppm=mg/l)
NitrogenNitrate (NO3-),
Ammonium (NH4+)100-250 ppm elemental N
PhosphorusDihydrogen phosphate (H2PO4-)
Phosphate (PO43-)Monohydrogen phosphate (HPO42-)
30-50 ppm elemental P
Potassium Potassium (K+) 100-300 ppm
Calcium Calcium (Ca2+) 80-140 ppm
Magnesium Magnesium (Mg2+) 30-70 ppm
Sulfur Sulfate (SO42-) 50-120 ppm elemental S
Iron Ferrous ion (Fe2+)Ferric ion (Fe3+)
1-5 ppm
Copper Copper (Cu2+) 0.04-0.2 ppm
Manganese Manganese (Mn2+) 0.5-1.0 ppm
Zinc Zinc (Zn2+) 0.3-0.6 ppm
Molybdenum Molybdate (MoO42-) 0.04-0.08 ppm
Boron Boric acid (H3BO3)Borate (H2BO3-)
0.2-0.5 ppm elemental B
Chloride Chloride (Cl-) <75 ppm
Sodium Sodium (Na+) <50 ppm TOXIC to plants
16
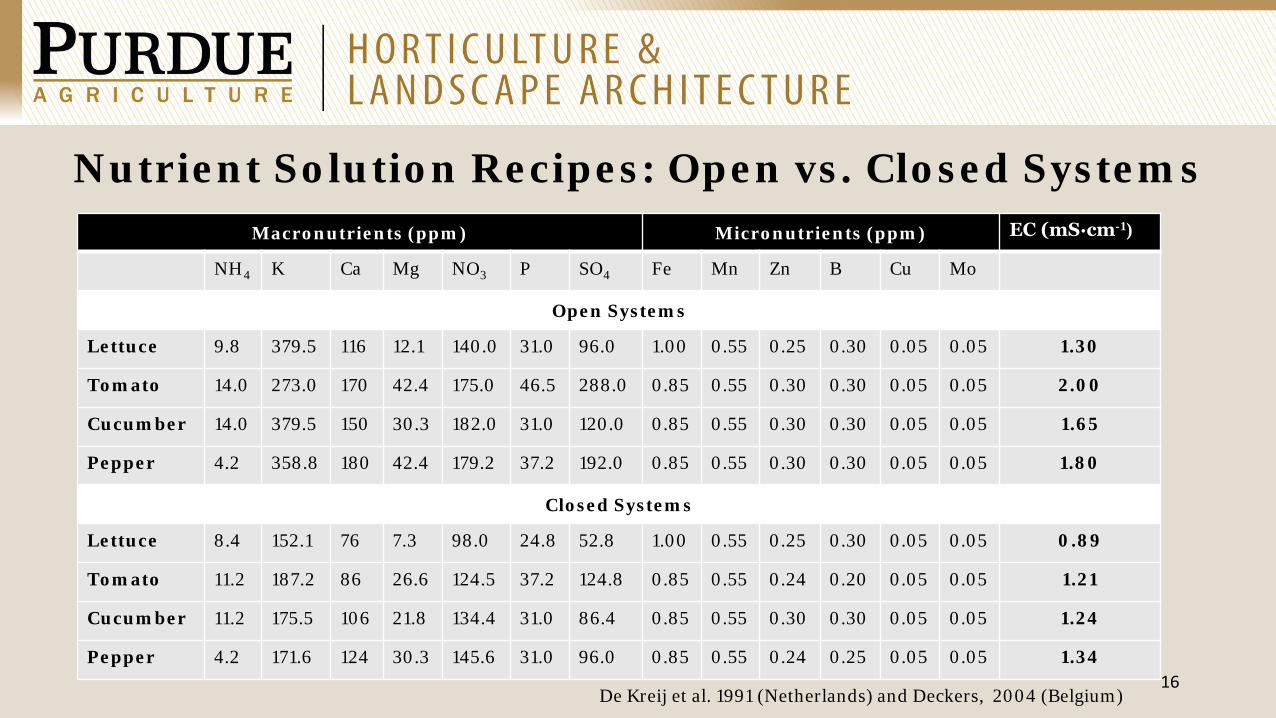
Nutrient Solution Recipes: Open vs. Closed SystemsMacronutrients (ppm) Micronutrients (ppm) EC (mS∙cm-1)
NH4 K Ca Mg NO3 P SO4 Fe Mn Zn B Cu Mo
Open Systems
Lettuce 9.8 379.5 116 12.1 140.0 31.0 96.0 1.00 0.55 0.25 0.30 0.05 0.05 1.30
Tomato 14.0 273.0 170 42.4 175.0 46.5 288.0 0.85 0.55 0.30 0.30 0.05 0.05 2.00
Cucumber 14.0 379.5 150 30.3 182.0 31.0 120.0 0.85 0.55 0.30 0.30 0.05 0.05 1.65
Pepper 4.2 358.8 180 42.4 179.2 37.2 192.0 0.85 0.55 0.30 0.30 0.05 0.05 1.80
Closed Systems
Lettuce 8.4 152.1 76 7.3 98.0 24.8 52.8 1.00 0.55 0.25 0.30 0.05 0.05 0.89
Tomato 11.2 187.2 86 26.6 124.5 37.2 124.8 0.85 0.55 0.24 0.20 0.05 0.05 1.21
Cucumber 11.2 175.5 106 21.8 134.4 31.0 86.4 0.85 0.55 0.30 0.30 0.05 0.05 1.24
Pepper 4.2 171.6 124 30.3 145.6 31.0 96.0 0.85 0.55 0.24 0.25 0.05 0.05 1.34
De Kreij et al. 1991 (Netherlands) and Deckers, 2004 (Belgium)

Compare
17
5-12-26
18
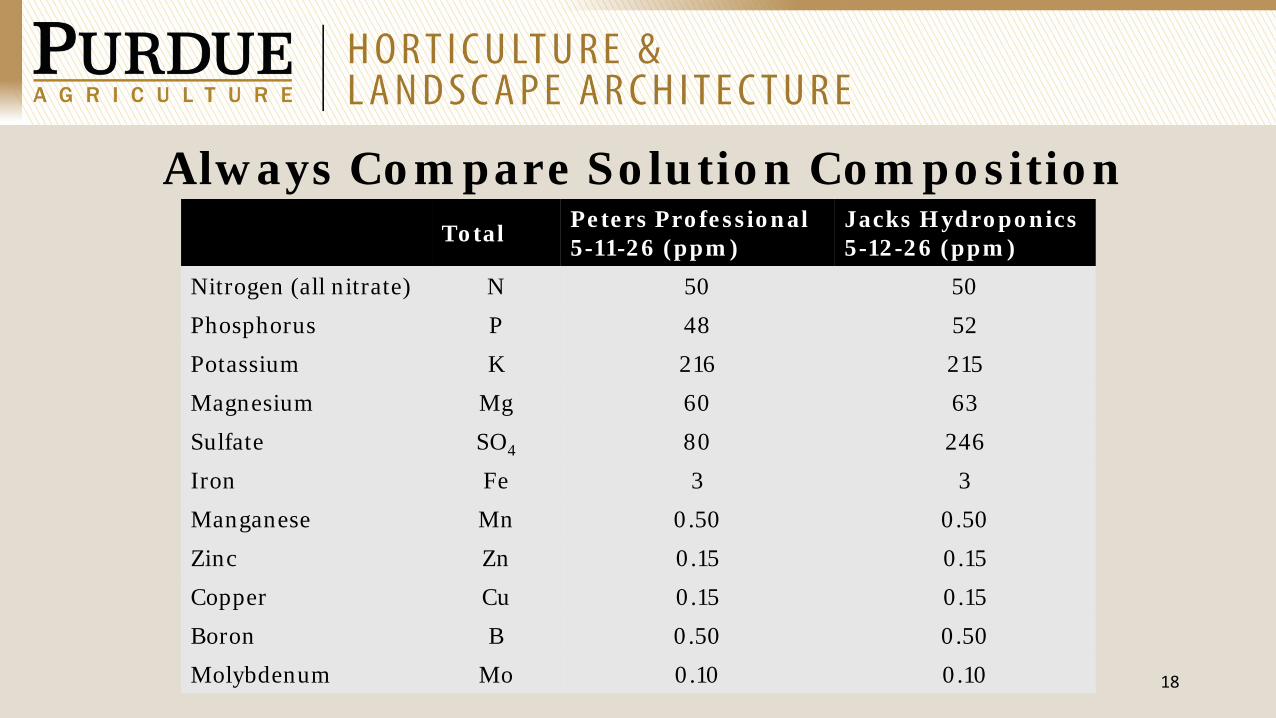
Always Compare Solution CompositionTotal Peters Professional
5-11-26 (ppm)Jacks Hydroponics 5-12-26 (ppm)
Nitrogen (all nitrate) N 50 50
Phosphorus P 48 52
Potassium K 216 215
Magnesium Mg 60 63
Sulfate SO4 80 246
Iron Fe 3 3
Manganese Mn 0.50 0.50
Zinc Zn 0.15 0.15
Copper Cu 0.15 0.15
Boron B 0.50 0.50
Molybdenum Mo 0.10 0.10
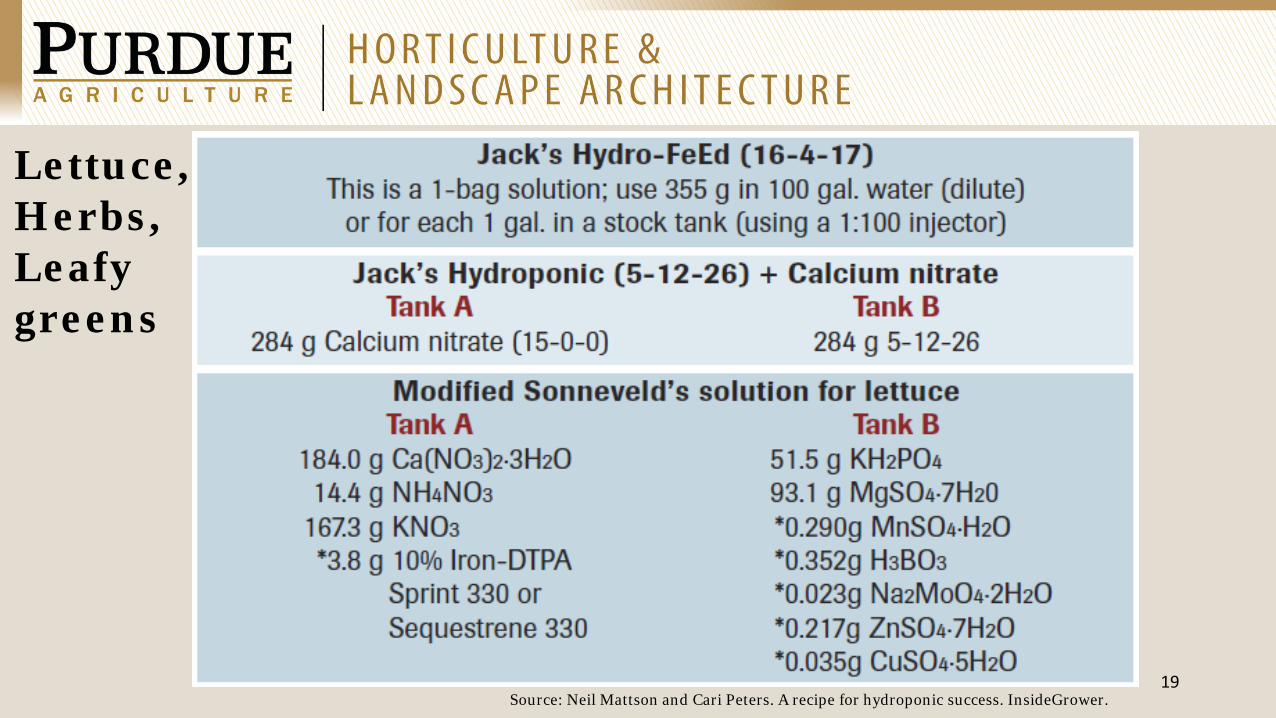
19Source: Neil Mattson and Cari Peters. A recipe for hydroponic success. InsideGrower.
Lettuce,Herbs,Leafy greens
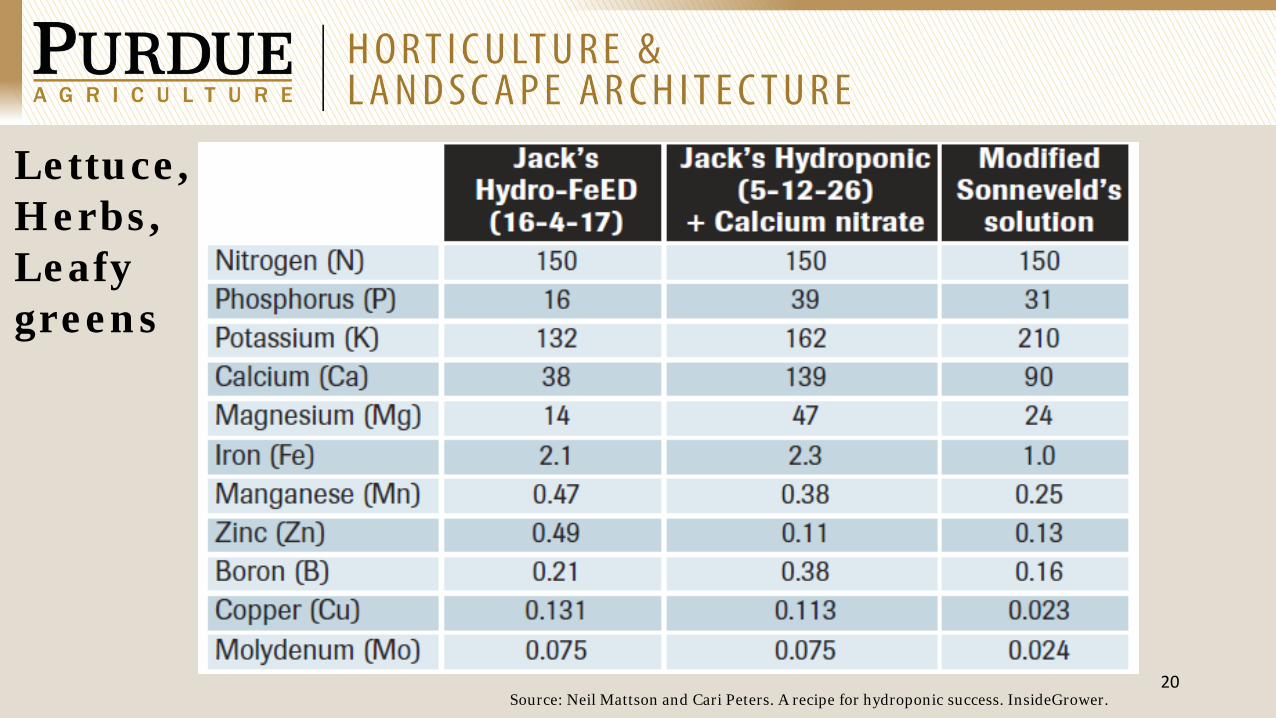
20Source: Neil Mattson and Cari Peters. A recipe for hydroponic success. InsideGrower.
Lettuce,Herbs,Leafy greens
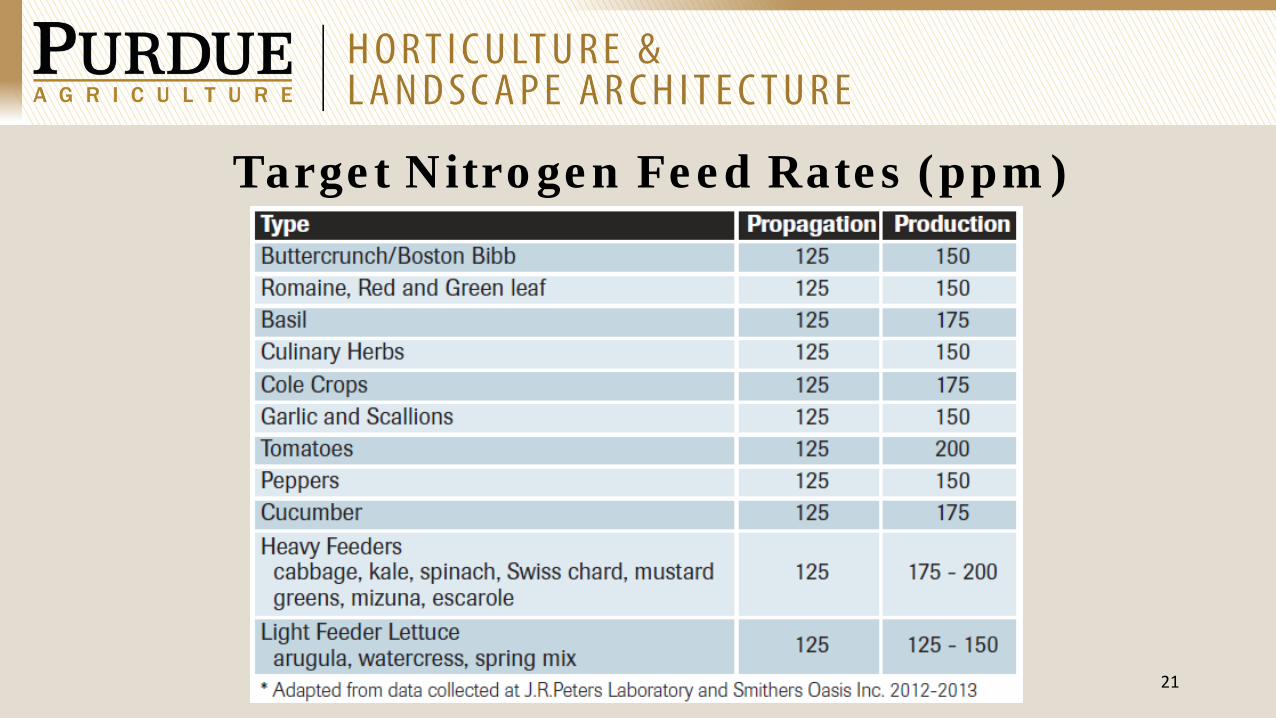
21
Target Nitrogen Feed Rates (ppm)
Solution adjustment - Tomato Nutrition, K:N ratio
22
• Optimal ratio of K to N varies with growth stage
• When the first truss is in flower, the K:N ratio should be 1.2:1, which is the
same K:N requirement as in most plants during the vegetative stage
• This ratio increases to 2:1 as the fruit load on the plant increases, since
about 70% of the potassium absorbed moves into the fruit
• By the time the ninth cluster flowers open, the ratio should be 2.5:1
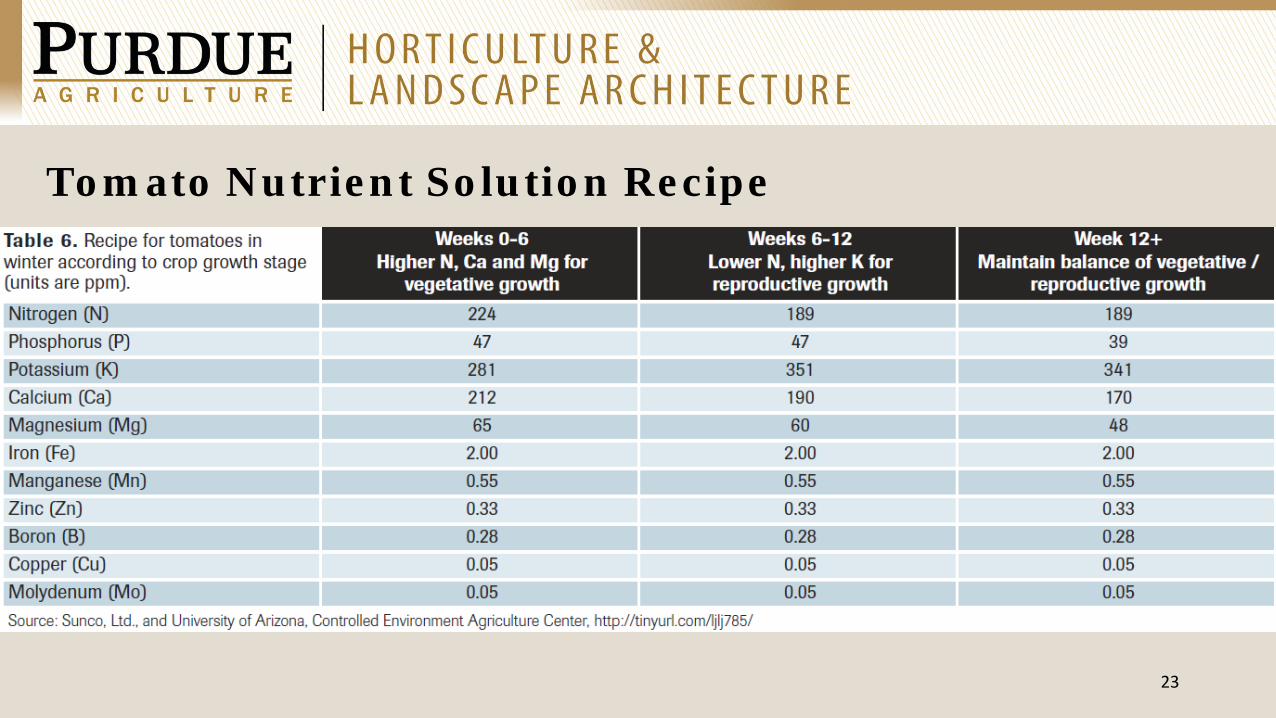
23
Tomato Nutrient Solution Recipe
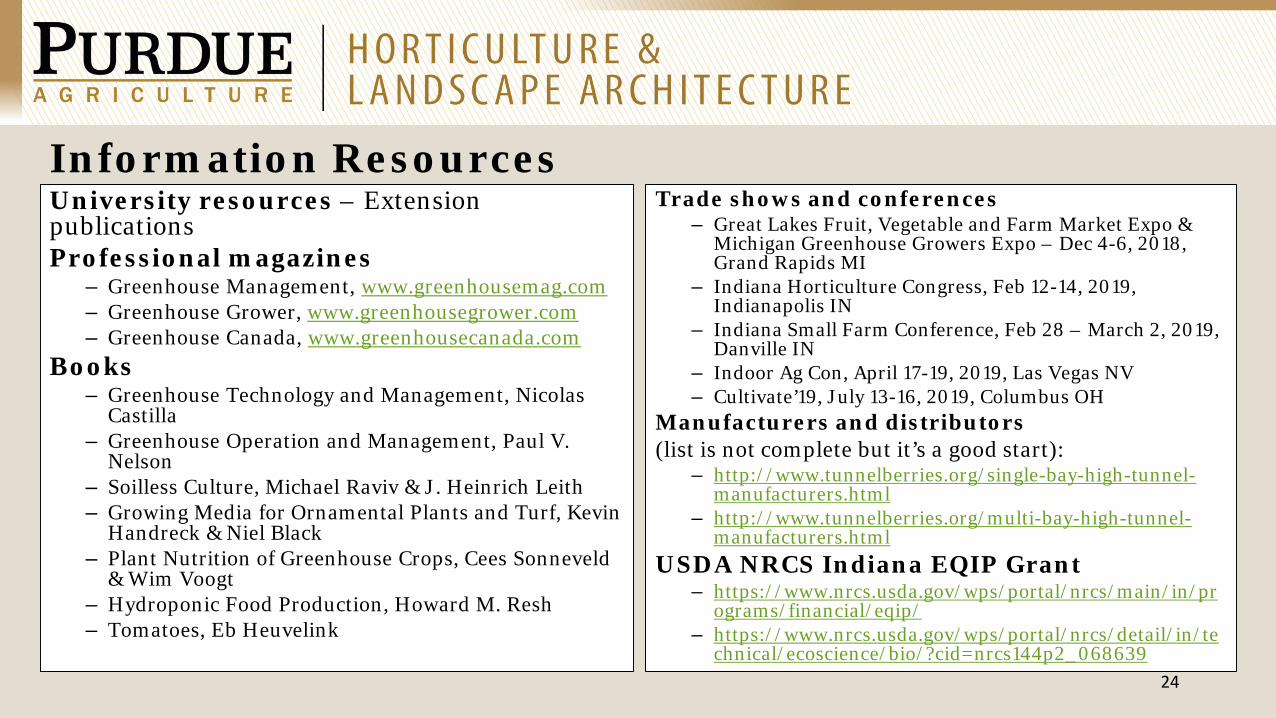
Information Resources
24
University resources – Extension publicationsProfessional magazines
– Greenhouse Management, www.greenhousemag.com– Greenhouse Grower, www.greenhousegrower.com– Greenhouse Canada, www.greenhousecanada.com
Books– Greenhouse Technology and Management, Nicolas
Castilla– Greenhouse Operation and Management, Paul V.
Nelson– Soilless Culture, Michael Raviv & J. Heinrich Leith– Growing Media for Ornamental Plants and Turf, Kevin
Handreck & Niel Black– Plant Nutrition of Greenhouse Crops, Cees Sonneveld
& Wim Voogt– Hydroponic Food Production, Howard M. Resh– Tomatoes, Eb Heuvelink
Trade shows and conferences– Great Lakes Fruit, Vegetable and Farm Market Expo &
Michigan Greenhouse Growers Expo – Dec 4-6, 2018, Grand Rapids MI
– Indiana Horticulture Congress, Feb 12-14, 2019, Indianapolis IN
– Indiana Small Farm Conference, Feb 28 – March 2, 2019, Danville IN
– Indoor Ag Con, April 17-19, 2019, Las Vegas NV– Cultivate’19, July 13-16, 2019, Columbus OH
Manufacturers and distributors(list is not complete but it’s a good start):
– http://www.tunnelberries.org/single-bay-high-tunnel-manufacturers.html
– http://www.tunnelberries.org/multi-bay-high-tunnel-manufacturers.html
USDA NRCS Indiana EQIP Grant– https://www.nrcs.usda.gov/wps/portal/nrcs/main/in/pr
ograms/financial/eqip/– https://www.nrcs.usda.gov/wps/portal/nrcs/detail/in/te
chnical/ecoscience/bio/?cid=nrcs144p2_068639

THANK YOU Questions?Contact details:
Dr. Petrus LangenhovenHorticulture and Hydroponics Crop Specialist
Department of Horticulture and Landscape ArchitecturePurdue UniversityTel. no. 765-496-7955
Email: [email protected]
25