how to search altmetric explorer: an introductory guide for
TRANSCRIPT

How to Search Altmetric Explorer:An Introductory Guide for
Institutions
Altmetric.com | @[email protected]
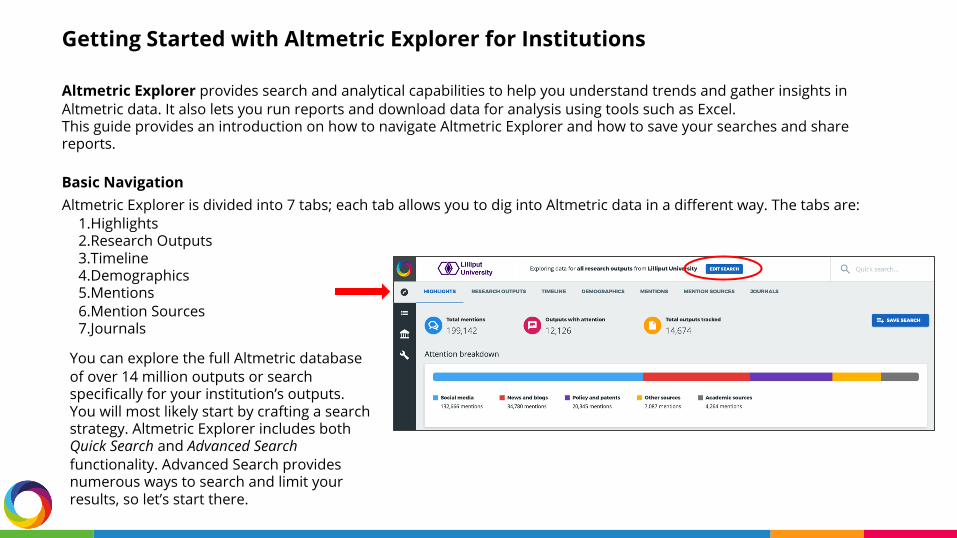
Altmetric Explorer provides search and analytical capabilities to help you understand trends and gather insights in Altmetric data. It also lets you run reports and download data for analysis using tools such as Excel.This guide provides an introduction on how to navigate Altmetric Explorer and how to save your searches and share reports.
Basic NavigationAltmetric Explorer is divided into 7 tabs; each tab allows you to dig into Altmetric data in a different way. The tabs are:
1.Highlights2.Research Outputs3.Timeline4.Demographics5.Mentions6.Mention Sources7.Journals
You can explore the full Altmetric database of over 14 million outputs or search specifically for your institution’s outputs. You will most likely start by crafting a search strategy. Altmetric Explorer includes both Quick Search and Advanced Searchfunctionality. Advanced Search provides numerous ways to search and limit your results, so let’s start there.
Getting Started with Altmetric Explorer for Institutions
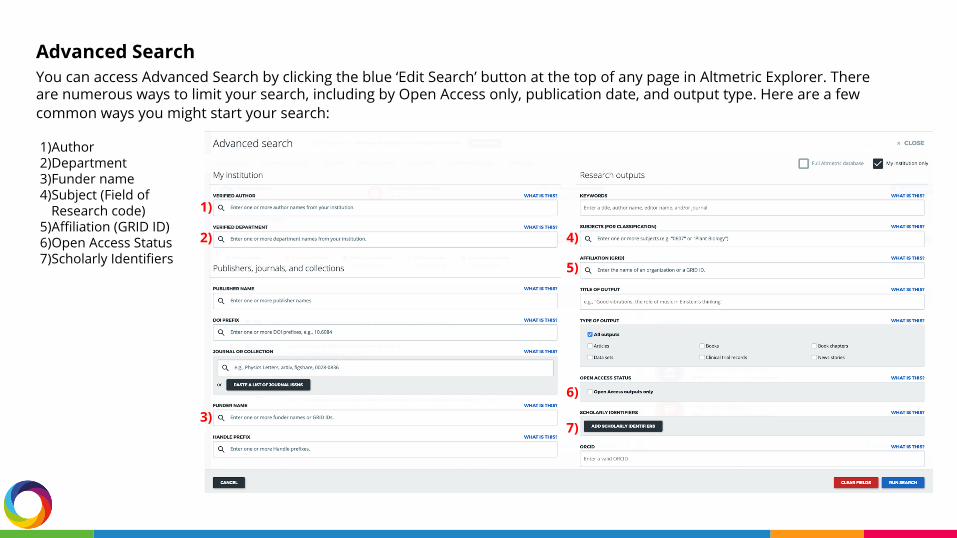
Advanced SearchYou can access Advanced Search by clicking the blue ‘Edit Search’ button at the top of any page in Altmetric Explorer. There are numerous ways to limit your search, including by Open Access only, publication date, and output type. Here are a few common ways you might start your search:
1)Author 2)Department3)Funder name4)Subject (Field of
Research code)5)Affiliation (GRID ID)6)Open Access Status7)Scholarly Identifiers
1)
2)
3)7)
4)
5)
6)
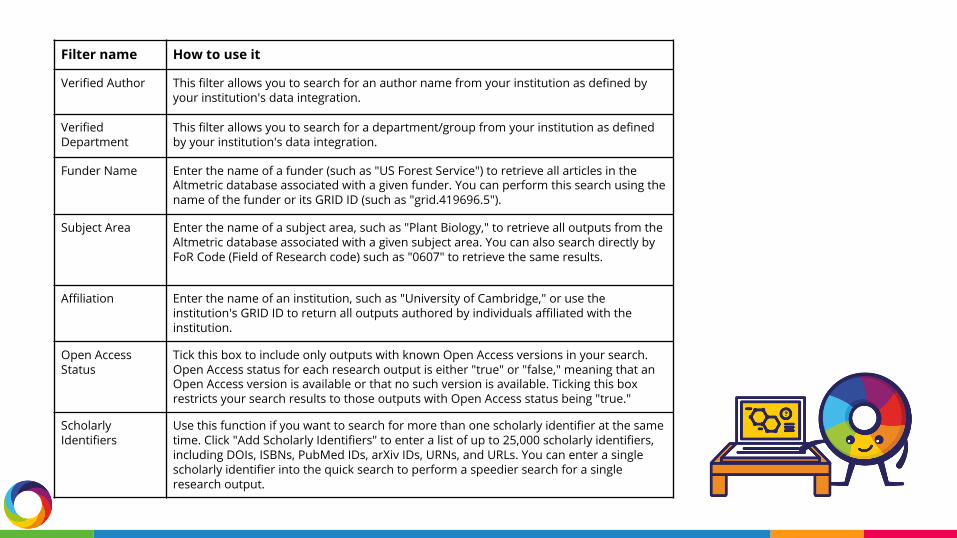
Filter name How to use it
Verified Author This filter allows you to search for an author name from your institution as defined by your institution's data integration.
Verified Department
This filter allows you to search for a department/group from your institution as defined by your institution's data integration.
Funder Name Enter the name of a funder (such as "US Forest Service") to retrieve all articles in the Altmetric database associated with a given funder. You can perform this search using the name of the funder or its GRID ID (such as "grid.419696.5").
Subject Area Enter the name of a subject area, such as "Plant Biology," to retrieve all outputs from the Altmetric database associated with a given subject area. You can also search directly by FoR Code (Field of Research code) such as "0607" to retrieve the same results.
Affiliation Enter the name of an institution, such as "University of Cambridge," or use the institution's GRID ID to return all outputs authored by individuals affiliated with the institution.
Open Access Status
Tick this box to include only outputs with known Open Access versions in your search. Open Access status for each research output is either "true" or "false," meaning that an Open Access version is available or that no such version is available. Ticking this box restricts your search results to those outputs with Open Access status being "true."
Scholarly Identifiers
Use this function if you want to search for more than one scholarly identifier at the same time. Click "Add Scholarly Identifiers" to enter a list of up to 25,000 scholarly identifiers, including DOIs, ISBNs, PubMed IDs, arXiv IDs, URNs, and URLs. You can enter a single scholarly identifier into the quick search to perform a speedier search for a single research output.

Tab 1: HighlightsOnce you have crafted your search strategy, you can begin to dig into the attention by using the different tabs located at the top of the screen.
A summary of outputs and attention is located on the Highlights tab. These numbers will change as you edit your search strategy.Total mentions: total of all mention types, i.e. twitter, news, policy, etc. Outputs with attention: number of outputs tracked by Altmetric that have some form of attentionTotal outputs tracked: overall number of outputs tracked, but not all have attention
This tab provides at-a-glance information, bringing interesting attention to the forefront. Divided into ‘data blocks’ with colorful visualizations, the highlights tab provides summary information with links to learn more. For example, you can use the ‘Top journals & collections’ data block to understand which journals in your search results get the most attention overall.
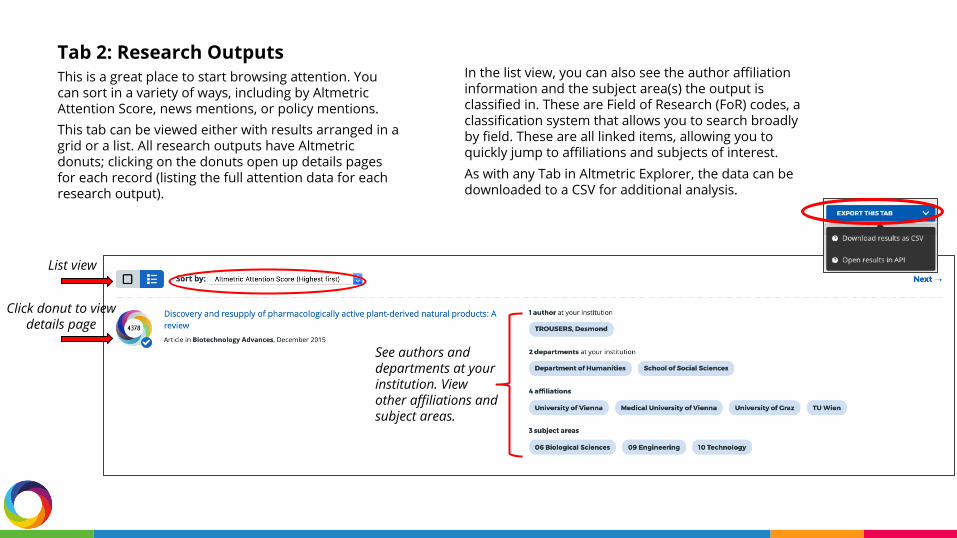
Tab 2: Research OutputsThis is a great place to start browsing attention. You can sort in a variety of ways, including by Altmetric Attention Score, news mentions, or policy mentions.This tab can be viewed either with results arranged in a grid or a list. All research outputs have Altmetric donuts; clicking on the donuts open up details pages for each record (listing the full attention data for each research output).
List view
See authors and departments at your institution. View other affiliations and subject areas.
Click donut to view details page
In the list view, you can also see the author affiliation information and the subject area(s) the output is classified in. These are Field of Research (FoR) codes, a classification system that allows you to search broadly by field. These are all linked items, allowing you to quickly jump to affiliations and subjects of interest. As with any Tab in Altmetric Explorer, the data can be downloaded to a CSV for additional analysis.
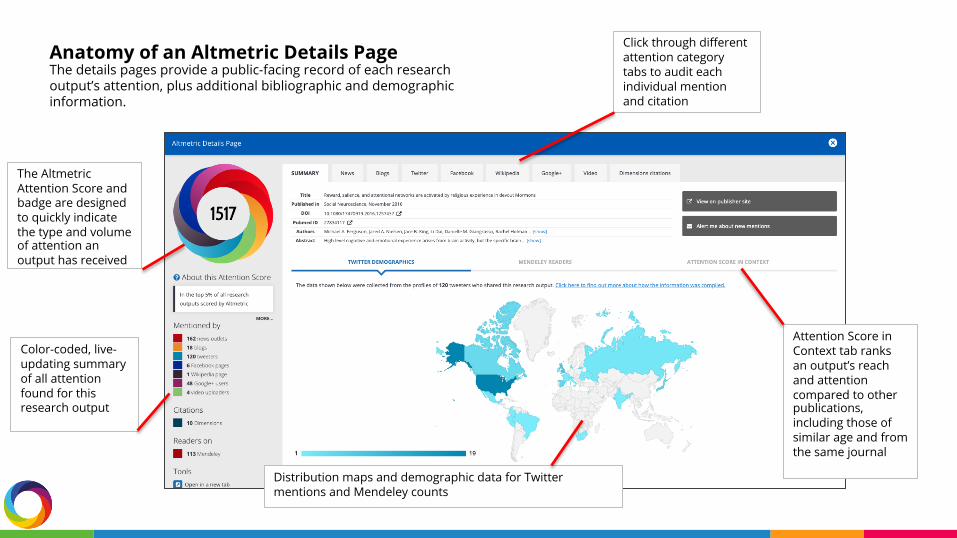
Anatomy of an Altmetric Details PageThe details pages provide a public-facing record of each research output’s attention, plus additional bibliographic and demographic information.
Attention Score in Context tab ranks an output’s reach and attention compared to other publications, including those of similar age and from the same journal
Click through different attention category tabs to audit each individual mention and citation
Color-coded, live-updating summary of all attention found for this research output
Distribution maps and demographic data for Twitter mentions and Mendeley counts
The Altmetric Attention Score and badge are designed to quickly indicate the type and volume of attention an output has received
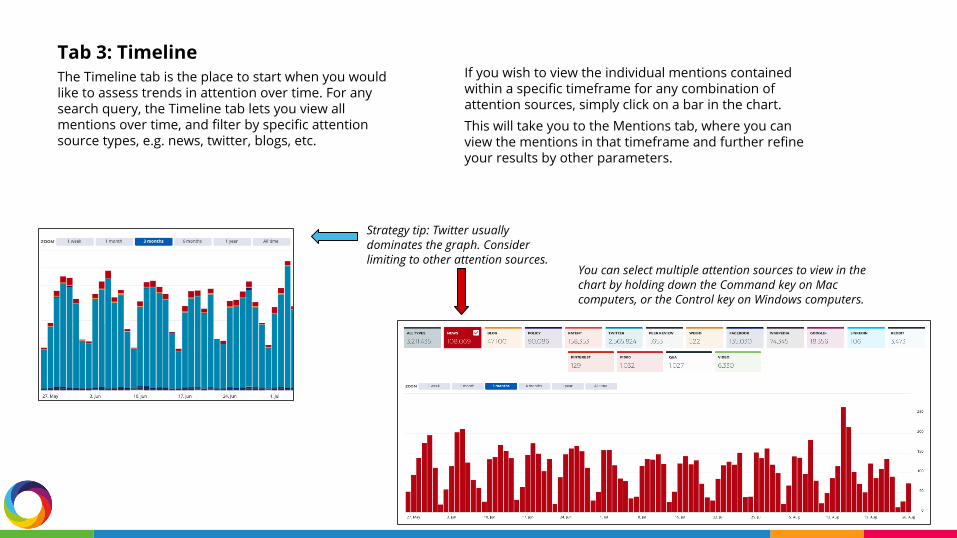
Tab 3: TimelineThe Timeline tab is the place to start when you would like to assess trends in attention over time. For any search query, the Timeline tab lets you view all mentions over time, and filter by specific attention source types, e.g. news, twitter, blogs, etc.
If you wish to view the individual mentions contained within a specific timeframe for any combination of attention sources, simply click on a bar in the chart. This will take you to the Mentions tab, where you can view the mentions in that timeframe and further refine your results by other parameters.
Strategy tip: Twitter usually dominates the graph. Consider limiting to other attention sources.
You can select multiple attention sources to view in the chart by holding down the Command key on Mac computers, or the Control key on Windows computers.

Tab 4: DemographicsIn the Demographics tab, you can see heatmaps of geolocations for four attention sources: Twitter, Facebook, News, and Policy. Each map shows the spread of attention around the world, applied for any search query. Counts for the number of mentions and mention authors (or outlets) by country are shown for each of the four attention sources.
If you click on the name of a country in the table or the country itself on the map, you will be taken to the Mentions tab, where you can view all of the mentions originating from that country in the selected attention source.
10,699 Facebook posts about this content by 4,392 unique pages in 75 countries
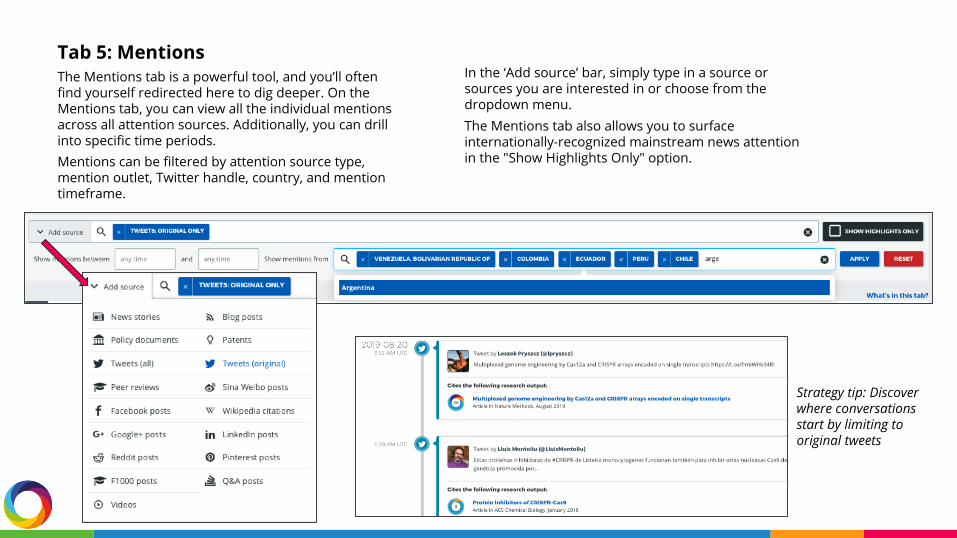
Tab 5: MentionsThe Mentions tab is a powerful tool, and you’ll often find yourself redirected here to dig deeper. On the Mentions tab, you can view all the individual mentions across all attention sources. Additionally, you can drill into specific time periods.Mentions can be filtered by attention source type, mention outlet, Twitter handle, country, and mention timeframe.
In the ‘Add source’ bar, simply type in a source or sources you are interested in or choose from the dropdown menu. The Mentions tab also allows you to surface internationally-recognized mainstream news attention in the "Show Highlights Only" option.
Strategy tip: Discover where conversations start by limiting to original tweets
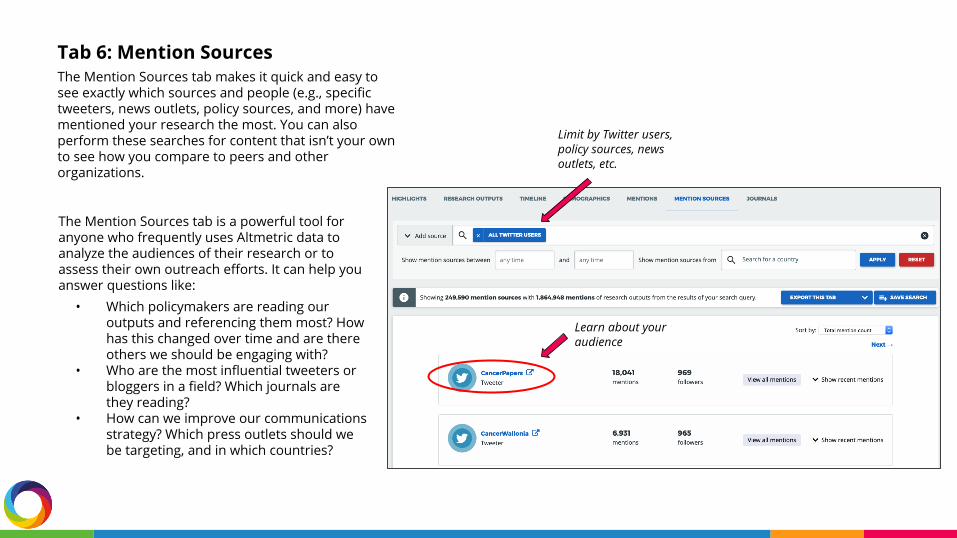
Tab 6: Mention SourcesThe Mention Sources tab makes it quick and easy to see exactly which sources and people (e.g., specific tweeters, news outlets, policy sources, and more) have mentioned your research the most. You can also perform these searches for content that isn’t your own to see how you compare to peers and other organizations.
The Mention Sources tab is a powerful tool for anyone who frequently uses Altmetric data to analyze the audiences of their research or to assess their own outreach efforts. It can help you answer questions like:
• Which policymakers are reading our outputs and referencing them most? How has this changed over time and are there others we should be engaging with?
• Who are the most influential tweeters or bloggers in a field? Which journals are they reading?
• How can we improve our communications strategy? Which press outlets should we be targeting, and in which countries?
Limit by Twitter users, policy sources, news outlets, etc.
Learn about your audience

Tab 7: JournalsThe Journals tab is a comparison table that displays all the total mention counts for different Altmetric attention sources, aggregated by journal.For example, if you limit your search to outputs published by your Oncology Department, you’ll probably see that most of the journals in the table are cancer related.
Within the Journals tab, you can sort the entire table by any attention source by clicking on its column header: for example, you can sort the journals by total number of mentions, number of Twitter mentions, number of policy mentions, and so on. With this table, you can easily see which journals receive attention across specific sources.

Click the blue ‘Save Search’ button on any screen to add your query to the saved search dashboard.
Saving Searches
Access saved searches via the side toolbar
Click on any saved search to return to the results in the Explorer
Set any search as your default view when you login by checking the corresponding box to the left
Select to receive daily, weekly, and/or monthly email reports based upon your searches
Edit your search name via the green pencil icon or delete your search with the red X button
The blue document icon opens the custom-report builder for that search set
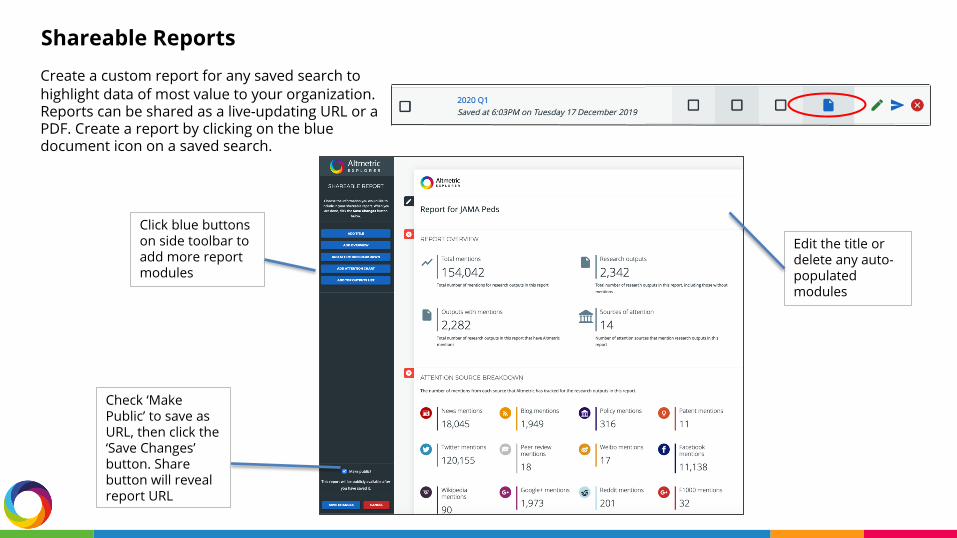
Create a custom report for any saved search to highlight data of most value to your organization. Reports can be shared as a live-updating URL or a PDF. Create a report by clicking on the blue document icon on a saved search.
Shareable Reports
Click blue buttons on side toolbar to add more report modules
Check ‘Make Public’ to save as URL, then click the ‘Save Changes’ button. Share button will reveal report URL
Edit the title or delete any auto-populated modules
Try it out!1. Identify the top three ‘most mentioned by’ sources for any search set via the Highlights
tab. Explore the results further in the Mention Sources tab to see who is engaging most frequently with this research.
1. Find the attention for a set of outputs. Search by department, author, or upload a list of identifiers, e.g. DOIs, via the Advanced Search. Try sorting your results by most policy, news, or patent mentions in the Research Outputs tab. Export your results as a CSV for further analysis.
1. Locate mentions from specific sources. Visit the Mentions tab to filter the mentions by a source that is of value to your stakeholders (eg, New York Times, key influencer on Twitter, arXiver blog)
1. Save your search and set up an email alert to receive regular notifications on the latest activity. Click ‘Save Search’ button and navigate to the saved search dashboard on the left menu panel, selecting a daily, weekly, or monthly report – remember to login to your account first!
1. Create a custom report to share. In the saved search dashboard click document icon to open up the custom report builder pop-out and edit each field to meet your needs. Save and share as live-updating URL or PDF.