how to promote customer loyalty of chinese telecom …828356/fulltext01.pdf · 2015-06-30 · how...
TRANSCRIPT

How to Promote Customer Loyalty of Chinese Mobile
Telecom Operator: Case Study of China Mobile
Master Thesis of Business Administration
Yi Hao,Xiaoqin Yuan, Weiqing Zhang
SUPERVISOR
Britt Aronsson
Ronneby
June 2009

Abstract Customer loyalty has been investigated in years, and its importance to corporate is understood by managers. The purpose of this paper is to find out what kinds of specific and concrete operational factors have an important impact on Chinese mobile telecom customer loyalty. Firstly, a model was established to represent the relationship between customer loyalty and its influencing factors (customer satisfaction, perceived quality, customer value, switching cost and corporate image). 11 specific and concrete operational factors were found according to Chinese mobile telecom industry which were never been studied by the pre-researchers. Secondly, a survey of questionnaire has been conducted which help to found out that the 9 factors (call quality, coverage of area, SMS quality, the convenience and reliability of Inquiring phone fee system, service quality of service center and hotline, rating price of given quality, customer’s worry of troubles after change cell phone number, social responsibility, advertisements about corporate image) have an important impact on customer loyalty on Chinese mobile telecom industry. Thirdly, separating these 9 factors into 3 groups through investigate the performance of customer loyalty in China Mobile. At last, some recommendations were given to China Mobile
Key words: customer loyalty; customer satisfaction; perceived quality;
customer value; switching cost; corporate image; Chinese mobile telecom industry, China Mobile
ii

CONTENTS
CHAPTER 1 INTRODUCTION ...................................................................................................... 1
1.1 BACKGROUND OF THE RESEARCH ............................................................................................ 1 1.2 THE RESEARCH PROBLEM DISCUSSION ..................................................................................... 2
1.2.1 The characteristics of Chinese mobile telecom market ...................................................... 2 1.2.2 The situation of current Chinese mobile telecom industry. ................................................ 3 1.2.3 The situation of China Mobile........................................................................................... 5
1.3 RESEARCH PURPOSE ................................................................................................................ 6 1.4 LIMITATION ............................................................................................................................. 6
1.4.1 Finiteness of interviewees.................................................................................................. 6 1.4.2 Finiteness of sample .......................................................................................................... 6
1.5 OVERVIEW OF THE THESIS ....................................................................................................... 6
CHAPTER 2 THEORY BACKGROUND ....................................................................................... 8
2.1 CUSTOMER LOYALTY ............................................................................................................... 8 2.1.1 The concept of customer loyalty ........................................................................................ 8 2.1.2 The antecedents of customer loyalty .................................................................................. 9 2.1.3 Does customer loyalty really work? ................................................................................. 10 2.1.4 New trend of the customer loyalty ................................................................................ 11
2.2 CUSTOMER SATISFACTION ...................................................................................................... 12 2.2.1 The definition of customer satisfaction ............................................................................ 12 2.2.2 The definition of perceived Quality of products and service ............................................. 13 2.2.3 The definition of perceived Customer value ..................................................................... 13 2.2.4 The relationship among perceived quality, perceived value and customer satisfaction, customer loyalty ....................................................................................................................... 14
2.3 SWITCHING COST ................................................................................................................... 15 2.3.1 Definition and typology ................................................................................................... 15 2.3.2 Switching cost and customer loyalty ................................................................................ 16
2.4 CORPORATE IMAGE ................................................................................................................ 16 2.4.1 The definition of corporate image ................................................................................... 16 2.4.2 Corporate image and customer loyalty ............................................................................ 17
2.5 THE INTEGRATIVE FRAMEWORK OF THEORY ........................................................................ 17
CHAPTER 3 THE HYPOTHESES OF CUSTOMER LOYALTY ................................................ 21
3.1 HYPOTHESIS OF CUSTOMER PERCEIVED QUALITY .................................................................. 21 3.2 HYPOTHESIS OF CUSTOMER PERCEIVED VALUE ...................................................................... 23 3.3 HYPOTHESIS OF SWITCHING COST .......................................................................................... 24 3.4 HYPOTHESIS OF CORPORATE IMAGE....................................................................................... 26
CHAPTER 4 RESEARCH QUESTION AND METHODOLOGY ............................................... 29
4.1 RESEARCH PURPOSE AND RESEARCH QUESTION ..................................................................... 29 4.2. RESEARCH METHODOLOGY .................................................................................................. 29
4.2.1 Definition and measurement of research hypotheses ....................................................... 29
iii

4.2.2 Data collection ................................................................................................................ 31 4.2.3 Reliability & validity ........................................................................................................ 32
4.2.3.1 Reliability ............................................................................................................................... 32 4.2.3.2 Validity ................................................................................................................................... 33
4.2.4 Process of data analysis................................................................................................... 33 4.2.5 Analyzing method discussion .......................................................................................... 34
CHAPTER 5 DATA ANALYSIS ................................................................................................... 36
5.1 FINDINGS ................................................................................................................................ 36 5. 2 USING EXPERIENCE AND GENDER’S INFLUENCE ..................................................................... 39
5.2.1 Using experience’s influence .......................................................................................... 39 5.2.2 Gender’s influence .......................................................................................................... 41
5.3 DISCUSSION ABOUT THE CASE ................................................................................................ 42 5.3.1 Performance of China Mobile ......................................................................................... 42 5.3.2 Discussion ....................................................................................................................... 43
CHAPTER 6 CONCLUSION AND FURTHER RESEARCH ...................................................... 45
6.1 CONCLUSION .......................................................................................................................... 45 6.3 LIMITATIONS AND FURTHER RESEARCH .................................................................................. 47
APPENDIX ..................................................................................................................................... 48
REFERENCE ................................................................................................................................. 52
iv

Chapter 1 Introduction
1.1 Background of the research With the increasing competition in the market, customer loyalty has become a decisive factor in the long-term business profits. High customer loyalty is the high enter- barriers for the competitor to enter the market. Customer loyalty contributes to reduce marketing costs. The companies have to invest quite much time and money when they attract new customers, this process always go through a long time period associated with uncertainty risks. The number of loyal customers as a sign of market share is more meaningful and significant than the number of customers. More loyal customers mean high profits. Loyal customers will continue to purchase or receive the product or service from the same enterprises, and willing to pay the higher prices for the quality products and first-class services, thereby increasing sales revenue and total. So at this point many enterprise managers focus on marketing management aspects to improve customer loyalty in order to gain the competitive advantage in the fierce competition. The importance of the customer loyalty has been identified by many researchers and academician in past years. So does in the mobile telecommunication industry in China. The customer loyalty is also important and essential. Nowadays as the mobile telecommunication market is being saturated, the growth rate won't be higher than some time ago. The situation makes mobile telecommunication companies not only to promote their service quality, but also change their marketing core strategy to holding their existing customers by enhancing and optimizing the customer loyalty. (Long-Yi Lin; Jen-Chun Chien,2004) Telecommunication industry is a very typical industry, customer's importance to enterprises, and how to attract, develop and maintain customers has became more and more important in the sharp internationalize mobile telecommunication competitions. The competition in mobile communication industry is becoming more and more fiercely. The issue how to improve customer loyalty is a very important issue for mobile communication operators. Hereby, the customer loyalty is playing a significant role in the telecommunication market competition.
It is World Telecommunication Day (WTD) to World Information Society Day (WISD) today. Customer loyalty is something that is vital to telecom operators, or any other businesses fighting for their survival. Research has shown the importance of loyal customers in telecom sector.
1

The typical company gets 65% of its business from its existing customers. It costs 5 times more to find a new customer than to keep an existing
customer happy. It takes 12 good service experiences to overcome a single bad one. 7 out of 10 customers who switch to the competition do so because of poor
service 91% of unhappy customers won’t but again from the company that
displeased them And unhappy customers will not only defect, they will grumble to 9 of their
friends.
Customer loyalty is one of the most dominated factors which drive the profits incoming of the operators in the telecom industry (Ramneck kaur, Preety Menon, 2009).
1.2 The research problem discussion What kind of factors that have an impact on customer loyalty have been researched by other countries such as South Korea, Germany, and France and so on. Gerpott (2001) considers the network quality, which is reflected in excellent indoor and outdoor coverage and in the clarity of voice reproduction without any connection break-downs; the price paid for obtaining access to and using the network; the quality of the exchange of information between customer and supplier (1) in response to customer (telephone) enquiries and (2) in the course of interactive activities initiated by the network operator (e.g., presentation of an invoice) have an important impact on customer loyalty in Germany market. Lee (2001) thinks pricing, area coverage, clarity of sound, access to provider, precision of billing service and perceived difficulty to switch are the main factors which have important impact on customer loyalty in France. Ahn (2006) considers that call drop rate (percentage of abnormally terminated calls), the number of complaints, monthly billed amounts and customers with a non-use or suspended status are positively associated with the probability of customer churn in South Korea mobile telecom industry. From the above literature review, we find that different countries have different factors that affect their customer loyalty in the mobile telecom market. Comparing with the other mobile telecom market situation, Chinese market is a different market. 1.2.1 The characteristics of Chinese mobile telecom market The largest and profitable market Chinese mobile telecom industry is a large and profitable industry. There are more than 600 million mobile subscribers in China. In 2008 the total revenue of
2

telecommunication industry is 800 billion RMB1, total revenue of Mobile sector is 448.5 billion RMB and revenue per subscriber is 700 RMB one year. (Wang 2009) No foreign-owned operators in Chinese mobile telecom industry. Chinese telecommunication is a national priority sector, wholly foreign-owned operators are not allowed to invest in this industry in China but equipment vendors are allowed to invest. Alcatel-Lucent, Cisco, Nortel and Siemens are the main international network equipment providers. Foreign investors, from USA, Sweden, Finland, France, Japan, Korea, Canada, UK and so on avoid the banning regulation by form joint venture with the local operators to access into this big market. (Wang 2009) Mobile number portability (MNP) does not exist in Chinese market. Mobile number portability (MNP) is the ability that enables mobile telephone users to retain their mobile telephone numbers when changing operators. Many countries are MNP countries for example, USA, Sweden, Denmark, Germany, Korea, UK, Turkey etc. But till now in the national wide, China does not have MNP, so if a subscriber wants to change from one operator to another, he or she has to worry about a plenty of trouble after using a new cell phone number, like to inform every contact, miss a lot of phone calls and so on. Majority consumers buy handsets by themselves. Before 3G, Global System for Mobile Communications (GSM) and Code Division Multiple Access (CDMA) are the two main network technologies. The CDMA operators require proprietary handsets that are linked to one carrier only. But for GSM, Subscriber Identity Module (SIM) card itself is tied to the network of an operator, rather than an actual phone. So operators, who use CDMA, always sell mobile service together with a handset while business model of operators who use GSM is to sell SIM card to their customers. The majority subscribers in China were using GSM, that is to say, operators only sell SIM card to their customers and their customers buy cell phone separately. So the willing of switching cell phone would not be an issue that makes customers change operators as long as they are in GSM network. Chinese mobile telecom market is different market which has a huge number of subscribers and all the mobile operators are state-owned companies. Like we said before different countries have different factors affect their country’s customer loyalty in the mobile telecom market. China as a large and different country has different factors affect the customer loyalty. 1.2.2 The situation of current Chinese mobile telecom industry. There are three mobile operators in Chinese mobile telecom industry; they are
1 RMB: China’s currency. 1RMB= 1.17kr (the exchange rate on 2009-06-23)
3

China Mobile, China Unicom and China Telecom. These operators not only supply the basic mobile voice services but also value-added services such as data, IP telephone and multimedia.
China Mobile: It was published in 2000 and now, it is Chinese largest mobile operator which has about 450 million mobile users. China Mobile only operates GSM2 network. China Unicom: It was published in 1994, and now it has 133 million GSM subscribers in Chinese mobile telecom market, China Telecom: It is a new mobile telecom operator in Chinese market which mainly focuses on fixed-line communication and Internet before 2008. It has 2.8 million CDMA3 subscribers in Chinese mobile telecom market which was bought from China Unicom.
On Jan. 7th 2009, Chinese government issued three 3G issues to 3 operators. China Mobile got TD-SCDMA4 (Time Division - Synchronous CDMA), China Unicom got WCDMA 5 (Wideband CDMA), and China Telecom got CDMA20006 (CDMA Multi-Carrier). Chinese telecom industry came into the 3G era. All the three operators are government funded and are regulated by the Ministry of Information Industry (MII), but being controlled by the same department does not mean monopolistic. The competition between the three is serious.
2 GSM (Global System for Mobile communications) is the most popular standard for mobile phones in the world. There is 80% of the global mobile market uses the standard. 3 CDMA (Code division multiple access) is a channel access method utilized by various radio communication technologies 4 TD-SCDMA (Time Division-Synchronous Code Division Multiple Access) is a channel access method that utilizes synchronous spread spectrum across multiple time slots. It was R&D by Chinese government. 5 W-CDMA (Wideband Code Division Multiple Access) is an air interface found in 3G mobile telecommunications networks. W-CDMA is the higher speed transmission protocol used in the Japanese FOMA system and in the UMTS system, a third generation follow-on to the 2G GSM networks deployed worldwide. HSDPA (High-Speed Downlink Packet Access) is an evolution and improvement on W-CDMA 6 CDMA2000 is a hybrid 2.5G / 3G technology of mobile telecommunications standards that use CDMA, a multiple access scheme for digital radio, to send voice, data, and signalling data (such as a dialed telephone number) between mobile phones and cell sites. CDMA2000 1xRTT, CDMA2000 EV-DO are approved radio interfaces of CDMA2000 standards. CDMA2000 is considered a 2.5G technology in 1xRTT and a 3G technology in EVDO.
4

1.2.3 The situation of China Mobile China Mobile dominated the Mobile telecom industry; it was officially established on April 20th, 2000 and its registered capital is 51.8 billion RMB yuan and assets of over 800 billion RMB yuan. It fully holds the equity of China Mobile (HK) Group Limited. China Mobile Limited, of which China Mobile (HK) Group Limited is the major shareholder, set wholly-owned subsidiaries in 31 provinces (autonomous regions and municipalities directly under the central government) in China and went public in Hong Kong and New York Stock Exchanges. Currently, in terms of its market value, China Mobile Limited is the largest among all the overseas listed Chinese companies and among all the telecom carriers in Asia. China Mobile operates not only basic mobile voice services but also value-added services such as data, IP telephone and multimedia. It has the right to operate Internet services and the international gateways, reputed for its brands like GOTOne, Easy-own and M-Zone. But after the recombination, the situation seems to be changed. China Mobile is gradually losing his advantages. The advantages of China Mobile are that it has the largest number of subscriber and is the most profitable mobile operators in China. After the recombination, China Mobile has largest number of mobile users in Chinese mobile telecom industry. According to the companies’ performance data on 2007, China Mobile was the most profitable enterprise, China Mobile Net Profit is about 87.063 billion RMB. While China Telecom net profit is about 23.702 billion RMB (most of Telecom’s income is come from fixed-line communications and internet) and China Unicom net profit is about 9.3 billion RMB The challenges for Chinese telecommunication industry After the issue of 3G licenses, the situation seemed to be changed. Compared with W-CDMA, CDMA2000 standards which already been used about 10 years, TD standard still young, it’s the first time to be commercialized and still exist some problems. During the commercial test, the main problem is the signal instability. When you surf the internet through the mobile phone, the situation like offline is often happened and the speed of internet is not very good. Of course this is not a serious technical problem. W-CDMA and CDMA 2000 standards also face to the same problems at the early commercial stage. The problems will be solved with the mature of technology. China Mobile faces to another problem, that the terminal devices designed for TD-CDMA are much less than for WCDMA and CDMA-2000. Till now Nokia, and SonyEricsson do not have plans to produce cell phones for TD-CDMA, so terminal devices will be a bottleneck for this standard and its operator. China Unicom can take advantage of the standard issue because it has wider choices of equipment
5

and handsets and more developed technology China Mobile will meet more challenges compared with the other two operators. How to keep the customers seems to be very important for China Mobile. China Mobile as the largest (the largest number of users) and most profitably mobile operator in Chinese mobile telecom industry will take a young and still immature 3G technology in the telecom new era. How to keep the customers and get loyal customers are especially important for China Mobile. So we choose China Mobile as our study case.
1.3 Research purpose The purpose of this thesis is to find out what kinds of specific and concrete operational factors have an important impact on Chinese mobile telecom customer loyalty.
1.4 Limitation 1.4.1 Finiteness of interviewees In our study we only choose China Mobile’s customers as our interviewees. Because we think firstly China Telecom only have 2.8 million subscribers which is much lesser than China Unicom (133 million) and China Mobile (450 million). So its customers will not have a great impact on Chinese mobile industry customers’ loyalty. Secondly China Mobile and China Unicom have the same customer groups, so there is no difference between them. Thirdly, we take China Mobile as our study case, a survey of their performance from 9 perspectives which have important impact on customer loyalty has been conducted. So we decide to interviewing China Mobile’s customers is much easier for our study. But it may have some difference among these three operators’ subscribers. Most of our interviewees are from young generation (less than 35 years old); their opinion is a little different with the elders (more than 35 years old subscribers). 1.4.2 Finiteness of sample As we said before, China has more than 600 million mobile users, it’s really need a large sample to test which factors really have important impact on customer loyalty in mobile industry. Due to the limitation of time and energy, we only get 99 valid answers which cannot really find out the influential factors in Chinese mobile telecom industry.
1.5 Overview of the thesis In chapter 2, we design a model to analyze the antecedents of customer loyalty. This model is based on ECSI (European Customer Satisfaction Index, 1999).
6

In this paper, customer loyalty has been defined from two perspectives: (1) re-purchasing the same brand products; (2) positive word of mouth. Customer satisfaction (Amine, A., 1998; Oliver, 1999; Butcher et al., 2001; Li Liu, 2008), switching cost and corporate image have an important impact on customer loyalty. In chapter 3, we set 11 hypotheses from these 3 antecedents of loyalty. The hypotheses based on specific and concrete operational aspects. They are: call quality (H1), coverage of area (H2), SMS quality (H3), network quality (H4), the convenience and reliability of Inquiring phone fee system (H5), service quality of service center and hotline (H6), rating price of given quality (H7), score accumulation and bonus (H8), customer’s worry of troubles after change cell phone number (H9), advertisements about corporate image (H10), social responsibility (H11). In chapter 4, we use questionnaires to get the first-hand data. The questionnaire is conducted with the totally numbers of 27 (2+12+13) questions according with our research purpose. It consists by 3 parts: background of the interviewees (gender and the duration to been the customer of an operator); the importance of the factors on customer loyalty (11 hypotheses); the performance of China Mobile on these perspectives. Our questionnaire was conducted online using website called Askform. In chapter 5, we calculate “Mean”, “Std. Deviation” of 11 hypotheses through the SPSS 16.0. We accept the hypotheses on the basis of mean are no less than 3 and refuse the hypotheses which mean are less than 3. That is to say if the mean of a hypothesis is less than 3, we think the factor doesn’t have a important impact on customer loyalty. In our paper, we find H4 and H8 are not have important impact on Chinese mobile telecom customers’ loyalty. Based on the performance of China Mobile, we give some recommendations to them. In chapter 6, we give a conclusion and some limitations of our thesis.
7

Chapter 2 Theory Background
2.1 Customer Loyalty 2.1.1 The concept of customer loyalty Customer loyalty has been studied both in the academic field and real business world for years. To keep a long-term relation with their customers is one of the most important goals of many companies in the modern business world. The cost to keep existing customers is much cheaper than obtaining new customers. Rosenberg and Czepiel indicated that expense of keeping an existing customer is the less than one sixth of winning a new customer. (Rosenberg, L., Czepiel, J.A. 1984) Customer loyalty now is one of the key factors can help a company win long-term success (Andres Kuusik 2007). Customer loyalty can be classified into proactive loyalty and situational loyalty. Oliver suggested that proactive loyalty occurs when a consumer frequently buys a brand and settles for no other substitute while situational loyalty exists when the buyer purchases a brand for a special occasion.(Oliver 1999) We can also classify customer loyalty into the behavior loyalty and the attitude loyalty. Behavior, customer loyalty focuses on the long-term choice probability for a brand, for example, repeat purchase probability, while, attitudinal loyalty focuses on brand recommendations, resistance to superior products, repurchase intention, and so on. (Xu-Xiaoli, Wan-Yinghong, Huan-Zhijian, Liu-Hui 2006) Behavior loyalty Many scholars (Soderlund, 1998; Ja-Shen Chen et al., 2006; Ehrenberg, 1991) think loyalty referred to customer consistent purchasing behavior. Jacoby and Kyner said “customer loyalty is the behavioral outcome of a customer’s preference for a particular brand from a selection of similar brands, over a period of time, which, importantly is the result of an evaluative decision-making process”. These researches are based on that there is no true definition of customer loyalty. And they think the data of repeat purchase can be easier get. But does the customer who repurchasing the same brand products is a loyal customer? Amine (1998) thinks the repurchasing under the two cases can’t be called loyalty purchasing: (1) consumers’ repurchasing may be due to the consumers’ tendency to reduce or avoid search efforts. There is a high probability of interrupting this consistent buying and switching to another brand at the first opportunity or inducement to do so (price increasing, new brand launching or brand out of stock). This kind of repurchasing can be called inertia purchasing. (2) When there is a narrow choice in a product category, the repeat purchasing improves too. This consistent brand buying may express more inertia or constrained repeated behavior rather than loyalty with commitment to that brand.
8
Consumer commitment purchasing (behavior loyalty) of same brand doesn’t mean he/she is a loyalty consumer. Attitudinal loyalty What is the attitudinal loyalty? Jacoby and Chestnut (1978) define it as a customer predisposition towards a brand. It’s a function of psychological processes. Amine (1998) considers the commitment toward a brand is the attitudinal loyalty. Baldinger and Rubinson (2001) also believe this kind of commitment is a dispositional commitment. It in terms of some unique value associated with the brand. While how to measure the attitudinal loyalty. Bandyopadhyay et al. (2007) think attitude strength of a brand was operationalize by the number of positive attributes associated with the brand. (A person has a stronger (or weaker) attitude toward a brand when he/she believes that the brand possesses more (or less) positive attributes.) While Rundle-Thiele (2005) use word of mouth as a measure of attitudinal loyalty. Attitude-behavior loyalty Behavioral loyalty suggests that the repeat purchasing of a brand over time by a consumer expresses their loyalty, while the attitudinal perspective assumes that consistent buying of a brand is a necessary but not sufficient condition to ‘true’ brand loyalty (Amine 1998). Like Dick and Basu (1994) precisely suggesting that a favorable attitude and repeat purchase were required to define loyalty. Behavior loyalty must be complemented with a positive attitude towards this brand to ensure that this behavior will be pursued further. Oliver (1999) defines loyalty as a deeply held commitment to re-buy or re-patronize a preferred product/service consistently in the future, thereby causing repetitive same-brand or same brand-set purchasing, despite situational influences and marketing efforts having the potential to cause switching behavior. Dick and Basu (1994) state that, “customer loyalty is viewed as the strength of the relationship between an individual’s relative attitude and their repeat patronage”. In this research we define the loyal customer from two aspects: (1) repeat purchasing the same brand products (2) positive word of mouth. Both are indispensable. Here the word of mouth means the extent to which customers inform friends and family (Rundle-Thiele, 2005). In this thesis, we agree with Butcher et al. (2001) view about positive word of mouth. They identify 4 variations of the concept of positive word of mouth: (1) providing positive word of mouth (2) recommending the service to others (3) encourage others to use service (4) defending the service provider's virtues 2.1.2 The antecedents of customer loyalty We think there are three factors that can lead to customer loyalty. The first one is the customer satisfaction (Amine, A., 1998; Oliver, 1999; Butcher et al., 2001;
9
Li Liu, 2008). Butcher say the increased loyalty results from high levels of customer satisfaction. Oliver describes it more figurative: “satisfaction becomes transformed into loyalty much like a caterpillar becomes transformed into a butterfly. After this metamorphosis, the two creatures are not the same and share virtually no common characteristics except for their biological origins.” The second factor is switch cost. Switching cost is related to the intention that customers willing to repurchase. Switching cost is positively related to customer loyalty and Fornell (1992) stated that switching cost have impact on the connection between customer loyalty and satisfaction. The third one is the corporate image. Corporate image and customer satisfaction have mutual effect on each other. And in turn they both have impact on customer loyalty 2.1.3 Does customer loyalty really work? There are large numbers of theses research the function of customer loyalty. But does customer loyalty really work? Dowling and Uncles, M. (1997) think the loyalty is not working. Launching and maintaining loyalty programs cost firms money (Muller, E., 1998). There are “Leaky Bucket Theory” and “Polygamous Loyalty” exit in the market. The empirical record and the predictive norms show that only about 10 percent of buyers for many types of frequently purchased consumer goods are 100 percent loyal to a particular brand over a one-year period. (Ehrenberg and his colleagues (1988) gathered data from various markets in Britain, continental Europe, Japan, and the United States over more than twenty years. Their research describes people's purchase habits of products like coffee, ready-to-eat breakfast cereals, newspapers, aviation fuel, toothpaste, laundry detergents, gasoline, television programs, airline tickets, ethical drugs, and even repeat purchases of management development programs at business schools). Moreover, 100 percent loyal buyers tend to be light buyers of the product or service. Most of customers not only buy one brand (Polygamous loyalty). For example, surveys of European business airline travelers show that more than 80 percent are members of more than one airline loyalty scheme. Customers don’t only loyal to one company (brand). But in mobile telecom industry the situation is different. The multi-brand loyalty does not exist in the market. Usually one customer only chooses one mobile operator at one time. Once customers have been acquired and connected to a certain network of an operator, their long-term relations with the operator are settled. It is more important to the company’s success than some other industry sectors (Gerpott et al. 2001). We are not sure the percentage of loyal customers in the whole customers but we know "80/20 law" (Dowling and Uncles, M., 1997). The 80/20 law states that about 80 percent of revenue typically comes from only 20 percent of customers. With such a skewed distribution of customers, it makes sense to concentrate most marketing
10

resources on the 20 percent. Most of these customers are loyal customers. Loyalty programmers can stabile market because the loyal customers are become less sensitive to price. The more stabile market the higher profit margins (Muller, E., 1998). We think customer loyalty is very important in mobile telecom industry. 2.1.4 New trend of the customer loyalty There are several levels of customers (Cary W. Adams Adams): 1. Dissatisfied customer--Looking for someone else to provide product or service. 2. Satisfied customer---Open to the next better opportunity. 3. Loyal customer--Returns despite offers by the competition. Nearly two decades after loyalty theories radically changed the business world, the balance of power has shifted from companies to customer, now the market is more customer- oriented market, and customer loyalty is becoming more and more indispensable and important in the real market. Now more than ever, organizations need to understand the mechanisms of customer loyalty to profit from it. As such, Jennifer Kirkby (2008) provides a trip through the history of customer loyalty and shows how we can learn from past mistakes and current thinking. Loyalty today is not what it was! Loyalty is more qualitative and subjective – it is a feeling of connection to, and belief in, a company and its proposition, created by a ‘feel good’ factor from interactions. (Jennifer Kirkby .2008) Products with after-sales service no longer sufficed, the customers wanted better experiences with suppliers and had started to use the internet to advise each other on which companies to use: three-quarters of consumers would recommend their favorites company to others. So the customer loyalty is different between industries. And it also has been added more meaning right now by the development of the technology. Five key loyalty-marketing trends are identified and explored in detail, while you think about the customer loyalty; you might to take the following five factors into your considerations. (Michael T. Capizzi and Rick Ferguson, 2005) ---Ubiquity; Existence or apparent existence everywhere at the same time; omnipresence ---Technology enables but imagination wins. The ability to confront and deal with reality by using the creative power of the mind; resourcefulness ---Coalition lite; An alliance of people, factions, parties, or nations. 2. A combination into one body; a union.
11
---Customer analytics; Division of a subject into elemental parts or basic principles. 2. Using, or subjecting a subject to a methodology involving algebra or other methods of mathematical analysis. 3. Proving a known truth by reasoning from that which is to be proved. ---the Wow! Factor wow Used to expressing wonder, amazement, or great pleasure. This is the outstanding success.
2.2 Customer satisfaction 2.2.1 The definition of customer satisfaction As the key driver of customer loyalty, many researchers increased emphasis on customer satisfaction. High level of customer satisfaction may lead to more loyal customers which means can bring more profit for enterprise. There are many kinds of definition of customer satisfaction, but no precise definition already been development. Just like Oliver said the working of customer mind is like a black box. That is an observer can only see what goes in and what comes out but not what happened inside. Satisfaction may result from a very simple or a complex process involving extensive cognitive, affective and other undiscovered psychological and physiological dynamics (Oh & Parks, 1997). Comparing the definitions of satisfaction, it can be found that satisfaction is stated to be a relative concept always judged in relation to a standard (Yuksel Atila et al., 2001). That means if you define customer satisfaction on different angles, you can get different definition. Usually, many researchers conceptualize customer satisfaction as a personal feeling that customers compare perceived quality performance with expectations. This kind of conception is represented by Oliver’s (1980) expectancy-disconfirmation framework. He states that customers compare the perceived quality of products and service with their prior expectations. The difference between expectations and perceived quality is called disconfirmation. If it is positive disconfirmation (the expectations are met or exceeded), the consumer is satisfied; if it is negative disconfirmation (perceived quality falls short of expectations), and then the customer is dissatisfied. The model is future developed by Anderson et al.(1993). Some other researchers suggest that customer satisfaction can be defined at two levels (Bitner & Hubbert, 1994; Jones et al. 2000; Bodet, Guillaume, 2008). They are transaction-specific satisfaction and overall satisfaction (holistic). Transaction-specific satisfaction refers to the consumer’s satisfaction with a discrete service encounter. It based on the individual level, they judgment customer satisfaction on a specific purchase occasion. Overall satisfaction refers to the consumer’s overall subjective post-consumption evaluative judgment based on all encounters and experiences with particular organization.
12
Like Wang, Yonggui et al. (2004) said that the overall satisfaction is more fundamental and useful than transaction-specific consumer satisfaction in predicting subsequent consumer behaviors and a firm’s past, present and future performance. ACSI (American Customer Satisfaction Index), SCSB and ECSI define customer satisfaction as overall satisfaction. So here our theoretical framework treats customer satisfaction as overall satisfaction. 2.2.2 The definition of perceived Quality of products and service From the end of last century, companies already realized understanding and meeting consumer’s need is very important for company. It can help companies get competitive advantages. Supplying high quality products and service seems very important. Companies that have goods and services that are perceived as being of high quality typically have greater market share, higher return on investment, and higher asset turnover than firms which have goods and services perceived as being of low quality (Kim et al., 2004). For the definition of quality which we will use in our thesis referred to perceived quality. Because it was found that the objective quality concepts are not identical for managers, customers and researchers (Zeithaml 1988). We need a higher level abstract definition to describe the quality. Definition of perceived quality seems suitable under the situation. Zeithaml (1988) describes perceived quality like this: consumer’s judgment about the superiority or excellence of a product or service. The perceived quality has two primary components of consumption experience (Fornell 1996): (I) customization, that is, the degree to which the firm's offering is customized to meet heterogeneous customer needs, and (2) reliability, that is, the degree to which the firm's offering is reliable, standardized, and free from deficiencies. O'Loughlin (2004) thinks that there are two general kind conceptions of perceived quality: product quality ((hardware) and service quality (software/ humanware). Perceived product quality is the evaluation of recent consumption experience of products. Perceived service quality is the evaluation of recent consumption experience of associated services like customer service, conditions of product display, range of services and products etc. 2.2.3 The definition of perceived Customer value The market is driven by customers’ demand. With the development of science and technology, there is no great difference among the same category products. Many firms are transforming their focus from looking internally within the organization for improvement byway of quality management, downsizing, business process reengineering or lean production and agile manufacturing to customers (Wang Yonggui, 2004). Customer value which has a significant impact on behavior intentions of customer has been considered as a successful factor for firms.
13

Like other definitions we meet before, there are many different expressions of the conceptions of perceived value. These definitions are very popular and already are widely used by many researchers in their research papers: Value is the consumer’s overall assessment of the utility of a product based on perceptions of what is received and what is given. (Zeithaml 1988) Buyers’ perceptions of value represent a tradeoff between the quality or benefits they perceive in the product relative to the sacrifice they perceive by paying the price. (Monroe 1990) Customer value is market perceived quality adjusted for the relative price of your product. (Gale 1994) Customer value as a customer perceived preference for and evaluation of those product attributes, attribute performances, and consequences arising from use that facilitate achieving the customer’s goals and purposes in use situations. (Woodruff, 1997) Comparing these definitions we can find some consensus among them. There is some form of tradeoff between what the consumer gives up (price, sacrifice) and what the consumer receives (utility, quality, benefits). (Doods, 1991; Woodruff, 1999; Kashyap & Bojanic, 2000) It implies at the same time that when consumers are able to practically evaluate tradeoffs between price and quality, perceived overall value may provide the best summary evaluation of the experience (Kashyap, 2000). All the value is based on customer perspective. In the thesis, we define the customer value as “the perceived level of product quality relative to the price paid” (Fornell, 1996). 2.2.4 The relationship among perceived quality, perceived value and customer satisfaction, customer loyalty Many previous studies measure customer satisfaction, perceived quality and customer value in a single item, but we think the single item study will lead to many shortcomings. Because all survey variables are believed to be measured with certain degree of errors (Fornell et al., 1996), single-item scales cannot assess or average out the variance due to random errors, specific items, and method factors (Yi, 1990). In contrast, some studies employing multi-item scales to measure perceived quality and consumer satisfaction show that multi-item scales are significantly more reliable than the single-item scales (Wang Yonggui, 2004). In the thesis we treat customer satisfaction, perceived quality and customer value as a whole. As ACSI, SCSB informed, the relationship among perceived quality, perceived value and customer satisfaction, customer loyalty can be concluded like that (1) perceived quality and perceived value have a direct and positive effect on customer satisfaction;
14

(2) perceived quality has a positive association between perceived value increases and customer satisfaction. (3) perceived quality and value don’t have a significant effect on customer loyalty.
2.3 Switching cost 2.3.1 Definition and typology Switching cost is defined as the cost involved in changing from one service provider to another (Porter, 1980). He also argued that there are three types of switching cost: (1) procedural switching costs, primarily involving the loss of time and effort; (2) financial switching costs, involving the loss of financially quantifiable resources; and (3) relational switching costs, involving psychological or emotional discomfort due to the loss of identity and the breaking of bonds. Though his research, he proved that all the three types of switching cost have influence on consumers’ intentions to stay with their current service provider, explaining more variance than satisfaction. Jones, .Mothers Baugh, and Beatty (2002) argued that switching cost is financial and psychological risk when a customer changes a provider. They supposed six dimensions of switching cost: (1) lost performance costs; (2) uncertainty costs; (3) pre-switching search and evaluation costs; (4) post-switching behavioral and cognitive costs; (5) setup costs; and (6) sunk costs. Lost performance costs are perceptions of the benefits and privileges lost by switching. Uncertainty costs are perceptions of the likelihood of lower performance when switching. Pre-switching search and evaluation costs are perceptions of the time and effort of gathering and evaluating information prior to switching. Post-switching behavioral and cognitive costs are perceptions of the time and effort of learning a new service routine subsequent to switching. Setup costs are perceptions of the time, effort, and expense of relaying needs and information to provider subsequent to switching. Sunk costs are
Perceived product quality
Perceived service quality
Perceived customer value
Customer satisfaction
Customer loyalty
Figure 1 The relationship among quality, value, satisfaction and loyalty
15

perceptions of investments and costs already incurred in establishing and maintaining relationship. By two studies, they proved that every one of the six dimensions is associated with repurchase intentions and indicates that lost performance costs and sunk costs are more strongly associated with repurchase intentions than others. (Jones, .Mothers Baugh, Beatty, 2002) Burnham, Frels and Mahajan (2003) defined switching costs as the onetime costs that customers associate with the process of switching from one provider to another. They provided eight dimensions of switching cost: economic risk costs, evaluation costs, learning costs, set-up costs, benefit loss costs, monetary loss costs, personal relationship loss costs, and brand relationship loss costs and then summarized these eight dimensions into three types: procedural, financial, and relational switching costs. Procedural switching costs: consisting of economic risk, evaluation, learning, and setup costs, this type of switching cost primarily involves the expenditure of time and effort. Financial switching costs: Consisting of benefits loss and financial-loss costs, this type of switching cost involves the loss of financially quantifiable resources. Relational switching costs: consisting of personal relationship loss and brand relationship loss costs, this type of switching cost involves psychological or emotional discomfort due to the loss of identity and the breaking of bonds. By their studies, they stated that all the three switching cost types appear to drive consumers’ intentions to stay with their current provider. 2.3.2 Switching cost and customer loyalty According to the previous studies, we can come to the conclusion that switching cost is the cost occurring when change product or service providers. No matter how switching cost was classified, in general business world it is related to the intention that customers’ willing to repurchase. When we only study the relationship of switching cost and customers’ repurchase intention, these two shows a positive correlation; the higher the switching cost, the higher the customers’ repurchase intention is. As we stated that repurchase intention is one aspect of attitudinal loyalty, which is one type of customer loyalty so switching cost has a positive correlation with customer loyalty in the general business world. Switching cost also has influence on the relationship between customer satisfaction and customer loyalty. The level of switching costs moderates the link between satisfaction and loyalty (Jonathan et al., 2001) Fornell (1992) suggested that switching cost has impact on the connection between customer loyalty and satisfaction. Jones and Aasser noted that the false loyalty increase when switching cost is high.
2.4 Corporate image 2.4.1 The definition of corporate image MacInnis and Price (1987) described image as a procedure by which ideas,
16

feelings, and previous experiences with an organization are stored in memory and transformed into meaning based on stored categories. Corporate image is described as the overall impression made on the minds of the public about a firm (Barich and Kotler, 1991). It is defined as perceptions of an organization reflected in the associations held in consumer memory by Keller (Keller, 1993) as well. Nguyen and LeBlanc, (1998) defined corporate image as subjective knowledge, as an attitude, and as a combination of product characteristics that are different from the physical product but are nevertheless identified with the product.
Corporate image is the result of a process (MacInnis and Price, 1987). The process stems from ideas, feelings and consumption experiences with a firm that are retrieved from memory and transformed into mental images (Yuille and Catchpole, 1977). Customers can obtain it from their own experience, words of others, advertising and so on. Serkan and Gokhan concluded that corporate image stems from all of a consumer’s consumption experiences, and service quality is a function of these consumption experiences. Hu et al. claimed that customers who received high service quality during service delivery would form a favorable image. Service quality has an indirect effect on corporate image (Hu et al., 2009).
2.4.2 Corporate image and customer loyalty Selnes (1993) stated that image should be incorporated into a model of loyalty together with satisfaction. Image and satisfaction, are associated with loyalty. Thomas et al. pointed that corporate image is an important factor for service companies because of its impact on loyalty (Thomas et al., 2008). They argued that experience plays an important role in building customer loyalty, the corporate image for experienced customers, who have established a reliable image, become a strong predictor of loyalty. So for continuously provided services, most customers will be experienced and have a strong image; their image will be an important factor in building loyalty. Jay Kandampully also claimed that corporate image is influenced both by service quality and customer satisfaction, which in turn influences customer loyalty (Jay Kandampully, 2007).
2.5 The Integrative Framework of Theory In our thesis, we will develop our own model of customer loyalty. Our model is similar with ECSI (European customer satisfaction index), but there are some differences:
17

Source: a study by Cassel, C., Eklof (2001 cited ECSI) Figure 2 European customer satisfaction index (1999)
1. In our thesis, we don’t add the factor “expectations” in our model. In fact,
expectations have an important role in the definition of customer satisfaction and perceived service quality. We do not consider the factor “expectations” is based on following reasons: (1) As we mentioned before, some researchers define the customer
satisfaction as the difference between the customers’ perceived quality with expectations. There are also some researchers define the service quality as “the outcome of an evaluation process where the consumer compares his expectations with the service he perceived”. That refers to the difference between expected service and perceived service (Parasuraman, 1988; Oh, H., 1999; Yuksel , 2001;Wang, Yonggui,2004; Ueltschy, 2007). We can find the concepts of customer satisfaction and service quality are almost same. Although the researchers already made the distinctions 7 between two conceptions, it’s still easy be
7 Oliver distinguishes them from following aspects: (1) expectations for quality are based on ideal or perceptions of excellence, whereas a large number of non-quality issues can help form satisfaction judgments (for example, needs, equity, and perceptions of fairness). (2) The dimensions underlying quality judgments are also rather specific, whereas satisfaction can result from any dimension, regardless of whether or not it is quality related. (3) In addition, the perception of quality does not require experience with the service or provider whereas satisfaction judgments do. (4) Finally, quality is believed to have fewer
Image
Perceived service quality
Perceived product quality
Expectations
Perceived value
Customer satisfaction
Customer loyalty
18

confused. (2) Based on the “gap” definition of service quality, Parasuraman (1988)
developed a SERVQUAL model to measure service quality. This model includes 5 dimensions: tangibles (physical facilities and the appearance of personnel), reliability (ability to perform the promised service dependably and accurately), responsiveness (willingness to help customers and provide prompt service), assurance (employee knowledge base which induces customer trust and confidence) and empathy (caring and individualized attention provided to customers by the service providers). The adaptability of dimensions of SERVQUAL makes it is widely used in many industries (banking, health care etc.). However, there are some researchers (Teas et al., 1992; Brady et al., 2002) who have raised concerns as to its validity, as well as definitional concerns related to the construct of expectations (Ueltschy, 2007). Cronin and Taylor developed a SERVPERF model to measure the service quality. They found expectations have no direct impact on customer satisfaction. Martensen et al. (2000) had a survey in Denmark, they also found that expectations have no or only a minimal impact on customer satisfaction and loyalty, especially for the telecommunication industry of Denmark. He thinks the value of “expectations” only exist on the theoretical level.
(3) In our thesis we add the “switching cost” as an important factor of customer loyalty. Based on the previous researches, switch cost has a significant impact on customer loyalty and it affects the relationship between customer satisfaction and customer loyalty.
Figure 3 The new theory model
According to our model, customer loyalty is affected by customer satisfaction, corporate image, and switching cost. Customer satisfaction comes from three aspects: perceived product quality, perceived service quality and perceived
conceptual antecedents than does satisfaction (Oliver, 1993).
Perceived service quality
Customer loyalty
Corporate image
Perceived product quality
Perceived customer value
Customer satisfaction
Switching cost
19

customer value. Switching cost not only can affect customer loyalty directly but also has influence on the relationship between customer satisfaction and customer loyalty. Corporate image and customer satisfaction have mutual impact on each other.
20

Chapter 3 The Hypotheses of Customer Loyalty
3.1 Hypothesis of customer perceived quality According to Ahn’s (2006) research that in Korea, call drop rate (percentage of abnormally terminated calls) has a significant impact on the probability of churn; however, the call failure rate (the percentage of calls that are not initiated due to interference or poor coverage) does not. While Gerpott (2001) considers the network quality, which is reflected in excellent indoor and outdoor coverage and in the clarity of voice reproduction without any connection break-downs, is one of the key drivers of customer satisfaction in Germany market. Lee (2001) thinks the quality of core services (coverage of the calling area and clarity of sound) is very important on customer satisfaction in France telecom market. There is no relative or similar research in Chinese Telecom Industry, but we think Chinese telecom market is similar with others. That is the coverage of the area and call quality (clarity of voice) are key drivers of customer satisfaction. Customer satisfaction has a strong relationship with customer loyalty which already been proved, so do coverage of the area and call quality (clarity of voice) have big importance on customer loyalty? Thus we make the hypothesis as follows: Hypothesis 1: “call quality” has a big importance on customer loyalty. Hypothesis 2: “coverage of the area” has a big importance on customer loyalty. SMS play a great important role in Chinese daily life. It was reported on Los Angeles Times on Oct. 31, 2007 that China has 455 million mobile users, they send 30 billon SMS every month. While 82% American mobile users never use SMS, 3% users use once every month and 15% users send SMS every one week or more. Comparing with other countries, Chinese prefer to send SMS to communicate and express their wishes to their friends and families. The reasons may be have a closely relation with Chinese character and SMS character. Chinese like use an explicit way to communicate with others. Americans or other Europeans like to express their feeling directly, while Chinese choose an explicit way to express. For example, Chinese seldom say “I love you” to their parents, children and lovers. I never say “I love you, Dad /Mum” until now.. That doesn’t mean I don’t love my parents, I just never express it directly. So more people choose send SMS to express their love to others, especially for young boys and girls. Usually, we will receive / send a lot of SMS during the festival to get / express wishes. The second reason is that text has a unique charm it can express something that the language cannot express. The third reason is that young people are the main groups of SMS. They like send SMS not only because it’s cheaper than the call, but also because they can send it every time in any places. For example, many students like to send SMS on the
21

classes. But usually one SMS only contain 70 Chinese characters which give a large limitation to mobile users in China when they send SMS. And we also find problem sometime we miss our SMS during the sending process, especially at the “peak time” (for example the Chinese Spring Festival). The pre-research never refer to the SMS. But according to the importance of SMS in Chinese market, we think it is necessary to prove the relationship between the customer loyalty and the quality of SMS. So we hypothesis: Hypothesis 3: “SMS quality” has a big importance on customer loyalty. In our thesis, the “network quality” refers to the internet connection and the speed to login website, received and send email etc. with cell phone. In 3G era, the quality of product for different telecom companies is largely depending on the speed of internet. If the mobile operator can supply high speed mobile internet, it can win more customers. So we hypothesis: Hypothesis 4: “network quality” has a big importance on customer loyalty. Nobody will deny that price is a key driver when people make a purchasing decision. Especially for the telecom industry, people usually store certain amount money in their account. So they will inquiry balance from time to time: how much money already been consumed and how much left. If the inquiry system is not reliable, nobody will feel assured when they are consuming. So we want to know does the convenient and reliable inquiring balance system have a big importance on customer loyalty. Hypothesis 5: “convenient and reliable inquiring balance system” has a big importance on customer loyalty. It’s hard to find a mobile operators’ service center on the street in western countries. Because people already been get used to deal all the transaction through internet and hotline. But in China it’s different. Most people especially the elders, they get use to deal it in the service center. They think if they open or close the service through the call or internet, it seems un-believable. Only the paper contract8 can protect the consumers’ interest. So if walking on the streets in China, you will easily find a mobile operators’ service center (especially China Mobile service center) in the corner whether you are in an international city like Shanghai or a small town which you even cannot remember the name. Besides the face to face service, the hotline is also a widely used tool to deal the tractions. Comparing with service center, the hotline service has some
8 In china, if you open or cancel a mobile service in the mobile operator service center, you usually get a contract. The contract will written what time, what kind of service will be open / cancel from a certain day. If the consumer agrees, he will sign his name and the contract entry into force.
22

incomparable advantages. (1) You can deal the transaction whenever (24 hours service) and wherever you like. The call is free. (2) It can handle complain. In our pre-description, we know the importance of loyalty customers for the firms. Its central role in maintaining customer loyalty clearly positions complaint handling as an important strategic tool for enterprises. Complaints represent an opportunity to remedy product or service related problems and to positively influence subsequent customer behavior. Dealing effectively with complaints can have a dramatic impact on customers' evaluations of the experiences for the encounter service as well as enhance their likelihood of repurchase and limit the spread of damaging negative word-of mouth (Blodgett, 1997). If the firms can deal the service efficiently and high quality, the complain customer can be transfer into loyal customer. Chinese like use the explicit way to express their mind; it’s same when they are complaining. They prefer to complain through the hotline. The service quality which done by the workers in the service center and hotline are very important. It will directly influence the consumers experience and affect the consumer overall satisfaction. So in this thesis, we want to prove that does the service quality of service center and hotline have a big importance on customer loyalty. We treat the overall evaluation of the encounter service (face to face service, call hotline etc.) quality as perceived service quality. Another factor which will influence the perceive service quality is the Inquiring phone fee system (inquiring personal bills of cell phone). Thus we can have hypotheses as follows: Hypothesis 6: “the service quality of service center and hotline” has a big importance on customer loyalty.
3.2 Hypothesis of customer perceived value When we talk about the value of products, a word usually appeared in our mind: “price”. Price is often used by consumers as an extrinsic product-quality cue (Teas & Agarwal, 2000). Scitovszky (1945) observed that the use of price as an indicator of product quality is not irrational, but represents a belief that price in the marketplace is determined by the interplay of the forces of competitive supply and demand. For general people, price just a number which present how much money you should pay if you want to get the product or service. That is what we called “actual price”. But can you remember the actual price of the products in your daily life. The researches reveal that consumers do not always know or remember actual prices of products. Instead, they encode prices in ways that are meaningful to them (Teas & Agarwal, 2000). This is what we usually called “perceived price”. Zeithaml (1988) define perceived price as “what is given up or sacrificed to obtain a product”. Here what we give up can be money but can also be nonmonetary things like time, convenience and search costs.
23

Just like we write before the customer value is the comparison between perceived quality and perceived price. Comparing quality with price can balance the difference in income among people. An example can make it clear. About ten years ago, there were only two mobile operators in Chinese telecom market: China Mobile and China Unicom. (The situation was broken from last year.) At that time, China Unicom is a small and young company, poor coverage area of network, instability signal and some other extrinsic reasons making China Unicom lose large number of users even through their price is lower than China Mobile. Even students who are most sensitive to price prefer use high price but good quality products and service. Through the 10 years development, their products and service category are similar and there is no great difference in the quality of their products and service. The only difference between them is the monetary price and nonmonetary price. So we hypothesis that: Hypothesis 7: “rating price of given quality” has a big importance on customer loyalty.
3.3 Hypothesis of switching cost In terms of mobile telecommunication, switching cost play an important role in the customer loyalty. In telecommunication industry, once customers have been acquired and connected to a certain network of an operator, their long-term relations with the operator are more important to the company’s success than some other industry sectors (Gerpott et al. 2001). In the mobile telecommunication sector, procedural switching costs can be embodied as time and effort paying on evaluating alternative operators, getting used to new service system and informing the contacts the new number (if there is no mobile number portability). Financial switching costs can be embodied as cost of new SIM card, financial loss on bonus and score accumulation, loss on prepayment. Relational switching costs can be embodied as emotional discomfort when facing to the inconvenience, and loss of former relationship with staff and so on. Jones and Sasser (1995) noted that when the false loyalty increase, switching cost is high. They suggest that when the switching cost is low, there are few false loyalties and satisfaction can easily keep customers stay and dissatisfy customers can easily make the decision of changing a provider. On the contrary, when customers facing to high switching cost, customer satisfaction’s influence are weaker; even if customers dissatisfy with the products or service, they may still stay. Serkan, Gokhan, and Omer (2005) stated that switching cost factor directly affects loyalty, and has a moderator effect on both customer satisfaction and trust. Therefore, it plays a crucial role in winning customer loyalty. This conclusion is based on the research on the Turkey’s mobile telecom market.
24

In addition to objectively measurable monetary costs, switching costs may also pertain to time and psychological effort involved in facing the uncertainty of dealing with a new service provider.
Kim et al. (2004) argued that factors creating switching costs positively affect customer satisfaction this conclusion is based on a survey in the Korea mobile telecommunication market. The authors embodied switching cost into sub factors. (1) Loss cost: the perception of loss in social status or performance, when cancelling a service contract with an existing carrier. (2) Adaptation cost: the perceived cost of adaptation, such as search cost and learning cost. (3)Move-in cost: the economic cost involved in switching to a new carrier, such as the purchase of a new device and the subscriber fee. They also stated that losses involved in removing special customer status or customer benefit programs, and move-in costs such as changing numbers, could be an important switching barrier for customers changing to other service providers. Jia and Yan tested what factors drive customer loyalty in the telecommunication sector in China by qualitative interview and questionnaire survey, and their finding is that customer loyalty is driven by customer satisfaction, trust relationship and switching cost synthetically. Switching cost has a stronger influence on customer loyalty than do customer satisfaction and relationship trust in the low stake holding condition. Which means when customers perceive low interests correlated with themselves of the service from a certain provider, switching cost plays a more important role in obtaining customer loyalty. Another similar research was made in China by Yonggui Wang et al. They selected randomly 300 mobile telecommunication customers in two cities, Tianjin and Hohhot, to make questionnaire which focus on what factors can impact customer loyalty in the mobile telecom market. Their finding is that switching cost plays a moderating role in impacting process of customer loyalty (Yonggui et al., 2005). Jonathan et al.(2001) suggested that, in mobile telecommunication sector, switching cost plays a significant moderating role in the satisfaction-loyalty link only for the economy and standard groups in which customers consider quality of core service very much when they choosing operators. They also suggested that firms should provide consumption-based incentives such as free hours, added value, services, and lower, weekend pricing, a new handset with discounted price, and free value-added services for heavy users. These researchers suggested that switching cost is an important factor that can affect customer loyalty in the mobile telecommunication sector. Researchers either test the general switching cost or divide switching cost into mutable types and test type by type. But the types are only stay in the
25

academic level, for example, financial switching cost, relational switching etc. Nearly none of them give us a conclusion that in empirical, or to say, in the real mobile telecommunication industry, what embodied form of switching cost have important influence on the customer loyalty. Some of the researchers use questionnaires in their studies; they choose questions related to score accumulation and bonus frequently so we propose a hypothesis that: Hypothesis 8: Score accumulation and bonus have big importance on customer loyalty in the mobile telecommunication sector. Mobile number portability gives subscribers right to keep their phone number when they change service providers. The main purpose of number portability adoption is to minimize the subscriber inconveniences associated with switching providers and to lower switching costs. (Lee et al. 2006) However, in China number portability was not introduced to the mobile telecommunication, that is to say, when customers change to another operator, they are not allowed to retain their cell phone numbers. This bring big inconvenience after switch to another operator because the customers have to inform all their contacts the new number and people would still call the old number at the beginning weeks, thus the customers may miss some phone calls which maybe vital. We propose another hypothesis: Hypothesis 9: customer’s worry of troubles after change cell phone number has big importance on customer loyalty in the mobile telecommunication sector.
3.4 Hypothesis of corporate image In the sector of Mobile telecommunication, researchers also studied the impact of corporate image. According to a survey, which Nokia took 3,900 interviewees, corporate image with network quality, and switching barriers together are the factors that can keep current customers stay in the operator. Groholdt et al. (2000) stated that corporate image is an important driver of customer satisfaction and loyalty in the industries of soft drinks, banking and telecommunications. Li Liu claimed that corporate image has a significant impression on services quality, customer value, customer satisfaction and customer loyalty ( Liu, 2008). This conclusion is based on a study of Chinese telecommunication marketing. Building up image is one of the important tasks to retain customers, and this is according to a study of the Taiwan telecommunication sector. ( Chen, 2006) Nguyen and Leblanc (2001) stated that corporate image is related to the physical and behavioral attributes of the firm, such as business name, architecture, variety of products/services, and to the impression of quality communicated by each person interacting with the firm’s clients. Except customer’s experience, corporate image can be built by publicity and
26

advertisements. Company can use these methods foster a good and healthy company image for them. Andreasen and Drumwright argued that social responsibility plays an important role in increasing corporate image.( Andreasen and Drumwright, 2001) Corporate social responsibility is defined as company’s status and activities regarding its responsiveness to its perceived societal obligations (Brown and Dacin, 1997). Nowadays companies should not just chase interest, they should take over some social responsibilities to improve social warfare, protect the living environment of people. Customers will have a good impression of a corporate if it takes part in some charity events, treat their employees well, be ethical and obey the law when doing business. A good impression can lead to a high corporate image. From the previous studied of corporate image, we can come to the conclusion that, corporate image and customer satisfaction have mutual effect on each other. In turn they both have impact on customer loyalty. Many researchers stated that corporate image is a subjective impression to a firm and this impression is partly from the customers’ consumption experiences. Service quality is one of the most important functions of the consumption experience. Service quality and other factors constitute customer satisfaction, so this can also improve that customer satisfaction and corporate image affect each other mutually. Besides consumption experience, customers can build their image about a firm from words from others, news of the firm, advertisements, business name and logo, corporate social responsibility. In terms of mobile telecommunication sector, corporate also have influence on customer loyalty. But researchers mainly focused on the general concept of corporate image, and not many of them study the embodied forms of corporate image and few focuses in the mobile telecommunication industry. We want to discover if some of the sub-factors or to say embodied forms of corporate image can have affect customer loyalty in the Chinese mobile telecommunication sector. Corporate image is influenced a lot by customer satisfaction and experience, but because we have already started a part studying customer satisfaction, we will not study it again in this corporate image part. The sub-factors we choose are (1) advertisements of corporate image; (2) corporate social responsibility. These are two factors have been mentioned in the previous literatures. We propose hypothesize that: Hypothesis 10 Advertisements of corporate image has big importance on customer loyalty in the mobile telecommunication sector. Hypothesis 11: Corporate social responsibility has big importance on customer loyalty in the mobile telecommunication sector.
27

Figure 4 The model of research hypotheses
Based on our model, we embody every factor into several concrete forms especially for mobile telecom sector in China and select eleven of them to test if these sub-factors really have connection with customer loyalty and which of them are more important in the mobile sector. Coverage of the area, call quality, SMS quality, and network quality are concrete forms for perceived product quality; convenient and reliable inquiring balance system and the service quality of service center and hotline are for perceived service quality, rating price of given quality is for perceived customer value; score accumulation and bonus and worry of troubles after change cell phone number are for switching cost; last but not least, advertisements of corporate image and corporate social responsibility are for corporate image. We suppose that these eleven concrete forms of factors have important influence on customer loyalty in China mobile communication industry.
Customer loyalty
Switching cost
H 8
H 9
Customer satisfaction
Perceived product quality
Perceived customer value
Perceived service quality
H1
H2
H3
H 4
H 5
H 6
H 7
Corporate image
H 10
H 11
28

Chapter 4 Research Question and Methodology
4.1 Research purpose and research question The purpose of this paper is to find out what kind of specific and concrete operational factors have an important impact on Chinese mobile telecom customer loyalty. And we choose China Mobile as our study case in the paper. The research questions of this paper are that: Which factors (11 hypotheses) have an important impact on customer
loyalty in Chinese telecom industry? How does China Mobile performance on these 11 aspects? How to map out the better way to help China Mobile to enhance customer
loyalty in the 3G era?
4.2. Research Methodology 4.2.1 Definition and measurement of research hypotheses In order to solve the main research question in our paper step by step. First of all, the initial approach of this paper is to figure out how many factors really affect the customer loyalty. Through large amount of literature review, we think customer satisfaction, corporate image, switch cost are the main antecedents of customer loyalty. Second, how do these influencing factors impact on the customer loyalty in Chinese mobile telecommunication market? We compare Chinese mobile market with other countries and find the factors (customer satisfaction, switching cost, and corporate image) will impact customer loyalty from the following aspects. In order to better dress out how those three main aspects function and affect the customer loyalty in Chinese telecommunication market by the more specific and concrete operational definitions, we called those operational definitions as research hypotheses in this paper. We have made reference on many previous studies of customer loyalty and mobile telecommunication industry, base on them we came up with 11 research hypotheses to describe these sub-factors within the three areas. We consider switching cost from two aspects: A.”Score accumulation and
bonus” (H8) which already been discussed by other scholars. If the customer is in a score accumulation and bonus plan, they will have some potential losses when they change the mobile operators. So, score accumulation and bonus plan can help to decrease the customers’ willingness to switch to other operators. B. “customer’s worry of troubles after change cell phone number” (H9) which only exists in Chinese market. If you want to change the mobile operator you need change your cell phone number. If you change the number, you usually face a risk that you will lose
29
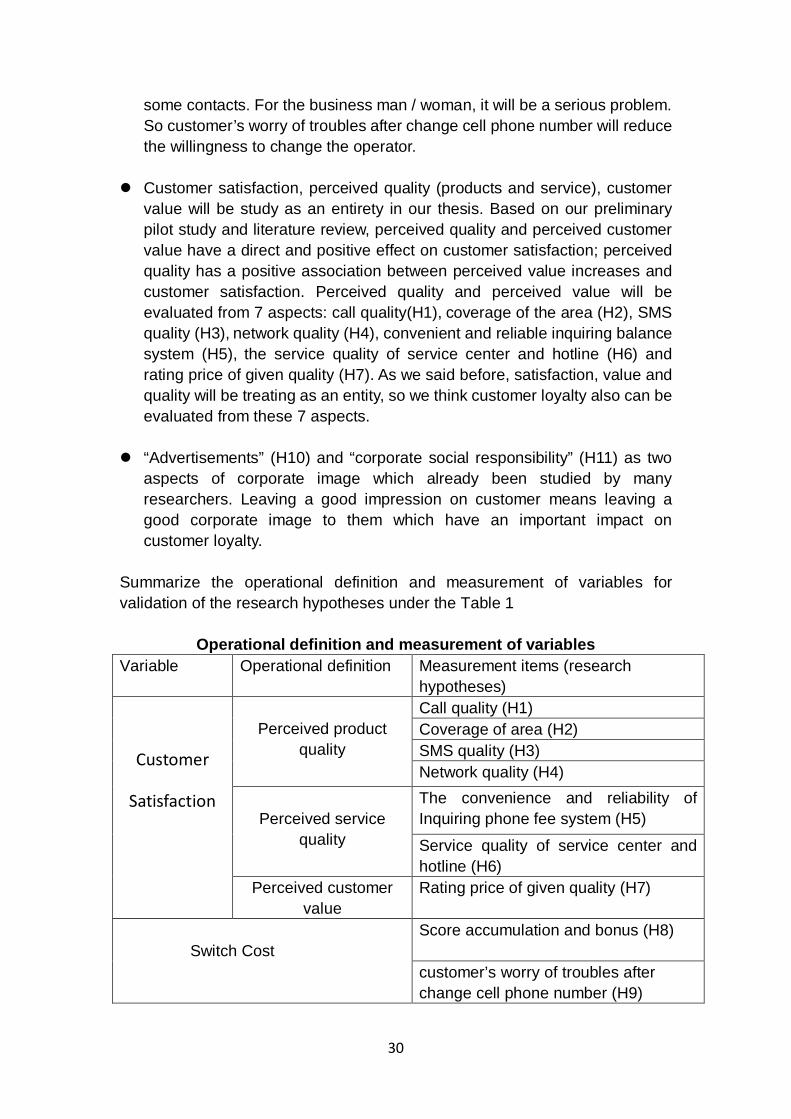
some contacts. For the business man / woman, it will be a serious problem. So customer’s worry of troubles after change cell phone number will reduce the willingness to change the operator.
Customer satisfaction, perceived quality (products and service), customer value will be study as an entirety in our thesis. Based on our preliminary pilot study and literature review, perceived quality and perceived customer value have a direct and positive effect on customer satisfaction; perceived quality has a positive association between perceived value increases and customer satisfaction. Perceived quality and perceived value will be evaluated from 7 aspects: call quality(H1), coverage of the area (H2), SMS quality (H3), network quality (H4), convenient and reliable inquiring balance system (H5), the service quality of service center and hotline (H6) and rating price of given quality (H7). As we said before, satisfaction, value and quality will be treating as an entity, so we think customer loyalty also can be evaluated from these 7 aspects.
“Advertisements” (H10) and “corporate social responsibility” (H11) as two
aspects of corporate image which already been studied by many researchers. Leaving a good impression on customer means leaving a good corporate image to them which have an important impact on customer loyalty.
Summarize the operational definition and measurement of variables for validation of the research hypotheses under the Table 1
Operational definition and measurement of variables Variable Operational definition Measurement items (research
hypotheses)
Customer
Satisfaction
Perceived product
quality
Call quality (H1) Coverage of area (H2) SMS quality (H3) Network quality (H4)
Perceived service
quality
The convenience and reliability of Inquiring phone fee system (H5)
Service quality of service center and hotline (H6)
Perceived customer value
Rating price of given quality (H7)
Switch Cost
Score accumulation and bonus (H8) customer’s worry of troubles after change cell phone number (H9)
30

Corporate Image
Advertisements about corporate image (H10) social responsibility (H11)
Table 1 4.2.2 Data collection In this paper we use questionnaires to get the first-hand data. The main reason we do that is because our theory model is a new model and some factors which we study in this thesis are not be researched by pre-researchers. We cannot get the second-hand data to analysis. The questionnaire was conducted with the totally numbers of 27 (2+12+13) questions according with our research purpose. Our questionnaire is separate into 3 parts: (1) The first part is the background information of interviewers. It consists by
two questions. One is the gender: female or male; the other is how many years have he /she been the customer of China Mobile. The descriptors ranged from “less than one year”, “1-2 years”, “2-3 years”, and “3-4 year”, “4-5 years” to “more than 5 years”.
(2) The second part is testing which factors have an important impact on
customer loyalty in the Chinese telecom industry while which factors have no important impact on loyalty. These factors were considered from 3 parts: customer satisfaction (perceived quality, customer value), switching cost and corporate image. At the beginning we hypothesized these 11 factors have an important impact on customer loyalty. Now, we use 11 questions (one hypothesis one question) to test that does each factor really has an important impact on loyalty (see table 1). The questions based on a four-point scale. The descriptors ranged from “very important”, “important” and “it does not matter” to “not important”.
(3) The third part is to see the performance of China mobile on these 11
aspects. This part aims to find out which part (factor) China Mobile performance well which part is not good and need to be improving in the future. These questions based on a five-point scale. The descriptors ranged from “Satisfy very much”, “Satisfy” and “In between”, and “Unsatisfied” to “Unsatisfied very much”.
In our study we only choose China Mobile’s customers as our interviewers. The main reason is that:
(1) China Telecom only has 2.8 million subscribers which are much lesser than China Unicom and China Mobile. So its customers will not have a great impact on Chinese mobile industry customers’ loyalty.
31

(2) China Mobile and China Unicom have the same customer groups, so there is no difference between them. China Mobile has 4 brands: like GoTone, Easy-own, M-Zone and B to B. While China Unicom also has 4 brands: U-Power, Ruyi Tong, Shijie Feng, CUConnected. They have different name of the package plan, but their aim the same group customers, for example: GoTone --- Shijie Feng: this mouthy package plan for businessman / woman. The customers can enjoy international roaming, receive emails and voice mail, browse the Internet and connect to a mobile secretary. They can even do their banking over the phone with GoTone (Shijie Feng). M-Zone --- U-Power: It is a package plan for young guys. if customers have the monthly package plan they can save a load of cash for customers. Easyown --- Ruyi Tong: its main customers are usual citizen. It’s cheap to call. B2B --- CUConnected: It is suitable for enterprises. It is very cheap for group calls.
(3) Thirdly, we take China Mobile as our study case, and survey their performance on these 9 perspectives which have important impact on customer loyalty. So interviewing China Mobile’s customers is much easier for our study.
4.2.3 Reliability & validity We had101 handouts of the questionnaire, 99 were effective questionnaires and only 2 excluded. 4.2.3.1 Reliability Reliability is the consistency of a measurement. Our questionnaires had been tested inside a small range of company at the early phase, base on the feedback both from the customers and experts. We re-organized it time by time; the forth-version was used as our final version of questionnaire which was easily to be understood and answered; to make sure all the interviewees can understand our question without any problems. We also use “repurchase and willing of recommending the operator to others” instead of “customer loyalty”, to make sure that all the interviewees can know what the questions about, no matter if they understand the phrase “customer loyalty” or not. We made a notice that only customers of China Mobile should keep taking the questionnaire in the beginning to make sure that all the interviewees are mobile users and their operator is China Mobile. Our questionnaire was conducted in the online website called Askform, http://www.askform.cn, which is a professional statistics company. Askform
32
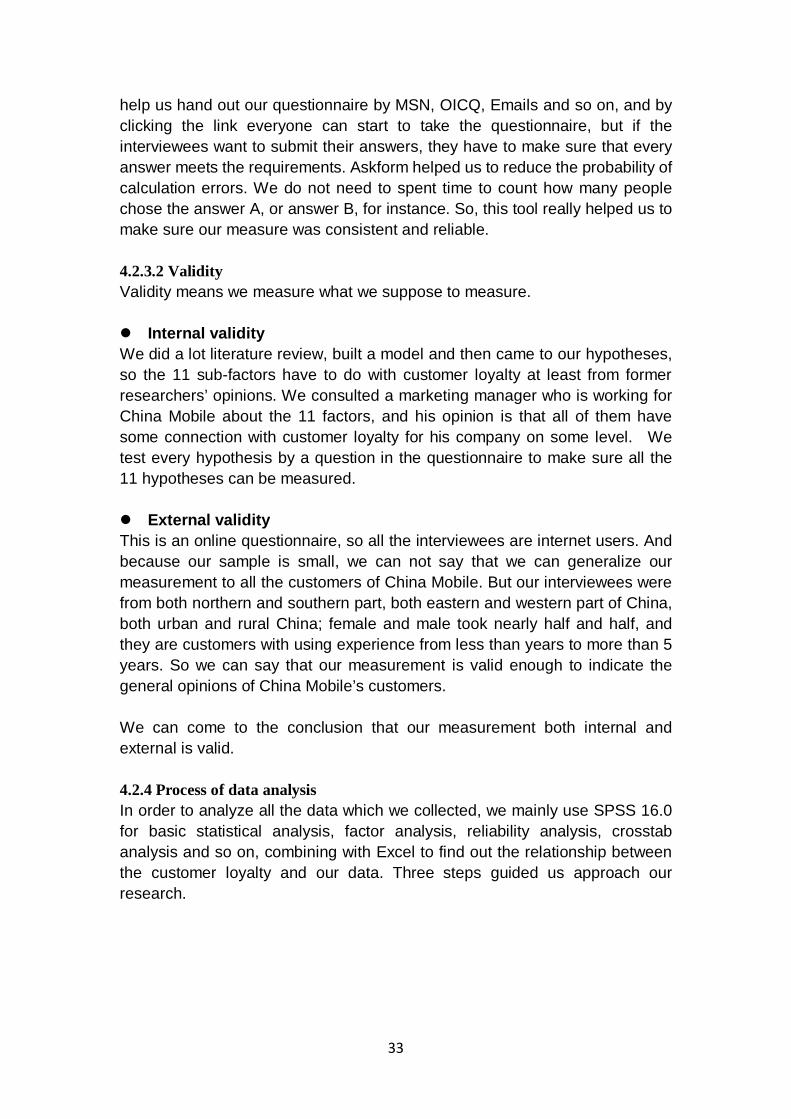
help us hand out our questionnaire by MSN, OICQ, Emails and so on, and by clicking the link everyone can start to take the questionnaire, but if the interviewees want to submit their answers, they have to make sure that every answer meets the requirements. Askform helped us to reduce the probability of calculation errors. We do not need to spent time to count how many people chose the answer A, or answer B, for instance. So, this tool really helped us to make sure our measure was consistent and reliable. 4.2.3.2 Validity Validity means we measure what we suppose to measure. Internal validity We did a lot literature review, built a model and then came to our hypotheses, so the 11 sub-factors have to do with customer loyalty at least from former researchers’ opinions. We consulted a marketing manager who is working for China Mobile about the 11 factors, and his opinion is that all of them have some connection with customer loyalty for his company on some level. We test every hypothesis by a question in the questionnaire to make sure all the 11 hypotheses can be measured. External validity This is an online questionnaire, so all the interviewees are internet users. And because our sample is small, we can not say that we can generalize our measurement to all the customers of China Mobile. But our interviewees were from both northern and southern part, both eastern and western part of China, both urban and rural China; female and male took nearly half and half, and they are customers with using experience from less than years to more than 5 years. So we can say that our measurement is valid enough to indicate the general opinions of China Mobile’s customers. We can come to the conclusion that our measurement both internal and external is valid. 4.2.4 Process of data analysis In order to analyze all the data which we collected, we mainly use SPSS 16.0 for basic statistical analysis, factor analysis, reliability analysis, crosstab analysis and so on, combining with Excel to find out the relationship between the customer loyalty and our data. Three steps guided us approach our research.
33
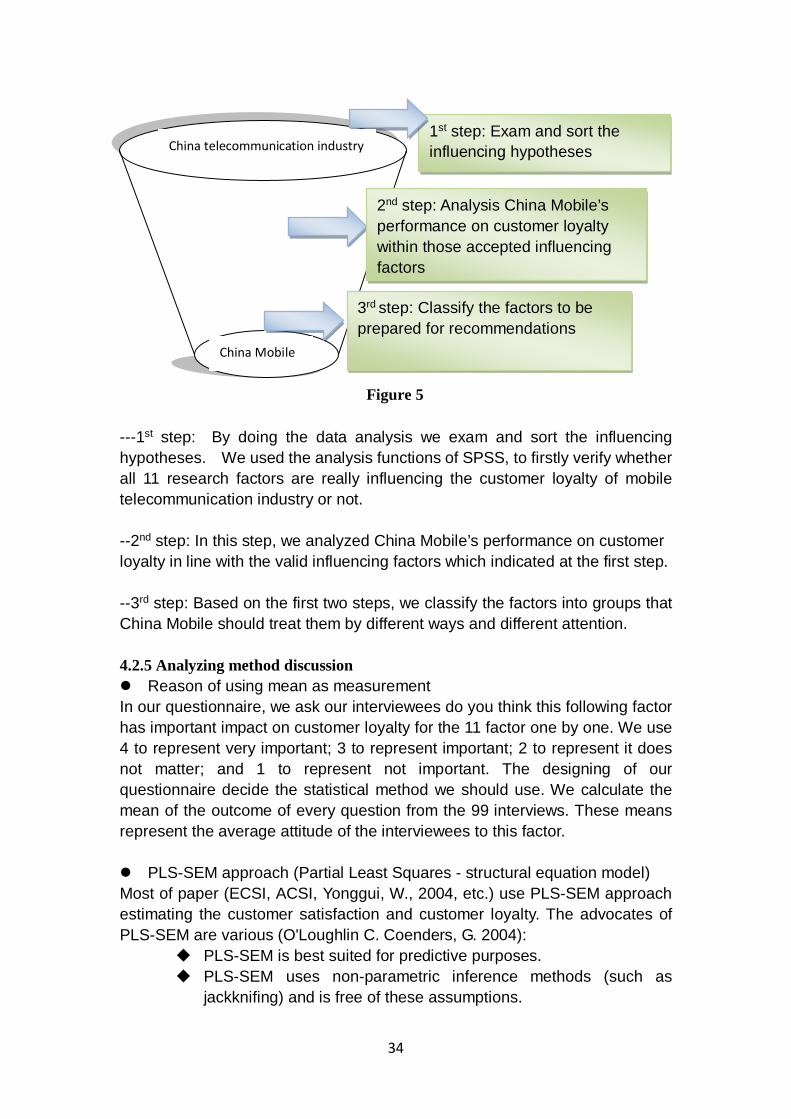
---1st step: By doing the data analysis we exam and sort the influencing hypotheses. We used the analysis functions of SPSS, to firstly verify whether all 11 research factors are really influencing the customer loyalty of mobile telecommunication industry or not. --2nd step: In this step, we analyzed China Mobile’s performance on customer loyalty in line with the valid influencing factors which indicated at the first step. --3rd step: Based on the first two steps, we classify the factors into groups that China Mobile should treat them by different ways and different attention. 4.2.5 Analyzing method discussion Reason of using mean as measurement In our questionnaire, we ask our interviewees do you think this following factor has important impact on customer loyalty for the 11 factor one by one. We use 4 to represent very important; 3 to represent important; 2 to represent it does not matter; and 1 to represent not important. The designing of our questionnaire decide the statistical method we should use. We calculate the mean of the outcome of every question from the 99 interviews. These means represent the average attitude of the interviewees to this factor. PLS-SEM approach (Partial Least Squares - structural equation model) Most of paper (ECSI, ACSI, Yonggui, W., 2004, etc.) use PLS-SEM approach estimating the customer satisfaction and customer loyalty. The advocates of PLS-SEM are various (O'Loughlin C. Coenders, G. 2004):
PLS-SEM is best suited for predictive purposes. PLS-SEM uses non-parametric inference methods (such as
jackknifing) and is free of these assumptions.
1st step: Exam and sort the influencing hypotheses
2nd step: Analysis China Mobile’s performance on customer loyalty within those accepted influencing factors
3rd step: Classify the factors to be prepared for recommendations
China telecommunication industry
China Mobile
Figure 5
34

PLS-SEM performs well in these modeling situations, which have been referred to as soft modeling.
PLS can estimate SEM where indicators affect or are affected by the latent variables.
PLS-SEM is a widely used method to measure customer loyalty; it’s also a complex and has a certain degree of difficulty. In our thesis we need to find out which factors (11 factors) have an important impact on customer loyalty. The aim of this thesis is just try to indicate some relationship between the factors and customer loyalty (not to prove the relationship). We just need to use some simple and easy way to calculate the data. So it is no need to use PLS-SEM to measure the customer loyalty. Firstly, we assume: “very important = 4”, “important =3”, “it doesn’t matter = 2”, “not important = 1”. We will use SPSS to calculate the index of mean, median, mode std. deviation, range, minimum and maximum of the given numbers. If the mean is no less than 3 we accept the factor if the mean is less than 3 we reject the actor. On the second step we analysis the relationships among using experiences and gender with hypotheses. The third step we just to calculate the percentage of the answers (“Satisfy very much”, “Satisfy”, “In between”, “Unsatisfied” and “Unsatisfied very much”).
35

Chapter 5 Data analysis
5.1 Findings We assume: “very important = 4”, “important =3”, “it doesn’t matter = 2”, “not important = 1”. We use SPSS to calculate the index of mean, median, mode std. deviation, range, minimum and maximum of the given numbers. Table 2 shows all the indexes.
Mean We use mean to evaluate the importance of every factors and then decide whether the homologous hypothesis should be accepted or not. We set 4 to represent very important and 1 to represent not important. So if the mean is close to 4 it means most of interviewees think the factor plays an important role in deciding to repurchase the same product or recommend it to others and the homologous hypothesis can be accepted; while if the mean is close to 1, it means most of interviewees think the factor does not play an important role in deciding to repurchase the same product or recommend it to others and the homologous hypothesis can be considered to be rejected. In our paper, we set important =3, very important = 4; so we accept the hypothesis whose mean is more than or equal to 3, we reject the hypothesis whose mean is less than 3. Form table 2, we can find out most of our hypothesis’s means can reach the standard (equal or more than 3), except H4 (Network quality), H8 (Troubles after change phone number). That means “network quality” and “score accumulation and bonus” don’t have big importance on customer loyalty in the mobile telecommunication sector. From the remaining 9 hypothesis we can find that the means of H1(call quality), H2 (coverage of the area), H7 (rating price of given quality), H3 (SMS quality), and H6 (the service quality of service
Hypothesizes
Mean Median Mode Std. Deviation
Range Minimum Maximum
H1 3.6768 4.0000 4.00 .53123 2.00 2.00 4.00
H2 3.6061 4.0000 4.00 .60302 2.00 2.00 4.00
H3 3.4040 4.0000 4.00 .68391 2.00 2.00 4.00
H4 2.9192 3.0000 3.00 .91112 3.00 1.00 4.00
H5 3.3535 3.0000 4.00 .67481 2.00 2.00 4.00
H6 3.4141 4.0000 4.00 .65481 2.00 2.00 4.00
H7 3.5354 4.0000 4.00 .64386 2.00 2.00 4.00
H8 2.9798 3.0000 3.00 .85690 3.00 1.00 4.00
H9 3.4040 4.0000 4.00 .71313 3.00 1.00 4.00
H10 3.3131 3.0000 4.00 .79085 3.00 1.00 4.00
H11 3.1111 3.0000 3.00 .83163 3.00 1.00 4.00
Table 2
36

center and hotline) are greater than 3.4. So the homologous factors of these five hypothesizes are in the first level which has the most important influence on customer loyalty in Chinese mobile telecom industry. Means of H9 (customer’s worry of troubles after change cell phone number), H5 (inquiring phone fee system), H10 (advertisements of corporate image), and H11 (corporate social responsibility) are between 3 and 3.4. The homologous factors of these four hypothesizes are in the second level which has secondary importance on customer loyalty in Chinese mobile telecom industry.
Hypothesizes
Accepted
Level 1
H1Call quality
H2 Coverage of the area
H7 Rating price of given quality
H3 SMS quality
H6 The service quality of service center and hotline
Level2
H9 Troubles after change cell phone number
H5 Inquiring phone fee system
H10 Advertisements of corporate image
H11 Corporate social responsibility
Rejected H8 Score accumulation and bonus
H4 Network quality
Table 3 Median Median is the average of the central pair and is calculated by arranging all the observations from lowest to highest and then picking the middle one or calculating the average of the central pair. Medians of H1Call quality, H2 Coverage of the area, H3 SMS quality, H6 The service quality of service center and hotline, H7 Rating price of given quality, H9 Troubles after change cell phone number, are 4, which means the second half of the 6 series of the observations are all 4. More than 50% of the interviewees think these 6 factors are very important. Mode Mode is the value that occurs most frequently. The Mode of H1Call quality, H2 Coverage of the area, H3 SMS quality, H5 Inquiring phone fee system, H6 The service quality of service center and hotline, H7 Rating price of given quality, H9 Troubles after change cell phone number, H10 advertisements of corporate image, are 4. This means the majority opinion of the importance of these factors on customer loyalty is very important.
37

Std. Deviation Std. deviation is a measure of the dispersion of values. A low Std. deviation means the data points tend to be very close to the mean, and high Std. deviation indicates the data are “spread out” over a large range of values. All the Std. deviations of the 11 hypothesize are less than 1, which means the data in every series are very close to their means. Data of H1Call quality, are closest to their mean 4 with a Std. deviation of 0.53123 and H4 Network quality’ s data are dispersed most among the 11 with a Std. deviation of 0.91112. Range Minimum Maximum Range is calculated by subtracting minimum value from maximum value of the given data. It represents the length of the observation. From the table we can find out those hypotheses whose range equals 2 all have a Std. deviation less than 0.7. H1Call quality, H2 Coverage of the area, H3 SMS quality, H5 Inquiring phone fee system, H6 The service quality of service center and hotline and H7 Rating price of given quality have a range of 2 which means interviewees only chose 3 of the 4 options. Combining with their minimum and maximum, we can find that all the 6 hypotheses’ minimums are 2 and maximums are 4. So interviewees only chose “very important”, “important” and “it does not matter” and not any one chose “not important”. We also ask interviewees to choose at least 5 factors, which they think are the most important factors that can affect their willing of repurchasing and recommending the service to others, out of the 11 factors. This is the bar chart illustrating the percentage of every factor.
What are the most important factors do you think for yourloyalty
94
72
58
22
51
26
49
5
22
7 7
0102030405060708090100
H1 H2 H3 H4 H5 H6 H7 H8 H9 H10 H11
Chart 1
From this chart, the top five factors are homologous factors of H1, H2, H3, H6,
38

and H7. They are call quality, coverage of the area, SMS quality, inquiring phone fee system and rating price of given quality. However, the top five from table 3 are homologous factors of H1call quality, H2 Coverage of the area, H7 Rating price of given quality, H3 SMS quality, and H6 The service quality of service center and hotline. The only difference is in terms of homologous factors of H6 and H5. We prefer the outcome of table 3 because there are 11 factors arraying together, people tend to choose the factors in the front position. H5 was arrayed ahead H6. H4 also took advantage of the arraying position it is not the least one in the chart1 but the least one in table 3. After ruling out the influence of arraying position, chart 2 is basically corresponding with table 3 except the factors regarding corporate image. H10 advertisements of corporate image and H11 corporate social responsibility are listed number 8 and 9 in table 3 but in the chart 2 they are tied for the second last. When people scoring H10 advertisements of corporate image and H11 corporate social responsibility, they think these two factors are on some level important, whereas when they choosing factors out of the 11 they do not think the two are very important any more. Of course on one hand, these two factors listed at last, so bad position bring them less attention, on the other hand, when people pick factors, they would like to choose the factors that can have more influence on their own experience of using the service and can bring them more physical interest. Corporate social responsibility can bring warfare for the whole society but people cannot feel it very much if they are not the target group. Advertisements can help corporate build good impression to customers but customers may not consider it very seriously because advertisements cannot give them cheap price, higher quality etc. So these are the reason why H10 and H11 are tied for the second last in chart 1.
5. 2 Using experience and gender’s influence We also want to find out if gender and using year can affect the outcome of the research. 5.2.1 Using experience’s influence
Less than 1 year
1-2 year 2-3 year 3-4 year 4-5 year more than 5 years
H1 3.75 3.80 3.44 3.73 3.81 3.60 H2 3.50 3.20 3.00 3.82 3.78 3.63 H3 2.75 3.40 3.00 3.73 3.63 3.33 H4 2.00 2.40 2.67 3.09 3.04 3.00 H5 3.25 3.20 3.00 3.36 3.48 3.37 H6 3.00 2.80 3.00 3.82 3.44 3.49 H7 3.50 3.20 3.33 3.64 3.56 3.58
39

H8 2.00 2.60 2.78 2.91 3.00 3.16 H9 3.00 3.20 3.33 3.27 3.56 3.42 H10 2.25 3.20 3.22 3.36 3.37 3.40 H11 2.50 2.80 2.78 3.27 3.26 3.14 Average 1 2.86 3.07 3.05 3.45 3.45 3.37 Average 2 3.00 3.43
Table 4 Table 4 shows the means in terms of using years. The second last row of the table is the average of every means within a using year group. The figures indicates that customers who have been using the service of a certain operator for no more than 3 year, generally have the opinion that the importance of the 11 factors on their repurchasing behavior and willing to recommend the operator to others, is lower but customers who have been subscribers of a certain operator, gave higher scores to the 11 factors. The average of the 11 factors’ importance to customer loyalty measured by customers with using experience no more than 3 three years, is about 3.00 but the average scored by customers with using experience more than 3 three years is about 3.43, which is 0.43 higher. In terms of every factor, table 5 shows the 11 factors’ importance to customer loyalty grouped by customers experience years (less than 3 years and more than 3 years) Less then 3 years More than 3 years Difference
H1 3.66 3.72 0.05
H2 3.23 3.74 0.51
H3 3.05 3.56 0.51
H4 2.36 3.04 0.69
H5 3.15 3.41 0.26
H6 2.93 3.58 0.65
H7 3.34 3.59 0.25
H8 2.46 3.02 0.56
H9 3.18 3.42 0.24
H10 2.89 3.38 0.49
H11 2.69 3.22 0.53
Table 5
40

0
0.5
1
1.5
2
2.5
3
3.5
4
H1 H2 H3 H4 H5 H6 H7 H8 H9 H10 H11
Less then 3 years
More than 3 years
Difference
Chart 2
Table 5 and chart 2 show that bigger differences exist in H4 Network quality, H6 Service quality of service center and hotline, H2 Coverage of the area, H3 SMS quality, and H9 Troubles after change cell phone number and all customers with using experience more than 3 years scored about 0.5 point higher than customers with using experience less than 3 year. 5.2.2 Gender’s influence
Male Female Difference
H1 3.68 3.67 0.01 H2 3.58 3.63 -0.05 H3 3.44 3.37 0.07 H4 2.86 2.98 -0.12 H5 3.36 3.35 0.01 H6 3.46 3.37 0.09 H7 3.66 3.41 0.25 H8 2.90 3.06 -0.16 H9 3.30 3.51 -0.21 H10 3.50 3.12 0.38 H11 3.24 2.98 0.26
Table 6
41

-0.5
0
0.5
1
1.5
2
2.5
3
3.5
4
H1 H2 H3 H4 H5 H6 H7 H8 H9 H10 H11
Male
Female
Difference
Chart 3 We have already stated that there is nearly no correlation between data of gender and hypothesis, which means female and male interviewees have similar opinions on the hypothesis. We can prove this conclusion by table 6 and chart 3 too. They show that there is no obvious difference between the two groups’ opinions. The greatest difference exists in H10 Advertisements of corporate image and is only 0.38.
5.3 Discussion about the case In terms of our case, China Mobile, we tested how it performed on the 11 factors. And based on our findings and the performance, we give some advises for China Mobile to increase its customer loyalty. 5.3.1 Performance of China Mobile We also researched China Mobile’s performance of the 11 homologous factors of hypothesizes. The results are shown in the following table:
Do you satisfy with China Mobile's performance on these factors
Satisfy very much
satisfy In between
Not satisfy
Not satisfy very much
Generally Satisfy
Generally not Satisfy
Quality of phone call
4% 60% 34% 1% 1% 64% 2%
Coverage
4% 53% 4% 3% 0% 57% 3%
Quality of SMS 4% 54% 36% 5% 1% 58% 6%
42

Inquiring phone fee system
3% 38% 45% 10% 4% 41% 14%
Customer service
1% 26% 67% 3% 3% 27% 6%
Rating price of given quality 1% 16% 47% 25% 11% 17% 36%
Advertisements about corporate image
2% 29% 62% 7% 0% 31% 7%
Corporate social responsibility
1% 44% 50% 4% 1% 45% 5%
Table 7 This table illustrates how China Mobile performed on eight factors. Totally we have 11 homologous factors of hypothesizes. But we have rejected two factors as important factors on customer loyalty. Because China does not have MNP in the national wide, customers would still face to the troubles after changing cell phone number and China Mobile cannot break the rule by itself, thus customers do not have an evaluation on this factor for China Mobile’s preference. Interviewees’ opinion on China Mobile’s preference was collected from five levels: satisfy very much, satisfy, in between, not satisfy, and not satisfy very much. Percentage of generally satisfy equals percentage of satisfy very much plus percentage of satisfy; percentage of generally not satisfy equals percentage of not satisfy plus percentage of not satisfy very much. From the table, we can tell that generally, more than 50% of customers satisfy with China Mobile’s preference on quality of phone call, coverage, quality of SMS, which means that China Mobile did well in these three aspects. There are 36% of customers do not satisfy with China Mobile’s preference on rating price of given quality.
5.3.2 Discussion China Mobile did well in its primary and widely used services: phone call and SMS. The majority of customers are satisfied with those services. The majority of opinion to customer service, corporate social responsibility, advertisements about corporate image, rating price of given quality and inquiring phone fee system are in between, which means there are still room for improvement for those 5 factors. Among them, customer service, corporate social responsibility and advertisements about corporate image, more than or equal to half of the interviewees neither think China Mobile did really well nor really bad. Around 40% of the interviewees are satisfied with the inquiring phone fee system, and 14% are unsatisfied. 36% of interviewees are not satisfied with China Mobile’
43
preference on rating price of given quality, and this is much more than any other factors score in “generally not satisfy”. Combine with the finding of our research, to increase customer loyalty, China Mobile should: (1) Keep its good performance on quality of phone call, coverage, quality of SMS and pay attention on these three areas because they are in the first level, which means they have great importance on customer loyalty (2) Improve its performance on customer service, advertisements about corporate image, inquiring phone fee system and corporate social responsibility and pay more attention on customer service, because it is in the first level. (3) Improve its performance on rating price of given quality significantly and pay great attention on this factor.
44

Chapter 6 Conclusion and Further research
6.1 Conclusion The purpose of this study was to investigate what factors have an important influence on customer loyalty in the Chinese mobile telecommunication service sector. We chose China Mobile as the case to study the situation of the mobile telecom industry. Based on the previous researches on customer loyalty, we represented an investigative model of customer loyalty and selected 11 sub factors only from mobile telecom service sector to study their importance on customer loyalty. We also investigated how China Mobile preformed on the 11 factors, and then gave some recommendation to China Mobile to increase its customer loyalty. Firstly, there is the conclusion researched on hypothesizes. According to our study, call quality, coverage of the area, rating price of given quality, SMS quality, service quality of service center and hotline, troubles after change cell phone number, inquiring phone fee system, advertisements of corporate image, and corporate social responsibility have important influence on customer loyalty in Chinese mobile telecom sector. Among them, call quality, coverage of the area, rating price of given quality, SMS quality, service quality of service center and hotline constitute the first level, which have a greater influence on customer loyalty than the second level which includes troubles after change cell phone number, inquiring phone fee system, advertisements of corporate image, and corporate social responsibility and has secondary effect on customer loyalty. We also find out that gender has low impact on hypothesis but using years has a higher impact on them. Customers, who have using experience more than 3 years, put greater importance on the 11 factors than customers who have using experience within 3 years.
Secondly, Chinese mobile telecommunication sector has similarities and differences on affecting factors to customer loyalty comparing with the general situation of other countries. Call quality, coverage of area rating rice of given quality, and service quality of service center and hotline are important to customer loyalty in general. Because of low price, Chinese customers like to send SMS, so SMS quality is important in China. Moreover, because we do not have MNP, troubles after changing numbers when switching operators will bring inconvenience to customers, therefore, troubles after change cell phone number do exist and have important influence on customer loyalty. Thirdly, in terms of China Mobile, it did well on areas of quality of phone call, coverage, and quality of SMS, but did not so well on rating price of given quality.
45

6.2 Recommendation
We have classified the eight factors into three categories: keep its good performance, improve its performance and improve its performance significantly. In this section, we will give some recommendations for China Mobile category by category. 6.2.1 Keep its good performance The 3 factors in this kind are all very important for customer loyalty and they represent the quality of primary service. China Mobile can keep and increase its good preference by the following ways: Use advanced techniques to improve the phone call quality
Increase the network coverage especially in the rural areas
Increase the number of limitation of character in one piece of SMS. Now,
for one piece of SMS, customers can only send 70 characters (including punctuation) in one piece of SMS and this is seemed to be a little few especially for people who like to chat by SMS
6.2.2 Improve its performance Increase the accuracy of inquiring results. Now, customers can use SMS,
phone call, internet service hall to inquire telephone fee, these multiple ways can meet the demand of customers in terms of means, but the results are sometimes wrong, and customers are unsatisfied with these mistakes.
Increase the quality of staffs training, especially the ones for employees
who are working in the service center. Their service attitude and work efficiency play an important role in the service quality of China Mobile
Not only be sponsor of recreational and sports activities but be an active participant of charity events to establish a good corporate image
Not only advertise its product but also advertise itself and it should add
corporate culture into these kind of commercials 6.3.3 Improve its performance significantly Besides the local phone fee, there are long distance fee and mobile roaming service charges which are much expensive than the local. Long distance fee is occurred when the phone call is made outside a certain area; roaming charges occurred when the caller travel outside a certain local area and make phone call. For China Mobile, “the certain area” refers to a city, and that means when customers make a phone call outside their own cities or make phone call in another city, even this city is in the same province, they have to pay extra money. Nowadays, people travel a lot, so long distance fee and mobile
46

roaming service charges can make the phone fee much higher and then make the customers feel the rating price of given quality of China Mobile is high. China Mobile can consider that firstly expand the rage of “the certain area” to a province or decrease the price level.
6.3 Limitations and further research The results of this study must be interpreted in view of certain limitations. Due to the time constrains, we spent a lot of time in the Literature review and hypothesis questionnaire formulation. We do not have enough time to gather more data. Meanwhile, the limitation of our research is number & scale of sample, only gathering the totally 99 value incoming data, then by we use all the data analysis to assume the future, because the changes of the market is so fast, so if we still have chance to perfect our work, we are going to make the a large scale and quantitative survey. In this thesis we only choose China Mobile’s customers as our interviewees. But it maybe has some difference among these three operators’ subscribers. So the further research can interview 3 operators’ subscribers, and to find out is there really differences among them. Most of our interviewees are young generation (less than 35 years old); their opinion is a little different with the elders (more than 35 years old subscribers). So it can also be done in the future.
47

Appendix Questionnaire
Part 1. Background information of responders 1. What is you Gender?
Male Female 2. How long have you been customer of China Mobile? ---Less than 1 year --1-2 years --2-3years --3-4 years --4-5 years --more than5 years Part 2 Do you think the performance of the following factors in the current Chinese mobile telecommunication market will influence your loyalty ---- repurchasing intention and willingness to recommend the products and service to others --- to a mobile operator (China Mobile and China Unicom)? 1 Quality of phone call e.g. Call clarity ,connection/ Signal Quality
--Very important --Important --Does not matter --Not important
2 Quality of phone call e.g. Call clarity ,connection/ Signal Quality Coverage of areas
--Very important --Important -- Does not matter --Not important
3 Quality of SMS (e.g. SMS sending speed , character number limitation of text and so on)
--Very important --Important --- Does not matter --Not important
4 Network quality such as Mobile internet ,Value-added services
--Very important --Important --- Does not matter --Not important
5 The convenience and reliability of Inquiring phone fee system
-Very important --Important --- Does not matter --Not important
6 The service quality of service center and hotline --Very important --Important --- Does not matter
48
--Not important
7 Rating price of given quality -Very important --Important --- Does not matter --Not important
8 Score accumulation plan and bonus Mileage program ( free call, free SMS
as bonus or awards) -Very important --Important --- Does not matter --Not important
9 Be afraid of troubles after changing your cell phone number --Very important --Important --- Does not matter --Not important
10 Social responsibility (e.g. Social charity activities) -Very important --Important --- Does not matter --Not important
11 Advertisements about corporate image e.g. Brand image (e.g.M-Zone, Easy-own and GoTone) - Very important --Important --- Does not matter --Not important
12 Within all those 11influencing factors above. Which are the main factors you are really concerning when you decide to loyal to one specific brand/company? Please choose at least 5 main factors. --Call quality -- Coverage of area -- Quality of SMS (sending speed , limitation of text) -- Network quality e.g. Value-added services
--The convenient of Inquiring phone fee system -- The service quality of service center and hotline -- Rating price of given quality -- Worry of troubles after changing phone number --Loss of benefits of score accumulation and bonus
-- Social responsibility (e.g. Social charity activities) -- Advertisements such as Brand image (e.g. M-Zone, Easy-own and
GoTone) Part 3, Do you satisfy with the performance of China Mobile in the following facts?
1 In General, do you satisfy with China mobile’s service? --Satisfy very much --Satisfy --- In between
49

-- Unsatisfied -- Unsatisfied very much
2 In specific , do you satisfy with China Mobile’s A. Quality of phone call --Satisfy very much --Satisfy --- In between -- Unsatisfied -- Unsatisfied very much B. The coverage of area --Satisfy very much --Satisfy --- In between -- Unsatisfied -- Unsatisfied very much
3 Quality of SMS (e.g. SMS sending speed , character number limitation
for text messages and so on) -- Satisfy very much --Satisfy --- In between -- Unsatisfied --- Unsatisfied very much
4 Do you satisfy with the internet services from China Mobile (e.g. mobile Internet surfing, personalize ring tones, cell phone newspaper, weather forecasting. wireless music club, mobile Fetion, etc)?
-- Satisfy very much --Satisfy --- In between -- Unsatisfied -- Unsatisfied very much
5 Inquiring phone fee system -- Satisfy very much --Satisfy --- In between
-- Unsatisfied --- Unsatisfied very much
6 Do you satisfy with China Mobile’s service of hotline and service center (customer’s service hotline10086). -- Satisfy very much --Satisfy --- In between
-- Unsatisfied ---- Unsatisfied very much
7 Rating price of given quality -- Satisfy very much --Satisfy --- In between
-- Unsatisfied -- Unsatisfied very much
8 Have you joined any commercial promotional activities held by China Mobile Yes No
9 For the actives that you have joined, do you satisfy with them?(e.g. Score accumulation and bonus, award free call, free SMS)
-- Satisfy very much --Satisfy --- In between -- Unsatisfied -- Unsatisfied very much
10 Have you ever seen or heard of China Mobile's advertisements (For
50

example: posters, leaflets, newspaper, magazines or television media advertisements.) Yes No
11 Do you satisfy with China Mobile’s advertisements? -- Satisfy very much --Satisfy --- In between
-- Unsatisfied --- Unsatisfied very much
12 Do you satisfy with the attitudes and performances of China Mobile on taking social responsibility
-- Satisfy very much --Satisfy --- In between -- Unsatisfied ---- Unsatisfied very much
13 Will you recommend your family or friends the telecom service of China Mobile you are currently using? Yes No
51

Reference ACSI: Fornell, C. Johnson, M. D., 1996. The American customer satisfaction index: Nature, purpose, and findings, Journal of Marketing, 60. 7-19 Ahn, J. H., Han, S. P., Lee Y. S., 2006. Customer churn analysis: Churn determinants and mediation effects of partial defection in the Korean mobile telecommunications service industry, Telecommunications Policy, 30, 552-569. Amine, A., 1998. Consumers’ true brand loyalty: the central role of commitment, Journal of Strategic Marketing. 6. 305-319 Anderson, E. W. Sullivan, M. W. 1993. The antecedent and consequences of customer satisfaction for firms. Marketing Science, 12. 125-144. Andreasen, A. Drumwright, M. 2001. In: Andreasen, A. (Ed.), Alliances and Ethics in Social Marketing in Ethical Issues in Social Marketing. Washington, DC: Georgetown University Press, Andres K. 2007, Affecting customer loyalty: do different factors have various influences in different loyalty levels?, University of Tartu - Faculty of Economics & Business Administration Working Paper Series. 58. 3-30. Aydin, S. Ozer, G. Arasil, O. 2005, Customer loyalty and the effect of switching costs as a moderator variable: A case in the Turkish mobile phone market. Marketing Intelligence & Planningl. 23. 89-103. Bandyopadhyay, S. Martell, M. 2007. Does attitudinal loyalty influence behavioral loyalty. Journal of Retailing & Consumer Services. 14. 35-45. Barich, H. Kotler, P. 1991, A framework for marketing image management, Sloan Management Review. 32.94-104. Bitner, M. J. Hubbert, A. R. 1994. Encounter Satisfaction versus Overall Satisfaction versus Quality, Service Quality New Directions in Theory and Practices. London: Sage Publications. 72-95. Blodgett, J.G. Hill, D.J. Tax, S.S. 1997, The effects of distributive, procedural, and interactional justice on post-complaint behavior, Journal of Retailing. 31. 185-210. Bodet, G. 2008. Customer satisfaction and loyalty in service: Two concepts, four constructs, several relationships. Journal of Retailing & Consumer Services. 15. 156-163.
52

Brady, M.K. Cronin, J.J. Brand, R.R. 2002. Performance-only measurement of service quality: a replication and extension. Journal of Business Research. 55. 17-31. Brown, T.J. Dacin, P.A. 1997. The company and the product: corporate associations and consumer product responses. Journal of Marketing, 6. 68–84. Brunner T. A. Stöcklin, M. Opwis, K. 2008. Satisfaction, image and loyalty: new versus experienced customers. European journal of marketing. 42. 1095-1105. Burnham, T. A., Frels, J. K., Mahajan, V., 2003. Consumer switching costs: a typology antecedents, and consequences, Journal of the Academy of Marketing Science, 31, 109-126. Butcher, K. Sparks, B. O'Callaghan, F. 2001, Evaluative and relational influences on service loyalty. International Journal of Service Industry Managemental. 12. 310-328.
Capizzi, M. T., Ferguson, R., 2005. Loyalty trends for the twenty-first century. Journal of Consumer Marketing, 22, 72-81.
Caruana, A. 2004. The impact of switching costs on customer loyalty: A study among corporate customers of mobile telephone. Journal of Targeting, Measurement & Analysis for Marketing. 12. 256-269.
Cary W., Adams A., 2009. Customer satisfaction and customer loyalty are the best predictors of customer retention. Online Journal. Available from: http://www.adamssixsigma.com/Newsletters/customers_results.htm
(accessed 5, May 2009) Cassel, C., Eklof, 2001. Modeling customer satisfaction and loyalty on aggregate levels: Experience from the ECSI pilot study. Total Quality Management, 12, 834-841. Chaudhuri, A. Holbrook, M. B. 2001. The Chain of Effects from Brand Trust and Brand Affect to Brand Performance: The Role of Brand Loyalty. Journal of Marketing. 65. 81-94. Chen J. S. Ching, R. 2006. The Study of Mobile Customer Relationship Management and Loyalty. 2006 International Conference on Service Systems and Service Management. 1. 67-72 Chris, D. Anne, G. Nigel, W. 1998. Barclays Life customer satisfaction and loyalty tracking survey: a demonstration of customer loyalty research in practice. Journal of International Journal of Bank Marketing. 16. 287 – 292. Chwo-ming, Y., Lei-yu, W., Yu-ching, C., Hsing-shia, T., 2005. Perceived quality,
53

customer satisfaction, and customer loyalty: the case of lexus in Taiwan. Total quality management & business excellence, 16, 707-719 Dick, A. S. Basu, K. 1994. Customer loyalty: toward an integrated conceptual framework. Journal of the Academy of Marketing Science. 22. 99-1 13. Dodds, W. B. Monroe, K. B. Grewal, D. 1991. Effects of Price, Brand, and Store Information on Buyers' Product Evaluations. Journal of Marketing Research. 28. 307-320. Dowling, G. R., Uncles, M., 1997. Do Customer Loyalty Programs Really Work? Sloan Management Review, 38, 71-83 Ehrenberg, A.S.C. Norman ,P. 1991. Repeat buying—facts, theory and applications. The Statistician. 40. 349-350. Ehrenberg, Goodhardt G.J., 1997. Understanding Buyer Behavior. New York: J. Walter Thompson and the Market Research Corporation of America. ECSI (1998): European Customer Satisfaction Index------Foundation and Structure for Harmonised National Pilot Projects. Report prepared by ECSI Technical Committee. ECSI Document, No. 005, 1 20- 11- 98. Gerpott, T; Rams, W; Schindler, A, 2001. Customer retention, loyalty and satisfaction in the German mobile cellular telecommunications market. Telecommunications Policy. 25. 249–269. Groholdt, L. Martensen, A. Kristensen, K. 2000. The relationship between customer satisfaction and loyalty: Cross-industry differences. Total Quality Management. 11. 509-514. Hu, H. H. Kandampully J. Juwaheer T. D. 2009. Relationships and impacts of service quality, perceived value, customer satisfaction, and image: an empirical study. Service Industries Journal. 29. 111-126. Jacoby, J. Chestnut, R. 1978. Brand Loyalty: Measurement and Management. New York: Wiley. Jacoby, J. Kyner, B. 1973. Brand loyalty versus repeat purchasing behaviour. Journal of Marketing Research. February. 1-9. Jay K. 2007, Do hoteliers need to manage image to retain loyal customers. International Journal of Contemporary Hospitality Management. 19. 435-443.
54

Jennifer K., 2008. Is customer loyalty an outdated concept. Journal of Consumer Marketing Jia, S. H. Yan., H. R. 2005. Empirical analysis on the forming model of customer loyalty: the case study of mobile communication service, Systems and Services Management, 2005 International Conference on. 1, 133-137 Jones, M. A. Mothersbaugh, D. L. Betty, S. E. 2000. Switching barriers and repurchase intentions in services. Journal of Retailing. 76. 259–272. Jones, M. A. Suh, J. 2000. Transaction-specific satisfaction and overall satisfaction: an empirical analysis. Journal of Services Marketing. 14. 147-160. Jones, T.O. Sasser, W.E. 1995. Why satisfied customers defect. Harvard Business Review. 73. 88-102. Kashyap, R. Bojanic, D. C. 2000. A structural analysis of value, quality, and price perceptions of business and leisure travelers. Journal of Travel Research. 39. 45-52. Keller, K.1993. Conceptualizing, measuring, and managing customer based equity. Journal of Marketing. 57. 1-22. Kim M. K., Park, M. C. Jeong, D. H. 2004. The effects of customer satisfaction and switching barrier on customer loyalty in Korean mobile telecommunication services. Telecommunications Policy. 2. 145-159. Kim, Y. P. Lee, S. H. Yun, D. G. 2004. Integrating current and competitive service-quality level analyses for service-quality improvement programs, Managing Service Quality. 14. 288-296. Lee J. KimY. Lee, J.D. Park Y. 2006. Estimating the extent of potential competition in the Korean mobile telecommunications market: Switching costs and number portability. International Journal of Industrial Organization, 24, 107-124. Lee, J. Feick, L. 2001. The impact of switching costs on the customer satisfaction-loyalty link: Mobile phone service in France. Journal of Services Marketing. 15. 35–48. Li, L. 2008. Study of the Relationship between Customer Satisfaction and Loyalty in Telecom Enterprise. 4th International Conference on Wireless Communications, Networking and Mobile Computing, 1-7. Long, Y. L. Jen, C. 2004. An Integrated Analysis of Relationship between Service Quality, Relationship Quality, Relationship Value and Customers' Loyalty-An Example
55

of Consumers of Mobile Telecommunication Industry. Tamsui Oxford Journal of Economics and Business. 12. 73-112. MacInnis, D.J. Price, L.L. 1987. The role of imagery in information processing: review and extensions. Journal of Consumer Research. 13. 473-91. Martensen, A. Gronholdt, L. Kristensen, K. 2000, The drivers of customer satisfaction and loyalty: cross-industry findings from Denmark. Total Quality Management. 11. 544-553. Monroe, K. B. 1990. Pricing: Making Profitable Decisions. New York: McGraw-Hill.
Muller, E., 1998. Customer loyalty programs. Sloan Management Review, 39, 4-6.
Nguyen, N. Leblanc, G. 2001, Corporate image and corporate reputation in customers’ retention decisions in services. Journal of Retailing and Consumer Services. 8. 227-36. Nguyen, N. Leblanc, G. 2001. Corporate image and corporate reputation in customers' retention decisions in services. Journal of Retailing and Consumer Services. 8. 227-36. Oh, H. Parks, C. S. 1997. Customer satisfaction and service quality: A critical review of the literature and research implications for the hospitality industry, Hospitality Research Journal. 20. 36-64. Oh, H. 1999, Service quality, customer satisfaction, and customer value: A holistic perspective. International Journal of Hospitality Management. 18. 67-82. Oliver, R. L. 1997. Satisfaction: A behavioural perspective on the consumer. New York: McGraw Hill. Oliver, R. L. 1980. A cognitive model of the antecedents and consequences of satisfaction Decisions. Journal of Marketing Research. 17. 460-470. Oliver, R. L. 1999. Whence consumer loyalty. Journal of Marketing. 4. 33-45. O'Loughlin C. Coenders, G. 2004. Estimation of the European Customer Satisfaction Index: Maximum Likelihood versus Partial Least Squares. Application to Postal Services. Total Quality Management & Business Excellence. 15. 1231-1255. Parasuraman, A. Zeithaml, V. A. Berry, L. L. 1988. SERVQUAL: A Multiple-Item Scale for Measuring Consumer Perceptions of Service Quality. Journal of Retailing. 64. 12-41. Porter, M.E. 1980. Competitive Sh-ategy; Techniques for analyzing industries and
56
competitors. New York: Macmillan Ramneck, k. Preety, M. 2008. Telecom fairytale-Customer Loyalty. GNIMT Model Town, Ludhiana. Retrieved in 15th May, Available from: http://www.scribd.com/doc/4705254/A-Telecom-fairytaleCustomer-Loyalty [Accessed 20 May 2009]. Rosenberg, L. Czepiel, J.A. A. 1984. Marketing approach to customer retention. Journal of Consumer Marketing. 1. 45-51. Rundle, T. S. 2005. Elaborating customer loyalty: exploring loyalty to wine retailers. Journal of Retailing and Consumer Services. 12. 333-345. Scitovszky, Tibor. 1945. Some Consequences of the Habit of Judging Quality by Price. Review of Economic Studies. 12. 100-105. SCSB: Fornell, C., 1992. A national customer satisfaction barometer: The Swedish experience, Journal of Marketing, 56. 6-22. Selnes, F., 1993. An examination of the effect of product performance on brand reputation, satisfaction and loyalty, European Journal of Marketing, 27, 19-35. Serkan, A., Gokhan O., 2005. The analysis of antecedents of customer loyalty in the Turkish mobile telecommunication market, European Journal of Marketing, 39, 910-925. Shuai, Z., Zhen, L., 2008. How to enhance customer loyalty. Xi An university. Business Management department. China, 15 -17. Soderlund, M., 1998. Customer satisfaction and its consequences on customer behavior revisited. International Journal of Service Industry Management, 9, 169-188. Teas, R. K., 1993. Expectations, performance evaluation, and consumers' perceptions of quality, Journal of Marketing, 57,18-35. Teas, R. K., Agarwal, S., 2000. The Effects of Extrinsic Product Cues on Consumers' Perceptions of Quality, Sacrifice, and Value, Journal of the Academy of Marketing Science, 28, 278-291. Ueltschy, L.C., Laroche, M., Eggert, A., Bindl, U., 2007. Service quality and satisfaction: an international comparison of professional services perceptions. Journal of Services Marketing, 21, 410-423 Wang, J. J., 2009. Report of Chinese telecom industry, Panorama Financial Search,
57

Available rom: http://search.p5w.net/pdf/Res/CN_RES/INDUS/2009/1/8/c017be7e-9dd7-4f05-b1e7-0560de0d9ed8.pdf [Accessed 22 March 2009]. Woodruff, R.B., 1997. Customer value: The next source for competitive advantage. Journal of the Academy of Marketing Science, 25, 139-154. Xiaoli, X., Yinghong, W., Zhijian, H., Hui, L., 2006. The impact of service quality, satisfaction, value and switching barrier on customer loyalty in Chinese airline industry. International Conference on Service Systems and Service Management, 2, 1316-1321. Yonggui W., Lei D., Shunping H., Guicheng S., 2005. The dimensions of customer loyalty and its key drivers: an integrated framework in perspective of customer equity management, Services Systems and Services Management. Proceedings of ICSSSM '05. 2005 International Conference on, 1, 204-210. Yonggui, W., Hing-Po, L., Yongheng, Y., 2004. An integrated framework for service quality, customer value, satisfaction: Evidence from China's telecommunication industry. Information Systems Frontiers, 6, 325-340. Yuille, J.C., Catchpole, M.J., 1977. The role of imagery in models of cognition. Journal of Mental Imagery, 1, 171-80. Yuksel A., Yuksel F., 2001. Measurement and Management Issues in Customer Satisfaction Research: Review, Critique and Research Agenda: Part One. Journal of travel and tourism marketing, 10, 47-80. Zairi, M, 2000. Managing Customer Dissatisfaction through Effective Complaint management Systems. The TQM Magazine,12, 331-335. Zeithaml, V. A., 1988. Consumer Perceptions of Price, Quality, and Value: A Means-Ends Model and Synthesis of Evidence. Journal of Marketing, 52, 2-22.
58