how to mitigate the effects of scour on bridge piers ... · iv andrew c raleigh abstract...
TRANSCRIPT

iii Andrew C Raleigh
University of Southern Queensland
Faculty of Engineering and Surveying
How to Mitigate the Effects of Scour on Bridge
Piers Through the Use of Combined
Countermeasures
A dissertation submitted by
Andrew Christopher Raleigh
In fulfillment of the requirements of
Courses ENG 4111 and 4112 Research Project
Towards the Degree of Bachelor of Engineering (Honours)
Major Civil Engineering

iv Andrew C Raleigh
Abstract Construction of a bridge pier in a flow of water will cause a disruption to the flow.
Scour around bridge piers arises due to the separation of this water causing erosion of
the sediment at the bridge pier and leading to the development of both horseshoe and
wake vortices around the pier. The relationship between water and bridge piers in
flowing streams creates a three dimensional field of flow. There is an additional
pressure head upstream of the pier as the water hits the bridge pier which then curves
downwards into the scour hole and a horseshoe vortex is formed. The accumulation
of flowing water on the surface pushes back and creates a bow wave. The water also
deviates around the pier as it continues its downstream flow and produces a shedding
wake vortex. Local scouring occurs due to the action of the horseshoe and wake
vortices. Local scour is the immediate change in the bed level surrounding an
obstruction due to the restriction or change in the natural flow path. This reduction in
the depth of bed level is called scour depth. Scour causes significant structural
unpredictability. The bridge foundations are weakened and may eventually cause
overall failure of the structure especially when there are floods as the volume and
intensity of the moving flow increases so rapidly. Researchers have been trying for
quite a long time now to find ways to reduce this scour occurring and thus increase
the safety of bridge piers.
Experimentation to understand the scour process and the damage a horseshoe vortex
causes is usually conducted in laboratories using straight flumes. Results of some
studies noted in this literature review showed that the maximum depth of scour was
highly dependent on the amount of time for which the experiment was conducted. It
also identified that as the flow rate increased so did the level of erosion. Several
engineering designs relating to this topic have been tested over the years and they are
becoming more successful with time and research. Bridges are very necessary in our
modern world so engineers must study the best ways to install bridge piers to create
the least disturbance to natural or man-made waterways in turn reducing erosion
around the pier.
This research was developed to understand and consequently aim to reduce scour
through the economical design and best use of countermeasures around bridge piers.
v Andrew C Raleigh
The project identified, through a literature review and design analysis, three combined
countermeasures for bridge piers. Initially countermeasures were built for testing in
the large flume. After preparing the large flume for testing and commencing the
control test the large flume unfortunately failed. Due to this misfortune models were
then built and tested in the small flume. The results compared the control pier and
each separate countermeasure with the amount of erosion which occurred. A control
pier for the purpose of this research was a circular pier without any countermeasure.
Volumes and dimensions were calculated using a laser scanner (FARO) then further
processed and modelled using mining software. These volumes were used identify
the greatest reduction in erosion. These outcomes all showed a decrease in erosion
when compared with the control pier but one combined countermeasure in particular,
three collars and a plate, showed the greatest reduction but did not totally deny scour.
Results show that an effective reduction in local scour can be achieved through the
use of three collars as a combined countermeasure but not totally eliminated.

vi Andrew C Raleigh
Limitations of Use
The Council of the University of Southern Queensland, its Faculty of Health,
Engineering and Sciences, and the staff of the University of Southern Queensland,
do not accept any responsibility for the truth, accuracy or completeness of
material contained within or associated with this dissertation.
Persons using all or any part of this material do so at their own risk, and not at
the risk of the Council of the University of Southern Queensland, its Faculty of
Health, Engineering and Sciences or the staff of the University of Southern
Queensland.
This dissertation reports an educational exercise and has no purpose or validity
beyond this exercise. The sole purpose of the course pair entitled “Research
Project” is to contribute to the overall education within the student’s chosen
degree program. This document, the associated hardware, software, drawings,
and other material set out in the associated appendices should not be used for
any other purpose: if they are so used, it is entirely at the risk of the user.

vii Andrew C Raleigh
Certification of Dissertation I certify that the ideas, designs and experimental work, results, analyses and
conclusions set out in this dissertation are entirely my own effort, except where
otherwise indicated and acknowledged.
I further certify that the work is original and has not been previously submitted
for assessment in any other course or institution, except were specifically stated.
Andrew Raleigh U1026255

viii Andrew C Raleigh
Acknowledgements This research has been carried out under the supervision of Dr Joseph Foley. I would
like to personally thank him for his invaluable mentoring throughout this project. His
insights and discussion of the subject were always very helpful.
Acknowledgment and thanks also to Chris Power, Technical Officer, for the
assistance given to understand and interpret the FARO scene software information.
Thanks to Terry Byrne who allowed me to use the 3D printer and made the models
for the small flume, and Dan Eising for his invaluable assistance in the Hydraulics
Laboratory.

ix Andrew C Raleigh
Table of Contents
Abstract ................................................................................................................................................................ iv
Limitations of Use ............................................................................................................................................. vi
Certification of Dissertation ........................................................................................................................ vii
Acknowledgements ...................................................................................................................................... viii
List of Figures .................................................................................................................................................................... 1 List of Tables ...................................................................................................................................................................... 3 Nomenclature .................................................................................................................................................................... 4
1.0 Introduction ................................................................................................................................................. 5
1.1 Objectives ................................................................................................................................................................ 5
2.0 Literature Review ................................................................................................................................... 7
2.1 Outline of Scour ........................................................................................................................................................ 7 2.1.1 Clear Water Scour ........................................................................................................................................... 9 2.1.2 Live Bed Scour ................................................................................................................................................... 9
2.2 Vortex shedding ........................................................................................................................................................ 9 2.2.1 Horseshoe Vortex ............................................................................................................................................. 9 2.2.2 Wake Vortex ..................................................................................................................................................... 10
2.3 Sediment transportation ................................................................................................................................... 11 2.4 Flow around piers and how piers affect flow ........................................................................................... 11 2.5 Hydraulic theory.................................................................................................................................................... 12 2.5.1 Flow Classifications and Flow Regimes. .................................................................................................. 12
2.5.2 Steady and Unsteady Flows ....................................................................................................................... 12 2.5.3 Uniform and Non-uniform Flows ............................................................................................................. 12 2.5.4 Flow classification ......................................................................................................................................... 13 2.5.5 Reynold’s Number .......................................................................................................................................... 13 2.5.6 Velocity Disturbance across an Open Channel ................................................................................... 14 2.5.7 Froude Number ............................................................................................................................................... 15 2.5.8 Flow Separation ............................................................................................................................................. 15
2.6 Theoretical Checks ............................................................................................................................................... 16 2.6.1 Critical Mean Velocity .................................................................................................................................. 16 2.6.2 Pier Scour depth ............................................................................................................................................. 17 2.6.3 Sediment Size ................................................................................................................................................... 17
2.7 Countermeasures Review ................................................................................................................................. 17 2.7.1 Flow altering measures ............................................................................................................................... 18 2.7.2 Pier Slots ............................................................................................................................................................ 18
2.8 Pier attachments ................................................................................................................................................... 19 2.8.1 Threading.......................................................................................................................................................... 19 2.8.2 Collars and horizontal plates .................................................................................................................... 19 2.8.3 Pier Attached Plates ...................................................................................................................................... 20
2.9 Bed attachments .................................................................................................................................................... 21 2.9.1 Sacrificial piles ................................................................................................................................................ 21 2.9.2 Sacrificial sheet piles .................................................................................................................................... 21 2.9.3 Vanes ................................................................................................................................................................... 22 2.9.4 Surface guide panels ..................................................................................................................................... 22 2.9.5 Sleeve and collared sleeve .......................................................................................................................... 22 2.9.6 Bed Sills .............................................................................................................................................................. 23
2.10 Other Devices ....................................................................................................................................................... 23 2.10.1 Suction applied to pier .............................................................................................................................. 23 2.10.2 Modifying pier shape .................................................................................................................................. 24 2.10.3 Riprap .............................................................................................................................................................. 25
2.11 Combination of countermeasures ............................................................................................................... 25 2.11.1 Submerged vanes and a bed sill ............................................................................................................. 26 2.11.2 Combination of sacrificial piles and a collar .................................................................................... 26 2.11.3 Combination of Sacrificial piles and a Slot ........................................................................................ 26
x Andrew C Raleigh
2.11.4 Combination of a slot and collar ........................................................................................................... 27 2.11.5 Multiple collars............................................................................................................................................. 27 2.11.6 Bed Sill and Collar ....................................................................................................................................... 27 2.11.7 Slot and bed sill ............................................................................................................................................ 28
2.12 Conclusion of Literature Review ................................................................................................................. 28
3.0 Design Analysis ...................................................................................................................................... 30
3.1 Elimination of Countermeasures and Choosing a Design ................................................................... 30 3.2 Design Matrix – Evaluation of strength and weakness ........................................................................ 31
3.2.1 Shape of the pier ............................................................................................................................................. 37 3.2.2 Bed attachments ............................................................................................................................................ 38 3.2.3 Pier Attachments ............................................................................................................................................ 41 3.2.4 Combined Countermeasures ...................................................................................................................... 42
3.3 Design Matrix Summary and Chosen Design with Countermeasures ........................................... 46
4. Methodology ................................................................................................................................................. 47
4.1 Introduction ............................................................................................................................................................ 47 4.2 Experimental Process and Setup –Large Flume ...................................................................................... 48
4.2.1 Large Flume ..................................................................................................................................................... 48 4.2.2 Construction of Model Piers and Countermeasures ......................................................................... 50
4.2.3 Bedding Material –Sand.................................................................................................................................. 53 4.2.4 Excavation of Flume ..................................................................................................................................... 57
4.3 Testing method – Large Flume........................................................................................................................ 58 4.4 Experimental Process and Setup – Small Flume ..................................................................................... 60
4.4.1 Small Flume ...................................................................................................................................................... 60 4.4.2 Construction of Model Piers and Countermeasures ......................................................................... 62
4.4.3 Installation of floating floor and bedding material ............................................................................ 65 4.5 Theoretical Calculations .................................................................................................................................... 65
4.5.1 Flow Conditions .............................................................................................................................................. 65 4.5.2 Sediment Size ................................................................................................................................................... 66 4.5.3 Critical Mean Velocity .................................................................................................................................. 66 4.5.4 Pier Scour depth ............................................................................................................................................. 67
4.6 FARO Laser scanner Focus 3D......................................................................................................................... 68 4.6.1 FARO Scene Software ................................................................................................................................... 69 4.6.2 Maptek - I-Site 3D laser Scanning Software ........................................................................................ 69 4.6.3 Maptek - Vulcan .............................................................................................................................................. 69
4.7 Positioning of model pier and countermeasures .................................................................................... 69 4.8 Testing method ...................................................................................................................................................... 70 4.9 Variables ................................................................................................................................................................... 71 4.10 Conclusion Methodology ................................................................................................................................. 72
5.0 Results & Analysis .................................................................................................................................... 73
5.1 Introduction ............................................................................................................................................................ 73 5.2 Initial results from the large flume ............................................................................................................... 73 5.3 Initial Results from the small flume .............................................................................................................. 74 5.4 Theoretical calculation of scour depth ........................................................................................................ 75
5.5 Control Pier .......................................................................................................................................................... 76 5.6 Countermeasure 1 -Inward facing vanes with plate attached to pier ........................................... 78 5.7 Countermeasure 2 -Outward Facing Vanes with plate attached to pier ...................................... 81 5.8 Countermeasure 3 –Three Collars ................................................................................................................. 83 5.9 Volume of Erosion -Comparison of countermeasures with control pier ..................................... 85 5.10 Scour Hole Dimensions .................................................................................................................................... 85 5.11 Measurement of volume of local scour ..................................................................................................... 86 5.5 Conclusion ................................................................................................................................................................ 90
6.0 Discussion ................................................................................................................................................... 91
6.1 Introduction ............................................................................................................................................................ 91 6.2 Scour Hole Depth................................................................................................................................................... 91 6.3 Scour development and shape ........................................................................................................................ 94

xi Andrew C Raleigh
6.4 Scour hole volume ................................................................................................................................................ 95 6.5 Research Limitations ........................................................................................................................................... 96 6.6 Areas of Future Research .................................................................................................................................. 97
7.0 Conclusion ................................................................................................................................................... 98
Reference List ............................................................................................................................................................... 100
Appendix A- Project Specification .......................................................................................................... 104

1
List of Figures
Figure 2.1 Scour Hole ....................................................................................................................................... 8
Figure 2.2 Horseshoe and Wake Vortices ....................................................................................................... 10
Figure 2.3 Flow around piers ......................................................................................................................... 11
Figure 2.4 Flow Charts .................................................................................................................................. 13
Figure 2.5 Velocity disturbances across an open channel ............................................................................... 14
Figure 2.6 Flow Separation ............................................................................................................................. 16
Figure 2.7 Varying pier shapes ....................................................................................................................... 24
Figure 4.1 Large Flume at University of Southern Queensland ..................................................................... 49
Figure 4.2 Control Valve ................................................................................................................................ 49
Figure 4.3 Discharge Gauge L/s ...................................................................................................................... 50
Figure 4.4 Test one no countermeasure – Control Test ................................................................................... 51
Figure 4.5 Test Two Outward Vanes ............................................................................................................... 52
Figure 4.6 Test Three inward Vanes ................................................................................................................ 52
Figure 4.7 Cross sectional View - Pier with plate............................................................................................ 52
Figure 4.8 Cross sectional View –Vane ........................................................................................................... 52
Figure 4.9 Multiple Collars top sectional View ............................................................................................... 52
Figure 4.10 Cross sectional View -Multiple Collars ........................................................................................ 52
Figure 4.11 Sieve Analysis ............................................................................................................................. 58
Figure 4.12 Excavation of Flume showing area of interest dug at 0.300m below flume bedding level .......... 58
Figure 4.13 Flume showing control pier in positon, sand filled and slot for boards ............................................
to water control depth ...................................................................................................................................... 59
Figure 4.14 Flume Control Valve slowly opening showing water flow .......................................................... 59
Figure 4.15 Panoramic view of water flowing from dam into flume and returning to dam............................. 60
Figure 4.16 Baffles and Fly Screen Mesh for Laminar Flow .......................................................................... 61
Figure 4.17 Positioning of Pier ........................................................................................................................ 61
Figure 4.18 ManuFlo Gauge ............................................................................................................................ 62
Figure 4.19 Test one no countermeasure – Control Test ................................................................................. 63
Figure 4.20 Test Two Outward Vanes ............................................................................................................. 64
Figure 4.21 Test Three inward Vanes ............................................................................................................. 64
Figure 4.22 Cross sectional View Outward Vanes with Pier attached plate .................................................... 64
Figure 4.23 Cross sectional View Inward Vanes with Pier attached plate ....................................................... 64
Figure 4.24 Cross sectional View -Multiple Collars ........................................................................................ 64
Figure 5.1 Large flume showing water flowing in the initial trial ................................................................... 74
Figure 5.2 Downstream view of erosion after initial testing of 30mins. .......................................................... 75
Figure 5.3 Upstream view of erosion after initial testing of 30 mins. .............................................................. 75
Figure 5.4 Erosion around control pier after 2hrs of testing ............................................................................ 78
Figure 5.5 Erosion behind control pier after 2hrs of testing ............................................................................ 78
Figure 5.6 Top View of Control Pier - Vulcan Software Depth Profile .......................................................... 79
2 Andrew C Raleigh
Figure 5.7 The distance of deposition of sand from the control pier after testing for 2 hours at
500L/min ......................................................................................................................................................... 79
Figure 5.8 Side View of Control Pier – Vulcan Software showing the depth of erosion ................................ 79
Figure 5.9 Inward vanes & attached plate upstream photo after 2hr testing .................................................... 80
Figure 5.10 Inward vanes & attached plate side view photo after 2hr testing ................................................. 80
Figure 5.11 Inward facing vanes and plate attached to pier - Vulcan Software Depth Profile ........................ 80
Figure 5.12 The distance of deposition of sand from the pier with plate attached after testing for 2
hours at 500L/min, ........................................................................................................................................... 81
Figure 5.13 Sectional view of inward facing vanes and plate attached to pier, Vulcan Software ................... 81
Figure 5.14 Outward vanes & attached plate upstream photos after 2hr testing .............................................. 82
Figure 5.15 Outward vanes & attached plate side view photo after 2hr testing ............................................... 82
Figure 5.16 Outward facing vanes and plate attached to pier - Vulcan Software Depth Profile ..................... 83
Figure 5.17 The distance of deposition of sand from the pier with plate attached after testing for 2
hours at 500L/min, ........................................................................................................................................... 83
Figure 5.18 Sectional view of Outward facing vanes and plate attached to pier ............................................. 83
Figure 5.19 Three collars upstream after 2hr testing ....................................................................................... 84
Figure 5.20 Three Collars side view photo after 2hr testing ............................................................................ 84
Figure 5.21 Three Collars - Vulcan Software Depth Profile ........................................................................... 85
Figure 5.22The distance of deposition of sand from the pier with three collars after testing for 2
hours at 500L/min, ........................................................................................................................................... 85
Figure 5.23 Sectional view Three Collars ........................................................................................................ 85
Figure 5.24 Outline of extent of local scour for comparison ........................................................................... 86
Figure 5.25 shows the radius capturing the extent of local scour around bridge pier ...................................... 87
3 Andrew C Raleigh
List of Tables
Table 1 Open Channel Reynolds Number .................................................................................................. 14
Table 2 Rating System ................................................................................................................................ 30
Table 3 Advantages & Disadvantages of countermeasures ........................................................................ 31
Table 4 Shapes of Piers ............................................................................................................................... 37
Table 5 Bed Attachments ............................................................................................................................ 38
Table 6 Pier Attachments ............................................................................................................................ 41
Table 7 Combined Countermeasures .......................................................................................................... 42
Table 8 - Sieve Analysis –Sample One ....................................................................................................... 53
Table 9 - Sieve Analysis –Sample Two ...................................................................................................... 54
Table 10 - Sieve Analysis –Sample Three .................................................................................................. 54
Table 11- Sieve Analysis –Sample Four ..................................................................................................... 55
Table 12- Sieve Analysis –Sample Five ..................................................................................................... 56
Table 13 Sieve Analysis – Median size grain distribution 𝒅𝟓𝟎 .................................................................. 57
Table 14 Sieve Analysis- Jacob’s Well Density ......................................................................................... 57
Table 15 Jacob’s Well – Critical Mean Velocity ........................................................................................ 67
Table 16 Jacob’s Well – Theoretical Depth ................................................................................................ 68
Table 17 Theoretical calculation of scour for test depth and flow rate ....................................................... 76
Table 18 Depth Colour Chart Control Pier ................................................................................................. 78
Table 19 Depth Colour Chart Inward vanes & attached plate .................................................................... 80
Table 20 Depth Colour Chart outward vanes & attached plate ................................................................... 82
Table 21 Depth Colour Chart three collars ................................................................................................. 84
Table 22 Physical Modelling of scour holes ............................................................................................... 85
Table 23 Percentage of scour over relimited area taken from Vulcan software .......................................... 87
Table 24 Reduction of scour volume against control pier ........................................................................... 89
Table 25 Testing Platform – Entire Bedding surface .................................................................................. 90
Table 26 - Upstream scour depth measurements ........................................................................................ 91
Table 27 - Bottom scour width ................................................................................................................... 92
Table 28 - Cross sectional width of scour ................................................................................................... 93
Table 29 - Distance of scour from upstream face of pier ............................................................................ 93

4 Andrew C Raleigh
Nomenclature
A Cross Sectional area 𝑚2 b Bridge Pier diameter m d Particle diameter mm
𝑑50 Medium size of sediment particle by mass mm 𝑑𝑠 Scour depth m Fr Froude number dimensionless g Gravity m. 𝑠−2 𝑘𝑠 Grain roughness of bedding material mm P Wetted Perimeter m R Hydraulic Radius m
𝑅𝑒 Reynolds number dimensionless 𝑆𝑠 Specific gravity of sediment particles 𝑡. 𝑠−3 v Velocity m/s 𝑉𝑐 Velocity at critical depth m/s y Depth of flow m 𝑦𝑐 Critical depth of flow m ρ Fluid density 𝑡. 𝑚−3 𝜌𝑠 Sediment density 𝑡. 𝑚−3 𝜏 Shear stress N. 𝑚−2 𝜏𝑠 Critical bedding shear stress N. 𝑚−2 𝑣 Dynamic viscosity of water Kg.𝑚−1.s

5 Andrew C Raleigh
1.0 Introduction
Bridges have been built for a millennium. They provide an essential link over
many types of obstructions such as waterways and railways permitting
transportation to take the most direct route. Bridge failures due to scour have
caused destruction to vital infrastructure resulting in financial stress to both
governments and the general public. “Man who overlook water under bridge will
find bridge under water” (Neill 1973). This study investigates the effects of scour
around bridge piers and assesses potential countermeasures to reduce scour.
Scour is the removal of existing sediment because of a change in the velocity of
the flow and or restriction in the flow path. This can cause structural integrity of
the bridge pier to be undermined resulting in bridge failure. see, e.g., Raudkivi
1986; Dey et al. 1995; Dey and Raikar 2007(Grimaldi 2009a). Scour research is
quite extensive however the use of combined countermeasures is limited. This is
probably due to each channel being different in size, velocity of flow and
sediment size.
This research aimed to investigate, through a literature review of current
countermeasures used within the industry, an evaluation and subsequent
elimination of these countermeasures. Elimination of these countermeasures
was determined by a rating system in which constructability, cost and efficiency
were measured. The most suitable countermeasures to be combined for testing
were determined through this rating system. Models of the countermeasures
were constructed for testing in the small flume at USQ Toowoomba. The
efficiency of each combined countermeasure was measured by volume and
depth of scour to provide results in which the performance was rated. This
performance will be available for industry information.
1.1 Objectives The aim of this research was to investigate the best countermeasure or combined
countermeasure to mitigate local scouring and vortex shedding around bridge piers in

6 Andrew C Raleigh
open channels. A design matrix using a rating system to classify constructability,
feasibility and an efficiency factor was employed to identify the most efficient
countermeasure. As bridges are necessary for everyday travel this topic is of vital
importance to ensure the structural integrity of bridge piers and safety to all who use
this infrastructure. Bridges collapse due to the undermining of bridge piers because of
the scouring caused by horseshoe and wake vortices.
This research examined the effect of scouring on scale models of bridge piers with
countermeasures in a flume. It also examined the best countermeasure to be
employed to reduce scour and ensure cohesion of the bedding material around the
pier.
Research conducted and literature already published furthered the understanding of
the scouring process. Studies completed by others were reviewed so that the strengths
and weakness of existing scour mitigation methods could be recognised. By grouping
and analysing the strengths and weakness of other designs, a new design could
potentially be developed.
This project tested three countermeasures which from analysis within the literature
review achieved the highest rating. Testing took place to determine the efficiency of
the various combined countermeasures in mitigating the scour depth allowing
conclusions to be drawn.

7 Andrew C Raleigh
2.0 Literature Review This literature review presents background information and previous understanding
within this field of study. Before physically investigating effective methods to reduce
scour at bridge piers, it was important to review existing techniques, their efficiencies
and weakness. This review investigated local scour and the causes of bridge pier
failure. It also provided information about the basics of hydraulic theory relating to
open channels offering the reader knowledge to understand the problem at hand. The
following points were outlined as part of the literature review:
General information on scour
Vortex Shedding
Sediment Transportation
Flow Around Piers
Hydraulic Theory
Theoretical Checks
Countermeasures –Pier Attachments, Bed Attachments & Other Devices
Combined countermeasures
Conclusion of the literature review
2.1 Outline of Scour In channel flows when an object such as a bridge pier obstructs the flow, scour
results. “Scour is defined as the erosion of streambed around an obstruction in a flow
field” (Chang,1988). Scour is a process that occurs when there is a rapid and
unexpected change in this water flow or an obstruction impedes the flow (Williams
2009). Bridge scour is the removal of sand, soil and pebbles by fast moving water
from around the foundations of bridge piers (figure 2.1). The pier impedes the natural
flow causing high shear stresses and turbulence which creates horseshoe vortex
causing scour to the riverbed. This scour creates a serious threat to bridge piers (Qi
2013).
8 Andrew C Raleigh
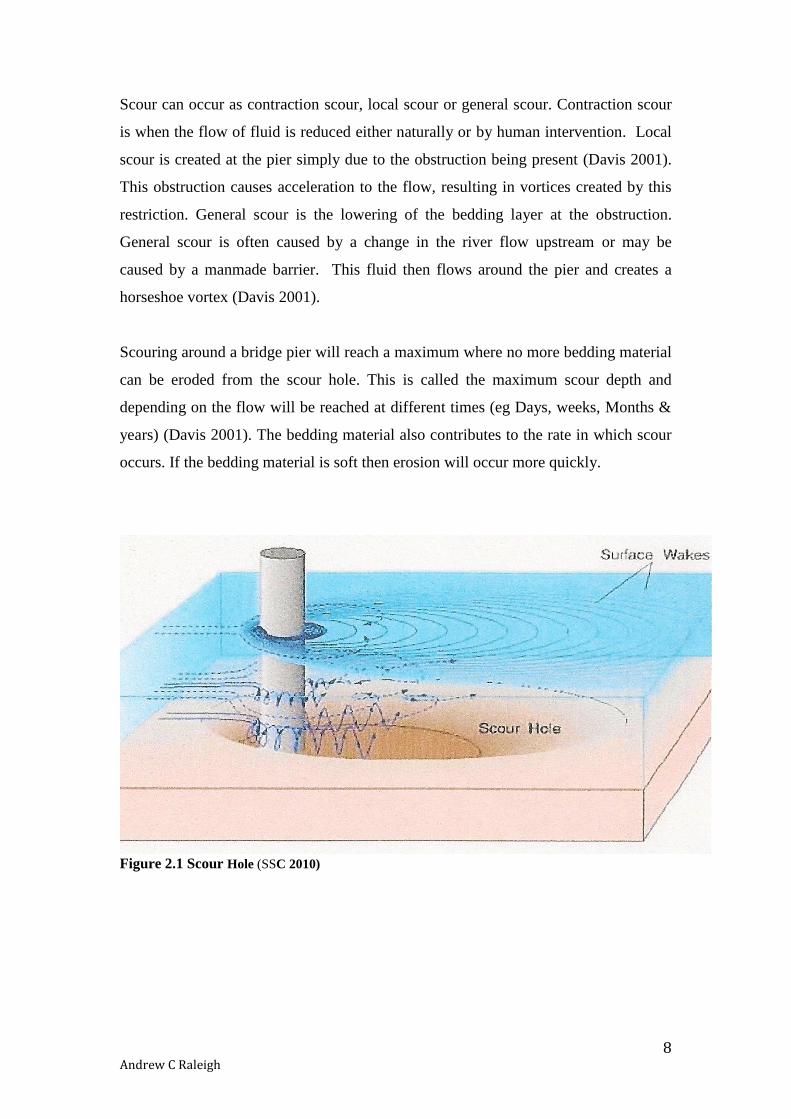
Scour can occur as contraction scour, local scour or general scour. Contraction scour
is when the flow of fluid is reduced either naturally or by human intervention. Local
scour is created at the pier simply due to the obstruction being present (Davis 2001).
This obstruction causes acceleration to the flow, resulting in vortices created by this
restriction. General scour is the lowering of the bedding layer at the obstruction.
General scour is often caused by a change in the river flow upstream or may be
caused by a manmade barrier. This fluid then flows around the pier and creates a
horseshoe vortex (Davis 2001).
Scouring around a bridge pier will reach a maximum where no more bedding material
can be eroded from the scour hole. This is called the maximum scour depth and
depending on the flow will be reached at different times (eg Days, weeks, Months &
years) (Davis 2001). The bedding material also contributes to the rate in which scour
occurs. If the bedding material is soft then erosion will occur more quickly.
Figure 2.1 Scour Hole (SSC 2010)
9 Andrew C Raleigh
2.1.1 Clear Water Scour
Clear water scour occurs when the fluid does not transport sediment material from the
bedding upstream. Clear water scour occurs when the bedding material cannot be
carried by the normal flow(Davis 2001).
2.1.2 Live Bed Scour
Live bed scour occurs when the bedding material is carried downstream with the flow
of the water. Scour holes in live beds are more prevalent during flood occurrences.
This is because of the presence of bedding material in the fluid causing shearing to the
current bedding layer. When the intensity of the flood decreases the sediment refills
the scour hole due to a drop in velocity (Davis 2001).
2.2 Vortex shedding When any water flow is disturbed by a solid object the result downstream is called
vortex shedding. The object causes a disruption to the speed and pressure of the water
both around the object and downstream (Stoesser 2010). These changes in pressure
result in the boundary layer of water separating from the bluff body. Vortices occur in
the separated boundary layer of water (Stern 2009). The stream of water disconnects
when it impacts on the obstruction causing an unsteady flow downstream.
2.2.1 Horseshoe Vortex
“Results show that the shape and size of the pier columns have a significant effect on
the spatial and temporal distributions of the bed friction velocity induced by the
horseshoe vortex system”(Chang 2013). The horseshoe vortex is created by the flow
of water separating at the upstream face of the bridge pier where the initial scour hole
has developed. The flow slows down as it approaches the pier hits the upstream face
of the pier travels vertically down the pier towards the bedding layer and pier
foundation as in figure 2.2 below. This vertical down flow erodes the surface and

10 Andrew C Raleigh
continues forming the scour hole in a semicircular direction (Masjedi 2010). This then
hits the oncoming flow of water to form a horseshoe vortex as seen in the diagram
below. The sediment is carried away downstream by the horseshoe vortex (Masjedi
2010).
Figure 2.2 Horseshoe and Wake Vortices (Masjedi 2010)
2.2.2 Wake Vortex
Wake vortices form behind a bridge pier and affect the downstream flow pattern
(Younis 2006). This phenomenon is caused by the separation of flow around the
bridge pier (figure 2.2 above). Melville (1975) wrote, “each of the concentrated
vortices acts with its low pressure center as a vacuum cleaner” (Melville 1975).
Wake vortices only cause problems with scour when piers are shielded by riprap or
other countermeasures upstream of the bridge pier (Stevens 1991). This effect of
scour causes little concern compared to the effect of horseshoe vortices. When the
bridge pier is large in diameter the effect of the horseshoe vortices is negligible, but
once again the wake vortices cause scour downstream (Stevens 1991).

11 Andrew C Raleigh
2.3 Sediment transportation Sand, soil, rocks and other solid debris are transported when the flow of water is
increased and or disturbed due to bluff bodies. This results in a natural reduction of
soil matter around the bluff body and creates an increase of soil matter further
downstream (SSC 2010).
2.4 Flow around piers and how piers affect flow The flow around bridge piers will be turbulent for scour and vortex shedding. This
turbulent flow is the most critical condition that will affect the structural integrity of
the bridge if not controlled through innovative design. The flow in front of the pier is
moving in a downwards direction as it hits the pier as seen below.
Figure 2.3 Flow around piers (Esfandi 2010)
The speed of the water pushes the vortex around the pier as seen in the above figure
2.3 as horseshoe and wake vortices. To try and combat the effect of the horseshoe
vortex the use of larger materials such as large rocks can be used to secure the
bedding material. Another option to limit the creation of horseshoe vortices is to use a
collar around the bridge pier thus abating the downwards flow of water (Esfandi
2010).

12 Andrew C Raleigh
2.5 Hydraulic theory An open channel can be defined by one surface of water being bound by atmospheric
pressure and free flowing. Open channels can either be constructed or formed by a
natural occurrence. Examples of open channels are rivers and streams. A channel can
be classified into prismatic or non-prismatic channel. Prismatic channels contain
features which remain constant and are usually associated with manmade structures.
Non-prismatic channels are categorized by fluctuating features which do not remain
constant (Unitec 2011). These are commonly identified with natural channels.
2.5.1 Flow Classifications and Flow Regimes.
2.5.2 Steady and Unsteady Flows
Steady flow is defined as one with flow properties that do not change with time.
Unsteady flow is classified by flow properties that change with time. This unsteady
flow may contain surges. An example of when unsteady flow occurs is during a flood.
2.5.3 Uniform and Non-uniform Flows
Uniform flow occurs when velocity and depth of the channel does not change
with distance. Steady uniform flows transpire in long channels where there are
no extra entries or exit points and where the water mass remains constant due
to the uniform slope. This steady uniform flow is the result of the balanced
condition where the energy loss due to friction is the same as the potential
energy created from the decline of the slope. The flow depth under this condition
is known as normal depth. Steady non-uniform flow fluctuates when the
conditions vary with distance but not with time (Unitec 2011). The mean
velocity will change with distance and not with time.

13 Andrew C Raleigh
2.5.4 Flow classification
There are three classifications of flow. They are Laminar, Transitional and Turbulent
flows. Laminar flows occur when the fluid is moving slowly in smooth parallel layers
(streamline flow). Turbulent flow is when the fluid travels at speed where flows are
erratic. This type of flow is often associated with flooding conditions. It is also most
evident around structures due to the disturbance in flow path. Turbulent flows are
unpredictable due to the changing velocities and direction, making analysis difficult.
The turbulent motion of water moves in a vortex motion. Transitional flow occurs as a
mix between turbulent and laminar flows (Richards 2010). Transitional flows are
obvious when unsteadiness starts to be evident within the flow (figure 2.4).
Figure 2.4 Flow Charts (Sydney 2005)
2.5.5 Reynold’s Number
Reynold’s number (Re) is the numerical method to determine the flow condition
within a channel. The equation is a ratio of the momentum forces to viscous forces
(Chadwick 2013). The equation is dimensionless.
𝑅𝑒𝐶ℎ𝑎𝑛𝑛𝑒𝑙 =𝜌𝑅𝑉
𝑣 (2.1)

14 Andrew C Raleigh
𝑊ℎ𝑒𝑟𝑒, 𝜌 = 𝑑𝑒𝑛𝑠𝑖𝑡𝑦 𝑅 = 𝐻𝑦𝑑𝑟𝑎𝑢𝑙𝑖𝑐 𝑅𝑎𝑑𝑖𝑢𝑠 𝑉 = 𝑉𝑒𝑙𝑜𝑐𝑖𝑡𝑦 𝑣 = 𝑉𝑖𝑠𝑐𝑜𝑠𝑖𝑡𝑦 The hydraulic radius is a function of the area over the wetted perimeter.
Table 1 below outlines the open channel Reynolds number for the different flows.
Table 1 Open Channel Reynolds Number
2.5.6 Velocity Disturbance across an Open Channel
Friction created along the boundaries of an open channel will cause the measured
velocity to fluctuate. The velocity also varies due to the secondary currents which
rebound off the boundaries of the channel (Unitec 2011). Figure 2.5 depicts the
change in velocity in an open channel. The atmospheric pressure contributes to the
variance. The maximum velocity is found to be just below the surface.
Figure 2.5 Velocity disturbance across an open channel (Sierra 2009)
Flow Classification Re Channels Laminar Flow Re<500 Transitional Flow 500< Re <2000 Turbulent Flow 2000 < Re

15 Andrew C Raleigh
2.5.7 Froude Number
Froude number (Fr) is a dimensionless parameter that describes the type of flow
within an open channel (Nalluri 2009). The Froude number is proportional between
gravitational and inert forces.
𝐹𝑟 = 𝑉
√𝑔𝑦 Eq. (2.2)
𝑊ℎ𝑒𝑟𝑒, 𝑉 = 𝑉𝑒𝑙𝑜𝑐𝑖𝑡𝑦 𝑦 = 𝐻𝑦𝑑𝑟𝑎𝑢𝑙𝑖𝑐 𝑚𝑒𝑎𝑛 𝑑𝑒𝑝𝑡ℎ 𝑔 = 𝐴𝑐𝑐𝑒𝑙𝑒𝑟𝑎𝑡𝑖𝑜𝑛 𝑑𝑢𝑒 𝑡𝑜 𝑔𝑟𝑎𝑣𝑖𝑡𝑦
2.5.8 Flow Separation
The real fluid flow around a non-streamlined shape (eg. cylindrical pier) is only
symmetrical before the obstruction in the upstream flow. As fluid passes the
downstream face of the obstruction the streamlines start to diverge (figure 2.6).
Maximum constriction occurs at the Y Axis line between the boundary layer and the
upstream face (Chadwick 2013). As the fluid passes the midway point the flow
decreases in intensity. The streamlined flow disappears and strong eddies appear
causing energy loss. The fluid in the boundary layer is travelling slower than fluid in
the stream. At this point negative velocities occur in the inner part of the boundary
layer as seen in figure 2.6. There is a distinct line where the body of the flow is
separated into negative and positive velocity showing flow separation.

16 Andrew C Raleigh
Figure 2.6 Flow Separation (Chadwick 2013)
2.6 Theoretical Checks
2.6.1 Critical Mean Velocity
Before any practical testing is carried out, flow conditions within the large flume must
be considered. This is to ensure that the critical mean velocity is checked so the
threshold for sediment transportation is reached. This is calculated using Neill’s
Equation (Administration 1993):
Neill's equation
𝑉𝑐 = 1.41√(𝑠𝑠 − 1)𝑔𝑑50 (𝑦
𝑑50)
1
6 Eq. (2.3)
Where, Ss = Specific gravity of sediment particles
y= flow depth (m)
𝑑50 = Median size of bed material (m)
g = Acceleration due to gravity

17 Andrew C Raleigh
2.6.2 Pier Scour depth
The formula below has been developed to predict the maximum scour depth around a
bridge pier (Administration 1993). It can be used for both cases of scour either live
bed or clear bed scour conditions.
𝑦𝑠
𝑦1= 2.0 𝑘1𝑘2𝑘3 [
𝑎
𝑦1]
0.65
𝐹𝑟10.43 Eq. (2.4)
Where, L = Pier Length (m) a = Pier width (m) 𝐹𝑟1 = Froude Number directly upstream of the pier 𝑉1 = Mean velocity of flow upstream of the pier g = Acceleration of gravity 𝑘1= Correction for pier nose shape 𝑘2=Correction for the angle of attacked of flow 𝑘3=Correction factor for bed condition 𝑦1 = Depth upstream 𝑦𝑠 = Depth of Scour
2.6.3 Sediment Size
The theoretical check of the size of the sediment to the diameter of the bridge pier
will be checked. This is to ensure independence between sediment size and bridge
pier diameter.
𝑏
𝑑50> 50 Eq. (2.5)
If this equation is greater than 50 then there is no relationship between sediment size
and scour depth (Ettema 1980).
2.7 Countermeasures Review Studies have identified two principal countermeasure categories used to minimize
scour around bridge piers (Tafarojnoruz 2010)
Flow altering Bed armouring
18 Andrew C Raleigh
2.7.1 Flow altering measures
Flow altering measures are designed to reduce the strength of the downflow and
the horseshoe vortex, the primary instigators of scour (Tafarojnoruz et al.,
2010). “using flow altering devices, the shear stresses on the riverbed, in vicinity
of the pier, are reduced by altering the flow pattern around a pier which in turn
reduces the scour depth” (Mubeen 2013).
Tafarojnoruz, Gaudio and Dey (2010) grouped flow-altering techniques into the
following four categories:
1. Pier Slots
2. Pier attachments
3. Bed attachments
4. Other devices
2.7.2 Pier Slots
Slots allow approaching water to pass through the pier (Tafarojnoruz 2010). Reduced
resistance created by the more direct path, weakens the horseshoe vortex and strength
of the downflow. Openings may be created in the pier itself or by gaps between
several smaller piers acting to support a single area. Both techniques work to reduce
resistance to the waters flow and subsequent scour. Scour reduction efficiencies for
techniques investigated by Tafarojnoruz et al. (2010) were around 35% to 39%
(Tafarojnoruz 2010).
Pier slots reduce the friction area of the pier allowing water to flow through
minimizing the downflow that will reach the bedding surface (Mubeen 2013). This
method is an indirect method that allows less contraction pressure to occur as the
natural flow is more freely dispersed. The slot design is critical. If the slot is placed
too high then the ability to divert the downflow to the bed is minimal (Chiew 1992).
When the slot is below the surface, the water passing through acts as a jetstream and
erodes the bed downstream of the pier. Debris is a major concern as the slot can very

19 Andrew C Raleigh
easily be filled making this countermeasure unproductive (Mubeen 2013). Regular
maintenance is required to ensure that blockage doesn’t occur making this option an
expensive exercise. Placing a slot into a pier is also a strength concern as structural
capacity is reduced. The placement of the slot is critical to structural integrity and
thus requires considerable calculations before implementation (Mubeen 2013).
2.8 Pier attachments Pier attachments include threading, collars or horizontal plates and pier-attached
plates (Tafarojnoruz 2010).
2.8.1 Threading
Threading involves wrapping cable around the pier from top to bottom so that the
cable is sloping downwards. Scour reduction efficiency is directly proportionate to the
amount of cable installed. Efficiency increases as more cable is applied and the slope
of the cable reduced (Tafarojnoruz 2010). Dey et al. (2006) suggested that the best
configuration is a triple thread with a thread angle of fifteen degrees (Dey 2006;
Tafarojnoruz 2012). Results using threading show minimal changes to scour
reduction when compared to a bridge pier with no countermeasure. The results
obtained from studies showed that similar scour shapes developed. Threading reduces
the downflow pressure by acting as a frictional component against the downward
flow (Tafarojnoruz 2012). Threading has been utilised to lessen the downward flow
which contributes to the development of horseshoe vortices. This method is
inexpensive and easy to apply.
2.8.2 Collars and horizontal plates
Collars are attached to the bridge pier and are used to deflect the flow of water
(Melville 1999). Several studies have been conducted to determine the best position
for placement and size of the collar. Installing a collar impacts directly on the

20 Andrew C Raleigh
downflow reducing both scour depth and the rate of scour (Mubeen 2013). Collars
encompass the whole pier, whereas a plate is usually only attached to the front of the
pier.
Collars and or horizontal plates are placed at or just below the original bed level to
deny scour continuing beyond the depth of the collar or plate (Tafarojnoruz 2010).
When the collar width was increased and it was placed below the bed level the
reduction of scour depth increased considerably. The size of particles in the sediment
also affected the performance of the collar (Gogus 2010).
Plates are generally positioned on the upstream side of the pier whereas collars are
circular disks that surround the pier (Tafarojnoruz 2010). The plates/collars width
controls the scour reduction efficiency; however size is dictated by practicality. Plates
help alleviate the downflow at the face of the pier from forming a horseshoe vortex.
Studies by Kumar (1999) showed that a larger scour hole formed at the upstream face
of the pier when using a smaller diameter of collar at a greater height rather than
using a larger diameter of collar at a lower height (Kumar 1999).
Experiments have also been conducted using a rectangular and a circular collar.
Results showed scour decreased using either collar but a rectangular collar was
superior decreasing scour depth by 79%. This same experiment also showed that the
greatest reduction in scour depth was gained by placing the collar under the river bed
(Jahangirzadeh 2014).
2.8.3 Pier Attached Plates
Plates (vanes) are placed on the pier at an angle to divert the downflow away from the
bed level. By diverting the downflow away from the bed, the horseshoe vortex is
denied. Scour depth reduction efficiency was recorded as high as 90% in good
conditions (Tafarojnoruz 2010). The angle investigated by Tafarojnoruz et al. (2010)
was 45 º. Plates sloping upward were more efficient.

21 Andrew C Raleigh
2.9 Bed attachments Bed attachments include sacrificial piles, vanes, bed sills, surface guide panels
and sleeve and collared sleeve. Bed armouring utilizes physical barriers to
negate scour (Tafarojnoruz 2010).
2.9.1 Sacrificial piles
Sacrificial piles, as the name suggests, are piles positioned in front of the bridge pier
as a barrier/deterrent of heavy flows. They consist of a group of piles upstream of the
bridge pier which causes a smaller velocity of wake which in turn reduces any
horseshoe vortex immediately upstream of the pier and consequently a reduction in
scour depth. The efficiency of sacrificial piles is dictated by the configuration, size
and number of piles used (Tafarojnoruz 2010). Recent research concluded that the
effectiveness of sacrificial piles as a scour countermeasure is also dependent on the
velocity flow angle and the flow intensity (Melville 1999). Studies determined scour
volume reduction efficiency between 40% and 50% (Tafarojnoruz 2010).
Sacrificial piles are said to be ineffective as scour countermeasures in live-bed
conditions. The only time sacrificial piles are effective is when the flow is straight and
the intensity of the flow is negligible (Mubeen 2013).
2.9.2 Sacrificial sheet piles
Sacrificial sheet piles are another countermeasure employed to reduce scour at bridge
piers. The sheet piles are joined and positioned in a way that the join forms a peak in
the direction of the oncoming flow. This method diverts the flow from the pier
reducing the velocity of flow impacting the pier. The highest scour reduction was
47% (Tafarojnoruz 2010).

22 Andrew C Raleigh
2.9.3 Vanes
Vanes are blades situated before the pier to alter the flow velocity, direction and
distribution (Tafarojnoruz 2010). Vane efficiency is determined by the vanes height,
orientation in relation to flow, length and the lateral distance between each
(Tafarojnoruz 2010). Rock vanes are placed at an angle so the tip of the vane is
immersed even during times of low flows in the channel or stream. Vanes, by aligning
the flow of water can effectively move the scour away from the bridge support and
into the centre of the channel. Vanes are an economical method of reducing scour
when the bridge and waterway are only small (Johnson 2001). When the bridge is a
single span, options to reduce scour such as riprap and bed armouring may interrupt
the flow of the water and cause contraction scour so the use of vanes has proven
effective (Johnson 2001). Scour reduction efficiency according to studies reviewed
was 30% to 50% (Tafarojnoruz 2010). Two vanes placed opposite to each other at a
short distance away from the front of the pier proved more effective than a single
vane (Kells 2008; Tafarojnoruz 2012).
2.9.4 Surface guide panels
Panels are positioned in a similar orientation and location as the sacrificial sheet piles
only the panels are not set into the bed of the waterway directly. The panels are
anchored into the bed to allow water to pass underneath the panel. This forces the
water downwards, causing erosion directly beneath the panel. The erosion creates a
bowl in the bed level. The end of the bowl then acts as a jump, pushing the water
upwards as it approaches the pier. This reduces the downflow at the pier and scour
intensity. Reduced downflow correlates to weakened horseshoe vortex (Tafarojnoruz
2010).
2.9.5 Sleeve and collared sleeve
A sleeve is a cylindrical steel container used to contain the horseshoe vortex
(Tafarojnoruz 2010). The container has a solid base. The horseshoe vortex occurs
inside the sleeve and the base and sides of the sleeve deny scour. Sleeve only methods

23 Andrew C Raleigh
have demonstrated failure to deny scour around the outside of the sleeve
(Tafarojnoruz 2010). To improve the sleeve capability, a collar is placed around the
sleeve. The collar denies scour outside the sleeve while the sleeve contains the
primary horseshoe vortex/scour potential.
2.9.6 Bed Sills
Grimaldi et al (2009), conducted experiments which concluded that placing a bed sill
a short distance downstream of the pier decreased the size and depth of the scour hole
(Grimaldi 2009b). It was noted, if the distance between the bed sill and pier was less,
the efficiency of this countermeasure increased. This countermeasure does not come
into effect immediately. The scour behind the pier must develop sufficiently before
the bed sill starts to counteract the scour process (Grimaldi 2009b). The best
positioning of the bed sill as stated by Grimaldi et al (2009a), suggested that the bed
sill should be adjacent to the downstream face of a circular pier (Tafarojnoruz 2012).
The bed sill acts as a barrier against the removal of sediment and therefore an
increased scour hole. In a recent study the buildup of debris at the face of the bed sill
caused a greater scour depth meaning this countermeasure can be detrimental to the
reduction of scour (Tafarojnoruz 2012).
2.10 Other Devices Other devices noted by Tafarojnoruz et al (2010) include suction and modifying the
pier shape. The use of riprap is also a method of preventing scour build up around
bridge piers.
2.10.1 Suction applied to pier
Holes are drilled through the lower part of the pier and water is suctioned through the
pier using pumps. This method showed positive scour reduction outcomes but did
contribute to minor scour downstream (Tafarojnoruz 2010).

24 Andrew C Raleigh
2.10.2 Modifying pier shape
Pier shape can change the strength of the downflow and the horseshoe vortex
(Tafarojnoruz 2010). Sharp-nosed piers can reduce the downflow and weaken the
horseshoe vortex provided the flow direction matches the orientation of the sharp
nose. If the flow direction changes and meets the flat faces of the pier, scour intensity
increases dramatically (Tafarojnoruz 2010). If a blunt nose pier is implemented there
will be no variation in scour intensity with flow direction changes. Industry
professionals support this predictability and blunt nosed piers are used most
frequently.
The shape of the bridge pier greatly influences the amount of scour. A cylindrical
shape was the most common but a round nosed pier, a sharp nosed pier or a girder
design are all now well-known shapes for pier design (Figure 2.7). If the shape is
sharp nosed or rectangular the flow must align with the pier face for scour to be
reduced. If there is even a small change in flow a cylindrical pier is safer to be used
as scour will increase with the other pier shapes (Lauchlan 1999). Figure 2.7 below
shows the most commonly used shapes for bridge pier design as per the Queensland
Main Roads and Transport Manual (2013).
Figure 2.7 Varying pier shapes (Roads 2013)

25 Andrew C Raleigh
2.10.3 Riprap
Riprap is the most commonly used method for reducing the effect of scour around a
bridge pier (Mubeen 2013). This method is both efficient and cost effective. Riprap
stones are commonly used to stop horseshoe vortex where the downflow from the pier
face is prevented from eroding the bedding due to the armoring in place. Failure can
follow using riprap stones, most likely evident during flood events where the
sediment within the water moves the riprap stones (live bed condition) further
downstream (Lauchlan 2001). Under live-bed conditions the riprap moves
downstream defeating the original placement of the riprap layer. Placing the riprap
layer below a sediment bed was identified as a possible solution by Chiew and Lim
(Chiew et al., 2000).
Failure may also occur in clear water conditions where the stones are not large
enough to withstand the shear stress caused from the downflow from the front of the
pier (Lauchlan 2001). Riprap stones vary in size and thus voids are created due to the
uneven shapes which allow the flow to erode the bed layer below. This can cause
subsidence of the riprap layer (Lauchlan 2001).
2.11 Combination of countermeasures Tafarojnoruz et al (2010) explored the efficiency of combinations and found that the
practicality of employing some of these combinations was difficult or required very
specific conditions to improve efficiency. The following combinations were tested
and improvements though sometimes small were noted:
Submerged vanes and a bed sill
Sacrificial piles and a collar
Sacrificial piles and a slot
Slot and collar
Multiple collars
Bed sill and collar
Slot and bed sill
Gaudio (2012) suggests that a higher reduction in scour is achieved through a
combination of mitigating techniques. Chiew (1992) noted that in clear water

26 Andrew C Raleigh
conditions a combination of slot and collar eliminated scour around the bridge pier.
Parker et al (1998). In live-bed conditions the combination of permeable sheet piles
with riprap reduced scour by up to 91% (Gaudio 2012). This article also concludes
that an incorrect combination of countermeasures can be less effective than a single
countermeasure (Gaudio 2012). The results obtained from this current project could
prove very helpful in mitigation techniques for future use.
2.11.1 Submerged vanes and a bed sill
These countermeasures used singly in previous research only showed reductions of
below 20% so were not considered effective. This configuration positioned two vanes
submerged upstream of the pier to catch sediment between them and prevent the scour
hole growing. A bed sill was placed downstream to avoid any build up to the back of
the pier. Testing with this combination only saw an eight percent greater reduction
than if a single bed sill had been used (Gaudio 2012).
2.11.2 Combination of sacrificial piles and a collar
Sacrificial piles in combination with a collar can help alleviate the scour depth
because the scour which occurs at the base of the sacrificial pile deposits this scour
into the scour hole around the pier. This method reduces the equilibrium and the rate
of scour at the pier (Gaudio 2012). In this combination the collar’s usual performance
to reduce scour at the pier face didn’t transpire. The results showed an undermining
upstream of the collar at the face of the pier (Gaudio 2012). This mitigating
combination only reduced the effect of scour marginally more than the individual
mechanisms and is therefore not a recommended solution.
2.11.3 Combination of Sacrificial piles and a Slot
The insertion of a slot into a pier reduces the force of the water lessening the
horseshoe vortex created and results in a reduction of scour depth. The
sacrificial piers again reduce scour at the pier by depositing crosswise sediment

27 Andrew C Raleigh
into the pier scour holes. The performance of this combined method was minor
in relation to the performance of each single countermeasure(Gaudio 2012).
2.11.4 Combination of a slot and collar
Studies have also taken place to include a collar and slot (Mubeen 2013). This
combination of a slot combined with a collar proved greater efficiency than just the
individual slot or collar but the slot created scour downstream at the rear of the pier
and the outflow from the slot can also affect the structure of wake vortices and
diverge them further down the watercourse (Gaudio 2012).
Experiments conducted by Chiew (1992) showed that if a slot was cut into the pier at
a quarter of the diameter of the pier at bed level and a collar placed around the pier
then scour could be eliminated Chiew (1992) (Moncada 2009).
2.11.5 Multiple collars
Garg et al. (2005) experimented with various sizes of collars around a bridge pier.
Studies showed that a collar three times the diameter of the pier and placed at bed
level reduced scour to zero. Due to concern of normal degradation of the riverbed
Garg et al. (2005), experimented using three collars one and a half times the diameter
of the pier. This reduced the scour by 83%. Concern arose with this first experiment
where the collar was three times greater than the pier diameter as it could prohibit any
traffic beneath the bridge (Garg et al. 2005).
2.11.6 Bed Sill and Collar
This combination varies in its effectiveness. The sill helps prevent the grooves that
appear under the collar and cause the scour hole around the pier. The difference is
noted to be dependent upon the placing of the bed sill in relation to the pier and also
the width of the bed sill (Gaudio 2012).
28 Andrew C Raleigh
2.11.7 Slot and bed sill
A slot reduces scour by decreasing the strength of the down flow, therefore limits the
horseshoe and wake vortices. The important design aspects of the slot to enable scour
reduction are the slot width, length, sinking depth and the skew angle (Grimaldi
2009a). The bed sill reduces the extent of the vortices at the rear of the bridge pier.
Scour will still occur to some degree as far as the bed sill is located. The best option
for placement of the bed sill was found to be adjacent to the bridge pier. As a
combined countermeasure the performance proved to be an effective combination
(Grimaldi 2009a).
2.12 Conclusion of Literature Review This literature review provided the basis of an understanding of various
countermeasures used within the hydraulic industry to reduce scour around bridge
piers. The literature provided information on previous results stating both the
efficiencies and failures of various countermeasures. Further reading offered evidence
of combined countermeasures mostly proving to be more effective in the reduction of
scour. Dependent upon the way the countermeasures were combined, a greater
reduction in scour generally occurred, but at times a combination provided lower
effectiveness, compared to an individual performance. By using the literature review
the studies of individual and combined countermeasures suggests the following
recommendations.
The performance of pier slots was shown to be an effective countermeasure but costly
to maintain. Collars and plates were reviewed as a good countermeasure in reducing
the scour depth. The reduction in the downflow at the face of the pier was one of the
main advantages and collars and or plates were one of the highly recommended
countermeasures previously tested. Pier attached plates also presented positively from
the literature review. Vanes are another suggestion recommended from the literature
mainly due to their cost efficiency and performance. Two vanes mirroring each other
at a 45 º angle to the flow proved to be effective. The literature showed riprap to be
an effective countermeasure also, but only in limited situations. Bed sills are noted to

29 Andrew C Raleigh
mainly be effective in combinations and are primarily limited to small channels due to
cost.
From the literature above combinations in the optimum configuration were commonly
found to perform better. From these readings slot and collars and/or multiple collars
used in the right combination appear to be very effective. The literature also suggests
that the most effective groupings are dependent on the channel conditions.
From the analysis matrix, the combination of vane and plate could prove to be an
effective combined countermeasure therefore testing was performed using this
permutation. Both inward and outward facing vanes combined with a plate were
chosen to determine the optimum measure for the reduction of erosion. Multiple
collars have already been discussed in the literature review but were shown to be
effective in the implementation of this combined countermeasure and were therefore
also selected to be tested against a control pier.
To provide a performance indicator as to which combined countermeasures would
offer the greatest efficiency, the volume of erosion would be measured and compared.
The greatest reduction in erosion using the chosen combined countermeasures when
compared to the control pier would be recommended for implementation.

30 Andrew C Raleigh
3.0 Design Analysis
3.1 Elimination of Countermeasures and Choosing a Design To choose combined countermeasures, elimination through a design matrix rating
system was used. The ratings were measured using a scale of 1 to 5 with five being
the most suitable. A countermeasure was rated on the basis of three criteria.
Constructability was judged on how easily the model could be built and implemented
at the site. It was also necessary to rate each model on the basis of ease of
construction. In practice if a pier is already constructed trying to cut a slot into this
pier would not be suitable. However placing a vane in front of an already constructed
pier would be possible. Cost was assessed on the affordability of the countermeasure
in terms of construction, material cost, maintenance costs and the life expectancy of
the countermeasure. Efficiency was the final criteria assessed. Efficiency was based
on previous results obtained from the literature review.
Table 2 Rating System
Point
value
Construction Cost Efficiency
1 Hard to construct Very expensive,
materials difficult to
source, labour intensive
to build
Inefficient except in
limited cases,
2 Not as difficult to
construct
Expensive to construct
and maintain
Limited change in
scale
3 Moderately difficult
to construct
Moderately expensive Moderately efficient
4 Easy to construct Reasonably cost
effective
Efficient in some
situations
5 Very easy to
construct
Very cost effective Very efficient in most
situations

31
3.2 Design Matrix – Evaluation of strength and weakness The aim of the tables shown below was to rate and then by process of elimination establish the most effective and efficient pier, bed attachment,
and or pier attachment to provide the outcomes to be tested. Further evaluation then determined the combinations of countermeasures which
were tested. The information below was taken from the literature review above and grouped accordingly. Using the information in Table 3
allowed for the creation of further tables (Tables 4 – 7) to pinpoint the most effective pier and combined countermeasures.
Table 3 Advantages & Disadvantages of countermeasures
Strength Weakness Evaluation/summary
Pier Shape
Blunt Nosed
Used to create greater structural
integrity
No variation in scour intensity with
flow direction changes
Sharp Nosed Weakens the horseshoe vortex
provided the flow direction
matches the orientation of the
sharp nose
If the flow direction changes and
meets the flat faces of the pier, scour
intensity increases dramatically
This design would be recommended
when the flow direction is the same
as the orientation of the sharp nosed
pier.

32 Andrew C Raleigh
Circular
Direction of flow doesn’t matter
with this design.
Without pier or bed attachments
scour holes are formed.
This design is used when the
direction of flow is unknown or too
unpredictable. Good for majority of
scenarios
Pier Slot
Reduces downwards flow
weakening the horseshoe vortex
Debris is often caught in the slot
making it less effective and
reduction of scour is dependent on
the positioning of the slot.
This countermeasure will be tested as
part of this research with one or more
other countermeasures. The pier slot
size and location must be taken into
account to ensure structural stability.
Bed Attachments
Sacrificial piles
Reduces horseshoe vortex
immediately upstream of the
pier and therefore a reduction in
scour depth.
Efficiency of sacrificial piles is
dictated by the configuration, size
and number of piles used and is also
dependent on the velocity flow angle
and flow intensity. Ineffective as a
countermeasure in live- bed
conditions. The only time sacrificial
piles are effective is when the flow
is straight.
This method is good for clear water
scour but not effective in live bed
conditions.

33 Andrew C Raleigh
Sacrificial sheet
piles
Reduces the velocity of the
flow. Good in flood conditions
Scour can occur locally at the sheets.
Difficult to construct and rust is a
concern.
Studies suggest the usage with riprap
protection. Good combination in
reducing high scour conditions
Vanes Blades situated before the pier
to alter the flow velocity,
direction and distribution of the
water. Very economical.
Two vanes are more effective than
one.
Other studies showed positioning,
including angular positioning of
vanes was found to be difficult.
Surface panels Reduces downflow at the pier
and scour intensity and
correlates to a weakened
horseshoe vortex.
Creates a bowl at the site of the
sheet causing the water to be pushed
upwards towards the pier.
Not the best option from literature
reviewed.
Sleeve and
collared sleeve
This causes the horseshoe
vortex to occur inside the sleeve
and scour is denied by the base
and sides of the sleeve. The
collar negates scour outside the
sleeve.
Incorrect positioning of the sleeve
can lead to greater scour
Position of this countermeasure under
live bed conditions can cause issues.

34 Andrew C Raleigh
Bed sill Reduction in velocity and
resultant scour reduction occurs
at the pier due to the sills
influence. Best configuration is
when the bed sill is adjacent to
the back of the pier.
Buildup of debris can occur at the
face of the bed sill rendering this
countermeasure ineffective. Scour
still occurs downstream of the pier.
This countermeasure must span
across the width of the streambed
and therefore can be expensive.
Scour will still occur at the rear of the
pier but the extent of scour will be
restricted by the sill. Debris can also
be of concern with this
countermeasure.
Riprap Most commonly used, efficient
and effective. Prevents
horseshoe vortex.
In event of floods riprap is moved
downstream and defeats the purpose.
It can cause shear failure when the
downwards pressure is too great
causing subsidence of the riprap
layer once again defeating its
purpose.
Riprap stones are most commonly
used and are an inexpensive method
of mitigating scour. However are not
suitable for small streams.
Pier Attachments
Threading
Inexpensive but reasonably
ineffective. Reduces the
downward velocity and
therefore less horseshoe
Threading shows minimal change to
scour reduction when compared to a
bridge pier with no countermeasure.
This method is inexpensive but
ineffective.

35 Andrew C Raleigh
vortices
Collars or
Horizontal
plates
Collars reduce both scour depth
and the rate of scour. Plates are
generally positioned on the
upstream side of the pier
whereas collars are circular
disks that surround the pier.The
greatest reduction in scour was
found when the collar was
placed under the river bed.
Plates/collars width controls the
scour reduction efficiency.
Using a rectangular collar was
superior to a circular collar
decreasing scour depth by 79%
Using a small collar placed at the
wrong height can actually increase
the size of the scour hole. Vibration
can be of concern when using a
large collar. It is also difficult to
install a large plate.
Using multiple collars provides safety
with concern to the lowering of the
natural bed level. Multiple plates
reduce the effects of horse vortices.
Using a single collar at a diameter
three times of the pier size can see a
reduction in scour up to 100%.

36 Andrew C Raleigh
Pier attached
plates
Plates (vanes) placed on the pier
at an angle divert the downflow
away from the bed level
negating the formation of a
horseshoe vortex. Scour depth
reduction was recorded as high
as 90%. The angle investigated
was 45 º. Plates sloping upward
were more efficient.
Debris buildup on the plates can be
an issue with this countermeasure
This method may be tested as a
suitable countermeasure.
The table below provides a recommendation for most effective and efficient design of pier and various countermeasures based on results using a
rating system of 0 to 5 (with five being the most effective and efficient refer to Table 2).

37 Andrew C Raleigh
3.2.1 Shape of the pier
Table 4 Shapes of piers
Countermeasure &
Design
Constructability Cost Efficiency Overall Rating
Blunt Nose Requires more detailed
form work – 3 points
3 points – More material
and construction detail
required than circular
4 points if the direction of
the flow is the same
orientation as the pier.
10 points
Sharp Nose Requires more detailed
form work - 3 points
3 points – More material
and Construction detail
required than Circular
4 points if the direction of
the flow is the same
orientation as the pier.
10 points
Circular Easiest to construct – 5
points
5 points – least amount of
material in designs chosen
5 points as the direction of
flow is not important
15 points
Slot Requires greatest amount
of form work – 2 points
2 points – Requires more
time and detail to
construct
5 points - height and
direction of slot is crucial.
Excellent countermeasure
in reducing the downflow
pressures.
8 points

38 Andrew C Raleigh
From the information in the table above the circular pier was chosen to be the most effective. The direction of flow in the channel is irrelevant
with this shape and therefore would permit the greatest amount of variation to size of channel, velocity of flow and live bed conditions available
when building a pier in any open water channel.
Selection: Circular pier as highlighted
3.2.2 Bed attachments
Table 5 Bed Attachments
Countermeasure &
Design
Constructability Cost Efficiency Overall Rating
Sacrificial piles 5 points – easy to build 3 points – dependent on
how many, their size and
height.
2 points – only effective in
clear water conditions.
10 Points
Sacrificial sheet piles 2 points - difficult to
construct and implement.
2 points - rust easily so
therefore not cost efficient.
4 points – good in flood
condition with aid of
riprap stones. The singular
8 Points

39 Andrew C Raleigh
efficiency is not as
effective. Scour can occur
locally.
Vanes 4 points – with the
positions of the vanes
being crucial
5 points - cheap to
implement
4 points – depends on the
flow direction and the
placement of the vane in
relation to the flow
direction
13 points
Surface panels 2 points – difficult to place
and anchor
3 points – inexpensive to
construct but expensive to
implement
2 points – creates bowls at
the base of the panel and
not very effective
7 points
Sleeve and collared
sleeve
3 points – moderately
difficult to construct
3 points –this measure is
reasonably expensive if
the sleeve is included
3 points – can easily get
clogged with debris and
incorrect positioning can
cause greater scour.
9 points
Bed sill 4 points – easy to
construct
2 points – expensive to
construct due to
countermeasure spanning
2 points – Scour will occur
to a certain degree before
countermeasure is
8 points

40 Andrew C Raleigh
across entire channel effective. Can also get
clogged with debris
Riprap 5 points – easy to
construct and implement
5 points – cheap and cost
effective method
3 points – mainly suitable
for small channels. Not
good in flood conditions
13 points
Bed attachments are a countermeasure that could be constructed in a channel at any given time. Sacrificial piles and riprap were the easiest to
construct as shown in Table 5 above however sacrificial piles are only effective in clear bed conditions so were ruled out as ineffective for most
river and channel situations. Riprap, vanes and bed sills were the next easiest to construct. Riprap is efficient and easy to construct however is
limited in its efficiency as it is only suitable for small channels and not good in flood situations. This investigation aimed to establish
countermeasures which will withstand flood situations as this is one of the most common reasons for bridge failure so riprap was ruled out as a
combined countermeasure to be tested. From the rating system shown in Table 5 vanes received the highest rating and would therefore be
suggested as suitable for bed attachments. From the above information vanes will be combined with another countermeasure and tested as part
of this study.
Selection: Vanes as highlighted

41 Andrew C Raleigh
3.2.3 Pier Attachments
Table 6 Pier Attachments
Countermeasure &
Design
Constructability Cost Efficiency Overall Rating
Threading 5 points –easy to construct 5 points – Cheap
countermeasure to
implement
1 point – ineffective
countermeasure to reduce
scour.
11 points
Collars or Horizontal
plates
4 points – reasonably
simple to construct
4 points – can be
expensive depending on
the number of collars and
thickness of material
5 Points –placement is
crucial but when
positioned at correct
height and or spacing very
effective
13 points
Pier attached plates
4 points – reasonably easy
to construct. Positioning is
crucial
4 point – reasonably cheap
to implement
5 points – can be really
effective if positioned at
the right angle
13 points

42 Andrew C Raleigh
Once again using Table 6 above collars and/or horizontal plates appear to be the most effective. Both of these countermeasures will be tested as
part of a combination.
Selection: Collars or pier attached plates as highlighted
3.2.4 Combined Countermeasures
Table 7 Combined Countermeasures
Countermeasure &
Design
Constructability Cost Efficiency Overall Rating
Submerged vanes and a
bed sill
2 points – time consuming
to construct
2 points - This
combination would be
expensive to construct as
the bed sill itself is
expensive.
1 point – as using the
vanes actually caused
larger scour holes
downstream of the pier
with the combination of
bed sill
5 points
Sacrificial piles and a
collar
4 Points – construction is
fairly easily with the
3 points – as a
combination this would be
1 point – did not improve
scour compared to just a
8 points

43 Andrew C Raleigh
position of the collar being
the most crucial and
hardest part of
construction
a reasonably expensive
process.
collar.
Sacrificial piles and a slot
3 points – Construct is
quite difficult especially
creating the slot
3 points – constructing a
slot is time consuming and
labour intensive.
1 point – no improve using
a combination
7 points
Slot and collar
3 points – construction of
this combination is
moderately difficult
3 points – slots are
expensive to construct
4 points – Debris can
block the slot rendering
this countermeasure
ineffective. However this
combination is highly
effective in clear water.
10 points
Multiple collars
4 points – construction and
position of the collars are
paramount
4 points – depending on
the diameter of the collar
this is a reasonably
efficient and cost effective
5 points – The efficiency
of this countermeasure is
very functional in reducing
scour
13 Points

44 Andrew C Raleigh
method
Bed sill and collar
3 points – Bed sill is time
consuming and labour
intensive.
3 points – the bed sill
would be expensive to
construct depending on the
width of the channel.
2 points – Fairly
ineffective as a combined
combination compared to
individual performances
8 points
Slot and bed sill
3 points – Construction of
both countermeasure
reasonably difficult and
time consuming
3 points – dependent on
the width of the channel
the bed sill can be
expensive to construct.
The slot construction is
expensive
3 points – the slot can get
blocked by debris
rendering this
countermeasure
ineffective.
9 points
From Table 7 above which was information taken from the literature review multiple collars was deemed to be the most efficient and effective.
Other combinations were not as efficient either in their cost or constructability so multiple collars was chosen to be tested. Three rectangular
collars was deemed to be effective as it allowed varying situations to occur within the channel and could still reduce the volume of scour.
Selection: Multiple collars as highlighted

45 Andrew C Raleigh
To present another option for testing the highest rating of pier attachment was combined with the highest rating of bed attachment to provide a
combined countermeasure to be tested.
Selection: Vanes with a pier attached plate

46
3.3 Design Matrix Summary and Chosen Design with
Countermeasures From the rating process established above the following conclusions were drawn:
This research eliminated designs through a logical process in which merit points were
given based on constructability, feasibility (cost) and the efficiency of the design to
reduce scour. From journal articles reviewed, individual efficiency of a single
countermeasure in reducing the effects of scour was noted to be at best 50%. In stating
this, the performance of some combined countermeasures proved less efficient than a
single countermeasure. However some combinations achieved much higher efficiency.
The circular pier was chosen to be the most effective. The direction of flow in the
channel is irrelevant with this shape. The bed attachment of a vane was chosen due to
efficient reduction in scour noted in the literature review. The pier attachment showed
both a collar and pier attached plate to be the most effective method to reduce scour.
Reviewing the combinations presented in the above matrix provided the information
that multiple collars were also an optimum choice.
The testing conducted included using the highest rated bed attachment combined with
the highest rated pier attachment to try and achieve the greatest reduction in scour.
These combinations were:
Vanes placed upstream of the pier face with vane pointing inwards towards pier
with pier attached plate
Vanes placed upstream of the pier face with vane pointing outwards from the
pier with pier attached plate
Three Rectangular Collars

47 Andrew C Raleigh
4. Methodology
4.1 Introduction The aim of this project was to establish any minor improvement which may result from
research conducted into ways to alleviate scour holes around bridge piers. “Predicting
the maximum depth, area, and volume of the scour hole around a pier is important in
order to design the pier foundations, avoiding pier and bridge failure” (Grimaldi 2009b).
The majority of the literature review above confirmed that combinations prove to be a
more efficient technique than a single countermeasure. This research used two or more
combinations to determine a better outcome from countermeasures against scour around
bridge piers.
Data collection for this experiment was conducted in both the large and small flumes at
USQ in Toowoomba. Combined countermeasures were tested in a hydraulic flume to
assess their efficiency. Non-cohesive material was used to form the bedding.
The original intention of this research was to use the large flume. However after
completing preparation of the flume and testing the control model for 45 minutes the
pump ceased working and repair of the pump was outside the time constants available
for this research. Due to this equipment failure the alternative of the small flume
became the only method of testing.
The research and results gathered from the testing undertaken are presented in this
dissertation. It offers recommendations of combined countermeasures to mitigate the
effects of local scouring.
The stages below formed the basis of testing:

48 Andrew C Raleigh
4.2 Experimental Process and Setup –Large Flume
4.2.1 Large Flume
The large flume which is 20m long, 2m wide and 0.9m depth was used to carry out
testing of combined countermeasures against scouring of a bridge pier. This flume is
located at USQ Toowoomba. Positioning of the bridge pier model in the correct location
(centred) of the flume to minimise the flow effects of the side walls was vital. In these
conditions examination of volume of erosion for each design was to be the focus of the
experiment. The base material of the flume was silty clay and river washed sand was
used around the pier to observe changes in scour depth. A timber weir controlled the
depth of water downstream and a gate valve controlled the upstream flow depth. Figure
4.1 below shows the flume used for testing prior to weeds being removed.
Stage 1
• Stage One - evaluate current strengths and weakness of bridge pier countermeasure designs noted in the literature via a matrix.
Stage 2
• Stage Two - test piers with combined countermeasures based around the results obtained from the design matrix. These designs were then constructed and tested in the flumes at USQ Toowoomba.
Stage 3
• Stage Three - collection of data for analysis of the different countermeasures tested.
Stage 4
• Stage Four - compilation of the data collected to allow for the results to be presented in the dissertation.

49 Andrew C Raleigh
Figure 4.1 Large Flume at University of Southern Queensland
Figure 4.2 Control valve

50 Andrew C Raleigh
The discharge was controlled by a valve at the start of the flume (Figure 4.2). Figure 4.3
below details in L/s the discharge:
Figure 4.3. Discharge Gauge L/s
This gauge showed the discharge of the fluid. A new electrical pump was installed and
tests were carried out to determine its capacity.
4.2.2 Construction of Model Piers and Countermeasures
These models were built at the University of Southern Queensland Faculty of
Engineering and Surveying. The piers were built using plastic pipe with a diameter of
225mm and were a length of 800mm. The plastic pipe was filled with concrete to help
stabilize each model once plates or collars were attached.
The first test used a cylindrical pier to generate a standard for testing (Figure 4.4). This
pier was built in the same way as described above. Testing was revised based on the
variations shown during this initial trial.

51 Andrew C Raleigh
In the second test a slot was cut out of the pipe to allow the plate to be slotted into
position. This plate was the same width as the pier and extruded 0.5D from the face of
the pier in a rectangular shape. The dimension of this plate was width of 225mm and
length from the face of 112.5mm (the overall length to allow for the cantilever of this
plate was 225mm). For construction of the vanes a sheet of plastic was cut at an angle
of 45 degrees. This sheet was approximately a 100mm in length (Figure 4.8). A
concrete base of 75mm was formed for this vane which was then placed in the wet
concrete. The vanes were to be placed at a 45 degree angle inwards towards the pier in
this first test approximately 200mm away from the face of the pier (Figure 4.6).
In the third test the same procedure was to be carried out with the only alteration being
the positioning of the vanes. In this test the vanes were to be placed outward at a 45
degree angle at the same distance away from the pier (Figure 4.5).
In the final combination of countermeasures to be tested, three rectangular collars
attached to a circular pier were positioned as above in the centre of the flume. Collars
were a length of 1.5D of the pier with the aim to reduce scour. The pier was constructed
using a 225mm pipe in which collars were inserted at varying levels. The collar was
situated below the surface at a depth of D/6 with the next collar being positioned at the
surface and the final collar at a height of D/6 above the bedding material (Figure 4.9 &
4.10). Once the collars were connected to the pipe shell the centre was filled with
concrete for support.
Figure 4.4 Test one no countermeasure – Control Test
225mmM

52 Andrew C Raleigh
Figure 4.5 Test Two Outward Vanes Figure 4.6 Test Three Inward Vanes
Figure 4.7 Cross sectional View Pier with plate Figure 4.8 Cross sectional View Vane
- –
Figure 4.9 Multiple Collars top sectional View
Figure 4.10 Cross sectional View -Multiple Collars
D/6
D/6
225mmM
1.5D 1.5D
225mmM
1.5D 100mmM
225mmM
1.5D

53 Andrew C Raleigh
4.2.3 Bedding Material –Sand The Standard used as a control for the size of bedding material is AS1141.11.1-2009
(Incorporating Amendment No 1). The methodology used was a sieving process in
which particle size was determined. A table was necessary to show particle size and
identify a median particle grain size for bedding material. A water absorption and
density of particles test was conducted in accordance with AS 1141.5 “Method for
sampling and testing aggregates”. This identified the apparent particle density of the
bedding material allowing for the theoretical check using Neil’s Equation [Eq. (2.3)].
The particle size distribution analysis was performed to determine the way in which the
material would perform in situ. The grading of a sediment material was chosen on the
basis of being cohesionless allowing for optimum test conditions in which scour was
likely to occur.
This sieve analysis allowed for the grading of the bedding material and the calculation
of the 𝑑50 (median particle size). Five different samples of sand were tested to allow
for a choice of sand with the least cohesion. The samples were tabulated showing the
sieve size, mass retained and mass passing through.
Table 8 - Sieve Analysis –Test One
Sample one – Garden City Landscape Centre – Coarse Sand
Sieve
Size
(mm)
Self-
Weig
ht of
Apert
ure
(g)
Mass
Retained
including
weight of
Aperture
(g)
Mass
Retaine
d (g)
Mass
Passing
(g)
Cumulative
Mass
Retained (g)
Percent
age
Retaine
d (%)
Percenta
ge
Passing
(%)
4.75 410.7 412.3 1.6 798.4 1.6 0.2 99.8
3.35 462.8 485.2 22.4 776 24 3 97
2.36 399.2 467.2 68 708 92 11.5 88.5
2.00 441.3 498.5 57.2 650.8 149.2 18.65 81.35
1.18 399.4 730.2 330.8 320 480 60 40
0.600 430 659.7 229.7 90.3 709.7 88.71 11.29
0.500 341.6 366.5 24.9 65.4 734.6 91.83 8.18
0.425 331 345.3 14.3 51.1 748.9 93.61 6.39
0.3 316.1 344.4 28.3 22.8 777.2 97.15 2.85
0.25 320.1 331 10.9 11.9 788.1 98.51 1.49
0.15 269 279.2 10.2 1.7 798.3 99.79 0.2125
0.075 253.4 254.8 1.4 0.3 799.7 99.96 0.0375

54 Andrew C Raleigh
0.052 254 254.1 0.1 0.2 799.8 99.98 0.025
pan 517.8 518 0.2 0.000 800 100 0
Total Weight of Sample 800 grams
Table 9 - Sieve Analysis –Test Two
Sample Two – Superior Sand Gravel – Coarse sand
Sieve
Size
(mm)
Self-
Weig
ht of
Apert
ure
(g)
Mass
Retained
including
weight of
Aperture
(g)
Mass
Retaine
d (g)
Mass
Passing
(g)
Cumulative
Mass
Retained (g)
Percent
age
Retaine
d (%)
Percenta
ge
Passing
(%)
4.75 410.6 425.7 15.5 784.5 15.5 1.94 98.06
3.35 463 483.5 20.5 764 36 4.5 95.50
2.36 399.4 442.1 42.7 721.3 78.7 9.84 90.16
2.00 441.9 469.7 27.8 693.5 106.5 13.31 86.69
1.18 399.5 512.7 113.2 580.3 219.7 27.46 72.54
0.600 429.9 648.9 219 361.3 438.7 54.84 45.16
0.500 341.7 421.1 79.4 281.9 518.1 64.76 35.24
0.425 331.1 375.5 44.4 237.5 562.5 70.31 29.69
0.3 316.1 429.8 113.7 123.8 676.2 84.53 15.48
0.25 319.6 368.3 48.7 75.1 724.9 90.61 9.39
0.15 268.7 333.0 64.3 10.8 789.2 98.65 1.35
0.075 253.4 263 9.6 1.2 798.8 99.85 0.15
0.052 254 254.6 0.6 0.6 799.4 99.93 0.07
pan 518 518.6 0.6 0.000 800 100 0.00
Total Weight of Sample 800 grams
Table 10 - Sieve Analysis –Test 3
Sample Three – D and D Sand & Gravel – Jacobs Well
Sieve
Size
(mm)
Self-
Weig
ht of
Apert
ure
(g)
Mass
Retained
including
weight of
Aperture
(g)
Mass
Retaine
d (g)
Mass
Passing
(g)
Cumulative
Mass
Retained (g)
Percent
age
Retaine
d (%)
Percenta
ge
Passing
(%)
4.75 618.2 618.6 0.4 631.3 0.4 0.06 99.94
3.35 462.9 465.9 3 628.3 3.4 0.54 99.46
2.36 400.9 403.5 2.6 625.7 6 0.95 99.05
2 442.2 442.8 0.6 625.1 6.6 1.04 98.96
1.18 438.7 442.5 3.8 621.3 10.4 1.65 98.35
0.6 429.9 508.1 78.2 543.1 88.6 14.03 85.97

55 Andrew C Raleigh
0.5 341.9 424.1 82.2 460.9 170.8 27.04 72.96
0.425 331.6 417.3 85.7 375.2 256.5 40.60 59.40
0.3 316.9 459.7 142.8 232.4 399.3 63.21 36.79
0.25 319.1 453.2 134.1 98.3 533.4 84.44 15.56
0.15 268.8 361.4 92.6 5.7 626 99.10 0.90
0.075 283.7 289 5.3 0.4 631.3 99.94 0.06
0.052 254.1 254.3 0.2 0.2 631.5 99.97 0.03
pan 379.3 379.5 0.2 0 631.7 100.00 0.00 Total Weight of Sample 631.7 grams
Table 11 - Sieve Analysis –Test 4
Sample Four – D and D Sand & Gravel – Medium Sand
Sieve
Size
(mm)
Self-
Weig
ht of
Apert
ure
(g)
Mass
Retained
including
weight of
Aperture
(g)
Mass
Retaine
d (g)
Mass
Passing
(g)
Cumulative
Mass
Retained (g)
Percent
age
Retaine
d (%)
Percenta
ge
Passing
(%)
4.75 618 618.3 0.3 675 0.3 0.04 99.96
3.35 462.6 464.3 1.7 673.3 2 0.30 99.70
2.36 400.6 406.2 5.6 667.7 7.6 1.13 98.87
2 442 447.5 5.5 662.2 13.1 1.94 98.06
1.18 438.7 480.5 41.8 620.4 54.9 8.13 91.87
0.6 430.1 658 227.9 392.5 282.8 41.88 58.12
0.5 341.7 462.7 121 271.5 403.8 59.80 40.20
0.425 331.4 407 75.6 195.9 479.4 70.99 29.01
0.3 316.2 403.6 87.4 108.5 566.8 83.93 16.07
0.25 318.7 364.2 45.5 63 612.3 90.67 9.33
0.15 268.7 313.9 45.2 17.8 657.5 97.36 2.64
0.075 283.6 298.2 14.6 3.2 672.1 99.53 0.47
0.052 254.1 255.9 1.8 1.4 673.9 99.79 0.21
pan 379.3 380.7 1.4 0 675.3 100.00 0.00 Total Weight of Sample 675.3 grams
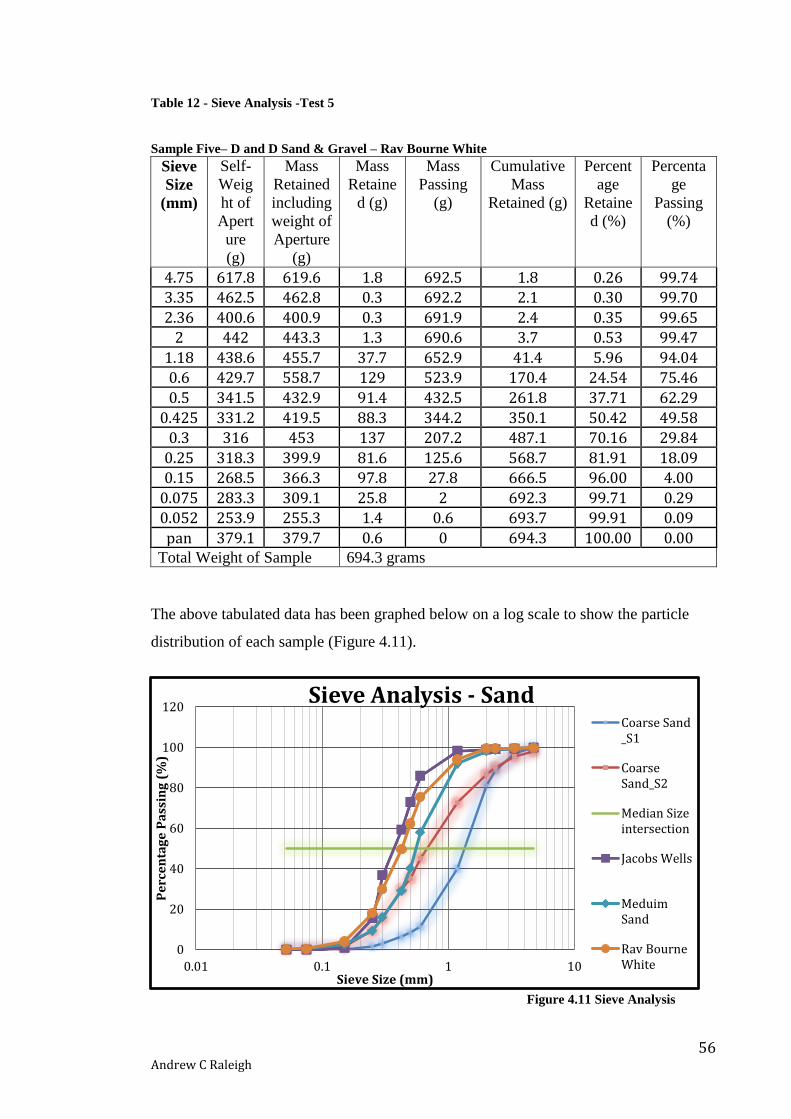
56 Andrew C Raleigh
Table 12 - Sieve Analysis -Test 5
Sample Five– D and D Sand & Gravel – Rav Bourne White
Sieve
Size
(mm)
Self-
Weig
ht of
Apert
ure
(g)
Mass
Retained
including
weight of
Aperture
(g)
Mass
Retaine
d (g)
Mass
Passing
(g)
Cumulative
Mass
Retained (g)
Percent
age
Retaine
d (%)
Percenta
ge
Passing
(%)
4.75 617.8 619.6 1.8 692.5 1.8 0.26 99.74 3.35 462.5 462.8 0.3 692.2 2.1 0.30 99.70
2.36 400.6 400.9 0.3 691.9 2.4 0.35 99.65 2 442 443.3 1.3 690.6 3.7 0.53 99.47
1.18 438.6 455.7 37.7 652.9 41.4 5.96 94.04 0.6 429.7 558.7 129 523.9 170.4 24.54 75.46
0.5 341.5 432.9 91.4 432.5 261.8 37.71 62.29
0.425 331.2 419.5 88.3 344.2 350.1 50.42 49.58
0.3 316 453 137 207.2 487.1 70.16 29.84
0.25 318.3 399.9 81.6 125.6 568.7 81.91 18.09 0.15 268.5 366.3 97.8 27.8 666.5 96.00 4.00
0.075 283.3 309.1 25.8 2 692.3 99.71 0.29 0.052 253.9 255.3 1.4 0.6 693.7 99.91 0.09
pan 379.1 379.7 0.6 0 694.3 100.00 0.00 Total Weight of Sample 694.3 grams
The above tabulated data has been graphed below on a log scale to show the particle
distribution of each sample (Figure 4.11).
Figure 4.11 Sieve Analysis
0
20
40
60
80
100
120
0.01 0.1 1 10
Pe
rce
nta
ge
Pa
ssin
g (
%)
Sieve Size (mm)
Sieve Analysis - Sand Coarse Sand_S1
CoarseSand_S2
Median Sizeintersection
Jacobs Wells
MeduimSand
Rav BourneWhite

57 Andrew C Raleigh
The median size grain (𝒅𝟓𝟎) has been tabulated below for each sample.
Table 13 - Sieve Analysis – Median size grain distribution 𝒅𝟓𝟎
Median size grain distribution 𝒅𝟓𝟎 Sample 1 1.36mm Sample 2 0.59mm Sample 3 0.38mm Sample 4 0.41mm Sample 5 0.54mm
From this analysis the bedding material chosen for testing was Jacob’s Well (Sample 3)
which showed the greatest rise on the graph. This sharper rise compared to other
samples indicated a lesser amount of cohesion. The lesser amount of cohesion meant
greater scour would occur during testing at a lower velocity. Sediment transportation
would also occur at a lower velocity.
The table below was completed for Jacob’s Well showing the apparent particle density,
dry particle density and water absorption in accordance with AS 1141.5 “Method for
sampling and testing aggregates”.
Table 14 - Sieve Analysis- Jacob’s Well Density
Sample Three – Jacobs Well
Apparent particle density 1.4432 t/m³
Dry Particle density 1.3612 t/m³
Water Absorption 5.68%
4.2.4 Excavation of Flume
Initial clearing of the weeds and levelling of the ground within the flume began. Further
excavation of bedding material at a distance 8m from the inlet and a depth of 0.300m
for a width and length of 2m was dug to provide depth to assimilate conditions for a
foundation and support for the pier as per figure 4.12. Once the pier placement was
established the area was filled with Jacob’s Well sand.

58 Andrew C Raleigh
Figure 4.12 Excavation of Flume showing area of interest dug at 0.300m below flume bedding level
4.3 Testing method – Large Flume
Boards were placed in slots in the sides of the flume (figure 4.13) to capture the water
so that the depth required for testing was achieved. The excavation of the centre of the
flume to a measurement of 2m x 2m x.0.3m was then completed. Once the control pier
was in place washed river sand was filled in this area to the same height as the bed level
of the flume. The pier was then anchored and tied provide stability and ensure that the
model did not move during testing.

59 Andrew C Raleigh
Figure 4.13 Flume showing control pier in positon, sand filled and slot for boards to water control
depth
The valve (figure 4.14) was then slowly released to allow the flow of water into the
flume until the required depth of 250mm was achieved. The control valve was opened
slowly to ensure a steady flow without any surges.
Figure 4.14 Flume Control Valve slowly opening showing water flow

60 Andrew C Raleigh
This intial test was conducted purely to understand and test the capacity of the newly
installed pump. Water was realeased slowly into the flume to reduce the effect of
surges on the bedding layer. After increasing the discharge the pump ceased working
approximately 30mins later. As a result testing stopped and the only results obtained
are soon below. Figure 4.15 provides a panoramic view of water being pumped from the
dam into the flume, flowing out over the weir and continuing around returning to the
dam. Further testing in the large flume was unable to be completed within time
constraints and testing was therefore moved to the small flume.
Figure 4.15 Panoramic view of water flowing from dam into flume and returning to dam
4.4 Experimental Process and Setup – Small Flume Due to the malfunctioning of the pump in the large flume testing was moved to the
small flume. The same bedding material as analyzed above was adopted. The models
were also scaled down, however the construction method was different, and this has
been explained further below.
4.4.1 Small Flume
The small flume is 3.8m long, 0.615m wide with a maximum depth of 0.120m and
located in the Hydraulic Lab at USQ Toowoomba. A floating floor was constructed
from marine ply at a depth of 0.030m. This was constructed to ensure the approach flow
from the inlet was as uniform as possible prior to reaching the bedding material. This
approach flooring was 1.8m in length with the bedding material 1.4m in length and the
last part of the floating floor continued to the end of the flume where a sediment trap
collected the moving particles. Baffles were also placed at the inlet of the flume to help
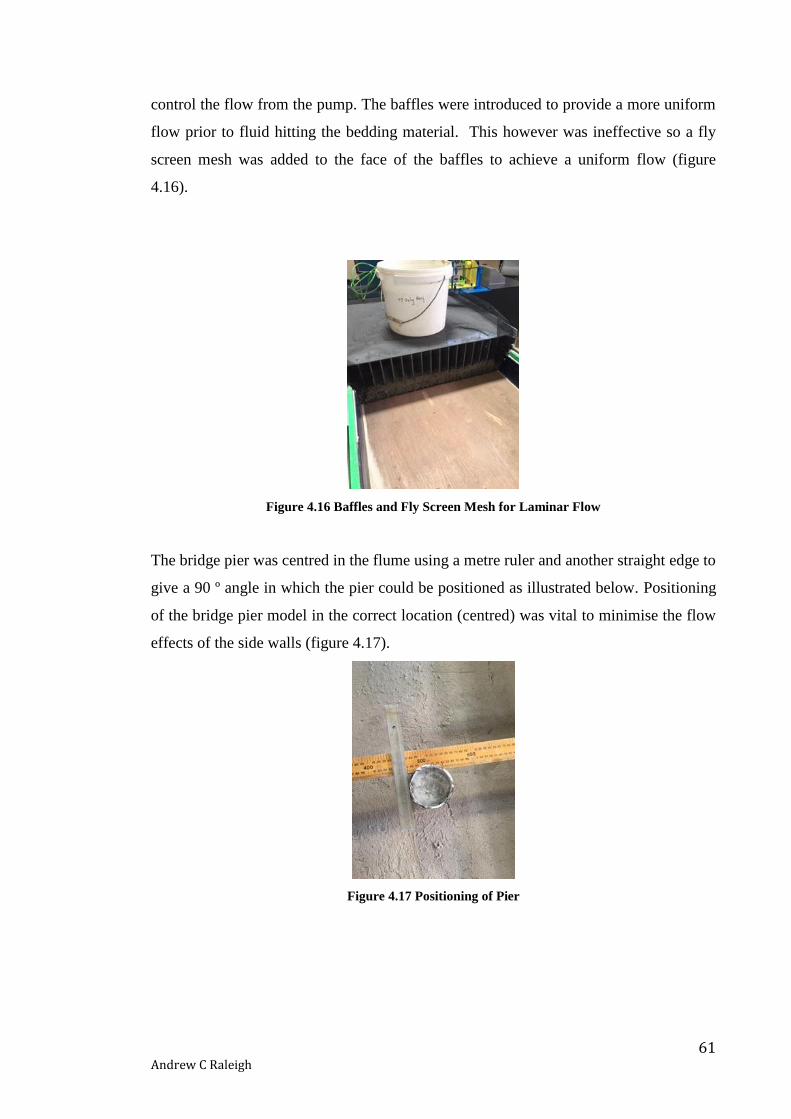
61 Andrew C Raleigh
control the flow from the pump. The baffles were introduced to provide a more uniform
flow prior to fluid hitting the bedding material. This however was ineffective so a fly
screen mesh was added to the face of the baffles to achieve a uniform flow (figure
4.16).
Figure 4.16 Baffles and Fly Screen Mesh for Laminar Flow
The bridge pier was centred in the flume using a metre ruler and another straight edge to
give a 90 º angle in which the pier could be positioned as illustrated below. Positioning
of the bridge pier model in the correct location (centred) was vital to minimise the flow
effects of the side walls (figure 4.17).
Figure 4.17 Positioning of Pier
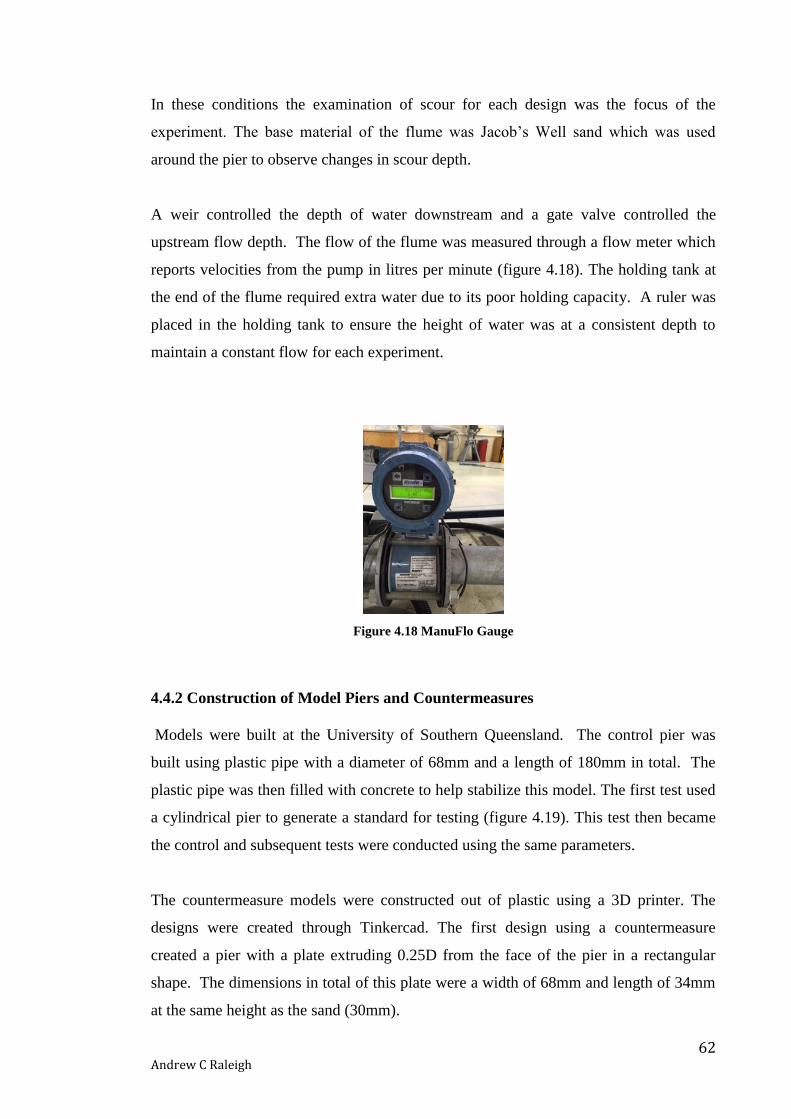
62 Andrew C Raleigh
In these conditions the examination of scour for each design was the focus of the
experiment. The base material of the flume was Jacob’s Well sand which was used
around the pier to observe changes in scour depth.
A weir controlled the depth of water downstream and a gate valve controlled the
upstream flow depth. The flow of the flume was measured through a flow meter which
reports velocities from the pump in litres per minute (figure 4.18). The holding tank at
the end of the flume required extra water due to its poor holding capacity. A ruler was
placed in the holding tank to ensure the height of water was at a consistent depth to
maintain a constant flow for each experiment.
Figure 4.18 ManuFlo Gauge
4.4.2 Construction of Model Piers and Countermeasures
Models were built at the University of Southern Queensland. The control pier was
built using plastic pipe with a diameter of 68mm and a length of 180mm in total. The
plastic pipe was then filled with concrete to help stabilize this model. The first test used
a cylindrical pier to generate a standard for testing (figure 4.19). This test then became
the control and subsequent tests were conducted using the same parameters.
The countermeasure models were constructed out of plastic using a 3D printer. The
designs were created through Tinkercad. The first design using a countermeasure
created a pier with a plate extruding 0.25D from the face of the pier in a rectangular
shape. The dimensions in total of this plate were a width of 68mm and length of 34mm
at the same height as the sand (30mm).

63 Andrew C Raleigh
For construction of the vanes a 3D printer was once again used for fabrication. The
vanes were positioned at an angle of 45 º to the pier. Theses vanes were 70mm in height
(figure 4.20 & 4.21). The vanes were placed at a 45 ºangle inwards towards the pier in
the first test at 100mm away from the face of the pier (figure 4.21).
In the next test the same procedure was carried out with the only alteration being the
positioning of the vanes. In this test the vanes were placed outwards at a 45 ºangle and
the same distance away from the pier (figure 4.20).
In the final combination of countermeasures tested, three rectangular collars were
attached to a circular pier and positioned in the centre of the flume. Collars were a
length of 1.5D of the pier with the aim to reduce scour. The pier was constructed using
the 3D printer where collars were inserted at varying levels. The first collar was situated
below the bed surface at a depth of D/6 with the next collar being positioned at the
bedding surface and the final collar at a height of D/6 above the bedding material
(figure 4.24). The pipe shell was then filled with concrete to provide support. All
models have been painted with a bitumen membrane to ensure a consistent frictional
surface for each pier. This was also completed to model a more industrial finish.
Figure 4.19 Test one no countermeasure – Control Test

64 Andrew C Raleigh
Figure 4.20 Test Two Outward Vanes Figure 4.21 Test Three Inward Vanes
Figure 4.22 Cross sectional View Figure 4.23 Cross sectional View
Outward Vanes with Inward Vanes with
Pier attached plate Pier attached plate
Figure 4.24 Cross sectional View -Multiple Collars

65 Andrew C Raleigh
4.4.3 Installation of floating floor and bedding material The small flume required a floating floor constructed from marine ply to provide
containment of the bedding material. This was also built to provide a run of clear flow
before hitting the bedding material. The first section of the flume prior to the start of
the bedding sand was 1.8m long. Bedding sand of 0.258m3 was then placed in the
flume and a further section of floating floor was constructed at the end of the pier at a
length of 0.600m. The bedding sand section measured 1.4m in length.
4.5 Theoretical Calculations
4.5.1 Flow Conditions
Steady flow was achieved by passing water through baffles and aluminum fly screen
situated at the beginning of the flume. A depth of 70mm was established to allow for
testing of the countermeasures. The testing was completed with a discharge of
500Litres/min ( 8.33 × 10⁻³𝑚3/𝑠 ).With the gate valve open at this discharge the
velocity was approximately 0.194m/s. The Reynold’s number was then calculated to
ensure flow around the pier was turbulent.
𝑅𝑒𝐶ℎ𝑎𝑛𝑛𝑒𝑙 =𝜌𝑅𝑉
𝑣 (Eq 2.1)
𝐻𝑦𝑑𝑟𝑎𝑢𝑙𝑖𝑐 𝑅𝑎𝑑𝑖𝑢𝑠 𝑅 =𝐴
𝑃=
𝑏𝑦
𝑏 + 2𝑦
𝐻𝑦𝑑𝑟𝑎𝑢𝑙𝑖𝑐 𝑅𝑎𝑑𝑖𝑢𝑠 𝑅 =0.615𝑚 × 0.070𝑚
0.615𝑚 + 2 × 0.070𝑚
𝑅 = 0.057𝑚
𝑅𝑒𝐶ℎ𝑎𝑛𝑛𝑒𝑙 =𝑝𝑅𝑉
𝑣
𝑅𝑒𝐶ℎ𝑎𝑛𝑛𝑒𝑙 =0.057𝑚 × 0.194𝑚/𝑠
1 × 10−6= 1.1058 × 10⁴
∴ 𝑇𝑢𝑟𝑏𝑢𝑙𝑒𝑛𝑡 𝐶𝑜𝑛𝑑𝑖𝑡𝑖𝑜𝑛𝑠

66 Andrew C Raleigh
Scour occurs in turbulent conditions caused by the obstruction of the pier.
The Froude Number was calculated next to determine the flow regime of the channel.
𝐹𝑟 =𝑉
√𝑔𝑦 (Eq.2.2)
𝐹𝑟 =0.194𝑚/𝑠
√9.81𝑚
𝑠2 ×0.070𝑚
𝐹𝑟 = 0.234 ∴ 𝑆𝑢𝑏𝑐𝑟𝑖𝑡𝑖𝑐𝑎𝑙 𝐹𝑙𝑜𝑤
4.5.2 Sediment Size
The theoretical check of the size of the sediment to the diameter of the bridge pier was
completed. This was to ensure independence between sediment size and bridge pier
diameter. If this equation was greater than 50 then there would be no relationship
between sediment size and scour depth.
𝑏
𝑑50> 50 Eq. (2.5)
68𝑚𝑚
0.38𝑚𝑚= 178.95 > 50
∴ 𝑆𝑐𝑜𝑢𝑟 𝑑𝑒𝑝𝑡ℎ 𝑖𝑠 𝑖𝑛𝑑𝑒𝑝𝑒𝑛𝑑𝑒𝑛𝑡 𝑜𝑓 𝑠𝑒𝑑𝑖𝑚𝑒𝑛𝑡 𝑠𝑖𝑧𝑒
4.5.3 Critical Mean Velocity
As per the literature review the critical mean velocity was calculated to ensure particle
transportation occurred. This was calculated using Neill’s Equation:
Where,
Specific gravity of sediment particles (Ss) =1.4432 t/m³,
y= flow depth (m) = 0.070m (Test depth)
𝑑50 = Median size of bed material (m) =0.36mm
𝑉𝑐 = 1.41√(𝑠𝑠 − 1)𝑔𝑑50 (𝑦
𝑑50)
1
6 Eq. (2.3)

67 Andrew C Raleigh
𝑉𝑐 = 1.41√(1.4432 t/m³ − 1) × 9.81𝑚/𝑠2 × 0.00036𝑚 (0.070𝑚
0.00036𝑚)
16
𝑉𝑐 = 0.137𝑚/𝑠
The table below was calculated to show the different critical mean velocity (Vc) at
various heights within the small flume.
Table 15 Jacob’s Well – Critical Mean Velocity
Jacob’s Well
Critical Mean Velocity Vc (m/s)
Y Depth
Q(m3/s) Litres minute
0.119 0.03 0.00219 131.40
0.137 0.07 0.00589 353.12
0.143 0.09 0.00790 473.43
4.5.4 Pier Scour depth
Equation 2.5 below was developed to predict the maximum scour depth around a bridge
pier (Administration 1993). It can be used for both cases of scour either live bed or
clear bed scour conditions. This was calculated to predict the theoretical scour depth.
𝑦𝑠
𝑦1= 2.0 𝑘1𝑘2𝑘3 [
𝑎
𝑦1]
0.65
𝐹𝑟10.43 Eq. (2.4)
Where, L = Pier Length (m) a = Pier width (m) 𝐹𝑟1 = Froude Number directly upstream of the pier 𝑉1 = Mean velocity of flow upstream of the pier g = Acceleration of gravity 𝑘1= Correction for pier nose shape 𝑘2=Correction for the angle of attacked of flow 𝑘3=Correction factor for bed condition 𝑦1 = Depth upstream 𝑦𝑠 = Depth of Scour

68 Andrew C Raleigh
𝑊ℎ𝑒𝑟𝑒, 𝑘1 = 1 𝑘2 = 1 𝑘3 = 1.1
𝑦𝑠 = (2.0 × 1 × 1 × 1.1 [0.068
0.070]
0.65
0.1130.43) × 0.070
𝑦𝑠 = 0.059𝑚
The Table below shows the theoretical scour depth for each critical velocity at the
various water depths.
Table 16 Jacob’s Well – Theoretical Depth
Critical Mean Velocity
𝑭𝒓𝟏 Y Depth Q(m3/s) Litres minute
YS (maximum depth of Scour theoretical
YS
Vc (m/s) (m) (m3/s) L/min (m) (mm)
0.1187 0.064 0.03 0.00219 131.41 0.034 34
0.1367 0.113 0.07 0.00589 353.12 0.059 59
0.1426 0.134 0.09 0.00789 473.43 0.070 70
4.6 FARO Laser scanner Focus 3D This laser scanner was used to assist in calculating the scour depth around each tested
pier. It ensured a greater degree of accuracy as it delivers very detailed 3D images
when determining the scour depth and volume. This device allowed the analysis of the
scour depth when compared to the theoretical calculation for the maximum scour depth
forming a good starting point to compare efficiencies of the countermeasures (Eq 2.5).
The laser is high speed with a 2mm tolerance level of accuracy (FARO 2015).
The scanner was placed in two positions one upstream and one downstream and
diagonally opposite to allow analysis of the scour effects at the face and directly behind
the pier. Scans were taken once the model was in place and prior to commencement of
water flow. After completing the testing further scans were taken to allow comparison.
The scans were processed into a software program called ‘Scene’ and then the data was
further refined in I-Site. Vulcan, another surveying software program, then displayed
the difference of scour in each scenario.

69 Andrew C Raleigh
A FARO Scanner recognises spheres as datum points. Four spheres were strategically
placed to allow the software to identify these spheres. This was completed as two scans
were necessary each time to capture information from both ends of the pier. The
software then detected these spheres as datum points merging the images into one.
4.6.1 FARO Scene Software
‘Scene’ was used to show 3D modelling of the scour holes. This program was used to
transfer the images from the SD card into the computer to allow for further modelling.
4.6.2 Maptek - I-Site 3D laser Scanning Software
I-site was used to refine the image detail previously obtained by the FARO Scene
software. The FARO scan captured a larger area of data than required so processing in
I-Site was used to reduce the image to the area of interest.
4.6.3 Maptek - Vulcan
From I-Site the information was transferred to Vulcan, a mining software program.
This software calculated the volume of scour. This program also allowed the images,
before any water flow and after testing, to overlap showing the amount of scour
occurring and the position of scour in relation to the bridge pier.
4.7 Positioning of model pier and countermeasures The pier was positioned in the centre of the flume in the initial test 2.2m downstream
from the inlet. A weight was placed on top of the pier to ensure no movement during
testing. Results around depth of water and movement of sediment were tested to
provide a standard with which to compare.

70 Andrew C Raleigh
The double submerged vanes were positioned upstream of the pier at a distance of
100mm from the face of the pier. The submerged vanes were set at 45º to the
perpendicular to try and achieve a reduction in scour depth. This test placed the end of
the vane closest to the pier directing the flow inwards towards the pier face (figure
4.23). The second configuration placed the end of the vane to the outside of the pier
directing the flow away from the pier (figure 4.22).
The third countermeasure tested was the combined collars. This pier was once again
positioned at the centre of the flume. These collars were rectangular in shape and the
first collar was situated below bed level at a distance of D/6 beneath the surface with the
second being at the surface of the bedding material and last being D/6 above the surface
of the bedding material.
4.8 Testing method Preliminary tests were completed to gauge the correct depth and velocity of water due
to the limiting capacity for storage of water within the flume. The control pier was then
tested under the same experimental conditions. The combined countermeasures,
chosen from the process of elimination in the design tables, were also tested to allow for
comparison of scour depth.
After positioning the control model in the centre of the sand and leveling this between
both false floors a smooth surface was achieved for testing. The wall of the weir was
raised to full height to retain the maximum depth of water prior to increasing the
discharge from the inlet. The next step involved taking the initial FARO scans from
each side of the model. The spheres were placed at four points around the flume and
positioned so that both scanning placements captured the spheres as datum points.
These scans were taken to show the bedding surface prior to water flow.
After these scans were completed water was introduced by slowly releasing the control
valve until a rate of 20litre/min was achieved to ensure minimal disruption (e.g surge
waves) to the bedding material. This rate was maintained until water started trickling
over the weir which took approximately 4.30mins. The height of water retained by the
weir was 0.030m. To achieve a higher depth in the flume for testing due to the

71 Andrew C Raleigh
restriction of the weir wall height the discharge was increased. The discharge was
increased in increments of 50litres/min every 30seconds until required discharge of
500litres/min was achieved. The depth of water in the flume was maintained at 0.070m.
The next step in testing was observation and monitoring of all the variable conditions
during testing. Photos of the models were taken every thirty minutes to illustrate if any
changes in scour occurred. After testing for two hours the flume pump was turned off
and the flume was drained of water. The bedding material was left to dry as the laser
scanner could only identify changes in the bedding surface once devoid of water. Once
the surface was dry enough scans were completed from each separate end of the flume
to provide information on the changes. This process was repeated for each
countermeasure for two hours at a time.
The main results were obtained by setting up the FARO scanner to capture the scour
depth and volume around the pier. This allowed for comparison of the different
countermeasures being tested. Once the results from the FARO scan were obtained
they were then processed through three different software packages to show the
differences in volume of scour. This allowed for the efficiency of the countermeasures
to be interpreted.
4.9 Variables
The following variables could affect results and it was important to be aware when
conducting analysis.
The water could be released too quickly causing a surge downstream;
The flow may vary in intensity and velocity for each individual experiment so it
was important to complete readings at consistent intervals to ensure the same
flow;
The time may run for a minute more or less on one experiment which may affect
the outcome;
Positioning of the countermeasures and or pier

72 Andrew C Raleigh
4.10 Conclusion Methodology Combinations generally tested more efficiently than countermeasure techniques
working independently. The most effective combinations appeared to cover the
weakness of the other. It would be rational to study the strengths and weakness of all
existing countermeasure methods working independently so that strengths could be
matched with weakness. Due to time and construction constraints this was not possible.
Using the literature review on the studies of individual countermeasures the
combinations were formed. The aim of this research was to nullify the weakness of
independent countermeasures by introducing another.
The performance of these countermeasures was measured by:
The FARO scanner was used to find the maximum depth of scour. The depth of
scour from each test was compared with the control model. The scour reduction
volume efficiency was compared to assess performance of the combined
countermeasures.
Once testing was completed the information collected above allowed for comparison of
the three different combinations of countermeasures. Ranking by measurement of the
scour reduction determined the success of this experiment. The design with the least
amount of erosion will be recommended for use.

73 Andrew C Raleigh
5.0 Results & Analysis
5.1 Introduction This section explains the results obtained during testing in the large and small flume at
USQ Toowoomba. The results compared the scour reduction volume efficiency
immediately around a control pier and piers using combined countermeasures. Three
different combined countermeasures were tested to determine their efficiency.
5.2 Initial results from the large flume Figures 5.1, 5.2 and 5.3 show the only results obtained from the large flume. Figure 5.1
shows the flume in operation. Figures 5.2 and 5.3 below show the deformation of sand
immediately around the pier. It is clear from the image that a deviation of the sand had
started to occur behind the pier and this was due to the wake vortices. These figures, 5.2
and 5.3, also clearly identify the initial signs of erosion around the base of the pier.
After only 30 minutes of testing the pump failed and was unable to be fixed after many
repeated attempts. As this was no longer viable as a test measure new models were
made to enable results to be obtained using the small flume.
Figure 5.1 Large flume showing water flowing in the initial trial

74 Andrew C Raleigh
Arrow indicates water flow
Figure 5.2 Downstream view of erosion Figure 5.3 Upstream view of erosion
after initial testing of 30mins. after initial testing of 30 mins.
5.3 Initial Results from the small flume The small flume involved testing the control pier at different depths of flow and
velocities to establish the correct parameters to use for testing. Experiments were
conducted where critical mean velocity was achieved for the various depths to ensure
sedimentation flow. Initial testing at 600L/min occurred, in turn creating a higher
depth of flow, equaling 90mm. Deformation was extreme with the sand particles totally
pushed downstream exposing a large portion of the bottom testing platform within an
hour of testing. Testing was then undertaken at the minimum point of critical velocity
360L/min where sediment transportation in theory should occur. After 2 hours only
minimal disruption to the surface had occurred determining that this test parameter was
too low. It was seen that the horseshoe shape of erosion was occurring but after 2 hours
of testing the deformation was only half way around the pier. Testing was then
commenced at 500L/min as this produced sufficient depth within the flume for a
turbulent flow allowing realistic results to be obtained during a flood event. These were
the parameters adopted.

75 Andrew C Raleigh
The velocities tested above were determined by using Table 16, Critical Mean
Velocities. A restriction due to the retention capacity of the weir meant depths at
varying velocities did not correlate directly to the theoretical critical velocities as stated
in the table. Theoretically these figures were the minimum and were surpassed in
velocity. This meant that the lower depths were tested with higher velocities to permit
sediment transportation to occur.
5.4 Theoretical calculation of scour depth The theoretical calculation was completed in Table 16 above to show the expected
depth of erosion. Testing at these velocities proved to be on the cusp of minimal
sediment transportation occurring, so velocity was increased until the sediment
transportation rate was seen to occur more frequently. To increase the rate of erosion
the discharge was increased to 500L/min. The calculation below shows the expected
depth of scour at this discharge.
𝑦𝑠
𝑦1= 2.0 𝑘1𝑘2𝑘3 [
𝑎
𝑦1]
0.65
𝐹𝑟10.43 Eq. (2.4)
Where, L = Pier Length (m) a = Pier width (m) 𝐹𝑟1 = Froude Number directly upstream of the pier 𝑉1 = Mean velocity of flow upstream of the pier g = Acceleration of gravity 𝑘1= Correction for pier nose shape 𝑘2=Correction for the angle of attacked of flow 𝑘3=Correction factor for bed condition 𝑦1 = Depth upstream 𝑦𝑠 = Depth of Scour
𝑊ℎ𝑒𝑟𝑒, 𝑘1 = 1 𝑘2 = 1 𝑘3 = 1.1
𝐹𝑟 = 0.234 ∴ 𝑆𝑢𝑏𝑐𝑟𝑖𝑡𝑖𝑐𝑎𝑙 𝐹𝑙𝑜𝑤

76 Andrew C Raleigh
𝑦𝑠 = (2.0 × 1 × 1 × 1.1 [0.068
0.070]
0.65
0.2340.43) × 0.070
𝑦𝑠 = 0.081𝑚 From this equation the expected theoretical depth was 81mm.
The table below shows the theoretical critical mean velocity for sediment transportation
to commence.
Table 17 Theoretical calculation of scour for test depth and flow rate
Critical Mean Velocity
𝑭𝒓𝟏 Y Depth Q(m3/s) Litres minute
YS (maximum depth of Scour theoretical
YS
Vc (m/s) (m) (m3/s) L/min (m) (mm)
0.1935 0.234 0.07 0.00833 500 0.081 81
5.5 Control Pier
The first test involved the cylindrical pier to provide a control against which the
efficiency of the combined countermeasures could be quantified. The following
parameters were adopted for all tests: - average mean velocity of 0.194m/s and depth of
70mm. After reaching the required velocity and water depth, initial observations
showed the commencement of scour at the face of the pier. The scour formed in a
shape similar to that of a horseshoe and continued to wrap around the face of the pier
gradually encompassing the whole pier. Scour occurred within the first 30 minutes and
was well defined after the first hour (figures 5.4 & 5.5). Sand particles formed a rolling
movement as they were uplifted by the force of the flow. Wake vortices occurred
behind the pier and there was also a deposition of sand creating a crater effect at the
base of, and in the wake of the pier.

77 Andrew C Raleigh
Figure 5.4 Erosion around control pier after 2hrs of testing
Figure 5.5 Erosion behind control pier after 2hrs of testing
Below in figure 5.6 the FARO scan image provides an overview of the deposition in the
area. Table 18 shows the depth of erosion and movement of sediment.

78 Andrew C Raleigh
Table 18 Depth Colour Chart Control Pier
Figure 5.6 Top View of Control Pier - Vulcan Software Depth Profile
Figure 5.7 The distance of deposition of sand from the control pier after testing for 2 hours at
500L/min
Figure 5.8 shows the erosion in purple around the control pier. This is quite a
significant bowl shape with a definite deposit of sand after the wake in white.
Figure 5.8 Side View of Control Pier – Vulcan Software showing the depth of erosion
5.6 Countermeasure 1 -Inward facing vanes with plate attached to pier The next test involved a pier with a plate attached level with the bedding surface and
inward facing vanes. As initially assumed there was a large amount of erosion occurring
at the vanes with reduced scour depth at the face of the pier (figure 5.10). There was a
buildup of sand in front of the diameter of the plate but erosion still occurred at the sides
428.3mm
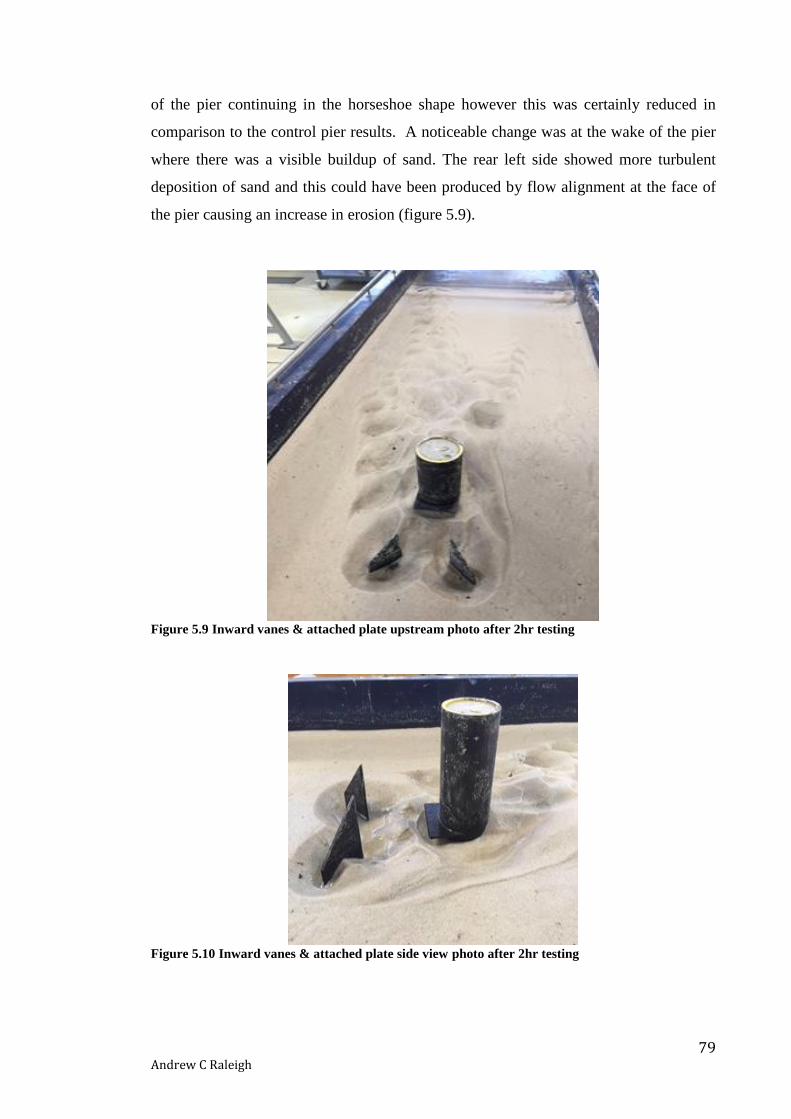
79 Andrew C Raleigh
of the pier continuing in the horseshoe shape however this was certainly reduced in
comparison to the control pier results. A noticeable change was at the wake of the pier
where there was a visible buildup of sand. The rear left side showed more turbulent
deposition of sand and this could have been produced by flow alignment at the face of
the pier causing an increase in erosion (figure 5.9).
Figure 5.9 Inward vanes & attached plate upstream photo after 2hr testing
Figure 5.10 Inward vanes & attached plate side view photo after 2hr testing

80 Andrew C Raleigh
Figure 5.11 is a topographical view of the scour deformation over the bedding surface.
Table 19 to the right indicates the depth profile.
Table 19 Depth Colour Chart Inward vanes & attached plate
Figure 5.11 Inward facing vanes and plate attached to pier - Vulcan Software Depth Profile
Figure 5.12 The distance of deposition of sand from the pier with plate attached after testing for 2
hours at 500L/min,
Figure 5.13 shows the erosion in purple around the vanes at the front of the pier. Scour
is also obvious around the pier and there is as deposit of sand after the pier which shows
as white. Some erosion has occurred to the both sides of the rear of the pier as a buildup
of sediment.
Figure 5.13 Sectional view of inward facing vanes and plate attached to pier, Vulcan Software
328.5mmm

81 Andrew C Raleigh
5.7 Countermeasure 2 -Outward Facing Vanes with plate attached to
pier The outward facing vanes were tested next and scour occurred at the face similar to the
control pier but not to the same extent width wise (figure 5.14). There was an obvious
deposit of sand directly behind the pier mounding higher than the original level of sand
prior to testing (figure 5.15).
Figure 5.14 Outward vanes & attached plate upstream photos after 2hr testing
Figure 5.15 Outward vanes & attached plate side view photo after 2hr testing
Figure 5.16 is a topographical view of the scour deformation over the bedding surface.
Table 20 to the right indicates the depth profile.

82 Andrew C Raleigh
Table 20 Depth Colour Chart outward vanes & attached plate
Figure 5.16 Outward facing vanes and plate attached to pier - Vulcan Software Depth Profile
Figure 5.17 The distance of deposition of sand from the pier with plate attached after testing for 2
hours at 500L/min,
Figure 5.18 shows the erosion in purple around the vanes at the front of the pier. Scour
around the pier is also obvious. There is as deposit of sand after the pier which shows
as white with some erosion also occurring to the sides of the buildup of sediment
immediately behind the pier. The erosion depth looks to be more even from this
sectional view.
Figure 5.18 Sectional view of Outward facing vanes and plate attached to pier
501.6mmm

83 Andrew C Raleigh
5.8 Countermeasure 3 –Three Collars The three collars was the final test undertaken. This model exhibited the greatest
reduction in scour immediately around the pier with a similar buildup of sand
immediately behind as the outward facing vanes had shown (figures 5.19 & 5.20)
Figure 5.19 Three collars upstream after 2hr testing
Figure 5.20 Three Collars side view photo after 2hr testing
Figure 5.21 is a topographical view of the scour deformation over the bedding surface.
Table 21 to the right indicates the depth profile.

84 Andrew C Raleigh
Table 21 Depth Colour Chart three collars
Figure 5.21 Three Collars - Vulcan Software Depth Profile
Figure 5.22The distance of deposition of sand from the pier with three collars after testing for 2
hours at 500L/min,
Figure 5.23 shows minimal scour around the front of the pier. Downstream of the pier
there is as deposit of sand which shows as white with some consistent erosion showing
either side at the rear of the pier. The erosion depth looks to be more even from this
sectional view.
Figure 5.23 Sectional view Three Collars
615mmm

85 Andrew C Raleigh
5.9 Volume of Erosion -Comparison of countermeasures with control
pier Commencing with a datum point on top of the pier and using the relimiting tool
available on the Vulcan software program a circle with a diameter of 26.32cm was
chosen as the area of interest. This area was chosen as it captured the full extent of
local scour around the control pier as highlighted in Figure 5.25 below. This same area
was then identified for each countermeasure allowing for comparison of erosion of the
models tested.
5.10 Scour Hole Dimensions
Table 22 Physical Modelling of scour holes
Illustrations showing
measured distances
Control
Pier
Inward
Facing
Vanes
with
Plate
attached
to Pier
Outward
Facing
Vanes
with
Plate
attached
to Pier
Three
Collars
attached
to Pier
Cross
Sectional
Width of
Scour
217. 2mm 149.1mm 147.7mm 175.6mm
Bottom
Scour
Width
106.3mm 104.2mm
89.3mm 121.5mm
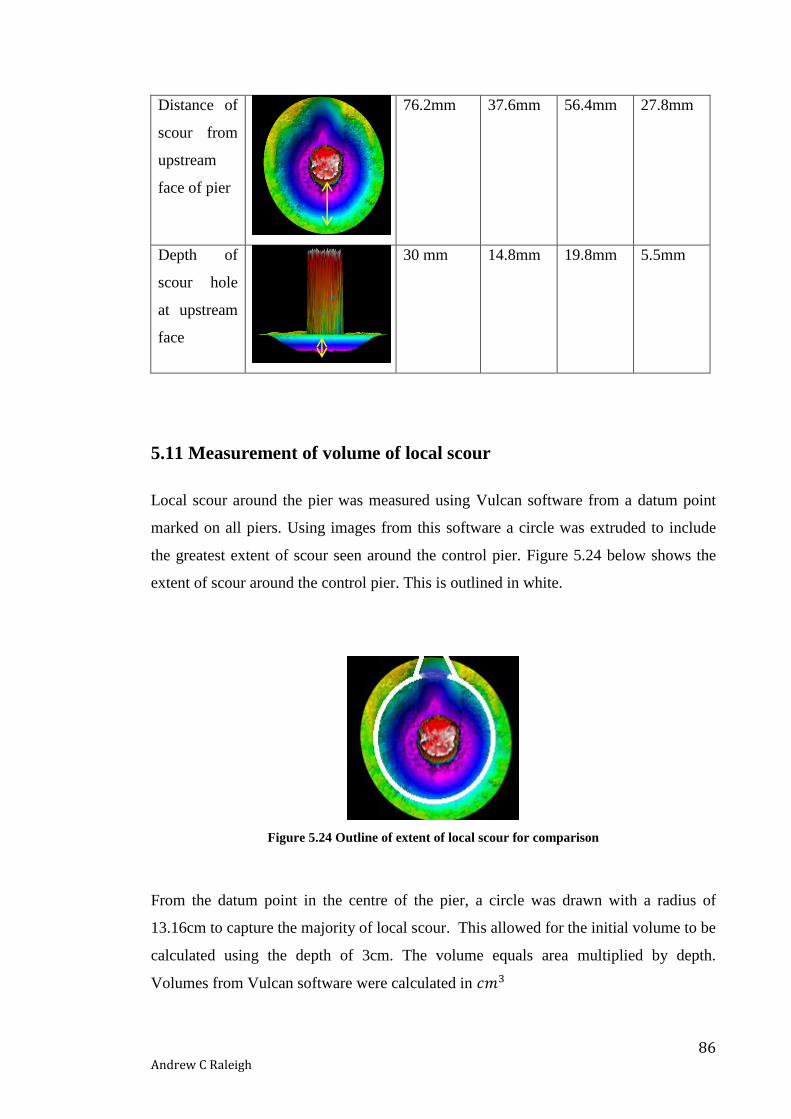
86 Andrew C Raleigh
Distance of
scour from
upstream
face of pier
76.2mm 37.6mm 56.4mm 27.8mm
Depth of
scour hole
at upstream
face
30 mm 14.8mm 19.8mm 5.5mm
5.11 Measurement of volume of local scour
Local scour around the pier was measured using Vulcan software from a datum point
marked on all piers. Using images from this software a circle was extruded to include
the greatest extent of scour seen around the control pier. Figure 5.24 below shows the
extent of scour around the control pier. This is outlined in white.
Figure 5.24 Outline of extent of local scour for comparison
From the datum point in the centre of the pier, a circle was drawn with a radius of
13.16cm to capture the majority of local scour. This allowed for the initial volume to be
calculated using the depth of 3cm. The volume equals area multiplied by depth.
Volumes from Vulcan software were calculated in 𝑐𝑚3

87 Andrew C Raleigh
𝐵𝑎𝑠𝑒 𝑎𝑟𝑒𝑎 = 𝜋 × 13.16𝑐𝑚2 = 544𝑐𝑚2
Depth = 3cm
𝑉𝑜𝑙𝑢𝑚𝑒 = 544𝑐𝑚2 × 3𝑐𝑚 = 1632𝑐𝑚3
Figure 5.25 shows the radius capturing the extent of local scour around bridge pier
From Table 23 when comparing percentages back to the volume of erosion of the
control pier both vane and plate countermeasures reduced scour volume by
approximately half of that of the control pier. The combined countermeasure of three
collars reduced this percentage again to approximately one quarter of the control pier in
scour volume.
Table 23 Percentage of scour over relimited area taken from Vulcan software
Relimited Test
volume prior to
water flow=
1632 𝑐𝑚3
Scour Removed Image
(Arrow indicates
direction of flow)
Percentage of scour
when compared to
before test volume
Control
Pier
=642.743 𝑐𝑚3
=642.743𝑐𝑚3
1632𝑐𝑚3× 100
= 39.38%
Yellow arrow indicates radius of 13.16cm

88 Andrew C Raleigh
Inward
facing
vanes with
pier
attached
plate
= 391.916 𝑐𝑚3
=391.916𝑐𝑚3
1632𝑐𝑚3× 100
= 24.01%
Outward
facing
vanes with
pier
attached
plate
=358.133 𝑐𝑚3
=358.133𝑐𝑚3
1632𝑐𝑚3× 100
= 21.94%
Three
Collars
=137.437 𝑐𝑚3
=137.457𝑐𝑚3
1632𝑐𝑚3× 100
= 8.42%
Efficiencies below were tabulated against the control pier and based on erosion volume
(Table 24). The formula below has been derived to allow for comparison of the various
combined countermeasures against the control pier scour volume efficiency.
𝑟𝑉 =𝑉𝑐−𝑉𝑎
𝑉𝑐× 100 Eq. (5.1)
Where, 𝑟𝑉 = 𝑣𝑜𝑙𝑢𝑚𝑒 𝑜𝑓 𝑠𝑐𝑜𝑢𝑟 𝑝𝑒𝑟𝑐𝑒𝑛𝑡𝑎𝑔𝑒 𝑜𝑓 𝑟𝑒𝑑𝑢𝑐𝑡𝑖𝑜𝑛, 𝑉𝑐 =𝐶𝑜𝑛𝑡𝑟𝑜𝑙 𝑝𝑖𝑒𝑟 𝑣𝑜𝑙𝑢𝑚𝑒 𝑜𝑓 𝑠𝑐𝑜𝑢𝑟, 𝑉𝑎 =𝐶𝑜𝑚𝑏𝑖𝑛𝑒𝑑 𝑐𝑜𝑢𝑛𝑡𝑒𝑟𝑚𝑒𝑎𝑠𝑢𝑟𝑒 𝑣𝑜𝑙𝑢𝑚𝑒 𝑜𝑓 𝑠𝑐𝑜𝑢𝑟

89 Andrew C Raleigh
Table 24 Reduction of scour volume against control pier
Control Pier relimited
section
Combined
countermeasure
relimited section
Inward
facing
vanes
with pier
attached
plate
= 642.743 𝑐𝑚3
= 391.916 𝑐𝑚3
𝑟𝑉
=642.743 𝑐𝑚3 − 391.916 𝑐𝑚3
642.743 𝑐𝑚3
× 100
=39%
Outward
facing
vanes
with pier
attached
plate
= 642.743 𝑐𝑚3
= 358.133 𝑐𝑚3
𝑟𝑉
=642.743 𝑐𝑚3 − 358.133𝑐𝑚3
642.743 𝑐𝑚3
× 100 =44%
Three
Collars
= 642.743 𝑐𝑚3
= 137.457 𝑐𝑚3
𝑟𝑉
=642.743 𝑐𝑚3 − 137.457𝑐𝑚3
642.743 𝑐𝑚3
× 100
=79%
Using Vulcan software the whole bedding platform was scanned and the results over the
entire volume of sand were tabulated. Table 25 below shows the amount of sand
displaced eg volume of erosion removed.
As the control pier is equal to the inward facing entire amount of erosion over the test
surface. There is more erosion downstream but our focus is around local scour which
affects the structural stability of the pier whereas scour over a greater test platform is
not relevant to this research. The figures below are all very similar because of the
percentage of the total area they should not be taken into consideration. Even though
these numbers are small over the entire field but local scour is the significant measure
where and these figures do not show the difference.

90 Andrew C Raleigh
Table 25 Testing Platform – Entire Bedding surface
Reduction of Scour
Control Pier 3.8%
Inward Facing Vanes & Attached Plate 3.8%
Outward Facing Vanes & Attached Plate 5.6%
Three Collars 4.4%
5.5 Conclusion From the results above all three combined countermeasures chosen through the design
matrix in Chapter 3 could be implemented for use in existing structures. The location,
size of channel and known velocity of flow would help determine the best combined
countermeasure in each circumstance.
Outward
Vanes
Three
Collar
Control
Test
Inward
Vanes

91 Andrew C Raleigh
6.0 Discussion
6.1 Introduction The results above are further discussed as well as exploring any contributing factors to
possible errors. Discussion also enters into the opportunity of the implementation of one
or more of the combined countermeasures into field practice.
All piers were tested at a depth of 70ml with an average velocity of 0.194m/s.
6.2 Scour Hole Depth From the analysis of the models, through the Vulcan software program, the following
measurements at the upstream face from the bedding surface to the bottom of the scour
hole were measured. Table 26 shows a comparison of the depths between the control
pier and the combined countermeasures.
Table 26 - Upstream scour depth measurements
Illustrations showing
measured distances
Control
Pier
Inward
Facing
Vanes
with Plate
attached
to Pier
Outward
Facing
Vanes
with Plate
attached
to Pier
Three
Collars
attached
to Pier
Depth of
scour hole
at
upstream
face
30 mm 14.8mm 19.8mm 5.5mm
The control pier eroded to the bottom of the flume (30mm) whereas three collars
(5.5mm) showed a significant reduction in the depth to which scour occurred. The vanes
and attached plate in both configurations also showed a considerable reduction in the
depth when compared to the control (Table 26).

92 Andrew C Raleigh
Scour around the three collars was only 5.5mm. The first collar was placed at D/6
above the bedding surface, the second collar was placed at the bedding surface and the
third one D/6 (11.33mm) below the bedding surface. As these numbers show scour
only developed up to half way between the collar at the bedding surface and the collar
below the bedding surface (5.5mm).
The plate attached to the pier in both configurations using vanes showed a reduction in
the effect of the horseshoe vortices but scour still developed beneath the plate at 14.8
and 19.8mm. With this study it is unsure whether scour would have continued to
develop to the same extent as the control pier if testing had continued. However it does
still show a significant decrease in the time period and could prove a useful tool in the
reduction of scour.
Table 27 - Bottom scour width
Illustrations showing
measured distances
Control
Pier
Inward
Facing
Vanes
with Plate
attached
to Pier
Outward
Facing
Vanes
with
Plate
attached
to Pier
Three
Collars
attached
to Pier
Bottom
Scour
Width
106.3mm 104.2mm
89.3mm 121.5mm
The bottom scour width as Table 27 shows for the three collars at 121.5mm is actually
greater than all the other pier combinations including the control. This is due to the fact
that the collars themselves measured 102mm so even though scour occurred around the
collar once again the total volume of erosion was less for the three collars.
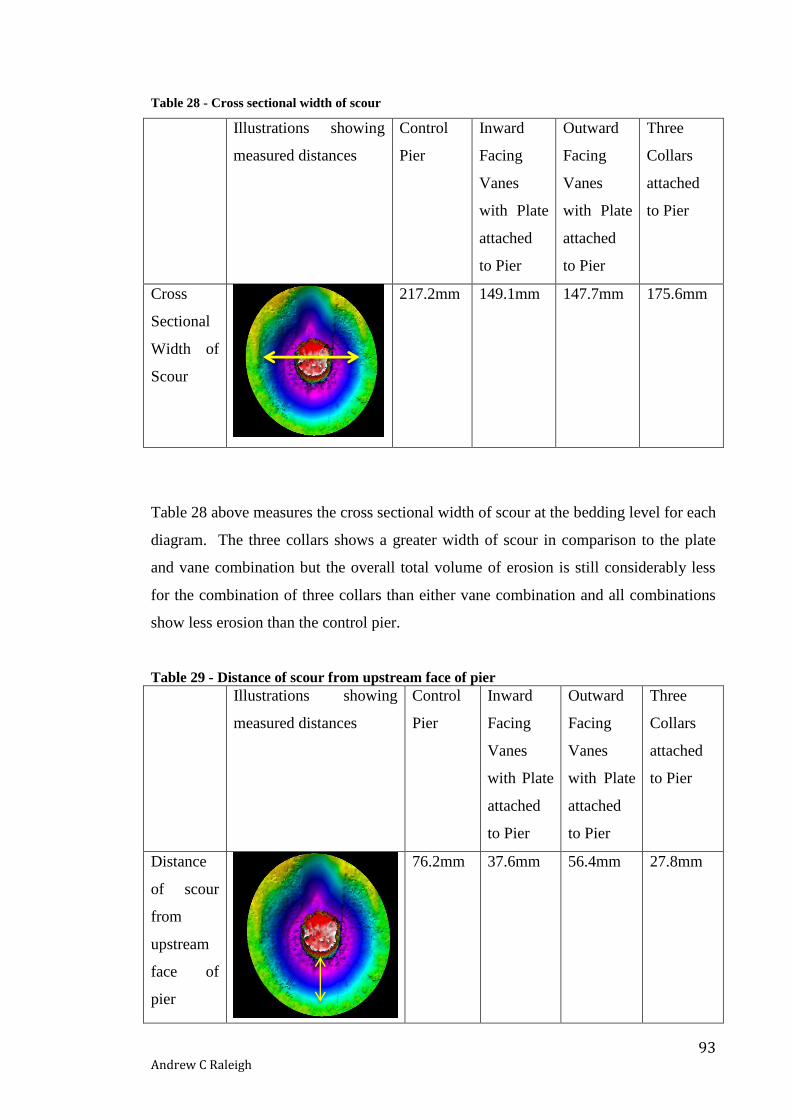
93 Andrew C Raleigh
Table 28 - Cross sectional width of scour
Illustrations showing
measured distances
Control
Pier
Inward
Facing
Vanes
with Plate
attached
to Pier
Outward
Facing
Vanes
with Plate
attached
to Pier
Three
Collars
attached
to Pier
Cross
Sectional
Width of
Scour
217.2mm 149.1mm 147.7mm 175.6mm
Table 28 above measures the cross sectional width of scour at the bedding level for each
diagram. The three collars shows a greater width of scour in comparison to the plate
and vane combination but the overall total volume of erosion is still considerably less
for the combination of three collars than either vane combination and all combinations
show less erosion than the control pier.
Table 29 - Distance of scour from upstream face of pier
Illustrations showing
measured distances
Control
Pier
Inward
Facing
Vanes
with Plate
attached
to Pier
Outward
Facing
Vanes
with Plate
attached
to Pier
Three
Collars
attached
to Pier
Distance
of scour
from
upstream
face of
pier
76.2mm 37.6mm 56.4mm 27.8mm

94 Andrew C Raleigh
Table 29 shows the scour distance from the upstream face of the pier. The three collars
showed the least amount of scour at only 27.8mm which was considerable lower than
the control pier at 76.2mm. The inward vanes also showed a significant reduction when
compared to control pier. The reduction in scour at the front of the pier by using the
combined countermeasures is due to weakened horseshoe vortices.
The vanes have clearly shown a reduction in the width of scour around the pier by
redirecting the flow path. The depth however remained considerable.
Using the theoretical calculation for scour the expected scour depth was 66.80mm.
Due to the testing platform only having a bedding thickness of 30mm no comparison
could be made between the depth achieved and the theoretical depth. Because of the
limitation of the flume height and for the purpose of this research testing was
undertaken at higher flow depths. To compare to the theoretical calculation with the
limitations of the flume height testing would have to have been conducted at a flow
depth of 25mm or lower. Testing was conducted at 70mm.
6.3 Scour development and shape Table 24 shows the development of the horseshoe shape for each pier with a combined
countermeasure. The control pier initially formed the traditional horseshoe shape but at
the end of testing the control pier erosion appeared to be in a bowl shape with a pointy
nose at the rear. The rear nose shape could relate to wake vortices forming a wing like
shape (figure 2.2), but because the test didn’t run for a long enough period of time and
the depth of the flume was too shallow the vortices didn’t develop. Had testing
continued for a longer period of time the usual winged formation at the back of the pier
may have formed. Water as it hit the front of the pier was deviating around the sides of
the pier and may have been crisscrossing at the back of the pier and so the true wake
appearance had not yet developed.
The horseshoe development however can be seen in the combined countermeasures.
The horseshoe effect is suppressed by the plate and or collars in the figures xxxx. This
in turn reduced the effect and shape of development of scour.
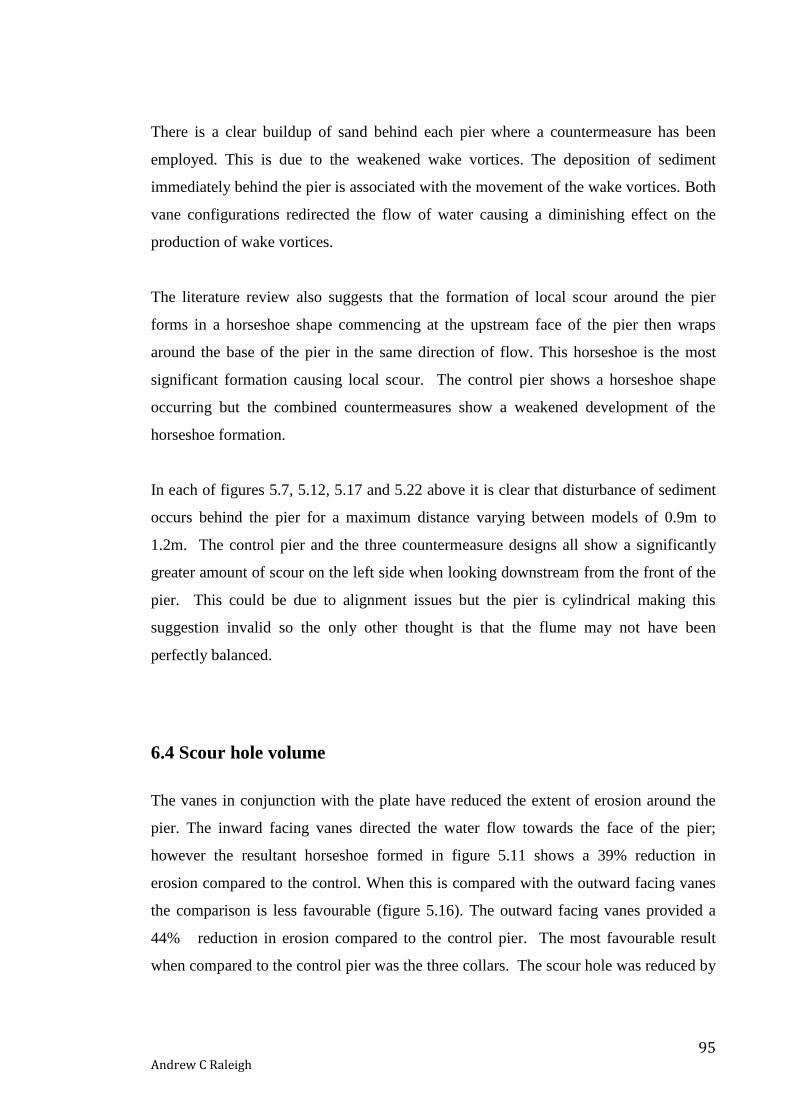
95 Andrew C Raleigh
There is a clear buildup of sand behind each pier where a countermeasure has been
employed. This is due to the weakened wake vortices. The deposition of sediment
immediately behind the pier is associated with the movement of the wake vortices. Both
vane configurations redirected the flow of water causing a diminishing effect on the
production of wake vortices.
The literature review also suggests that the formation of local scour around the pier
forms in a horseshoe shape commencing at the upstream face of the pier then wraps
around the base of the pier in the same direction of flow. This horseshoe is the most
significant formation causing local scour. The control pier shows a horseshoe shape
occurring but the combined countermeasures show a weakened development of the
horseshoe formation.
In each of figures 5.7, 5.12, 5.17 and 5.22 above it is clear that disturbance of sediment
occurs behind the pier for a maximum distance varying between models of 0.9m to
1.2m. The control pier and the three countermeasure designs all show a significantly
greater amount of scour on the left side when looking downstream from the front of the
pier. This could be due to alignment issues but the pier is cylindrical making this
suggestion invalid so the only other thought is that the flume may not have been
perfectly balanced.
6.4 Scour hole volume
The vanes in conjunction with the plate have reduced the extent of erosion around the
pier. The inward facing vanes directed the water flow towards the face of the pier;
however the resultant horseshoe formed in figure 5.11 shows a 39% reduction in
erosion compared to the control. When this is compared with the outward facing vanes
the comparison is less favourable (figure 5.16). The outward facing vanes provided a
44% reduction in erosion compared to the control pier. The most favourable result
when compared to the control pier was the three collars. The scour hole was reduced by

96 Andrew C Raleigh
79% establishing that when this option is available during construction it would be an
optimum choice (figure 5.21).
6.5 Research Limitations The results presented must be considered on the basis of the limitations of testing in a
flume. These results are accurate for the same configurations with the same testing
parameters. As the conditions in a flume will vary to real conditions in the field these
limitations must be considered. It must be stated that most limitations were unexpected
prior to undertaking this research and have been stated below.
The capacity of the small flume was the first limitation as constant filling and draining
was required. When testing commenced with 20L/min through the system it was
necessary to fill the tank level above the invert inlet with a hose to stop the pump
sucking air, thus minimising any surges through the system. At the completion of each
test to allow for scanning under dry conditions the tank had to be drained.
Another constraint encountered prior to testing was the depth of the flume. This limiting
factor played a major role in defining the testing parameters and duration. Testing was
cut off at two hours due to exposure of the flume floor. This meant that erosion ceased
before reaching equilibrium where no more scour would occur.
At the inlet of the flume the baffles did not provide sufficient uniform distribution of the
flow over the width. To improve this, fly screen mesh was introduced to the face of the
baffle to provide a more uniform flow.
The Manuflow velocity meter attached to the small hydraulic flume showed fluctuations
throughout testing of ± 4L/min meaning that the accuracy of discharge could not be
maintained. This could have affected the comparison of erosion between models. It was
noted that this irregularity caused small surges further affecting the accuracy of results.

97 Andrew C Raleigh
Data collected provided an acceptable picture for the purpose of this research. Small
improvements could be made in future research to improve upon the results presented in
this dissertation.
6.6 Areas of Future Research Through literature studied and this research paper the performance of collars as a
combined countermeasure is shown to provide a significant improvement in the
reduction of local scour. Cost will continue to be a limitation for bridge piers already
constructed however the knowledge that these improvements could provide greater
confidence in times of flood is worth a thought. Future research into a more in depth
understanding as to how the collars and or vanes and plates reduce the effect of erosion
on bridge piers is well worth considering.
Future works relating to scour mitigation
Complete further testing using different shaped piers and countermeasures
Use varied depths and velocities for comparison
Complete testing in large agricultural flume and compare to lab results above
Test efficiency of individual countermeasures against combined
countermeasures
98 Andrew C Raleigh
7.0 Conclusion This project has produced some interesting results providing information for scour
mitigating techniques around bridge piers.
The basis of this research aimed to reduce the effect of local scour around bridge piers
through testing of combined countermeasures. Submerged vanes, bed sills, sacrificial
piles, collars, threading and pier slots were evaluated with results concluding that single
countermeasures did not always provide adequate protection to bridge piers. Previous
results provided from other studies claimed to have good results but were shown to be
unreliable due to inadequate design of testing (Tafarojnoruz 2012). In the reduction of
local scour this research hopes to provide a safer bridge design and longer life
expectancy of these structures thus minimising the cost associated with reconstruction
or repairs.
Combined countermeasures have been noted to provide improved results and can be
modified to remain economical. Combined countermeasures were chosen based on
affordability, practicality and constructability. The efficiency of these combined
countermeasures to reduce the scour depth would be the factor upon which
recommendations would be made.
The three combined countermeasures could all be used in bridges in most
circumstances. In small channels where there is a large volume of traffic beneath the
bridge a vane and plate attached pier may prove to be a better countermeasure than
collars which would extend further out around the pier. If the piers are then close
together the extra diameter of collar could be close to the next pier and prohibit traffic
flow below the bridge.
Where flood situations are not uncommon then the three collars would be an ideal
combined countermeasure as when sediment transportation occurs during a flood event
the collars would prevent any further erosion around the pier and make the pier safer
than a pier without any countermeasure.

99 Andrew C Raleigh
Future construction of bridge piers incorporating these combined countermeasures
would be well advised by current engineers when designing new bridges.

100 Andrew C Raleigh
Reference List A. Masjedi, MSBaHK 2010, 'Effects of Bridge Pier Position in a 180 Degree Flume
Bend on Scour Hole Depth', Journal of Applied Sciences, vol. 10, no. 1, pp. 670-5.
Administration, NHIFh 1993, Evaluating Scour at Bridges, HEC 18 Second Edition
February 1993, Resource Consultants & Engineer, Incl Dr. E.V. Richardson, L.J.
Harrison, Dr. J.R. Richardson & S.R.Davis.
Chadwick , JMaMB 2013, Hydraulics in Civil and Environmental Engineering 5edn,
vol. 1, Taylor & Francis Group
Chang, W, Constantinescu, G., Lien, H., Tsai, W., Lai, J., and Loh, C. 2013, 'Flow
Structure around Bridge Piers of Varying Geometrical Complexity', Journal of
Hydraulic Engineering, vol. 139, no. 8, pp. 812-26.
Chiew, Y 1992, 'Scour Protection at Bridge Piers', Journal of Hydraulic Engineering,
vol. 118, no. 9, pp. 1260-9.
Chiew, YaL, F 2000, 'Failure Behavior of Riprap Layer at Bridge Piers under Live-Bed
Conditions', Journal of Hydraulic Engineering, vol. 126, no. 1, pp. 43-55.
Davis, EVRASR 2001, 'Evaluating Scour At Bridges ', FHWA NHI 01-001 HEC 18,
vol. 4, no. Hydraulic Engineering Circular No. 18, p. 378.
Dey, S, Sumer, B., and Fredsøe, J. 2006, 'Control of Scour at Vertical Circular Piles
under Waves and Current.', Journal of Hydraulic Engineering, vol. 132, no. 3, pp. 270-
9.
Esfandi, AMMSBaA 2010, Reduction of Local Scour at a Bridge Pier using Collar in a
180 Degree Flume Bend, Science Alert
<http://scialert.net/fulltext/?doi=jas.2010.124.131&org=11>.
Ettema, R 1980, 'Scour at Bridge Piers ', Bridges, vol. Volume 216 of Department of
Civil Engineering, no. 216, p. 527.
FARO 2015, FARO Focus 3D & FARO Scene Software, FARO,
<http://www.faro.com/products/3d-surveying/laser-scanner-faro-focus-3d/overview>.
Garg , V, Baldev Setia , D. V. S. Verma 2005, 'REDUCTION OF SCOUR AROUND A
BRIDGE PIER BY MULTIPLE COLLAR PLATES', ISH Journal of Hydraulic
Engineering vol. 11, no. 3, pp. 66-80.
Gaudio , R, ATFC 2012, 'ombined flow-altering countermeasures against bridge pier
scour', Journal of Hydraulic Research, vol. 50, no. 1, pp. 35-43.
Gogus, MaD, A 2010, 'Effects of Collars on Scour Reduction at Bridge Abutments',
Scour and Erosion -American Society of Civil Engineers, vol. 1, no. 1, pp. 997-1007.

101 Andrew C Raleigh
Grimaldi, C, Gaudio, R., Calomino, F., and Cardoso, A. 2009a, 'Countermeasures
against Local Scouring at Bridge Piers: Slot and Combined System of Slot and Bed
Sill', Journal of Hydraulic Engineering, vol. 135, no. 5, pp. 425-31.
Grimaldi, C, Gaudio, R., Calomino, F., and Cardoso, A. 2009b, 'Control of Scour at
Bridge Piers by a Downstream Bed Sill.', Journal of Hydraulic Engineering, vol. 135,
no. 1, pp. 13-21.
Jahangirzadeh, AB, Hossein; Akib, Shatirah; Karami, Hojat; Naji, Sareh;
Shamshirband, Shahaboddin 2014, 'Experimental and Numerical Investigation of the
Effect of Different Shapes of Collars on the Reduction of Scour around a Single Bridge
Pier', Scholarly Journals PLoS One, vol. 9, no. 6.
Johnson, P, Hey, R., Tessier, M., and Rosgen, D. 2001, 'Use of Vanes for Control of
Scour at Vertical Wall Abutments', Journal of Hydraulic Engineering, vol. 127, no. 9,
pp. 772-8.
Kells, BGJA 2008, ' Effect of submerged vanes on the scour occurring at a cylindrical
pier', Journal of Hydraulic Research, vol. 46, no. 5, pp. 610-9.
Kumar, V, Raju, K., and Vittal, N 1999, 'Reduction of Local Scour around Bridge Piers
Using Slots and Collars', Journal of Hydraulic Engineering, vol. 125, no. 12, pp. 1302-
5.
Lauchlan, CaM, B 2001, 'Riprap Protection at Bridge Piers', Journal of Hydraulic
Engineering, vol. 127, no. 5, pp. 412-8.
Lauchlan, CS 1999, 'Pier scour countermeasures', The University of Auckland (New
Zealand), UMI Dissertations Publishing.
Masjedi, A, M.S. Bejestan and H. Kazemi 2010, 'Effects of Bridge Pier Position in a
180 Degree Flume Bend on Scour Hole Depth', Journal of Applied Sciences, vol. 10,
no. 1, pp. 670-5.
Melville, BaH, A 1999, 'Use of Sacrificial Piles as Pier Scour Countermeasures.',
Journal of Hydraulic Engineering, vol. 125, no. 11, pp. 1221-4.
Melville, BW 1975, 'Local scour at bridge sites'.
Moncada, AT, -M , J. Aguirre-Pe , J.C. Bolívar , E.J. Flores 2009, 'Scour protection of
circular bridge piers with collars and slots', Journal of Hydraulic Research, vol. 47, no.
1, pp. 119-26.
Mubeen, B, Salman Beg 2013, 'Scour Reduction around Bridge Piers: A Review',
International Journal of Engineering Inventions, vol. 2, no. 7, pp. 7-15.
Nalluri, F 2009, Civil Engineering Hydraulics 5edn, vol. 1, Wiley Blackwell

102 Andrew C Raleigh
Qi, M, Chiew, Y., and Hong, J. 2013, 'Suction Effects on Bridge Pier Scour under
Clear-Water Conditions.', Journal of Hydraulic Engineering, vol. Volume 139, no. 6,
pp. 621–9.
Richards, S 2010, Laminar, Transitional or Turbulent Flow The Engineering ToolBox
viewed 04/10/2014, <http://www.engineeringtoolbox.com/laminar-transitional-
turbulent-flow-d_577.html>.
Roads, DoTaM 2013, Bridge Scour Manual Hydraulics & marine Studies State of
Queensland
<http://www.google.com/url?sa=t&rct=j&q=&esrc=s&source=web&cd=2&ved=0CCU
QFjAB&url=http%3A%2F%2Fwww.tmr.qld.gov.au%2F~%2Fmedia%2Fbusind%2Fte
chstdpubs%2FBridge%2520scour%2520manual%2FBridgeScourManual.pdf&ei=ZER
uVdapLaTDmwXhl4KACA&usg=AFQjCNEjMTNOCu-
FvCKi8QKBR6NRC6B5Ew>.
Sierra, EHK 2009, Open Channel Meter FlowIndex
<http://www.flowmeters.info/wiki/index.php?title=Open_Channel_Meter>.
SSC 2010, How the Frond System works - What is Scour Seabed scour control Systems
Ltd viewed 28/09/14, <http://www.sscsystems.com/scour-control/how-the-frond-
system-works>.
Stern, F 2009, Bluff Body
<http://user.engineering.uiowa.edu/~me_160/lecture_notes/Bluff%20Body2.pdf#page=
1&zoom=auto,-193,798>.
Stevens, M, Gasser, M., and Saad, M. 1991, 'Wake Vortex Scour at Bridge Piers',
Journal of Hydraulic Engineering, vol. 117, no. 7, pp. 891-904.
Stoesser, DFFDT 2010, Vortex Shedding Hybrid Vortex Oscillating System viewed
28/09/2014,
<http://savannah.gatech.edu/people/ffedele/Research/researchsite/OMHtmlExport/sitem
ap.htm>.
Sydney, Uo 2005, Classification of Flows, Laminar and Turbulent Flows, Aerospace,
Mechanical & Mechatronic Engineering <http://www-
mdp.eng.cam.ac.uk/web/library/enginfo/aerothermal_dvd_only/aero/fprops/pipeflow/no
de8.html>.
Tafarojnoruz, A, Gaudio, R., and Calomino, F. 2012, 'Evaluation of Flow-Altering
Countermeasures against Bridge Pier Scour.', Journal of Hydraulic Engineering, vol.
138, no. 8, pp. 297-305.
Tafarojnoruz , A, RG, Subhasish Dey 2010, ''Flow-altering countermeasures against
scour at bridge piers:' Journal of Hydraulic Research, vol. 48, no. 4, pp. 441-52.
Unitec 2011, Open Channel Unitec New Zealand viewed 23/06/15,
<https://moodle.unitec.ac.nz/file.php/1319/_Word/NOTES/L13_Open_Channel_Flow_-
_Part_1.pdf>.

103 Andrew C Raleigh
Williams, DT 2009, Local Scour viewed 28/09/14,
<http://www.dnrc.mt.gov/wrd/water_op/floodplain/streambank_course/local%20_scour.
pdf>.
Younis, BA, V. P. Przulj 2006, 'Computation of turbulent vortex shedding',
Computational Mechanics, vol. 37, no. 5, pp. 408-25.

104 Andrew C Raleigh
Appendix A- Project Specification

105 Andrew C Raleigh