how to measure
TRANSCRIPT

How to Measure Your Market Opportunity for Business Success
INSIDER’S GUIDE | BUILDING PRODUCT MANUFACTURERS DISTRIBUTORS, CONTRACTORS SERVICE COMPANIES

3.Geography2.Dig Deeper 4. Performance
IntroductionKnowing your market opportunity
allows you to better manage
your business and make more
effective decisions. As the famous
management consultant Peter
Drucker professed, “You can’t manage
what you don’t measure.” Whether
you use your own sales people,
independent reps, or distributors,
having a realistic understanding of
your company’s market opportunity
enables you to make more effective
decisions about your sales, marketing
and product performance. This guide
will show you ways to measure your
market opportunity, what data to
use, and where to find it — whether
from new construction activity, major
addition or renovation projects, or the
maintenance and repair of the stock
of existing buildings.
How to Measure Your Market Opportunity for Business Success
Introduction 5.Context Conclusion1. The Numbers Resources6. Two Measures 7.Gauge Opportunity 8.Refine

1 Focus on the Right Construction Activity Numbers Measuring your market opportunity using
Total construction activity can be misleading,
since the number is a combination of three
broad Categories:
¢ Nonresidential: Commercial, institutional & manufacturing buildings
¢ Residential: Single & multifamily housing
¢ Nonbuilding (a.k.a. Infrastructure):
Streets & highways, bridges, water supply
systems, etc.
These categories do not always move in the
same direction over time. For example, total
construction may be up 4% over the prior year,
but individual category performance shows
nonresidential up 16%, residential down 10%,
and nonbuilding unchanged. If your products
and/or services are sold primarily within one of
these categories, then knowing only that total
construction is up 4% doesn’t help you more
accurately measure your market opportunity.
* INSIDER TIP
Knowing your market opportunity informs effective decision making.
How to Measure Your Market Opportunity for Business Success
3.Geography2.Dig Deeper 4. PerformanceIntroduction 5.Context Conclusion1. The Numbers Resources6. Two Measures 7.Gauge Opportunity 8.Refine
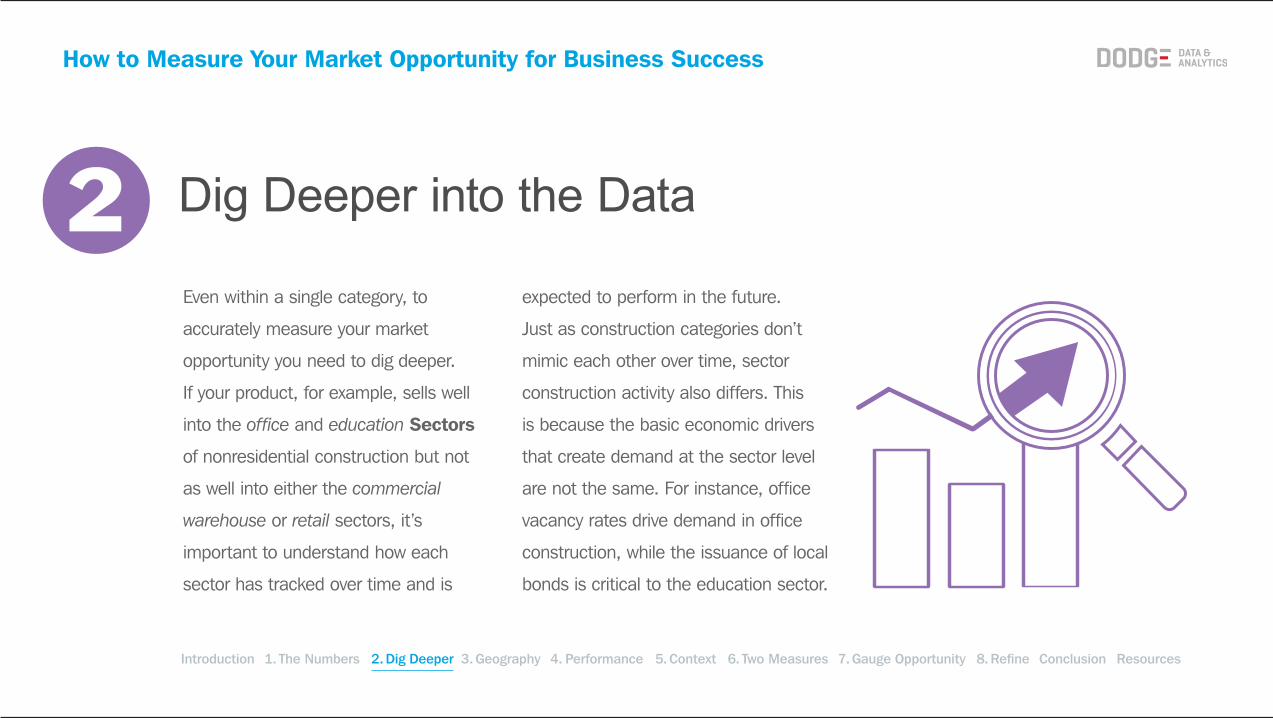
2 Dig Deeper into the Data
Even within a single category, to
accurately measure your market
opportunity you need to dig deeper.
If your product, for example, sells well
into the office and education Sectors
of nonresidential construction but not
as well into either the commercial
warehouse or retail sectors, it’s
important to understand how each
sector has tracked over time and is
expected to perform in the future.
Just as construction categories don’t
mimic each other over time, sector
construction activity also differs. This
is because the basic economic drivers
that create demand at the sector level
are not the same. For instance, office
vacancy rates drive demand in office
construction, while the issuance of local
bonds is critical to the education sector.
How to Measure Your Market Opportunity for Business Success
3.Geography2.Dig Deeper 4. PerformanceIntroduction 5.Context Conclusion1. The Numbers Resources6. Two Measures 7.Gauge Opportunity 8.Refine

3 Dissect Construction Activity by Geography
The change in national U.S. construction activity is never
a reflection of what’s happening in a specific region, state,
or local market. For example, the national U.S. office
construction sector grew an average of nearly 40% from
2010 to 2015. However, growth for the top three states
for office starts varied greatly from the national average:
California roughly 125%, New York slightly above 25%,
and Texas exceeding 200%. Successfully measuring your
market opportunity requires that you dissect construction
activity by geography.
How to Measure Your Market Opportunity for Business Success
216%27%126%37%U.S. Total California New York Texas
Average Office Starts (2011-2015) Growth from 2010 Office Starts
3.Geography2.Dig Deeper 4. PerformanceIntroduction 5.Context Conclusion1. The Numbers Resources6. Two Measures 7.Gauge Opportunity 8.Refine

4 Gauge True Performance
Analyzing construction activity by more discrete geographies
allows you to gauge the absolute and comparative size
of your market opportunity now, in addition to its change
over time. It can also help you more objectively assess
performance and help set expectations. If sales territory or
distributor A has twice as many sales as sales territory or
distributor B, does it mean territory A is performing better?
Not necessarily. If territory A’s market opportunity is three
times greater than territory B’s, then in truth territory A is not
performing as well against its market opportunity.
How to Measure Your Market Opportunity for Business Success
3.Geography2.Dig Deeper 4. PerformanceIntroduction 5.Context Conclusion1. The Numbers Resources6. Two Measures 7.Gauge Opportunity 8.Refine
4
How to Measure Your Market Opportunity for Business Success
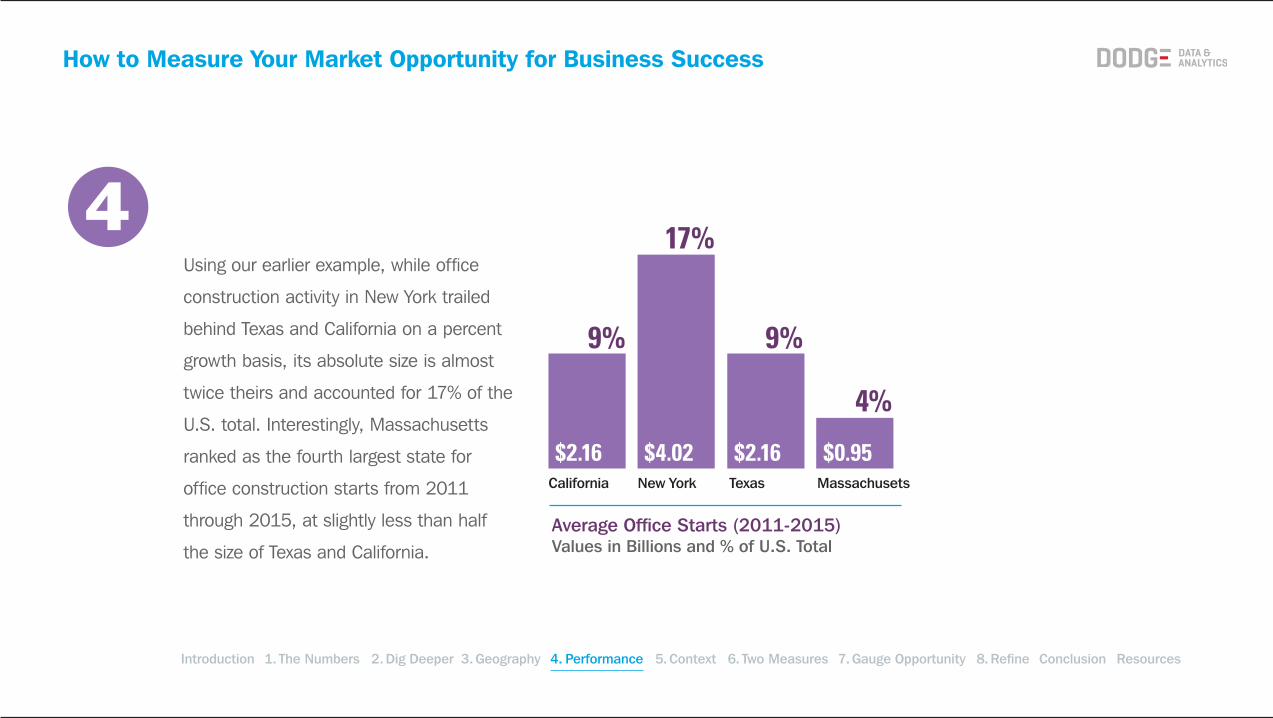
Using our earlier example, while office
construction activity in New York trailed
behind Texas and California on a percent
growth basis, its absolute size is almost
twice theirs and accounted for 17% of the
U.S. total. Interestingly, Massachusetts
ranked as the fourth largest state for
office construction starts from 2011
through 2015, at slightly less than half
the size of Texas and California.
$0.95$2.16$4.02$2.16California New York Texas Massachusets
Average Office Starts (2011-2015) Values in Billions and % of U.S. Total
9%
17%
9%
4%
3.Geography2.Dig Deeper 4. PerformanceIntroduction 5.Context Conclusion1. The Numbers Resources6. Two Measures 7.Gauge Opportunity 8.Refine

5 Expected Construction Activity Needs Context
Knowing that today’s temperature is 10
degrees higher than yesterday’s is only
valuable if you have context. Was yesterday’s
temperature 60 degrees or 80 degrees?
And was that considered low, high or
average? The same need for context holds
true for understanding next year’s expected
construction activity, which creates your
market opportunity.
* INSIDER TIP
Based on expected sustainable demand, annual single family housing starts should be about one million units.
How to Measure Your Market Opportunity for Business Success
3.Geography2.Dig Deeper 4. PerformanceIntroduction 5.Context Conclusion1. The Numbers Resources6. Two Measures 7.Gauge Opportunity 8.Refine

5
How to Measure Your Market Opportunity for Business Success
By viewing your market opportunity as a time series,
you have the historical perspective to interpret
expected change, be it positive or negative. For
instance, having known in 2011 that single family
housing units would record back-to-back annual
increases of 25% in 2012 and 21% in 2013 is not
good enough. To reveal the full story, a historical time
series of single family housing starts is needed. As you
can see from the graph, even with two years of very
strong annual growth, single family housing in 2013
amounted to a weak 624,000 units. Single Family Housing Starts¢Annual % Change ¢Units in Thousands
’01 ’02 ’03 ’04 ’05 ’06 ’07 ’08 ’09 ’10 ’11 ’12 ’13 ’14 ’15
1,700
1,500
1,300
1,100
900
700
500
300
624,000units
25%
21%
3.Geography2.Dig Deeper 4. PerformanceIntroduction 5.Context Conclusion1. The Numbers Resources6. Two Measures 7.Gauge Opportunity 8.Refine

6 Understand the Two Standard Measures
The two standard measures of construction
activity are the U.S. Census’ Construction
Value Put in Place, a.k.a. construction
spending, and Dodge Data & Analytics’
Construction Starts. They exist for
different reasons.
The federal government, mainly through
the U.S. Census Department, tracks
overall economic activity to understand
how the economy is performing, and as
a result enacts appropriate policymaking
decisions. Private companies also rely on
this government-generated data to evaluate
business conditions and react accordingly.
Census’ Construction Value Put in Place
is a coincident indicator. That’s because it
How to Measure Your Market Opportunity for Business Success
* INSIDER TIP
It’s important to understand the differences between the two standard measures of construction activity.
3.Geography2.Dig Deeper 4. PerformanceIntroduction 5.Context Conclusion1. The Numbers Resources6. Two Measures 7.Gauge Opportunity 8.Refine

6
How to Measure Your Market Opportunity for Business Success
records construction spending as it
occurs. For example, if a $40 million
office building starts construction
in January, then Census records
each month how much of the $40
million has actually been spent until
construction is complete.
Dodge Data & Analytics’ Construction
Starts is a leading indicator. This is
because Dodge Data & Analytics, using
the same $40 million office project,
records the entire $40 million in the
month of January when the project
starts. Therefore, Construction Starts
indicates what will be spent, while
Construction Value Put in Place
indicates what has been spent.
3.Geography2.Dig Deeper 4. PerformanceIntroduction 5.Context Conclusion1. The Numbers Resources6. Two Measures 7.Gauge Opportunity 8.Refine

7 Use Construction Starts to Gauge Opportunity
The Census Department’s Construction
Value Put in Place suffices to measure
the overall health of construction in the
U.S. economy.
Dodge Data & Analytics’ Construction
Starts data, because it’s a leading indicator
of forthcoming construction spend and is
compiled from individual Dodge Reports,
enables building product manufacturers and
other firms whose products and services are
sold into the construction industry to gauge
in advance the direction and change in
their market opportunity at a granular level.
Whether you sell nationally, regionally, or
locally, this data can conform to your specific
requirements, giving you the insights needed
to make more effective business decisions.
* INSIDER TIP
Dodge’s Construction Starts data is built up from the summation of individual Dodge Reports.
How to Measure Your Market Opportunity for Business Success
3.Geography2.Dig Deeper 4. PerformanceIntroduction 5.Context Conclusion1. The Numbers Resources6. Two Measures 7.Gauge Opportunity 8.Refine

8 Refine Your Market Opportunity
Tracking the movement of Construction
Starts for those sectors creating demand
for your products and/or services has great
value in helping you make better business
decisions. Historical and forecast changes
in Construction Starts for the combination
of these sectors, by itself, is often a very
good proxy for understanding your market
opportunity. However, you can further calibrate
* INSIDER TIP
Take additional steps to convert construction activity into market opportunity.
How to Measure Your Market Opportunity for Business Success
3.Geography2.Dig Deeper 4. PerformanceIntroduction 5.Context Conclusion1. The Numbers Resources6. Two Measures 7.Gauge Opportunity 8.Refine

8
How to Measure Your Market Opportunity for Business Success
your market opportunity by applying four additional refinements:
¢Lags
¢Usage Weights
¢Use Factors
¢Existing Building Stock
Lags. Depending on the product or service being sold, the Lag—
meaning the time in months between when market opportunity
is realized versus when a project’s Construction Start occurs—will
vary. For finishing products, such as flooring and acoustical ceilings,
Lag time will be longer than for other products, such as curtain wall,
roofing and HVAC equipment.
3.Geography2.Dig Deeper 4. PerformanceIntroduction 5.Context Conclusion1. The Numbers Resources6. Two Measures 7.Gauge Opportunity 8.Refine

8
How to Measure Your Market Opportunity for Business Success
Lags also vary by project size and in some instances by
sector. Just as a $100 million hospital project takes longer
to build than one half as large, an office building will typically
take more time to construct than a similar-sized warehouse.
By combining Census Department data with knowledge of
when your products or services are sold and installed, you
can determine the appropriate Lags to apply to Construction
Starts, shifting the timing of the Construction Starts series to
better align to when your market opportunity occurs.
Usage Weight. Usage Weight is a comparative weight or
ranking of how much market opportunity you expect from Nonresidential Buildings¢$10M or more ¢$5M<$10M ¢$3M<$5M ¢$1M<$3M
0 3 6 9 12 15 18 21 24 27 30 33 36 39 42 45 48
100%
90%
80%
70%
60%
50%
40%
30%
20%
10%
0%
Months from Construction Start
Cum
ulat
ive
% C
ompl
ete
3.Geography2.Dig Deeper 4. PerformanceIntroduction 5.Context Conclusion1. The Numbers Resources6. Two Measures 7.Gauge Opportunity 8.Refine

8
How to Measure Your Market Opportunity for Business Success
the same amount of Construction Starts
from one sector to another. For instance,
if your expected market opportunity is ten
times more from a $20 million healthcare
project versus a $20 million retail project,
then healthcare’s Usage Weight is ten
(10) and retail one (1). If a $20 million
office project’s market opportunity falls
roughly in between, then its Usage Weight
is five (5), and so on. Knowledgeable
individuals within your firm can often
come up with a basic Usage Weight.
Use Factor. Use Factor is a
measurement of how much of a
specific product or products is used
in projects in each sector. Use Factor
allows you to calculate that X amount
of market opportunity is generated
for your product(s) by Y amount of
Construction Starts.
You can develop a Use Factor in various
ways, including: quantity take-offs from
building plans, either outsourced or
from projects done in-house (for bidding
projects directly or through distributors);
your company’s sales records; and bids
prepared for contractors. Greater use of
CRM software and better mining of in-
house data have made generating a Use
Factor more viable than in the past.
Existing Building Stock. A significant
share of total market opportunity for
your company may result from an
owner’s need to properly maintain and
3.Geography2.Dig Deeper 4. PerformanceIntroduction 5.Context Conclusion1. The Numbers Resources6. Two Measures 7.Gauge Opportunity 8.Refine

8 repair their building(s). Replacing or
upgrading roofs, locksets, door closures,
toilet partitions, carpeting, and plumbing
fixtures are all examples of this type of
market opportunity.
Knowing the existing stock of buildings
is the best way to size this maintenance
and repair market opportunity.
Similar to understanding your market
opportunity from new construction
activity, you need to assess by sector
and geography the existing stock
buildings slated for a major addition or
renovation project. Additionally, knowing
the age of the existing stock will enable
you to factor in the length of your
product’s life cycle, i.e. how many years
before it needs to be replaced — or to
determine what portion of the existing
stock is old enough to have originally
installed products replaced with
those that are more energy efficient,
representing market opportunity.
Your market opportunity generated from
Construction Starts generally has a much
greater degree of change over time than
from the existing stock. You can measure
the change in market opportunity
for existing building stock by applying
indicators of a sector’s more general
economic health. For instance, for K-12
schools it could be the passage of local
bond initiatives, for hotels the change
in revenues per available room, and for
offices the change in vacancy rates.
How to Measure Your Market Opportunity for Business Success
3.Geography2.Dig Deeper 4. PerformanceIntroduction 5.Context Conclusion1. The Numbers Resources6. Two Measures 7.Gauge Opportunity 8.Refine
The Bottom LineTo better manage your business, you need to understand your
market opportunity. To uncover and measure that market opportunity
requires that you understand how the construction sectors that
sell well for your product or service perform over time, pinpoint the
geographic areas that have the best potential, use historical data to
anticipate change, and further refine those opportunities to make the
best decisions. Armed with a realistic measurement of your market
opportunities, you’re ready to achieve business success.
How to Measure Your Market Opportunity for Business Success
3.Geography2.Dig Deeper 4. PerformanceIntroduction 5.Context Conclusion1. The Numbers Resources6. Two Measures 7.Gauge Opportunity 8.Refine

How to Measure Your Market Opportunity for Business Success
Additional Resources to Grow Your Business
To learn more about how you can grow
your business, visit www.construction.com.
Call 888-808-6169 to find out how
Dodge can customize a solution for you.
About Dodge Data & Analytics
Dodge Data & Analytics is a technology-driven construction project
data, analytics and insights provider. Dodge provides trusted market
intelligence that helps construction professionals grow their business,
and is redefining and recreating the business tools and processes on
which the industry relies. Dodge is creating an integrated platform
that unifies and simplifies the design, bid and build process, bringing
data on people, projects and products into a single hub for the entire
industry, from building product manufacturers to contractors and
specialty trades to architects and engineers. The company’s products
include Dodge Global Network, Dodge PlanRoom, Dodge PipeLine,
Dodge SpecShare, Dodge BuildShare, Dodge MarketShare, and the
Sweets family of products. To learn more, visit www.construction.com.
3.Geography2.Dig Deeper 4. PerformanceIntroduction 5.Context Conclusion1. The Numbers Resources6. Two Measures 7.Gauge Opportunity 8.Refine

For more information call: 888-808-6169or visit www.construction.com
MarketShareBuildShare SpecShare
How to Measure Your Market Opportunity for Business Success