how to make the budget less sexist - the australia institute
TRANSCRIPT

How to make the budget less sexist
Budget policy has traditionally advantaged men over women. This paper makes seven
recommendations on how to improve women’s economic security and use the budget as a tool to
reduce gender inequality.
Discussion paper
Matt Grudnoff Eliza Littleton Dave Richardson Richard Denniss April 2021

ABOUT THE AUSTRALIA INSTITUTE The Australia Institute is an independent public policy think tank based in Canberra. It is funded by donations from philanthropic trusts and individuals and commissioned research. We barrack for ideas, not political parties or candidates. Since its launch in 1994, the Institute has carried out highly influential research on a broad range of economic, social and environmental issues.
OUR PHILOSOPHY As we begin the 21st century, new dilemmas confront our society and our planet. Unprecedented levels of consumption co-exist with extreme poverty. Through new technology we are more connected than we have ever been, yet civic engagement is declining. Environmental neglect continues despite heightened ecological awareness. A better balance is urgently needed.
The Australia Institute’s directors, staff and supporters represent a broad range of views and priorities. What unites us is a belief that through a combination of research and creativity we can promote new solutions and ways of thinking.
OUR PURPOSE – ‘RESEARCH THAT MATTERS’ The Institute publishes research that contributes to a more just, sustainable and peaceful society. Our goal is to gather, interpret and communicate evidence in order to both diagnose the problems we face and propose new solutions to tackle them.
The Institute is wholly independent and not affiliated with any other organisation. Donations to its Research Fund are tax deductible for the donor. Anyone wishing to donate can do so via the website at https://www.australiainstitute.org.au or by calling the Institute on 02 6130 0530. Our secure and user-friendly website allows donors to make either one-off or regular monthly donations and we encourage everyone who can to donate in this way as it assists our research in the most significant manner.
Level 1, Endeavour House, 1 Franklin St Canberra, ACT 2601 Tel: (02) 61300530 Email: [email protected] Website: www.australiainstitute.org.au ISSN: 1836-9014

Contents
Summary ............................................................................. Error! Bookmark not defined.
Recommendations ...................................................... Error! Bookmark not defined.
Introduction ...................................................................................................................... 2
Section 1 - Stage 3 tax cuts and gender ........................................................................... 5
The stage 3 tax cut ........................................................................................................ 5
The gender split of stage 3 tax cuts .............................................................................. 7
Conclusion & recommendations .................................................................................. 8
Section 2 - Tax concessions .............................................................................................. 9
Distribution of tax concessions by income and wealth ................................................ 9
Distribution of tax concessions by gender ................................................................. 10
Distribution of tax concessions versus tax paid ......................................................... 11
Reviewing tax concessions ......................................................................................... 12
Conclusion & recommendations ................................................................................ 12
Section 3 - Superannuation gender gap ......................................................................... 13
Recommendation ....................................................................................................... 15
Section 4 - Labour force participation and childcare ..................................................... 16
Participation ............................................................................................................... 16
Childcare ..................................................................................................................... 17
Costs and Benefits ...................................................................................................... 18
Conclusion & Recommendation ................................................................................. 19
Section 5 - Stimulus through building and construction ................................................ 20
Recommendation ....................................................................................................... 22
Section 6 - Should we ignore women and children? Restructuring JobSeeker.............. 23
Work incentives .......................................................................................................... 24
Conclusion & Recommendations ............................................................................... 25
Conclusion ...................................................................................................................... 26
Appendix A ...................................................................................................................... 27


How to make the budget less sexist 1
Recommendations
Recommendation: The Commonwealth Government abandon the stage 3 income tax cut.
Recommendation: The Government establish a revenue review committee to look at all budget revenue sources, as well as tax concessions.
Recommendation: That the social benefit of negative gearing, superannuation tax concessions, capital gain tax discount and excess franking credits are investigated by the revenue review committee, and consideration is given to reducing or removing the tax concessions.
Recommendation: Superannuation tax concessions be channelled into additional support for women with broken work histories and lower incomes prior to retirement.
Recommendation: The Government reintroduce free or low-cost universal public childcare to ensure that this cost does not prevent women from participating in paid work.
Recommendation: Economic stimulus packages are directed to reflect the modern workforce and stimulate the economy via industries that are labour intensive and have higher female representation in their workforce.
Recommendation: That the inadequate JobSeeker is increased, and income support for families increased in proportion.

How to make the budget less sexist 2
Introduction
Budgets spell out a government’s priorities in the clearest possible terms. Last year’s budget, and every budget before it, has prioritised the preferences of men over the priorities of women.
Budgets show the priorities that governments are willing to spend money on and those they are not. Helping women take paid maternity leave, helping parents pay for childcare, helping women earn as much as men, helping women find refuge from domestic violence or recover from domestic or sexual violence, or helping women to retire as comfortably as men have simply not been priorities of the Federal Government for the last seven years.
Since 2018, the Coalition has legislated more than $300 billion in income tax cuts. Since it has come to power in 2013, it has increased spending on defence by 30 per cent. It has spent $100 million on the infamous ‘sports rorts’ grants program and found $500 million to expand the Australian War Memorial.
This paper sets out a number of key areas in which government spending and government policy, clearly advantage men at the expense of women. As economists, the authors have no specific insight into what combination of government policies would be ‘fair’, but what we can do is highlight the nature and extent of the gender inequality that flows from some major areas of government policy.
The paper starts with an analysis of the upcoming personal tax cuts which were legislated back in 2018 and 2019, before the pandemic and the recession. A progressive income tax system is the central pillar of any attempt to reduce income inequality in a democracy. By definition a progressive income tax system ensures that high income earners pay not just more tax than low-income earners, but a higher proportion of their income in tax. In turn, any attempt to ‘flatten’ the income tax rates and reduce its progressive nature will deliver significantly more money to those who earn the most than those who earn the least.
Because men, on average, are paid significantly more than women and because the very highest income earners are disproportionally male, all efforts to flatten the tax scales in Australia deliver significant bigger benefits to men than women. For example, as discussed in Section 1, the legislated stage 3 income tax cuts, which will commence in 2024, will cost $18 billion per year, 67 per cent of which will flow to men and 33 per cent of which will flow to women. To be clear, the stage 3 income tax cuts will increase the gap between the disposable incomes of men and women.
While a progressive income tax system has the capacity to reduce income inequality, this capacity can be significantly diminished when significant amounts of income are treated ‘concessionally’, that is, taxed at lower rates than ordinary income. For example,

How to make the budget less sexist 3
contributions to superannuation are taxed at a flat rate of 15 per cent whereas personal income is taxed on a sliding scale from zero per cent up to $18,201 per year to 47 per cent (including the Medicare levy) on income above $180,000. Because men earn significantly more than women and have significantly larger superannuation balances, men receive around 72 per cent of the $41 billion per year benefit of tax concessions for superannuation. As discussed in Section 2, when tax concessions for superannuation, capital gains tax, negative gearing and franking credit refunds are combined, 70 per cent of the $60 billion annual benefits from these concessions flow to men.
Section 3 looks specifically at superannuation. The skew towards men from the $41 billion cost of superannuation tax concessions combines with the gender pay gap and the broken work history of women to result in large gaps in superannuation balances between men and women.
Moving from how the government chooses to collect (and not collect) tax to how it spends money, Section 4 considers the impact of government decisions to make childcare relatively expensive in Australia. While free or very low-cost childcare is provided in a number of countries, most notably the Nordic countries, in Australia parents pay significant fees to send children to childcare. Fees which, once deducted from the relatively low wages paid by women, often lead to women opting out of paid work in the years after the birth of their children. For example, 62.8 per cent of women with children not engaged in paid work identified that the cost of childcare was a barrier to working.
As Section 4 shows, not only would the cost of providing free childcare be a small fraction of the cost of providing the stage 3 income tax cuts, but economic modelling also commissioned by the Australia institute shows that free childcare would provide significantly greater employment, productivity and GDP benefits. It would also help improve the distribution of both work and income between men and women.
The number of women employed is not just related to the design of the tax system, the childcare system and the preferences of women, it is also affected by the number and kind of jobs that are available. As the economy recovers from the COVID recession, the Commonwealth Government has been active in spending money to ‘create jobs’ but, as Section 5 makes clear, the shape of government spending choices is as significant as the size of the spending. For example, for every $1 million spent on building roads and other construction works, 1.2 jobs are created, compared to 14 jobs when the same amount is spent on education. Significantly, when the number of jobs for women is considered the results are even more stark. While spending $1 million on roads might create an average of 1.2 direct jobs, it creates only 0.2 jobs for women. Spending the same amount on education, on the other hand, creates 11 jobs for women. Employment impacts and the share of jobs going to women are also high in health, caring sectors, and the arts.

How to make the budget less sexist 4
Section 6 considers assistance for the unemployed. We note that all the attention has been on the single unemployed person. They received the JobSeeker supplement and the meagre additional payment that followed the suspension of the supplement. Low-income families missed out, because while adults in unemployed families received the base increase that meant proportionately lower increases for families with children. That impacts on the resources going mainly to women who shoulder the care responsibilities in most families.
Our discussion in this paper reflects our findings of massive bias against women in the budget initiatives and the impacts that flow from budget measures. This is despite the long history of women’s statements among the budget papers and various bureaucratic arrangements that are supposed to bring women’s perspectives into the framing of budgets. That history suggests formal responses to perceived problems can be ineffective if those who frame the budget do not prioritise outcomes for women.

How to make the budget less sexist 5
Section 1 - Stage 3 income tax cuts and gender
The gender pay gap means that men earn more than women. The official gender pay gap, which compares men and women just in full time positions, is 13.4 per cent.1 The gender pay gap for all workers, including full time, part time, causal and other insecure employment positions, is 31 per cent.2 The difference is explained by the fact that women are more likely to be in part time, casual and other insecure jobs.
One of the ways the budget can reduce inequality between the genders is by taxing higher income earners, who are more likely to be men, more and redistributing the revenue raised in the form of services which are more likely to go to women.
Tax cuts that mainly go to high income earners have the effect of widening the gap between the take home pay of men and women. If the Government then chooses to ‘pay’ for these tax cuts by cutting funding to services that are more likely to benefit women, that will further increase gender inequality.
THE STAGE 3 INCOME TAX CUT In July 2024, the third and final stage of the Commonwealth Government’s income tax plan will come into effect. The tax cut will cost the budget $18 billion in 2024-25.
This stage of the tax cut will:
• Increase the income at which the top tax bracket begins from $180,001 to $200,001. • Removes the 37 per cent backet which previously applied to incomes from $120,001
to $180,000. • Lower the income tax rate for the new bracket that extends from $45,001 to
$200,000 from 32.5 per cent to 30 per cent.
After this tax cut comes into effect, people earning from $45,001 to $200,000 per year will pay the same marginal tax rate.
1 Australian Government (2021) Australia’s Gender Pay Gap Statistics 2021, Workplace Gender Equality
Agency, 26 February, available at <https://www.wgea.gov.au/publications/australias-gender-pay-gap-statistics>
2 Pennington A (2021) Women’s Casual Job Surge Widens Gender Pay Gap, Centre for Future Work, 8 March, available at <https://www.futurework.org.au/surge_in_women_s_casual_work_widens_gender_pay_gap>

How to make the budget less sexist 6
This tax cut will give very little to those on low and middle incomes. Examples of various incomes and the size of the tax cut are shown in Table 1.
Table 1 – Various annual incomes and the size of the tax cut they will receive in July 2024
Annual Income Tax cut per week (rounded to nearest dollar) $45,000 Nil $60,000 $7 $90,000 $22 $120,000 $36 $150,000 $76 $200,000 $174
Source: Authors’ calculations from legislated tax cut in July 2024
While the tax cut for those on $45,000 or less is zero, those earning $200,000 or more will get over $9,000 per year. A graph showing the size of the tax cut over an income range from $5,000 per year to $200,000 per year is shown in Figure 1.
Figure 1 – Size of the tax cut per week
Source: Authors’ calculations from legislated tax cut in July 2024
An analysis of the stage 3 income tax cuts shows that high income earners get most of the tax cut.3 More than half will go to the top 10 per cent of taxpayers and 72 per cent will go to the top 20 per cent. Half of all taxpayers only get just five per cent and the bottom 20 per cent will get nothing. The income distribution of stage 3 income tax cuts by decile is shown in Figure 2.
3 Information on the distributional analysis can be found in Appendix A.
$0$20$40$60$80
$100$120$140$160$180$200
$5,
000
$15
,000
$25
,000
$35
,000
$45
,000
$55
,000
$65
,000
$75
,000
$85
,000
$95
,000
$10
5,00
0
$11
5,00
0
$12
5,00
0
$13
5,00
0
$14
5,00
0
$15
5,00
0
$16
5,00
0
$17
5,00
0
$18
5,00
0
$19
5,00
0
Wee
kly
tax
cut
Income

How to make the budget less sexist 7
Figure 2 – Income distribution of stage 3 income tax cuts in July 2024
Source: Calculations by model described in appendix A.
THE GENDER SPLIT OF STAGE 3 INCOME TAX CUTS Men will receive two thirds of the stage 3 income tax cuts while one third will go to women. This means that for every dollar of tax cut going to women, men get two dollars. This is because men are more likely to be higher income earners and most of the benefit of the tax cut goes to high income earners.
This can be shown by looking at the proportion of the tax cut going to different quintiles by gender. Quintiles group all taxpayers by income into five equal groups. The lowest 20 per cent of taxpayers in the first quintile. The next 20 per cent of income earners in the second quintile and so on, with the top 20 per cent of income earners in the fifth quintile. Figure 3 shows the distribution of the tax cut by income quintiles and gender.
0.0% 0.0% 0.4% 1.8% 3.3% 5.1% 7.4%10.3%
18.9%
52.7%
0%
10%
20%
30%
40%
50%
60%
1 2 3 4 5 6 7 8 9 10
Prop
ortio
n of
tax
cut
DecilesBottom 10% Top 10%

How to make the budget less sexist 8
Figure 3 – Distribution of stage 3 income tax cut by income quintiles and gender
Source: Calculations by model described in appendix A.
Men in the top 20 per cent of taxpayers get over half of all the benefit. This means they get more benefit than women in all five quintiles as well as all other men in every quintile except the top quintile. This highlights how this tax cut benefits high income men. Even though women are far less likely to be in the top 20 per cent of taxpayers, those women that are get more of the total benefit (20 per cent) than women in all other quintiles (12 per cent).
The bottom 20 per cent of taxpayers, the majority of whom are women, get nothing from this tax cut. The second quintile, which is also majority women, get just two per cent (one per cent each for men and women). Each quintile after that is majority men and gets an increasingly larger share.
CONCLUSION & RECOMMENDATIONS Of the $18 billion per year stage 3 income tax cuts, men will receive $12 billion and women $6 billion. This will have the effect of further widening the gap between men and women’s take-home pay. If Australia is to take seriously improving the economic security of women then it needs to make tax changes that help reduce gender inequality, not increase it.
A progressive income tax system is one of the great bulwarks against inequality, including inequality between genders. The stage 3 tax cuts will flatten the income tax system, making it less progressive. This income tax cut will result in men paying a smaller proportion of total tax than they were previously and women paying a larger proportion of total tax.
Recommendation: The Commonwealth Government abandon the stage 3 income tax cut.
0% 1%4%
7%
20%
0% 1%5%
11%
51%
0%
10%
20%
30%
40%
50%
60%
1 2 3 4 5
Prop
ortio
n of
tax
cuts
Quintiles
Female Male
How to make the budget less sexist 9
Section 2 - Tax concessions
The progressive income tax system is one of the most powerful tools to reduce gender inequality in Australia. The progressive nature of the income tax system can be undermined by tax concessions if they are mainly used by high income and wealthy households.
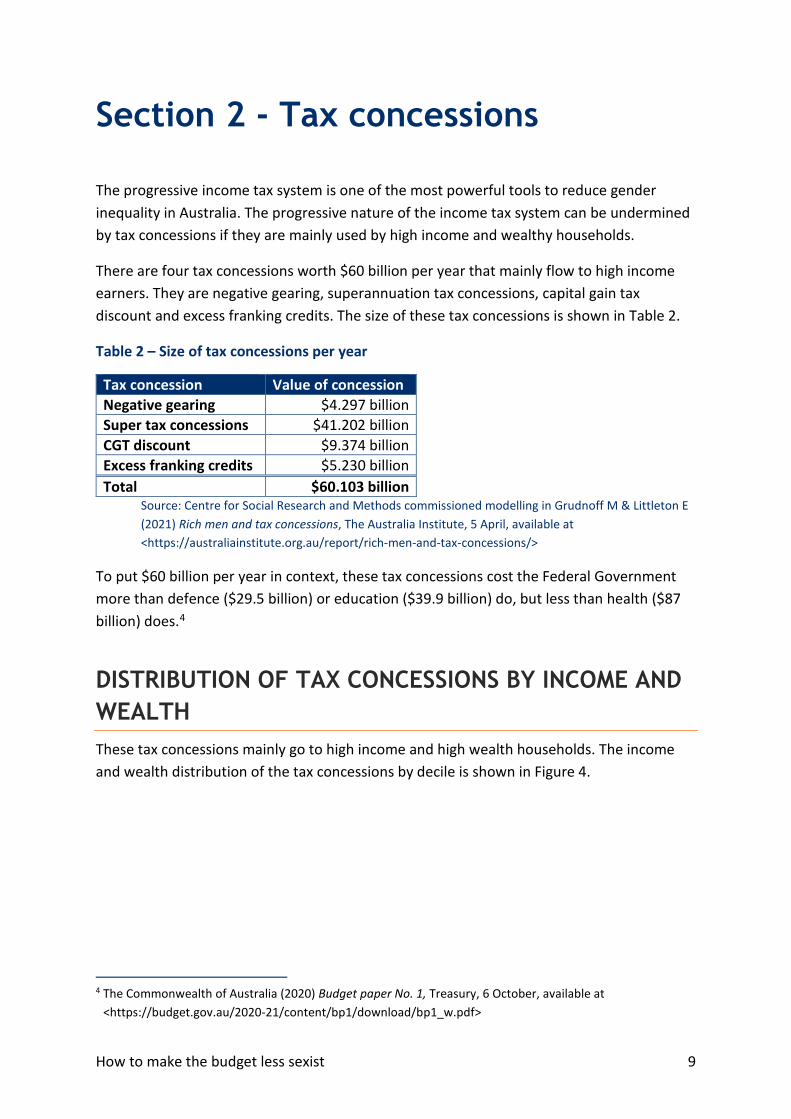
There are four tax concessions worth $60 billion per year that mainly flow to high income earners. They are negative gearing, superannuation tax concessions, capital gain tax discount and excess franking credits. The size of these tax concessions is shown in Table 2.
Table 2 – Size of tax concessions per year
Tax concession Value of concession Negative gearing $4.297 billion Super tax concessions $41.202 billion CGT discount $9.374 billion Excess franking credits $5.230 billion Total $60.103 billion
Source: Centre for Social Research and Methods commissioned modelling in Grudnoff M & Littleton E (2021) Rich men and tax concessions, The Australia Institute, 5 April, available at <https://australiainstitute.org.au/report/rich-men-and-tax-concessions/>
To put $60 billion per year in context, these tax concessions cost the Federal Government more than defence ($29.5 billion) or education ($39.9 billion) do, but less than health ($87 billion) does.4
DISTRIBUTION OF TAX CONCESSIONS BY INCOME AND WEALTH These tax concessions mainly go to high income and high wealth households. The income and wealth distribution of the tax concessions by decile is shown in Figure 4.
4 The Commonwealth of Australia (2020) Budget paper No. 1, Treasury, 6 October, available at
<https://budget.gov.au/2020-21/content/bp1/download/bp1_w.pdf>

How to make the budget less sexist 10
Figure 4 – Income and wealth distribution of negative gearing by decile
Source: Centre for Social Research and Methods commissioned modelling in Grudnoff M & Littleton E (2021) Rich men and tax concessions, The Australia Institute, 5 April, available at <https://australiainstitute.org.au/report/rich-men-and-tax-concessions/>
It shows that the top 10 per cent gets 39 per cent of the benefit by income and 41 per cent by wealth. With the bottom half of all households by income getting just 18 per cent of the benefit while the bottom half of all households by wealth also get just 18 per cent.
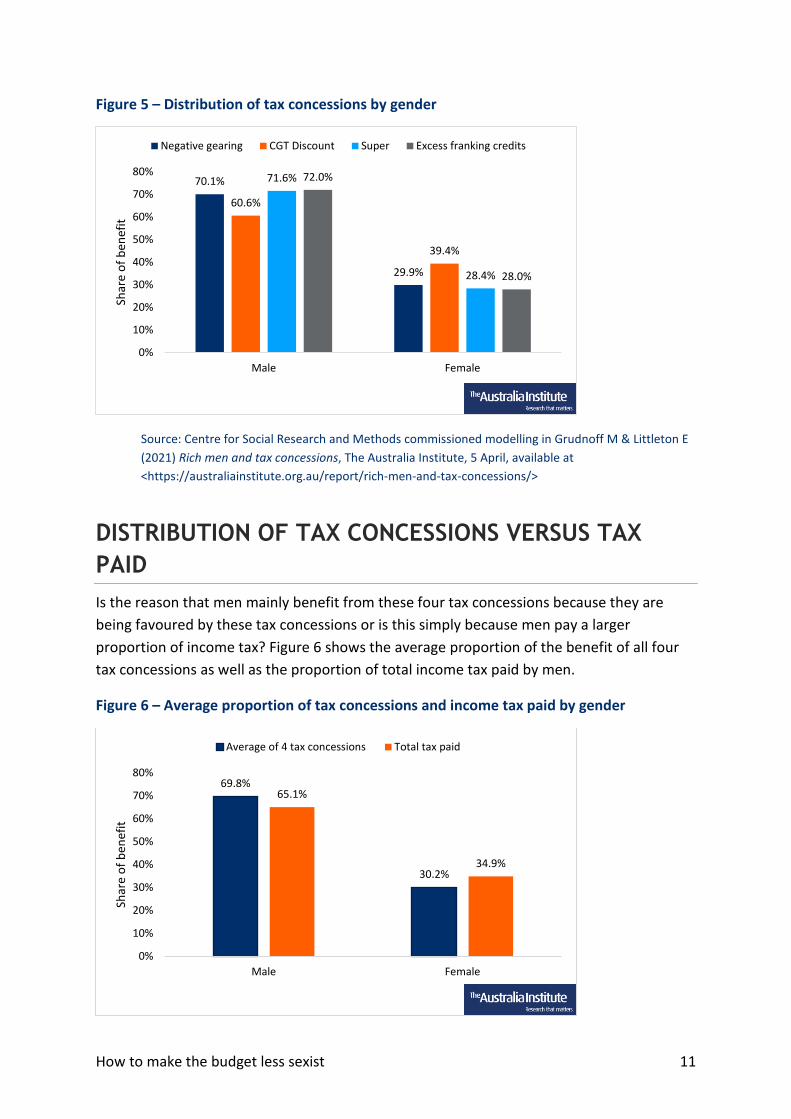
DISTRIBUTION OF TAX CONCESSIONS BY GENDER Men are the main beneficiaries of these tax concessions. Men get twice as much benefit from negative gearing, superannuation tax concessions and excess franking credits than goes to women. For every dollar of the capital gains tax discount that goes to women, men get more than $1.50. The gender distribution of the four tax concessions is shown in Figure 5.
0%
5%
10%
15%
20%
25%
30%
35%
40%
45%
1 2 3 4 5 6 7 8 9 10
Shar
e of
ben
efit
Deciles
Income Wealth
How to make the budget less sexist 11
Figure 5 – Distribution of tax concessions by gender
Source: Centre for Social Research and Methods commissioned modelling in Grudnoff M & Littleton E (2021) Rich men and tax concessions, The Australia Institute, 5 April, available at <https://australiainstitute.org.au/report/rich-men-and-tax-concessions/>
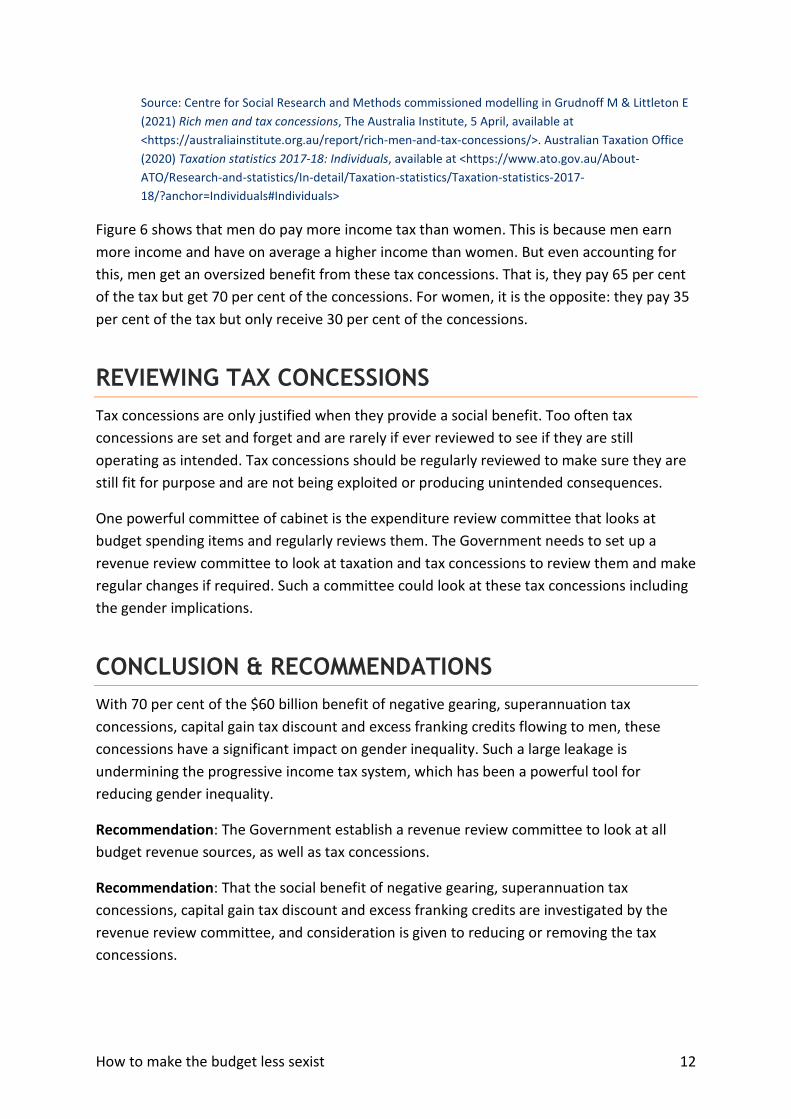
DISTRIBUTION OF TAX CONCESSIONS VERSUS TAX PAID Is the reason that men mainly benefit from these four tax concessions because they are being favoured by these tax concessions or is this simply because men pay a larger proportion of income tax? Figure 6 shows the average proportion of the benefit of all four tax concessions as well as the proportion of total income tax paid by men.
Figure 6 – Average proportion of tax concessions and income tax paid by gender
70.1%
29.9%
60.6%
39.4%
71.6%
28.4%
72.0%
28.0%
0%
10%
20%
30%
40%
50%
60%
70%
80%
Male Female
Shar
e of
ben
efit
Negative gearing CGT Discount Super Excess franking credits
69.8%
30.2%
65.1%
34.9%
0%
10%
20%
30%
40%
50%
60%
70%
80%
Male Female
Shar
e of
ben
efit
Average of 4 tax concessions Total tax paid
How to make the budget less sexist 12
Source: Centre for Social Research and Methods commissioned modelling in Grudnoff M & Littleton E (2021) Rich men and tax concessions, The Australia Institute, 5 April, available at <https://australiainstitute.org.au/report/rich-men-and-tax-concessions/>. Australian Taxation Office (2020) Taxation statistics 2017-18: Individuals, available at <https://www.ato.gov.au/About-ATO/Research-and-statistics/In-detail/Taxation-statistics/Taxation-statistics-2017-18/?anchor=Individuals#Individuals>
Figure 6 shows that men do pay more income tax than women. This is because men earn more income and have on average a higher income than women. But even accounting for this, men get an oversized benefit from these tax concessions. That is, they pay 65 per cent of the tax but get 70 per cent of the concessions. For women, it is the opposite: they pay 35 per cent of the tax but only receive 30 per cent of the concessions.
REVIEWING TAX CONCESSIONS Tax concessions are only justified when they provide a social benefit. Too often tax concessions are set and forget and are rarely if ever reviewed to see if they are still operating as intended. Tax concessions should be regularly reviewed to make sure they are still fit for purpose and are not being exploited or producing unintended consequences.
One powerful committee of cabinet is the expenditure review committee that looks at budget spending items and regularly reviews them. The Government needs to set up a revenue review committee to look at taxation and tax concessions to review them and make regular changes if required. Such a committee could look at these tax concessions including the gender implications.
CONCLUSION & RECOMMENDATIONS With 70 per cent of the $60 billion benefit of negative gearing, superannuation tax concessions, capital gain tax discount and excess franking credits flowing to men, these concessions have a significant impact on gender inequality. Such a large leakage is undermining the progressive income tax system, which has been a powerful tool for reducing gender inequality.
Recommendation: The Government establish a revenue review committee to look at all budget revenue sources, as well as tax concessions.
Recommendation: That the social benefit of negative gearing, superannuation tax concessions, capital gain tax discount and excess franking credits are investigated by the revenue review committee, and consideration is given to reducing or removing the tax concessions.

How to make the budget less sexist 13
Section 3 - Superannuation gender gap
Gender gaps in the distribution of pay and the broken work history of women show up in the superannuation statistics. Superannuation provides a massive contribution to people’s income in retirement but tends to exaggerate working age inequalities and carry them through into retirement. As shown above, men get 72 per cent of the $41 billion per year in superannuation tax concessions.
Taxation statistics show that the average (mean) superannuation balance at the end of 2017-18 was $153,300 for males and $120,200 for females.5 This represents a 27.5 per cent difference in favour of males. For prime working age people, that figure ranged from a 26 per cent bias in favour of 35- to 39-year-old males to a 38 per cent advantage for those in the 50-to-54-year age group. The average is susceptible to bias due to the occasional very high incomes that might be included. But looking at the median figures the advantage in favour of males is even worse. Figure 7 shows the median superannuation balances for males and females across various age ranges.
Figure 7 – Median superannuation balances for males and females across various age ranges
5 Australian Taxation Office (2020) Taxation statistics 2017-18: Individuals, available at
<https://www.ato.gov.au/About-ATO/Research-and-statistics/In-detail/Taxation-statistics/Taxation-statistics-2017-18/?anchor=Individuals#Individuals>
$-
$20,000
$40,000
$60,000
$80,000
$100,000
$120,000
$140,000
$160,000
$180,000
18-24 25-29 30-34 35-39 40-44 45-49 50-54 55-59 60-64
Med
ian
supe
r bal
ance
($)
Age ranges
Male Female
How to make the budget less sexist 14
Source: Authors’ calculations from Australian Taxation Office (2020) Taxation statistics 2017-18: Individuals, available at <https://www.ato.gov.au/About-ATO/Research-and-statistics/In-detail/Taxation-statistics/Taxation-statistics-2017-18/?anchor=Individuals#Individuals>
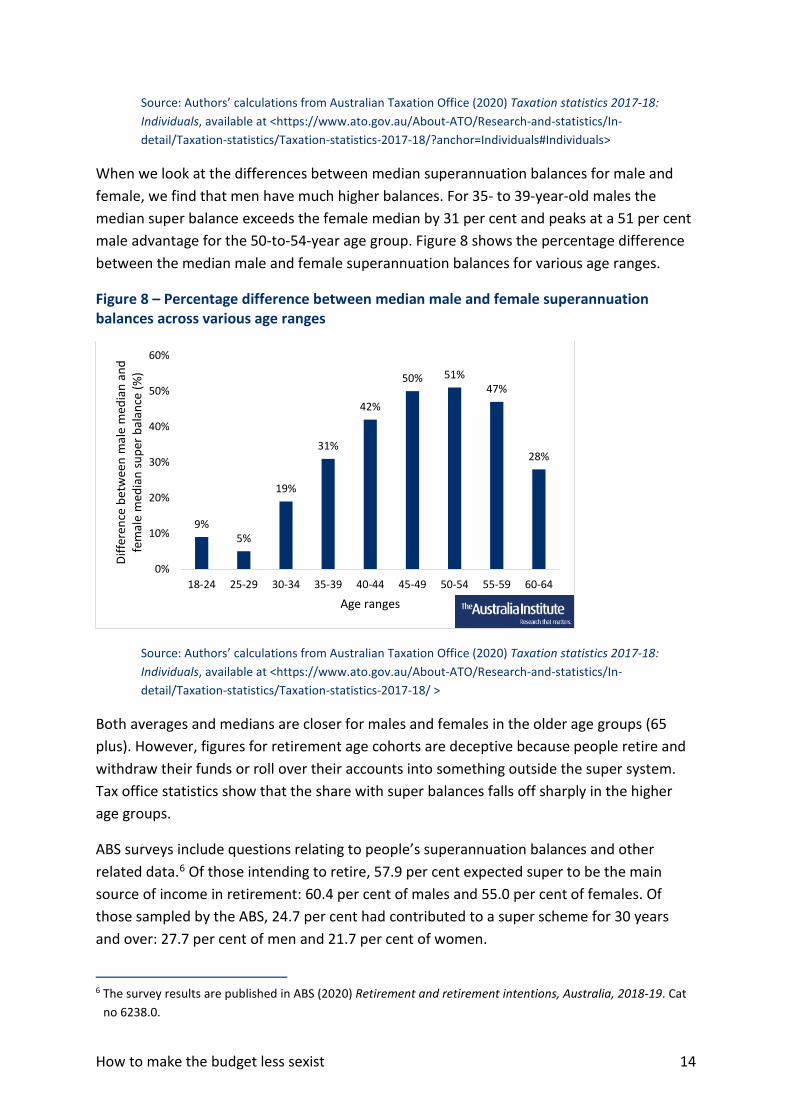
When we look at the differences between median superannuation balances for male and female, we find that men have much higher balances. For 35- to 39-year-old males the median super balance exceeds the female median by 31 per cent and peaks at a 51 per cent male advantage for the 50-to-54-year age group. Figure 8 shows the percentage difference between the median male and female superannuation balances for various age ranges.
Figure 8 – Percentage difference between median male and female superannuation balances across various age ranges
Source: Authors’ calculations from Australian Taxation Office (2020) Taxation statistics 2017-18: Individuals, available at <https://www.ato.gov.au/About-ATO/Research-and-statistics/In-detail/Taxation-statistics/Taxation-statistics-2017-18/ >
Both averages and medians are closer for males and females in the older age groups (65 plus). However, figures for retirement age cohorts are deceptive because people retire and withdraw their funds or roll over their accounts into something outside the super system. Tax office statistics show that the share with super balances falls off sharply in the higher age groups.
ABS surveys include questions relating to people’s superannuation balances and other related data.6 Of those intending to retire, 57.9 per cent expected super to be the main source of income in retirement: 60.4 per cent of males and 55.0 per cent of females. Of those sampled by the ABS, 24.7 per cent had contributed to a super scheme for 30 years and over: 27.7 per cent of men and 21.7 per cent of women.
6 The survey results are published in ABS (2020) Retirement and retirement intentions, Australia, 2018-19. Cat
no 6238.0.
9%5%
19%
31%
42%
50% 51%47%
28%
0%
10%
20%
30%
40%
50%
60%
18-24 25-29 30-34 35-39 40-44 45-49 50-54 55-59 60-64
Diffe
renc
e be
twee
n m
ale
med
ian
and
fem
ale
med
ian
supe
r bal
ance
(%)
Age ranges
How to make the budget less sexist 15
The ABS figures on the main source of income at the start of retirement show that of those who relied on super or similar (purchased annuities or allocated pensions), 59.0 per cent were men and 41 per cent women. While 29.8 per cent of male retirees relied on super, only 16.8 per cent of female retirees did so.7
Of those who retired, 33.3 per cent did not contribute to a super scheme: 23.8 per cent of males and 41.0 per cent of females. Of those who had contributed to superannuation and who recalled the value of the lump sum received, 44.1 per cent received a sum less than $40,000: 41.0 per cent of men and 53.4 per cent of women. These figures confirm that women have lower superannuation balances when they retire.
The statistical evidence reveals large gender inequalities in the superannuation system. It is worth also pointing out that superannuation in Australia is heavily subsidised through tax concessions, especially concessions on workers’ incomes in the form of super contributions as well as concessions on the earnings of super funds. Together those two tax concessions are estimated to be worth $39 billion in 2019-20,8 despite COVID-19. With other minor tax concessions, they amount to around 2.5 per cent of national income.
Australia’s individual account based private super system makes it difficult to redistribute wealth within the retirement age groups. Such distribution was possible and even recommended in the report of the Hancock Inquiry established by the Whitlam Government, which advocated a European-type contributory social security system.
However, there is still scope within the existing retirement income system for repurposing some super tax concessions towards topping up female super balances. For example, super balances might be topped up for parents engaged in childrearing duties with consequent absences from the paid workforce.
RECOMMENDATION Superannuation tax concessions be channelled into additional support for women with broken work histories and lower incomes prior to retirement.
7 ABS (2020) Retirement and retirement intentions, Australia, 2018-19. Cat no 6238.0. 8 Australian Government (2021) 2020 Tax Benchmarks and Variations Statement, 29 January, available at
<https://treasury.gov.au/publication/p2021-145906>
How to make the budget less sexist 16
Section 4 - Labour force participation and childcare
Women face long-term structural labour market inequality. Social and economic pressure on women to provide the bulk of childcare at home results in poor female participation rates and a concentration of women in low wage and insecure work.
The Commonwealth Government extended free childcare to working parents early in the pandemic to aid workforce participation but supports were cut after three months and fees reintroduced. The return of high-cost childcare is pricing women out of work, undermining female workforce participation and earnings.
Almost 450,000 Australians with children under the age of five would like to work more hours, 75 per cent of whom are women.9 This represents a 3.4 per cent of all Australian’s employed. One barrier to higher participation rates is the cost and lack of availability of suitable childcare.
Reintroducing government-funded universal childcare could address a substantial barrier to women’s workforce participation and deliver fiscal stimulus to the broader economy.
PARTICIPATION While the number of women taking up paid work has substantially increased since the post-war period, female participation in Australia is lower than comparable countries.
According to the World Economic Forum, Australia fell from 12th to 49th place for economic participation and opportunities for women, well behind countries like Canada, the US and UK.10 Interestingly Australia retained first place for female educational attainment. This suggests that Australian women are qualified to work but face unnecessary barriers to participating in the labour market.
The impact of parenting and household responsibilities on women’s participation in paid work is starkly evident when compared to men. Among couple families11 with dependents between the age of zero and four, only 63 per cent of mothers are employed compared to
9 ABS (2020) Barriers and Incentives to Labour Force Participation, Australia, The Australian Bureau of
Statistics, available at <https://www.abs.gov.au/statistics/labour/employment-and-unemployment/barriers-and-incentives-labour-force-participation-australia/latest-release>
10 World Economic Forum (2021) Global Gender Gap Report 2021, available at <https://www.weforum.org/reports/global-gender-gap-report-2021/digest>
11 Note: the ABS defines couple families as families formed around two people in a couple relationship who both usually reside in the same household.

How to make the budget less sexist 17
89 per cent of fathers, as shown in Figure 9.12 Mothers who are employed often take on part-time or causal work to remain flexible for the demands of family life. The lower rates of female participation reflect the disproportionate amount of childcare provided by women, particularly early on in a child’s life.
Figure 9 – Couple families by employment and age of youngest dependent, 2020
Source: ABS (2020) Labour Force Status of Families, 6224.0.55.001.
Figure 9 shows that as the age of the youngest dependent increases and reaches school age, the gap between male and female employment closes. However, the absence from paid work during the prime earning years has dramatic impacts on women’s lifelong earnings and work opportunities.13
CHILDCARE Australia has high net childcare costs (the cost of childcare minus childcare supports) compared to other OECD countries.14 Part of the problem is that the country relies heavily on the private marketplace to deliver for profit childcare.15 This has undermined the
12 Note: for same-sex couples, the ABS considers the younger partner in female employment and the older
partner in male employment. Same-sex couples make up a very small percentage of couple families with dependents, so this decision does not make a statistical difference.
13 Pennington A and Stanford J (2020) Gender Inequality in Australia’s Labour Market: A Factbook, The Centre for Future Work, 6 March, available at <https://www.futurework.org.au/gender_equality_still_far_off_in_australia_s_labour_market>
14 OECD (2020) Net childcare costs, available at <https://data.oecd.org/benwage/net-childcare-costs.htm> 15 Cahill D and Toner P (2018) Wrong Way: How Privatisation and Economic Reform Backfired, Black Inc.
89 89 8884
5663
78 74 73
52
0
10
20
30
40
50
60
70
80
90
100
0-4 5-9 10-14 15-24 No dependants
Male employed (%) Female employed (%)
How to make the budget less sexist 18
affordability and accessibility of childcare, pricing women out of returning to the paid workforce.
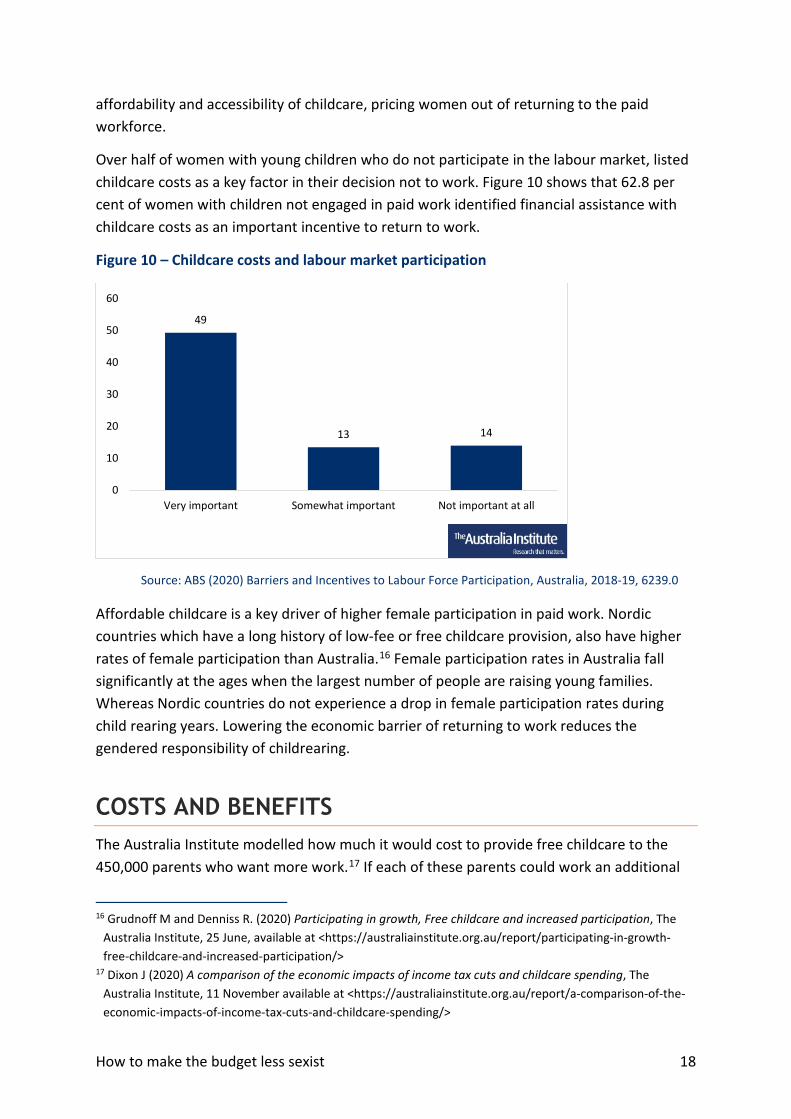
Over half of women with young children who do not participate in the labour market, listed childcare costs as a key factor in their decision not to work. Figure 10 shows that 62.8 per cent of women with children not engaged in paid work identified financial assistance with childcare costs as an important incentive to return to work.
Figure 10 – Childcare costs and labour market participation
Source: ABS (2020) Barriers and Incentives to Labour Force Participation, Australia, 2018-19, 6239.0
Affordable childcare is a key driver of higher female participation in paid work. Nordic countries which have a long history of low-fee or free childcare provision, also have higher rates of female participation than Australia.16 Female participation rates in Australia fall significantly at the ages when the largest number of people are raising young families. Whereas Nordic countries do not experience a drop in female participation rates during child rearing years. Lowering the economic barrier of returning to work reduces the gendered responsibility of childrearing.
COSTS AND BENEFITS The Australia Institute modelled how much it would cost to provide free childcare to the 450,000 parents who want more work.17 If each of these parents could work an additional
16 Grudnoff M and Denniss R. (2020) Participating in growth, Free childcare and increased participation, The
Australia Institute, 25 June, available at <https://australiainstitute.org.au/report/participating-in-growth-free-childcare-and-increased-participation/>
17 Dixon J (2020) A comparison of the economic impacts of income tax cuts and childcare spending, The Australia Institute, 11 November available at <https://australiainstitute.org.au/report/a-comparison-of-the-economic-impacts-of-income-tax-cuts-and-childcare-spending/>
49
13 14
0
10
20
30
40
50
60
Very important Somewhat important Not important at all

How to make the budget less sexist 19
10 hours a week, the net cost18 of providing government-funded childcare would be approximately $2.8 billion per year. This is equivalent to an increase of 0.75% in Commonwealth Government spending.
Alternatively, the Commonwealth Government could fund the expansion of childcare by reducing its 2018 and 2019 Personal Income Tax Plan, worth $300 billion over 10 years, by just one-tenth.19 In this scenario, taxpayers would still receive 90% of the tax cuts and the expansion of childcare would be budget-neutral.
Not only would the provision of free childcare not break the budget, but it could be worth billions in economic gains for society. Enabling parents, particularly mothers, to return to the workforce would positively impact labour supply. If Australia had the same female participation rate as Nordic countries, then 380,000 additional women would be working, which would be worth $48 billion to GDP or an increase of 2.5 per cent.20
Investment in expanding childcare services would directly increase the number jobs in childcare and spill-over to associated businesses. Higher female participation has the potential to increase disposable household incomes and demand for goods and services. This has flow on effects increasing revenue from indirect taxation and taxation of profits.
CONCLUSION & RECOMMENDATION The COVID pandemic highlighted the critical nature of early childhood education and care for working parents. The provision of free childcare represents an opportunity for the Commonwealth Government not only to tackle gender inequality in the labour market but also to back jobs and growth.
Recommendation: The Government reintroduce free or low-cost universal public childcare to ensure that this cost does not prevent women from participating in paid work.
18 This model considers the additional economic activity generated by the expansion of childcare. 19 Dixon J (2020) A comparison of the economic impacts of income tax cuts and childcare spending, The
Australia Institute, 11 November available at <https://australiainstitute.org.au/report/a-comparison-of-the-economic-impacts-of-income-tax-cuts-and-childcare-spending/>
20 Grudnoff M and Denniss R (2020) Participating in growth: Free childcare and increased participation, The Australia Institute, 25 June, available at <https://australiainstitute.org.au/report/participating-in-growth-free-childcare-and-increased-participation/>
How to make the budget less sexist 20
Section 5 - Stimulus through building and construction
Over the course of 2020 the government announced a number of stimulus measures to offset the impact of COVID-19 and the lockdowns that followed. The immediate response included the introduction of JobKeeper and the Coronavirus Supplement for JobSeeker. The Government said they were supposed to be temporary and more recent measures were intended to provide some on-going stimulus as the JobKeeper and JobSeeker supplements were withdrawn.21
The Government’s new stimulus measures are mainly tax concessions and spending measures predominantly directed at the building and construction industries. The Australia Institute has previously pointed out that these forms of stimulus involving public works or other construction initiatives tend not to be very labour intensive and generate jobs mainly for men.22
The measures include bringing forward tax cuts via the personal income tax package and some tax incentives for business. The Australia Institute has commented on these packages before23 and Section 1 in this paper shows that the government’s tax cuts are concentrated on higher income individuals.
Businesses and higher income individuals are less likely to spend and more likely to save additional income, which means they are likely to represent a modest stimulus. By contrast, the early response to the COVID-19 recession used increases in JobSeeker and lump sum payments to other income support recipients, who tend to spend virtually all additional income.
On top of that is the infrastructure spend. The budget papers report increasing its “infrastructure pipeline” from $100 billion to $110 billion over the next 10 years. As a result, the government claims it:
21 Subsequently JobSeeker itself was increased marginally by $50 a fortnight. 22 Richardson D & Denniss R (2020) Gender experiences during the COVID-19 lockdown, The Australia Institute,
1 July, available at <https://australiainstitute.org.au/report/gender-experiences-during-the-covid-19-lockdown/>
23 The personal income tax cuts are biased towards the well-off and are likely to involve very modest stimulus compared with direct spending. See Grudnoff M (2020) Tax cuts or spending: What is the most effective stimulus?, 4 October at <https://australiainstitute.org.au/report/tax-cuts-or-spending-what-is-the-most-effective-stimulus/>. Likewise, we have pointed out that company tax cuts are unlikely to provide much by way of stimulus. See for example, Richardson D (2017) Trump’s tax plan: Australian perspective, 21 November, available at <https://australiainstitute.org.au/report/trumps-tax-plan-australian-perspective/ >

How to make the budget less sexist 21
will provide an additional $10.0 billion in funding towards projects over the next four years bringing total commitments for new and accelerated projects since the onset of the COVID-19 pandemic to $14.0 billion across the forward estimates. Projects currently under construction are supporting around 100,000 direct and indirect jobs over their construction periods, with the Government’s additional investments since the onset of COVID-19 supporting a further 40,000 direct and indirect jobs.24
In addition to the Government’s infrastructure spending measure, it has announced the $2 billion HomeBuilder program which includes $25,000 grants for home building and renovations. This program also reflects the government’s emphasis on the building industry.
When unemployment is high it is a very good time to undertake projects that will provide benefits into the future. Calculations using the above figures suggest the first $100 billion was only going to produce one job (direct and indirect) for every million dollars spent. The language is vague, so we do not know if these are total jobs or full-time year equivalent jobs, or if multiplier effects are included and so on. What we can say though is the impact is small in terms of bang-for-buck measures. It is not clear what is included in the further 40,000 jobs and whether they are net figures, or some brought forward and so on although the suggestion is that the bang-for-buck is somewhat more effective.
Australia Institute research that examined the employment effects of construction found that there were only 1.2 direct jobs created for every million dollars spent, and only 0.2 of those jobs went to women.25 Those figures are very important for judging the effectiveness of the present stimulus measures. Female employment was worst hit in the early stages of the COVID-19 recession and female unemployment remains significantly higher than it was in February 2020. As of February 2021, there are 362,600 unemployed females compared with 318,400 a year ago.26
To get good “bang-for-buck”, money would be better spent in labour-intensive industries such as health, education, care (aged and childcare), public administration and arts and entertainment. A million spent on education and training would generate an estimated 14.9 jobs, including 10.6 for women.27 Health care and social assistance generate 10.2 jobs per million in spending, of which 7.9 would go to women.
24 Australian Government (2020) Statement 1: Budget overview, Budget Paper No 1, Budget 2020-21 p 1-17
available at <https://budget.gov.au/2020-21/content/bp1/download/bp1_bs1.pdf> 25 Richardson D & Denniss R (2020) Gender experiences during the COVID-19 lockdown, The Australia Institute,
1 July, available at <https://australiainstitute.org.au/report/gender-experiences-during-the-covid-19-lockdown/>
26 ABS (2021) Labour force, Australia, February 2021, 18 March, available at <https://www.abs.gov.au/statistics/labour/employment-and-unemployment/labour-force-australia/latest-release>
27 See Richardson D & Denniss R (2020) Gender experiences during the COVID-19 lockdown, for the assumptions behind these estimates.
How to make the budget less sexist 22
Spending on physical capital adds to Australia’s productive capacity, but so does spending on human capital. Additional human capital has been neglected with funding cuts beginning in the 2014 budget. Health care is also important in maintaining human capital and addressing increasing participation rates. The Royal Commission shows there is an urgent need for additional support in aged care,28 where ABS data shows that 12.5 jobs are created for every million dollars spent.
When the economist Maynard Keynes advocated massive public works as a way out of the Great Depression, breadwinners were mostly men and the female participation rate was very low, especially for married women. Moreover, public works were a lot more labour intensive compared with the mechanised construction techniques used today. Today, construction is a poor creator of jobs and misses the mark entirely when it comes to female employment.
RECOMMENDATION Economic stimulus packages are directed to reflect the modern workforce and stimulate the economy via industries that are labour intensive and have higher female representation in their workforce.
28 The Aged Care Royal Commission (2021) Final Report, available at
<https://agedcare.royalcommission.gov.au/publications/final-report>
How to make the budget less sexist 23
Section 6 - Should we ignore women and children? Restructuring JobSeeker
In March 2020 the government announced new Coronavirus Supplement to the JobSeeker Payment (formerly Newstart) to be paid at $550 per fortnight. At the time that amounted to a doubling of the payment for single beneficiaries. The Australia Institute estimated that the supplement increased the single payment rate from 55 per cent below the Henderson Poverty Line to 23 per cent above it.29 That increase was dramatic but was much less dramatic for families with unemployed adults. For example, an unemployed couple with three children saw their income increase from 24 per cent below the poverty line to just four per cent above the poverty line. For some reason, the keenness to put more money into the hands of the unemployed ignored the proportionately greater need of the unemployed with dependent children.
The Melbourne Institute of Applied Economic and Social Research has published recent reports on the poverty lines and how people on income support compare.30 However, these estimates are based on calculations using national accounts data for household disposable income expressed on a per capita basis. These figures have been severely distorted by the massive payments via JobKeeper and JobSeeker, as well as the slump in economic activity. Hence for example household disposable income per head increased from $877.79 a week in the December 2019 quarter to $946.56 in the September 2020 quarter: an eight per cent increase. That increase feeds through into poverty line estimates and would suggest the poverty line has increased by eight per cent over the same time. That seems very unrealistic, so we do not think it worth updating to give the new estimates of income support payments relative to the poverty line. Any figures we obtain would be biased towards showing income as a smaller proportion of the poverty line than would be apparent if we could correct for the distortions.
The coronavirus supplement, as a flat payment to eligible adults, gave proportionately much more assistance to single people and those without children. A supplement that gave a proportionate increase in income support for all family types would have been fairer.
29 Richardson D (2020) A generous increase in Newstart? The effect of the Coronavirus Supplement, 6 April,
available at <https://australiainstitute.org.au/report/a-generous-increase-in-newstart/> 30 These are published quarterly. See Melbourne Institute (no date) Poverty Lines, available at
<https://melbourneinstitute.unimelb.edu.au/publications/poverty-lines>
How to make the budget less sexist 24
Despite the bias, Australia Institute estimates found that unemployed households would rise above the poverty line provided they received all their entitlements.31 The March 2020 measure is estimated to have lifted almost half a million Australians out of poverty, including 75,000 children.32 All these gains were lost as the Government incrementally cut the coronavirus supplement through 2020. Between March and December 2020, an additional 900,000 Australians fell into poverty, including 200,000 children.33
At the end of March 2021, the Government scrapped the remaining coronavirus supplement (worth $150 per fortnight) and replaced it with an increase in the base rate of $50 per fortnight. This represented a net cut of $100 per fortnight from the then current rate, or a net cut of $500 from the original coronavirus supplement. This final cut will put an additional 155,000 Australians into poverty, including 18,000 children. Moreover, the latest measure fell into the same trap as the coronavirus supplement. It provides a 10 per cent increase to the single JobSeeker payment but proportionately much less to a family with children.
The gradual fall in Newstart/JobSeeker relative to the poverty line since 1991 was caused by decision to index the payments against the Consumer Price Index, which has not risen in line with the overall increase in community living standards.34
Prior to the coronavirus supplement there had been widespread support for increases in unemployment payments, mostly expressed as an increase in the single rate. However, the Government should have accounted for, and provided additional assistance to, family types with children.
WORK INCENTIVES The excuse the government gave for the miserly increase in JobSeeker related to incentives. In announcing the changes, the Minister for Families and Social Services, Anne Ruston, said:
These changes strike the right balance between support for people while they look for a job and incentives to work while ensuring the sustainability of our social security safety net.35
31 The paper did not look at family types with more than four children. 32 Grudnoff M (2021) Opportunity lost: Half a million Australians in poverty without the coronavirus
supplement, 31 March, available at <https://australiainstitute.org.au/report/opportunity-lost/> 33 Ibid 34 The Australia Institute (2016) Australia fails to hold the poverty line, Media Release, 3 May, available at
<https://australiainstitute.org.au/post/australia-fails-to-hold-the-poverty-line/> 35 Cartwright D (2021) JobSeeker will rise $50 a fortnight after bill passes through Senate with Labor’s backing,
News.com.au, 18 March, available at <https://www.news.com.au/finance/money/jobseeker-will-rise-50-a-

How to make the budget less sexist 25
The Australia Institute does not necessarily agree that lower income support encourages recipients to find work, and the Government’s focus on price incentive is a tacit acknowledgement that the administrative arrangements do not work to place people in work.
However, if price incentives apply at all, they apply to that part of any income support that is removed when the recipient earns additional private income. The present additional payments for children via the Family Tax Benefit are designed so that they continue to be paid as the adult concerned moves from unemployment into work. Because these payments are not removed as the recipient finds work, they do not interfere with the incentives to work.
CONCLUSION & RECOMMENDATIONS The Government has changed the JobSeeker payment a number of times since the onset of COVID-19, but each time has dealt only with the base rate of JobSeeker. The government has ignored the children of the unemployed by failing to adjust the additional payments that go to unemployed families with children.
Recommendation: That the inadequate JobSeeker is increased, and income support for families increased in proportion.
fortnight-after-bill-passes-through-senate-with-labors-backing/news-story/2bee4a3a470ef5d8e334dcddfdfb60fd>
How to make the budget less sexist 26
Conclusion
There are many Government budget priorities that advantage men and disadvantage women. If the Government wants to focus on women’s economic security, they should address the gender impacts of their budget policies.
Australia is one of the richest countries in the world. On a per capita basis we rank 12th and in absolute terms our economy is just a bit smaller than Russia (population around 145 million) and just a bit bigger than that of Spain (population around 47 million).36 Since coming to office eight years ago the Coalition has found hundreds of billions of dollars to fund tax cuts that flow predominantly to men while arguing that it ‘can’t afford’ to increase spending on domestic violence centres or provide free childcare.
The Government is free, with the appropriate approval of parliament, to spend on its budget priorities. There is no need for such spending to be fairly, efficiently, or equitably spent. There is no obligation to spend similar amounts of money on men and women and in turn there appears to have been no attempt to do so.
If the Government wants to change this and use the budget as a tool to reduce gender inequality, then this paper offers several recommendations that will help achieve this. The budget is sexist, but it does not have to be.
36 United Nations (2019) Per capita GDP at current prices – US dollars, available at
<http://data.un.org/Data.aspx?q=GDP&d=SNAAMA&f=grID%3A101%3BcurrID%3AUSD%3BpcFlag%3A1>

How to make the budget less sexist 27
Appendix A
The Australia Institute calculates the benefit of the tax cut flowing to taxpayers by income deciles using the latest taxation statistics. The taxation statistics were used to construct a model of Australia’s income tax system. All taxpayers were then broken into 100 groups from the lowest income earners to the highest. By inflating income by nominal GDP and calculating how much tax each group pays as the income tax cut is introduced, how much of the tax cut will go to each income decile can then be calculated.