how to improve quality assurance in fluorometry
TRANSCRIPT

Journal of Fluorescence, Vol. 15, No. 3, May 2005 (© 2005)DOI: 10.1007/s10895-005-2630-3
How to Improve Quality Assurance in Fluorometry:Fluorescence-Inherent Sources of Error and SuitedFluorescence Standards
U. Resch-Genger,1,6 K. Hoffmann,1 W. Nietfeld,2 A. Engel,3 J. Neukammer,4
R. Nitschke,5 B. Ebert,4 and R. Macdonald4
Received October 15, 2004; accepted January 28, 2005
The scope of this paper is to illustrate the need for an improved quality assurance in fluorometry.For this purpose, instrumental sources of error and their influences on the reliability and comparabil-ity of fluorescence data are highlighted for frequently used photoluminescence techniques rangingfrom conventional macro- and microfluorometry over fluorescence microscopy and flow cytometryto microarray technology as well as in vivo fluorescence imaging. Particularly, the need for andrequirements on fluorescence standards for the characterization and performance validation of fluo-rescence instruments, to enhance the comparability of fluorescence data, and to enable quantitativefluorescence analysis are discussed. Special emphasis is dedicated to spectral fluorescence standardsand fluorescence intensity standards.
KEY WORDS: Fluorescence; standard; calibration; microarray; in vivo imaging; flow cytometry.
INTRODUCTION
Fluorescence techniques are widely used as analyt-ical tools and detection methods in different areas suchas material sciences, environmental analysis, bioanaly-sis, molecular genetics, cell biology, medical diagnos-tics, and drug screening [1–5]. Commonly recognizedadvantages of fluorescence are its high sensitivity thatallows even the detection of single molecules, its intrin-sic selectivity concerning experimental parameters suchas excitation and emission wavelength as well as fluores-cence lifetime and (de)polarization [6], its ease of use,
1 Federal Institute for Materials Research and Testing, Working GroupOptical Spectroscopy, Division I.3, BAM, Berlin, Germany.
2 Max Planck Institute for Molecular Genetics, Berlin, Germany.3 Schott AG, Mainz, Germany.4 Physikalisch-Technische Bundesanstalt, Dept. 8.3, PTB, Berlin,
Germany.5 Life Imaging Center, Institute of Biology I, Developmental Biology,
Freiburg, Germany.6 To whom correspondence should be addressed. E-mail: ute.resch@
bam.de
non- or minimally invasive character, and the remote ac-cessibility of signals employing conventional optics andfiber optics. Depending on the specific application, flu-orescence measuring systems strongly differ in instru-mental design, i.e. use of optical components and de-tection systems as well as in measurement geometriesincluding sample containers/formats for the investigationof fluorescent samples. Typical instruments range fromconventional monochromator- or filter-type fluorometersand microplate readers over fluorescence microscopes,flow cytometers, and systems for (real time) polymerasechain reaction (rt-PCR) as well as devices for molecularimaging to microarray scanners for DNA or protein chipsand high throughput screening systems [5,7–10]. Inde-pendent of the technique and particular instrumentationapplied, a major drawback of fluorescence measurementsis the demand to remove instrument-specific effects fromthe measured raw data that otherwise limit the compa-rability of fluorescence data across instruments, labora-tories, and over time [1–4,11,12]. Further fluorescence-inherent problems are related to difficulties to accuratelymeasure absolute fluorescence intensities and hence to
3371053-0509/05/0500-0337/0 C© 2005 Springer Science+Business Media, Inc.

338 Resch-Genger et al.
realize true quantitative measurements [13]. In addition,quantitative fluorometry based on measurements of rela-tive fluorescence intensities is hampered by the sensitiv-ity of the absorption and fluorescence properties of mostchromophores to their microenvironment that results inenvironment-specific absorption and emission spectra aswell as molar absorption coefficients, fluorescence quan-tum yields, and fluorescence lifetimes, respectively. Theseproblems and disadvantages render quality control diffi-cult and make standardization even more important.
The improvement in quality assurance for fluores-cence techniques critically relies on the development ofinternationally accepted and purpose-fit guidelines forinstrument characterization and performance of fluores-cence measurements which are barely available at present.The former, however, depends on the availability of com-mercial, easy-to-operate, and reliable fluorescence stan-dards, that take special requirements of each particular flu-orescence technique into account, and that are preferablycertified in view of traceability and accreditation needs.Within the context of this paper, fluorescence standardsrefer to chromophore-based reference materials for fluo-rometric quantities, which are designed for specific fluo-rescence applications. This includes both instrument-typestandards for the calibration and performance validationof fluorescence instruments as well as more application-specific standards for instance to relate chemical con-centration to instrument response, i.e. typically to fluo-rescence intensity. Furthermore, for certain fluorescencetechniques, the evaluation of commonly used softwareroutines like e.g. fitting routines for the analysis of time-resolved fluorescence data as well as software for thestatistical analysis of imaging data and the analysis ofmicroarray experiments is gaining importance and willeventually be mandatory.
At present, these needs are poorly met for fluores-cence techniques, despite of their widespread use and theextensive literature dedicated to the characterization offluorescence measuring equipment and potential fluores-cence standards [1–4,14–18], as well as the globalization-induced anchor role of traceability and accreditation [19].The latter initiated for instance standardization in closelyrelated fields like UV/Vis/IR spectrophotometry [20–23]and colorimetry [24–27]. Up to now, there exist only a verylimited number of recommendations on the characteriza-tion of fluorescence instrumentation and performance offluorescence measurements like the determination of thelinear range of detection systems and the limit of de-tection [28–30]. Furthermore, with the exception of flowcytometry [31–34], surveys on instrument calibration andcomparability of fluorescence data have been barely per-formed [35,36]. In addition, available or recommended
fluorescence standards are often of insufficient qualitywith respect to their analytical and spectroscopic char-acterization and stability as well as reproducibility or areeven not purpose-fit. For a long time, only a single certifiedreference material [37], the traceable emission standardquinine sulfate dihydrate (SRM 936a), developed by theNational Institute of Standards and Technology (NIST) inthe late 1970s, was commercially available [38]. This ref-erence material enables the determination of the spectralresponsivity of fluorescence instruments in the spectralrange from about 395 to 565 nm. Only recently, a newthough not certified reference material, RM8640, i.e. mi-crospheres with varying amounts of immobilized fluores-cein molecules was released by NIST for flow cytometrythereby aiming at the establishment of a reference scalefor fluorescence intensity [39].
To underline the importance of an improved qual-ity control for the majority of fluorescence techniques, inthis review, problems and fluorescence-inherent sourcesof error are revealed exemplary for macro- and mi-crofluorometry, fluorescence microscopy, flow cytom-etry, fluorescence-based microarray technology, andin vivo fluorescence spectroscopy/imaging. The aim isto highlight the need for internationally accepted guide-lines for instrument characterization and performance oftypical fluorescence measurements in combination withthe need for better-suited and certified fluorescence stan-dards thereby improving the reliability of fluorescencedata. This could eventually broaden the application offluorescence methods, especially in areas like medical di-agnostics that require instrument performance validation(IPV), standardization of measurements, and comparabil-ity of data for the acceptance of analytical methods. Ac-cordingly, the scope of this article is to discuss purpose-fitsolutions to these problems with special emphasis dedi-cated to specific existing fluorescence standards and theneed for and requirements on improved systems ratherthen to give a comprehensive overview of the literatureon the characterization of fluorescence instruments andpotential reference materials.
FLUORESCENCE-INHERENT SOURCESOF SYSTEMATIC ERRORS
The majority of fluorescence-based measuring or de-tection methods relies on the assumption that the recordedfluorescence intensity is proportional to the concentra-tion of the fluorophore(s) in the sample. However, inde-pendent of fluorescence technique and type of measure-ment, i.e. spectrally resolved or integrated over a smallwavelength interval, the generated fluorescence signal is

Quality Assurance in Fluorometry and Suited Fluorescence Standards 339
affected by both the fluorescent analyte(s) and the instru-ment. Properties of the sample that influence the mag-nitude of the resulting fluorescence signal are the fluo-rophore’s absorptance at the excitation wavelength (in-terval) and the fluorescence quantum yield [40,41]. Theformer is nonlinearly linked to absorbance and thus mo-lar absorption coefficient and concentration by the Beer–Lambert law. Absorptance and quantum yield as well asthe spectral shape and position of a chromophore’s ab-sorption, excitation and emission spectrum can stronglydepend on the dye’s microenvironment, e.g. the polarityof the surrounding solvent/matrix molecules, pH as wellas the concentration of certain ions in the sample [1–5,13].Furthermore, specific solvent–solute or matrix–solute in-teractions can play a role. From the instrument side, thetime-, wavelength-, and polarization-dependent spectralirradiance of the excitation channel reaching the sampleand the spectral responsivity of the emission channel in-fluence the magnitude of the recorded fluorescence inten-sity and the shape of the measured fluorescence spectra,respectively [40,42]. To illustrate the distorting effects ofthe spectral characteristics of fluorescence measuring sys-tems, the normalized spectral responsivities of commontypes of fluorescence instruments are exemplary shown inFig. 1. These curves have been determined with a spec-tral radiance transfer standard [40]. Accordingly, asidefrom spectral irradiance-related effects, measured emis-sion intensities or spectra represent truly sample-relateddata that are superimposed by the spectral responsivity of
Fig. 1. Wavelength-dependent normalized spectral responsivity of theemission channel of four typical fluorometers equaling the correspond-ing normalized emission correction curves. Spectrally corrected emis-sion spectra are obtained on division of the measured uncorrected spectraby the respective emission correction curve measured with identical in-strument parameters.
the respective instrument, with the size of these distortionsdepending on the spectral region of the dye’s emission andthe width of its emission band. Similarly, as has been illus-trated in Parts I and II of a series of publications dedicatedto the traceability in fluorometry [40,42], the instrument-specific wavelength and polarization dependence of thespectral irradiance at the sample position distorts excita-tion spectra and affects the intensity of emission spectra.
Other potential sources of error are uncertainties ofthe wavelength scale which need to be minimized espe-cially for fluorophores with narrow absorption and/or fluo-rescence bands and nonlinearities of the detection system.The latter can hamper quantitative fluorometry and the de-termination of fluorescence quantum yields [40]. Further-more, instrument- and sample-related polarization effectsmay play a role [39,43]. The size of instrument-related po-larization effects is determined by the dependence of thetransmittance and reflectance of the instrument’s opticalcomponents on the polarization of the incident light and, toa much smaller extent, by polarization effects of detectors[40]. The magnitude of sample-related polarization effectsdepends on the fluorescence anisotropy of the sample.Instrument- and sample-inherent polarization effects, thatare strongest for the measurement of anisotropic emitterswithout polarizers, can yield intensity and spectral errorsin fluorescence measurements in the range of a few tensof percent [15]. Depending on the fluorescence technique,additional uncertainties can be introduced by e.g. an insuf-ficient long-term instrument stability or instrument drift,an inhomogeneous illumination of the sample as well asgenerally by sample- and sample-handling-related effects.The latter are beyond the scope of this article.
As is often overlooked for certain analytes/samples,also type of light source, i.e. continuous or pulsed excita-tion, and related instrument settings such as e.g. the widthof the time gate and delay have to be considered. This isillustrated in Fig. 2 for the normalized corrected emissionspectra of a glass doped with rare-earth (RE) ions dis-playing different lifetimes in the µs- and ms-range thatwas measured with conventional steady-state fluorome-ters equipped with a continuous and a pulsed Xe lamp(width at half peak intensity of less than 10 µs), respec-tively. Such a RE-doped glass is an interesting candidatefor a standard to control the wavelength accuracy andlong-term stability of fluorescence instruments [44]. Thedifferences observed in Fig. 2 are caused by the differ-ent and long lifetimes of the dopants and are not relatedto spectral correction. Basically, with the settings em-ployed for pulsed excitation, suppression of the long-livedemission compared to the emission of the species withshorter lifetimes occurs. This observation correlates withthe width of the time gate used for signal detection. Only

340 Resch-Genger et al.
Fig. 2. Comparison of the corrected emission spectra of a glass, dopedwith a mixture of rare-earth (RE) ions, measured with a fluorometerequipped with a continuous excitation source (8100, Spectronics Instru-ments, Xe lamp, solid line) and a fluorometer with a pulsed lamp (LS50B, Perkin Elmer, width at half peak intensity of the pulsed Xe lampless than 10 µs, fluorescence mode, dashed line) using identical spectralbandpasses of the emission monochromators. Excitation was at 370 nm.
minor effects are due to subtraction of dark current con-tributions and background from the long-lived emission.Accordingly, for instruments equipped with pulsed lightsources, these experimental settings have to be consideredfor the comparability and reliability of fluorescence dataif species with sufficiently long and different lifetimes areanalyzed simultaneously. Furthermore, these parametersneed to be kept constant for the control of the day-to-dayperformance and long-term stability of such fluorescenceinstruments.
Aside from instrument-specific effects, the reliabil-ity of fluorescence measurements as well as the limit ofdetection can be affected by non-specific or so-calledbackground fluorescence. This includes all the fluores-cence that does not originate from the fluorophore ofinterest. Background fluorescence may arise from con-taminations of the sample and non-specific binding aswell as from autofluorescence of optical components suchas lenses, objectives, and optical filters [45] and sam-ple supports/containers like glass or polymer slides andmicrotiter plates, respectively. The possible influence ofautofluorescence from optical components is illustratedexemplary for filter glass OG 550 obtained by differentpre-treatment procedures, see Fig. 3. Due to its clearlymeasurable autofluorescence on excitation at 450 nm, theemissive filter is not suited for the fabrication of fluores-cence instruments working in the UV/Vis region. Thesefindings underline the importance of an improved qualitycontrol of such materials.
Fig. 3. Uncorrected emission spectra of two OG 550 filters obtained bydifferent pre-treatment procedures recorded under identical conditions.Excitation was at 450 nm.
FLUORESCENCE STANDARDS: TYPES ANDGENERAL REQUIREMENTS
Types of Fluorescence Standards
The comparability of fluorescence data between in-struments, laboratories, and over time as well as the min-imization of fluorescence measurement-inherent sourcesof errors require a reliable instrument characterizationand performance validation. This can be achieved withaccordingly designed, well-characterized, and easy-to-use fluorescence standards including standard operationprocedures (SOPs) for their use. Additionally, as manyfluorescence experiments are performed for quantifica-tion purposes, suited standards, recommendations for theirchoice and application as well as SOPs for the measure-ment of (relative) fluorescence intensities are desired.
Fluorescence standards are typically divided intoinstrument-type standards, which allow the determina-tion of an adequate and application-relevant instrumentperformance thus ruling out instrumentation as a majorsource of variability, and more application-specific stan-dards, which take into account the fluorescence proper-ties of routinely measured samples. The latter are alsoreferred to as reference standards for instance in fluo-rescence microscopy. Typical instrument standards arespectral standards with known, preferably certified cor-rected, i.e. instrument-independent fluorescence spectra.Spectral standards can be divided into wavelength stan-dards to control the wavelength accuracy of wavelength-selecting optical components and so-called emissionand excitation standards [14] for the determination of
Quality Assurance in Fluorometry and Suited Fluorescence Standards 341
the spectral characteristics of fluorescence instruments[40,46–48]. Examples for more application-specific typesof standards are fluorescence lifetime and fluorescence(de)polarization standards [16,49], that are beyond thescope of this article, and the class of fluorescence inten-sity standards. The latter include fluorescence quantumyield standards and reference materials to relate chem-ical concentration to instrument response or, less com-mon, to characterize the autofluorescence of materialsand reagents used for fluorescence analysis. Other equallyrequested standards, that belong to the classes of fluo-rescence intensity and spectral standards, are materialsto control the day-to-day performance and the long-termstability of fluorescence instruments. At present, there is abroad variety of more or less suited fluorescence standardscommercially available such as for instance fluorescentmicrospheres as alignment standards for fluorescence mi-croscopy and flow cytometry, solid and liquid standardsfor the spectral correction of cuvette-type measurementsand microplate readers as well as standards for front sur-face fluorescence measurements, and solid and liquid stan-dards for intensity calibrations and for the determinationof the linearity of microscopes, flow cytometers, and mi-croplate readers, respectively [42,50]. In addition, thereexists extensive literature on potential fluorescence stan-dards. This includes for example emission and excitationstandards and standards for fluorometric quantities likefluorescence quantum yield, fluorescence lifetime as wellas fluorescence (de)polarization [1–4,14–15,51,52].
General Requirements on Fluorescence Standards
Generally, the requirements on fluorescence stan-dards depend on the level of uncertainty desired forfluorescence measurements and accordingly, for instru-ment characterization. Standard-related contributions tothe overall calibration and measurement uncertainty aredirectly linked to the reliability and suitability of thestandard(s) and to the uncertainty of the standard’s certi-fied/reported radiometric/fluorometric quantities that arerelevant for the respective application. For many ap-plications, also the resemblance between the standardand typically measured samples affect the size of thestandard-related contributions to the overall measurementuncertainty [40].
A purpose-fit fluorescence standard should enablethe instrument characterization and IPV under analyticallyrelevant routine conditions, e.g. for similar settings of in-strument parameters (detector voltage, spectral bandpass,polarizer settings, signal intensities/counting rates, mag-nification etc.) and measurement geometry—preferablywith a minimum and known uncertainty. This implies es-
pecially comparable emission characteristics and spectralradiances or emission intensities of the standard and thesample, typically within a similar spectral region. Thestandard needs to be sufficiently well characterized withrespect to its application-relevant spectroscopic proper-ties. Its calibration-relevant radiometric/fluorescence fea-tures should have been determined with a reliably char-acterized reference instrument. To judge the reliabilityof the standard, the calibration procedure and calibra-tion uncertainty of this reference instrument as well asthe chosen instrument settings and measurement geom-etry need to be provided. Moreover, this eventually en-ables traceability to the spectral radiance scale and/orthe spectral responsivity scale realized by the black bodyradiator and the cryogenic radiometer [40,42] and themandatory report of the (wavelength-dependent) uncer-tainty of the respective fluorometric quantity of the stan-dard. In addition, a specification of the standard’s thermaland photochemical stability, the temperature dependenceand—for some types of standards also the concentrationdependence—of the reported/certified fluorometric quan-tity as well as information on storage conditions, shelflife, scope, and limitations for use are necessary [40].For physical transfer standards, also recalibration inter-vals should be given. For chromophore-based referencematerials, the purity and homogeneity of the chromophoreand the solvent or matrix should be stated as well as thehomogeneity of the dye distribution for solid systems.For particle-type standards, also the particle size distribu-tion should be provided as well as the coloring procedurelike for example staining, i.e. chromophore mainly insidethe particle, or attachment to the particle surface, i.e. chro-mophore mainly at the particle surface and thus accessibleto solvent.
Type-Specific Requirements
For each application, the choice of a fluorescencestandard requires a thorough understanding of its purposeand, most important, the requirements it has to fulfill.A suited wavelength standard must emit a multitude ofvery narrow emission bands in the spectral range of in-terest, commonly the UV/Vis/NIR region, and must bemeasurable at sample position employing the typical mea-surement geometry. Furthermore, the spectral position ofthe emission lines/bands should preferably show no or atleast a reported temperature dependence within the com-monly encountered room temperature region. These de-mands are best met by a physical-type transfer standard,an atomic discharge lamp, ideally of cuvette-shape, typi-cally in combination with a non-fluorescent reflectance orwhite standard [40]. Such lamps can be used for all types

342 Resch-Genger et al.
of luminescence instruments and are not restricted to pho-toluminescence measuring systems like chemical-typefluorescence standards. For reduced requirements on spec-tral resolution, also chromophore-based wavelength stan-dards can be employed. Their advantages are the typicallysmaller spectral radiances and similar emission character-istics as encountered for the majority of samples. An ex-ample is a commercially available dysprosium-activatedyttrium aluminum garnet Y3−xDyxAl5O12 (DYAG, Pho-ton Technology International Inc., FA-2036) that showsa multitude of narrow excitation bands in the spectralregion between 250 and 500 nm and narrow emissionbands in the spectral region from 500 to 800 nm, respec-tively [53]. Similarly suited are mixtures of RE ions, seeFig. 2. Here, however, excitation wavelength-dependentemission spectra are encountered and accordingly, provi-sion of the emission spectra for frequently used excitationwavelengths may be appropriate. Contrary to wavelengthstandards, the main requirement on emission and exci-tation standards that enable the determination of the rel-ative spectral responsivity of the emission channel andthe relative spectral irradiance at the sample position, re-spectively, are broad and unstructured fluorescence spec-tra to reduce the effect of instrumental resolution/spectralbandpass [40,47]. This minimizes the influence of un-certainties in the determination of the wavelength whichare directly translated into uncertainties in fluores-cence intensities. Further requirements are revealed in“Spectrally Resolved Macro- and Microfluorometry”section.
Fluorescence quantum yield standards are used asreference for the relative determination of the fluo-rescence quantum yield of an analyte. Accordingly—contrary to fluorescence intensity standards that relatechemical concentration to instrument response—they aretypically not based on the same fluorophore as the sam-ple and is not mandatory matching of spectra. The moststringent requirements are reliable fluorescence quantumyields and properly defined conditions such as e.g. ma-trix, oxygen concentration, temperature, and excitationwavelength as well as a stated uncertainty of the quan-tum yield. Furthermore, standard and sample should ab-sorb and emit within comparable spectral regions, seealso “Spectrally Resolved Macro- and Microfluorometry”section.
The working principle of the majority of fluoromet-ric reference materials that relates chemical concentrationto instrument response is the comparison of the spectralradiance/fluorescence intensity of a standard and a sam-ple to quantify the number of fluorophores in the sample.Though often overlooked in fluorometry, this is a commonapproach used in many different analytical techniques.
This type of intensity standard typically relies on the samefluorophore(s) as to be quantified. However, due to the in-herent sensitivity of the spectroscopic properties of themajority of chromophores to their microenvironment, thistype of standard has to be handled with care. To eliminateerrors in quantification, the chromophore to be specifiedand the standard have to be in the same microenvironmentto guarantee identical fluorescence spectra, molar absorp-tion coefficients, and fluorescence quantum yields, respec-tively. This is for instance fulfilled for many applicationsof high performance liquid chromatography (HPLC) withfluorescence detection where the fluorescence intensitiesfrom free, i.e. unbound fluorophores in solutions of iden-tical or at least very similar composition are compared[54,55]. On the other hand, for a set of fluorophores in so-lution and a set of immobilized fluorophores, e.g. boundto or incorporated into a microparticle, the absorptionand fluorescence spectra, molar absorption coefficients,and especially the fluorescence quantum yields can differsignificantly [13]. If not properly considered, these differ-ences lead to considerable errors in fluorophore quantifi-cation. As an approach to overcome these problems, thequantification of the fluorescence intensity of samples isoften performed in units of molecules of equivalent solu-ble fluorochrome (MESF) [56,57]. This type of referencesystem, that circumvents differences in the molar absorp-tion coefficients and fluorescence quantum yields of thestandard and the sample, however, relies on matching flu-orescence spectra and the sample and is not designed toderive the absolute number of fluorophores in the sample.Accordingly, standard-related contributions to the over-all measurement uncertainty are linked to the degree ofspectra matching of the standard and the sample [32].This is also true for standards for the characterizationof material-related autofluorescence which are requestedby manufacturers of materials relevant for fluorescenceanalysis like e.g. optical glasses, crystals, and ceramicsemployed for the fabrication of optical components andsupports/sample containers.
For standards employed for the characterization ofthe day-to-day performance and long-term stability of flu-orescence instruments, a close match between the standardand routinely measured samples is not mandatory. How-ever, these standards should be measured/measurable withroutinely used instrument settings to guarantee the relia-bility of the instrument performance under application-relevant conditions. Further prerequisites are sufficientand reported stability or, for single-use standards, ex-cellent reproducibility. Contrary to statements in the lit-erature, per definition, there are no standards but onlymethods, procedures or guidelines—preferably in com-bination with suited materials—to measure the range of

Quality Assurance in Fluorometry and Suited Fluorescence Standards 343
linearity of fluorescence instruments, their dynamic rangeand the limit of detection [29,30]. For instance, the de-termination of the former requires a method for the de-fined physical or chemical variation of the amount oflight reaching the detector [29,40]. Additionally, recom-mendations on accordingly tested materials are desiredthat enable such measurements without material-specificcontributions [40].
In addition to the standards discussed, for other fluo-rescence instruments like e.g. fluorescence microscopes,microarray scanners, and imaging systems, further ref-erence materials are needed for instrument characteriza-tion and IPV. As is discussed in the sections dedicated tothese techniques, requested are for instance standards forthe determination of the spatial resolution, the correctionfor the heterogeneity of illumination and for detectionwithin a single field, i.e. shading or flat field correction,and the characterization of the size of the illuminatedvolume.
APPLICATION-SPECIFIC NEEDS FORIMPROVED COMPARABILITY ANDRELIABILITY OF FLUORESCENCE DATA
Frequently used fluorescence techniques includemacro- and microfluorometry often combined with mea-surements of fluorescence spectra, fluorescence lifetimes,and fluorescence (de)polarization, fluorescence micro-scopic techniques, and flow cytometry as well as fluores-cence imaging in vivo. Fluorescence detection is also com-monly employed for analytical separation techniques likefor instance HPLC, capillary electrophoresis (CE), and(high performance) thin layer chromatography (HPTLC;TLC), and for bioanalytical methods like rt-PCR used forDNA analysis and DNA quantification as well as for themicroarray technology. However—despite of the broadand ever increasing use of fluorescence techniques—tothe best of our knowledge, there exist no overall acceptedprocedures for instrument characterization and IPV atpresent. Different manufacturers of steady-state fluorom-eters recommend the so-called Raman test [58,59] forthe control of the instrument’s long-term stability andsensitivity and the determination of the wavelength ac-curacy via scanning of the emission lines of the instru-ment’s Xenon excitation source or the transmission min-ima in the spectrum of a solution of holmium perchlorate.These tests are often integrated into the software of in-struments, and the recommended materials and requiredaccessories are available from the instrument manufac-turers, in some cases even with a SOP for use. Morecomplex procedures recommended and commonly per-
formed by service engineers include the determination ofthe wavelength accuracy with pen-type atomic dischargelamps and the characterization of the spectral responsivityof the emission channel with a calibrated lamp, i.e. typi-cally an instrument-adapted integrating sphere-type spec-tral radiance transfer standard. The availability of suchprocedures is limited to few types of instruments, mostlysteady-state fluorometers. For other techniques like e.g.fluorescence microscopy no such recommendations areavailable. Accordingly, in the following sections, the needfor procedures/guidelines and standards for the character-ization of fluorescence instruments and performance offluorescence measurements is illustrated for selected flu-orescence techniques.
Spectrally Resolved Macro- and Microfluorometry
Uncertainty of Fluorescence Measurements
The uncertainty [60] of fluorescence measurementsrelies on parameters such as e.g. the stability of the exci-tation light source and means for correction of its fluctua-tions, the stability and linearity of the detection system(s)and the detector’s sensitivity to polarization effects, theoccurrence of photobleaching, background fluorescence,scattering and reflections, the measurement geometry,sample format and reproducibility of sample positioningas well as the type of sample and sample-handling steps,respectively. Influences of the latter two factors are notfurther discussed. As a rule of thumb, for cuvette-type flu-orescence measurements of transparent dilute solutions,the fluorescence-based uncertainty is ca. 2%. For mea-surements of solid films with a routine fluorometer, theuncertainty is increased, mostly due to enhanced uncer-tainties related to sample positioning. For fluorescencemeasurements with 96-well microtiter plates, a well-to-well reproducibility of ca. 2% can be achieved underoptimum conditions, i.e. with well-aligned instruments,well-chosen microtiter plates, and a flat meniscus for topreading. The effect of the meniscus, that depends on thesurface tension of the solvent, solvent–well interactions,and the volume of the analyte solution, is illustrated inFig. 4 for top reading. Figure 4 compares the uncorrectedmean emission spectra and the respective standard devi-ations (SD) obtained for two solutions of organic dyes,i.e. coumarin 153 and quinine sulfate which emit withinthe spectral region of 400–600 nm and were dissolved inethanol and 0.1 M HClO4, respectively. For each mea-surement, the same black microtiter plate from NUNCand a volume of 270 µl of the pipetted solution per wellwere used and the standard deviation was derived from 32wells. The smaller SD of 3% resulting for the ethanolic

344 Resch-Genger et al.
Fig. 4. Uncorrected mean emission spectra of two organic dyes and therespective standard deviations (SD) measured with a common microplatereader using a black 96-well microplate from NUNC and a pipettedvolume of 270 µl, respectively. For each dye, spectra are averaged over32 wells. Left: coumarin 153 in ethanol, right: quinine sulfate dihydratein 0.1 M perchloric acid.
coumarin 153 solution (left), which shows a rather flatmeniscus, compared to the SD of 8% obtained for quininesulfate dihydrate (right) exemplary demonstrates the in-fluence of solvent-related meniscus effects.
Need for Spectral Correction of Fluorescence Spectra
The influence of the instrument-specific spectralcharacteristics and the according need for spectral cor-rection is exemplary highlighted for steady-state fluorom-etry in Fig. 5 comparing the uncorrected and correctedemission spectra of a typical fluorescent label used for thederivatization of amino groups, here at the surface of apolymer support. The measurements were performed attwo different settings of the emission polarizers, i.e. 0◦
and 90◦. As is evident from Fig. 5, the uncorrected emis-sion spectra differ considerably in fluorescence intensityand shape for both polarizer settings. The bump in theuncorrected curve obtained for an emission polarizer setto 90◦ arises from diffraction effects or so-called Woodanomalies of the monochromator gratings of the instru-ment. Moreover, both uncorrected spectra clearly deviatefrom the corresponding corrected spectra that are almostidentical. These findings demonstrate the need for spectralcorrection to obtain comparable instrument-independentspectra and the potential of spectral correction to elimi-nate instrument-related polarization effects that can distortuncorrected spectra.
Fig. 5. Comparison of the uncorrected (dashed lines) and spectrallycorrected (symbols) emission spectra of a fluorophore-labeled polymerfilm measured at two different settings of the emission polarizers, i.e. 0◦and 90◦. The bump in the uncorrected spectrum obtained for 90◦ resultsfrom diffraction effects of the monochromator gratings used.
Fluorescence Standards Suited for Spectral Correction
Spectral correction of fluorescence data provides thebasis for the comparability of fluorescence data across in-struments, laboratories, and over time as well as for thetraceability of fluorescence measurements as illustratedin Figs. 1 and 5. With the increasing application of fluo-rescence instruments with real spectral resolution like forinstance detectors for chromatography, that record fluo-rescence spectra, as well as modern types of fluorescencemicroscopes and the according desire to use fluorescencespectra for species identification, spectral correction, andthe availability of reliably corrected fluorescence spectraare gaining importance for many other fields of applica-tion. Furthermore, spectral correction is mandatory forfluorescence methods that rely on the comparison of twofluorophores with different absorption and emission fea-tures or measured at two different wavelengths.
The traceable correction of fluorescence data forinstrument-specific wavelength dependences can be real-ized via measurement of emission and excitation correc-tion curves in relative intensities [40] either with physicaltransfer standards, i.e. calibrated standard lamps and de-tectors [42], or certified emission and excitation standards.Due to their ease of use and resemblance to typicallymeasured samples, the latter approach is recommendedfor the broad community of users of fluorescence tech-niques. In addition to the previously discussed generalrequirements on fluorescence standards, and the need forbroad and unstructured fluorescence spectra, this type of

Quality Assurance in Fluorometry and Suited Fluorescence Standards 345
spectral fluorescence standard should have moderate tohigh fluorescence quantum yields independent of exci-tation or emission wavelength and dye concentration toenhance the signal-to-noise ratio and to reduce the in-fluence of stray light, solvent emission, and fluorescentimpurities on the shape of the standard’s fluorescencespectrum [40,47]. Minimum overlap between absorptionand emission is important to minimize inner filter ef-fects. A nearly isotropic emission is the prerequisite toguarantee negligible additional uncertainties under mea-surement conditions that can dispense with or for in-struments that lack polarizers. Furthermore, to cover theUV/Vis/NIR spectral region, sets of spectrally tailoredstandards are requested in combination with a tested pro-cedure for the determination of the overall spectral cor-rection curve from the measured and provided correctedspectra [40,46,47].
Measurement of Fluorescence Intensities
To circumvent the use of standards, absolute mea-surements of fluorescence intensities or quantum yieldscan be performed. However, in addition to the consid-eration of the instrument’s spectral characteristics, thisrequires the determination of the absolute fraction of in-cident photons per time unit in the sample that are ab-sorbed by the analyte and the collection efficiency of theinstrument, which together control the fraction of the flu-orescence photons detected. This renders absolute mea-surements very challenging. Also, each instrument has tobe accordingly characterized to establish the comparabil-ity of fluorescence intensities. On our opinion, this is notpracticable on a broad level, i.e. for each instrument usedfor quantitative fluorometry.
For the broad community of users of fluorometry, apurpose-fit approach to quantitative fluorometry includ-ing the determination of fluorescence quantum yields isthe application of fluorescence intensity standards. Forthese applications, the influence of spectra matching andspectral correction is exemplary illustrated in Fig. 6 for aseries of commonly used fluorescent dyes, the correctedemission spectra of which are shown in the lower partof Fig. 6. The upper part of Fig. 6 depicts the integralfluorescence intensities of these dyes that have been de-termined relative to quinine sulfate dihydrate [61] takingthe areas from the respective integrated uncorrected andcorrected emission spectra, respectively. All the measure-ments were performed at the same excitation wavelengthand bandpass. The emission spectra were background-corrected and have been converted from radiometric tophotonic quantities prior to integration [40]. As is evident
Fig. 6. Comparison of the integral fluorescence of several organic dyesobtained from uncorrected and corrected emission spectra, respectively,using quinine sulfate dihydrate in 1 N sulfuric acid as fluorescent stan-dard. Excitation was at 370 nm. Bottom: Corrected emission spectraof α-NPO (short dash-dotted), coumarin 47 (solid line), coumarin 102(dotted), coumarin 153 (dash-dotted), rhodamine 101 (dashed line), andquinine sulfate dihydrate (-◦-).
from Fig. 6, the magnitude of these now and then con-siderable deviations between uncorrected and correcteddata depend on the shape of the wavelength dependenceof the spectral responsivity of the instrument used, seealso Fig. 1, and for a given standard accordingly on thespectral region of the dye’s emission and the width ofits emission spectrum. For each sample-standard pair,uncorrected fluorescence spectra can be compared witha reasonable uncertainty only for species with identicalor at least closely matching fluorescence spectra. This isthe reason why for fluorescence techniques using inte-gral measurements of relative fluorescence intensities forquantification purposes like e.g. flow cytometry, spectramatching is recommended [32,56]. Due to the instrumentspecifity of spectra matching of a sample-standard pair,its dependence on dye microenvironment, and the everincreasing variety of fluorescent labels and fluorophore-containing systems, general solutions to quantitative flu-orescence analysis with small uncertainty are not very

346 Resch-Genger et al.
realistic. Fluorescence-based uncertainties of ca. 2% canbe realized only for simple cases where the fluorescentanalyte and the standard are identical and located in thesame or in a very similar microenvironment. This is of-ten met e.g. for HPLC analysis of fluorescent analytessuch as polycyclic aromatic hydrocarbons (PAH) [54,55].However, for more complex systems, a considerable in-crease in measurement uncertainty of up to a few tensof percent may occur. This is further detoriated espe-cially by the dependence of the fluorescence quantumyield on microenvironment. To meet this challenge, itmay be of interest to determine fluorescence-based un-certainties for representative examples, i.e. very popularlabels and matrices, with varying degree of spectra match-ing and well-characterized microenvironment-inducedchanges in molar absorption coefficients and fluorescencequantum yields.
Fluorescence Quantum Yield Standards
From the material side, the sensitivity of fluorescenceanalysis depends on the molar absorption coefficient of thesample/analyte(s) at the excitation wavelength and the flu-orescence quantum yield. Accordingly, the availability offluorescence quantum yields of (bio)analytically relevantdyes in application-relevant matrices under application-relevant conditions and their accurate determination areof considerable importance. The uncertainty of the mea-surement of relative fluorescence quantum yields is gov-erned by several factors. Major contributions arise fromthe uncertainty or lack of spectral correction, see Fig. 6,temperature-related effects, uncertainties inherent to ab-sorption measurements and dilution of solutions as wellas from the uncertainty of the fluorescence quantum yieldof the chosen standard, respectively. With respect to thelatter, it is critical that literature data on fluorescence quan-tum yields are often not very reliable with deviations of upto 50% being not uncommon and uncertainties typicallymissing. Accordingly, there is still a considerable need forfluorescence quantum yield standards for the UV/Vis/NIRspectral region, the fluorescence quantum yields of whichhave been determined with a stated uncertainty with atraceably characterized setup. To eventually overcomethese problems, currently at BAM, a reference fluorometeris been built for the dissemination of absolute fluorescencequantum yields. Furthermore, not only well-characterizedstandards with high fluorescence quantum yields aredesired but also systems of low fluorescence quantumyield. This takes into account that not only the absorp-tion and emission spectra of standard and sample shouldlay within a similar spectral region but also the size oftheir quantum yields should be preferably close to avoid
problems related to nonlinearities of the detection systemor dilution errors.
Standards for the Characterizationof Material-Related Autofluorescence
The inherent sensitivity of fluorescence imposesstrong requirements on materials suited for the fabrica-tion of optical components for fluorescence instrumentsas well as supports for fluorescence analysis. This even-tually affects quality control by materials suppliers as isexemplary revealed for glass-type materials. Generally,materials made for applications in optical technologiesshould show minimum autofluorescence on excitation atwavelengths typically used, i.e. LED, and laser (diode)wavelengths as well as at 365, 248, and 193 nm. Further-more, they need to be stable under application-relevantconditions, e.g. at photon fluxes in the range betweenµW/cm2 for spectroscopy/microscopy and kW/cm2 formicrolithography, and should not form fluorescent photo-products [62,63]. With respect to proper quality controlfor glass-type materials, it has to be taken into accountthat their optical properties and (photo)stability are influ-enced by (fluorescent) impurities/dopants, the presenceof point defects such as color centers that originate forinstance from impurities such as RE elements, as well asthe matrix. Also, the glass manufacturing process itselfplays a role, i.e. redox equilibria and eventually incor-poration of dopants into the glass matrix [64–66]. Ac-cordingly, material-related autofluorescence needs to bespecified under application-relevant conditions, e.g. ex-citation wavelengths and photon fluxes [67], and on abatch-to-batch basis, see also Fig. 3. Techniques that areincreasingly used for this purpose are conventional steady-state, laser-induced, and time-resolved fluorometry [68–74]. For instance, a standard procedure for quality controlused by suppliers of optical glass is the measurement of theglass emission at an excitation wavelength of 365 nm andcomparison of the integral emission in the wavelength re-gion of 400–700 nm to that of reference samples like SF1or SF6 available from Schott AG. SF1 and SF6 contain adefined amount of emissive lead ion chromophores, e.g.ranging between 20 and 70%. A similar approach basedon lead-type glasses certified by the Agency of IndustrialScience and Technology (AIST) is performed within theJapanese Optical Glass Industrial Standard (JOGIS) pro-cedure applied by Japanese manufacturers [75]. Glassesof low emission show an integral photoluminescence wellbelow 5%.
Despite of the considerable importance for opticalindustry, instrument manufacturers and for the reliabil-ity of fluorescence analysis—aside from these lead-based

Quality Assurance in Fluorometry and Suited Fluorescence Standards 347
standards—up to now, there are no suited solid referencematerials available that enable a standardized determi-nation of the application-relevant fluorescence propertiesof glass-type materials. Desired are fluorescence quan-tum yield standards and/or reference materials that relatethe concentration of typically encountered fluorescent im-purities or dopants to fluorescence intensity, standardsto quantify the acceptable level of autofluorescence forquality control as well as standards for the fluorometricquantities luminescence lifetime and (de)polarization. Inaddition to the requirements on quantum yield and flu-orescence intensity standards, of special importance forthis application are the shape and size of potential refer-ence materials and the respective measurement geometry,e.g. 0◦/90◦ and front face. Also the luminescence quan-tum yields of the analytes of interest have to be taken intoaccount. Luminescence quantum yields are in the rangeof 60% for RE-doped optical glass and CaF2 due to theinner-shell nature of the optical transitions involved, reachup to 95% for color centers [76], and are below 10% foroptical transitions from the ns2 levels (n = 1, 2, 3, etc.)as is found for instance in SbO3, AsO3 or ZnO. Suitedluminescence lifetime standards should cover the ns- toms-time domain. In a first step, to help manufacturers ofoptical materials and fluorescence instruments to improvefluorescence-based quality control, a set of reference ma-terials covering the most important application-relevantproblems related to autofluorescence from glass-type ma-terials needs to be defined, certified, and made available.Furthermore, internationally accepted guidelines for thedetermination and specification of autofluorescence areincreasingly requested. This will eventually contribute toan improved performance of fluorescence instruments andreliability of fluorescence analysis.
Flow Cytometry
Flow cytometry is a technique frequently used inclinical medicine to support diagnoses or prognoses ofdifferent diseases such as leukaemia, HIV infection orimmune paralysis, i.e. sepsis. To derive the informationrequired for a medical decision, cells of a blood or bonemarrow sample as well as cells isolated from a biopsyare distinguished according to their physical and biolog-ical properties. Subsequently, concentrations or relativeconcentrations of subpopulations of cells are determined.Apart from cell differentiation based on light scattering inforward and sideward directions, staining of the surface oftarget cells by fluorophore-labeled monoclonal antibod-ies has evolved as a powerful tool for the identificationof subpopulations of cells, e.g. T-helper and T-suppressorlymphocytes in AIDS diagnosis. In addition, flow cytom-
etry is used to detect fluorescently labeled intracellularconstituents like DNA or messenger RNA.
One essential feature of flow cytometry is the anal-ysis of single particles at a high throughput of up to100 kHz. For this purpose, the sample fluid containingthe suspended particles is injected into a flow cell to-gether with a second fluidic stream, the sheath or mantlestream. This results in hydrodynamic focusing of the sam-ple stream to diameters of typically 5 µm that correspondapproximately to the size of human blood cells. Hence,the cells are forced to cross one or several laser beams,oriented perpendicularly with respect to the direction ofthe flow, in single file. When passing the laser beams,for each cell, light scatter in forward and sideward di-rection and laser-induced fluorescence is simultaneouslyrecorded. Generally, the pulse heights of the signals aremeasured. Fluorescence is observed in up to four differentoptical bandpasses or channels corresponding to differentantibodies and different fluorophores, respectively.
In most cases, relative fluorescence intensities aremeasured in flow cytometry to divide cell population intotwo species, one of which reacts with a selected mono-clonal antibody and hence is termed positive. The otherpopulation that does not react with the selected antibodyis referred to as negative. In Fig. 7, a typical histogramobtained with the antibody CD4 (Cluster of Differentia-tion 4) labeled with the fluorophore PE (phycoerythrin)is presented which features two populations, i.e. CD4-positive (CD4+) lymphocytes and CD4-negative lympho-cytes [77]. The difference or ratio of the distributionsof fluorescence intensities between these two cell sub-sets strongly depends on several factors. This includes theinstrumental characteristics, the spectroscopic properties
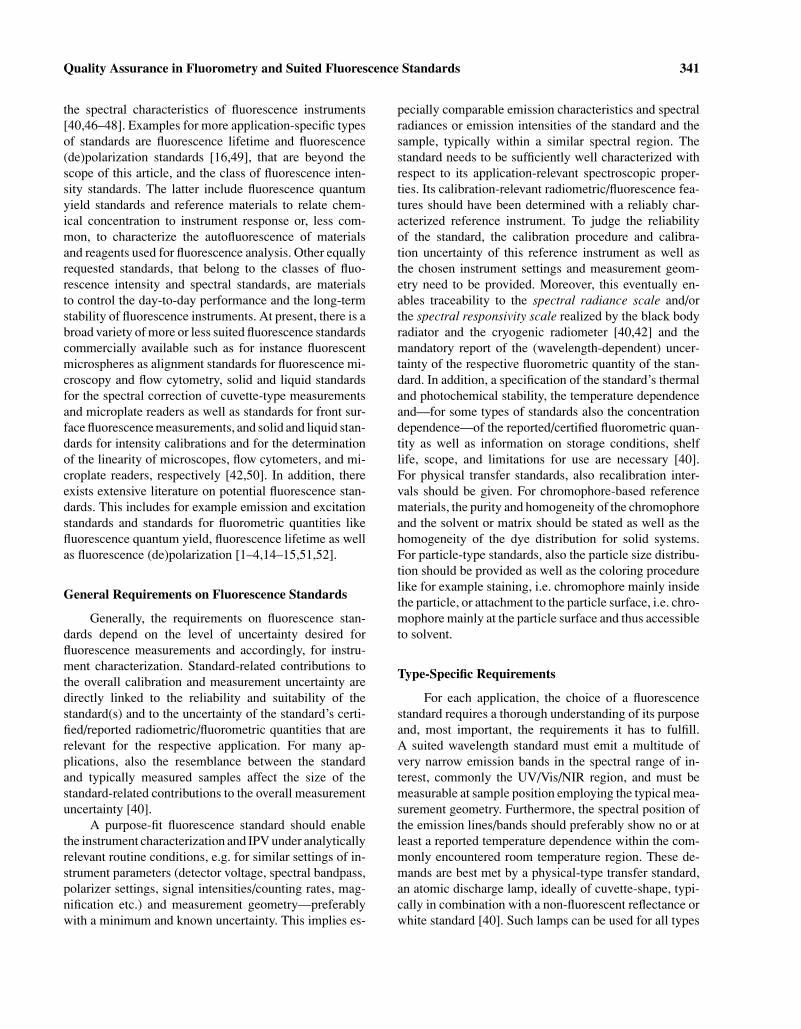
Fig. 7. Histogram of the frequency distribution of stained white bloodcells. Phycoerythrin (PE) labeled antibodies CD4 were used to identifyCD4-positive T-lymphocytes. Included in the figure is the discriminationthreshold to distinguish positive and negative cells. The histogram wasprovided by V. Ost, PARTEC GmbH.
348 Resch-Genger et al.
of the fluorescent molecules attached to the antibody,and cell-specific biological features like autofluorescencefrom intracellular constituents and non-specific binding.To account for contributions arising for example fromautofluorescence and from non-specific binding, controlexperiments (variation of the spectral irradiance of excit-ing laser beams, isotype control to determine non-specificbinding, titration of antibody concentration) are requiredto optimize the difference between positive and negativepopulations, i.e. the signal-to-background ratio. To facil-itate the comparison of the results from different instru-ments, to compare different blood samples, and to accom-plish a day-to-day control of the flow cytometer, stainedmicrobeads are frequently used. A typical histogram dis-playing the relative frequency of particles of different flu-orescence intensity is depicted in Fig. 8. The number ateach peak corresponds to MESF units. The MESF numberdoes not represent the true amount of dye molecules, butindicates the brightness, i.e. the product of the molar ab-sorption coefficient and the fluorescence quantum yield, ofthe fluorescent species in solution [13,39]. MESF particlesare available with different fluorophores like for instancefluorescein (FITC), PE or allophycocyanin (APC) and areroutinely used to align the optics of flow cytometers, toset the detection threshold as well as to check the sensi-tivity and the linearity of the instruments. Alternatively,the linearity and resolution, i.e. the width of the intensitydistribution of flow cytometers can be monitored withbiological material, e.g. DNA-stained trout or chickenerythrocytes.
Fig. 8. Histogram of differently stained calibrations beads (SPHEROTM
Rainbow Fluorescent Particles). The fluorescence intensities given inarbitrary units can be calibrated in MESF units. The correspondingMESF numbers labeling each peak indicate its respective center. Thefluorescence was observed in the FITC detection path of a Cytomation
MoFlocell sorter.
To improve quality assurance in flow cytometry, thespectroscopic features of existing calibration (MESF) par-ticles should be better characterized. This implies for ex-ample the determination of the absorption spectrum andthe molar absorption coefficients at the wavelengths com-monly available in flow cytometers as well as the cor-rected emission spectrum and fluorescence quantum yieldin phosphate buffered isotonic solution. The availability ofsuch data would allow users of flow cytometry to obtain aspectral correction of the instrument and to determine thecrosstalk between different fluorescence detection paths,the correction of which is termed fluorescence compen-sation. This eventually considers future developments inflow cytometry that might result in an improved spectralresolution from presently 20–30 to 1–2 nm. Accordinglycertified MESF beads are suited to calibrate such instru-ments which allow to record emission spectra.
Apart from relative measurements, quantification offluorescence intensity in flow cytometry and subsequentdeduction of the significant biological quantities, i.e. thenumber of specific antibodies on the cell surface (anti-body binding capacity, ABC) or the number of proteinswithin the cell, would possibly allow to improve medicaldiagnosis. For example, standardized immune monitor-ing, which includes the determination of ABC for differ-ent antibodies, has been recently applied [78] to derivecriteria for the prediction of infections in risk patients af-ter cardiopulmonary bypass surgery. For monocytes, theexpression of HLA-DR (human leukocyte antigen) epi-topes correlates with their activation and can be appliedto monitor patients with septic shock [79]. To determinethe number of antibodies, the QuantiBRITEprinciple isused [80]. For this calibration procedure, PE is chosento label antibodies and calibration beads as the influenceof the microenvironment on its spectroscopic propertiesis not as pronounced as for other fluorophores. Anotheradvantage of PE is its high molecular weight and its cor-respondingly large size, which allows to control that onlyone fluorochrome is bound to each antibody. Apart fromquantification of PE fluorescence, the expression of en-hanced green fluorescent protein (EGFP) of transfectedT-cells has been determined by calibration of the fluores-cence of cells to an EGFP standard of validated MESFunits [81].
Due to the inherent sensitivity of fluorescence to dyemicroenvironment, for each chromophore, diverse envi-ronmental conditions can cause significant variations inthe brightness and spectral position of the absorption andemission bands of the stained cells. The classical exampleis the pH dependence of the fluorescence quantum yieldof frequently used fluorescein which limits its use. Hence,to correct for such variations, any standard used to derive

Quality Assurance in Fluorometry and Suited Fluorescence Standards 349
biological quantities has to mimic the fluorescently la-beled cells as closely as possible. However, because of thecomplexity of bacteria or cells, it is challenging to achievematching of absorption and emission spectra of standardand biological sample. In addition, it is ambiguous to con-trol labeling-induced changes of the spectral features, themolar absorption coefficient, and especially the fluores-cence quantum yield. To assure the traceability of such astandard and to quantify its spectral properties, compar-ison with corresponding stained cells is mandatory, forexample by employing cell sorting and subsequent sin-gle molecule bleaching under microscopic control. Thistechnique would allow to determine the properties of fluo-rophores in situ and to account for the influence of the mi-croenvironment. In addition, to derive the biological influ-encing quantities, colocalization should be applied to thecells under investigation to distinguish specific and non-specific binding of the fluorophore-labeled monoclonalantibodies.
Fluorescence Microscopy
As a tool in microscopy—in addition to absorp-tion methods—fluorescence provides a number of al-ready mentioned possibilities such as e.g. selectivity ofcommunication via different parameters like excitationand emission wavelength, fluorescence lifetime, and flu-orescence (de)polarization [5,82–85]. Furthermore, withconfocal laser scanning microscopy and wide-field mi-croscopy with spatially modulated excitation, the theo-retical limits of spatial resolution that are determined bythe numerical aperture of the objective and the excita-tion wavelength can be realized in practice. In addition,labeling or probing of biological structures with fluo-rescent reporters allow their indirect visualization evenwhen the size is far below the optical resolution limit.Accordingly, confocal and wide-field fluorescence mi-croscopy have been developing into some of the mostpowerful and commonly used methods in medicine, foren-sics, and bioanalysis. Founded on these techniques, fur-ther specialized imaging and non-imaging methods liketwo-photon fluorescence microscopy (2P), Forster or fluo-rescence resonance energy transfer (FRET), total internalreflection microscopy (TIRF), fluorescence lifetime imag-ing microscopy (FLIM), fluorescence recovery after pho-tobleaching (FRAP), fluorescence loss in photobleach-ing (FLIP), fluorescence intensity (FLINT), fluorescenceanisotropy (FA), time-resolved energy transfer (TRET) aswell as fluorescence correlation spectroscopy (FCS) havebeen become very popular. Typical applications of fluores-cence microscopy techniques are investigations of fixed(dead) samples like immunofluorescence studies and in
situ hybridization measurements of DNA sequences, livecell imaging with measurements of the structure, dynam-ics, and potential (maps) of membranes and organelles,measurements of cell structures, organization, and func-tion, e.g. determination of intracellular pH and physio-logically important ions like e.g. Ca(II), Na(I), K(I), andMg(II) [86] as well as studies of protein structure anddynamics [5,82–84,87]. A broad variety of these micro-scopic techniques do not require quantification. However,methods for the study of biological functions are gain-ing importance that demand the precise quantification ofthe concentration of analytes by measuring fluorescenceintensity in the 3D space over time (4D). Furthermore,as some experimental approaches or methods like FRETrequire quantitative spectrally resolved measurements oftwo fluorophores simultaneously, this task can result in5D data sets. The need for quantification, however, ispoorly met at present as commercial imaging instrumentsare designed mostly for high image quality, i.e. low back-ground signals and image distortions, high light through-put, and good detection efficiency, but not primarily forquantitative measurement of fluorescence. Accordingly,this situation is reflected by the commercially availablestandards.
Due to the complexity of the instrumentation used forconfocal and high-end wide-field imaging microscopy,there is an urgent need for easy-to-use standards andsimple procedures for the characterization of these in-struments, control of instrument specification, day-to-day and long-term performance as well as to enable thecomparability—and in some cases the combination of mi-croscopic data—across instruments and laboratories. Thiscan be seen as the first necessary step towards calibrationprocedures and standards fulfilling the up-coming needfor signal quantification in many fields of microscopicimaging. The demand for standardization of instrumentcharacterization and measurement procedures is furtherenhanced due to the increasing use of fluorescence mi-croscopy in areas like medical diagnostics. Accordingly,in this section, the general need for and requirementson standards suited for fluorescence microscopy are dis-cussed without consideration of the specific demands ofthe broad variety of fluorescence microscopic techniquesavailable.
In conventional and confocal fluorescence mi-croscopy, the recorded signal is affected by the sample-specific amount of fluorescent molecules with a certainmolar absorption coefficient and fluorescence quantumyield present in a given microscopic volume, the in-strument, and autofluorescence. The latter can arisefor instance from the sample, the instrument’s opticsand/or from an immersion medium. (Time-dependent)

350 Resch-Genger et al.
instrument-specific effects are linked to the wavelength-dependent spectral irradiance at sample position, thewavelength- and polarization-dependent light collectionproperties and aberration of the microscope, and thewavelength- and polarization-dependent spectral respon-sivity of the detection system [88]. To obtain instrument-independent and hence comparable data, these instrumentcharacteristics need to be measured. For the quantifica-tion of the recorded signals, the linearity of the detectionsystem has to be determined and either standards closelymatching the sample/analyte to be quantified or appropri-ate characterization procedures are required [89]. Accord-ing to the broad community of fluorescence microscopists[90], instrument-type standards—preferably in combina-tion with guidelines for instrument characterization—aredesired to characterize the size of the illuminated volume,i.e. the point-spread function [91], the instrument’s spatial(x, y) resolution, the spectral irradiance/excitation inten-sity reaching the sample, the homogeneity of the sampleillumination, the field flatness, z-distance and z-resolution,the spectral resolution as well as the day-to-day andlong-term instrument performance, respectively. More-over, application-specific fluorescence intensity standardsor so-called reference standards are requested [92] andinternationally agreed methods/protocols in combinationwith suited systems to determine the range of linearity ofthe detection system [93]. Additionally, guidelines includ-ing materials to measure limits of detection are of interest,for instance to compare the sensitivities of different instru-ments. Furthermore, with the increasing spectral resolu-tion offered now by the majority of modern commercialconfocal microscopes, spectral fluorescence standards aregaining importance [94].
Standards for the characterization and calibration offluorescence microscopes have to meet additional require-ments compared to standards for macroscopic fluores-cence spectroscopy. This is due to the strongly increasedspectral irradiances at the sample position that exceedthose used in conventional (macro)fluorometry often by 4or more orders of magnitude [17]. Accordingly, frequentlyenhanced photodecomposition is observed, especially inthe case of laser illumination typically used for confocalscanning techniques. The strongly improved spatial reso-lution imposes more strict requirements on the homogene-ity of the chromophore distribution within the standard.Size and shape of a standard are by far more importantas microscopic measurements usually require changes infield aperture and magnification. Only dimension-adaptedmicroscopic standards with a well-defined shape permita correct intensity/volume relationship. Furthermore, thespectral radiances and spectral characteristics of the stan-dard and the sample need to be sufficiently similar.
At present, there is a broad variety of fluorescencestandards, mostly of instrument-type, commercially avail-able. Instrument standards can be of chemical, i.e. organicor inorganic nature, or of physical type. Standards, whichrelate instrument response to analyte concentration, com-monly rely on organic fluorophores either incorporatedwithin or bound to the surface of a stable, non-fluorescinghost of well-defined shape. Other approaches are micro-droplets of fluorescent solutions [92] or microcapillariesfilled with fluorophore solutions [17,95,96]. Typical in-strument standards are for instance inorganic ion-dopedglass materials such as uranyl-containing glasses [97,98]that are of good photo-stability but no longer commer-cially available, or inorganic ion-doped fibers [99] de-veloped for the calibration of the day-to-day instrumentperformance. Inorganic ion-doped glasses have only re-stricted application as reference standards for certainanalytes with sufficiently similar excitation and emis-sion spectra. Fluorescent microspheres [100–102] are ofwidespread use not only as instrument-type standards tocheck on instrument alignment, sensitivity, and stability aswell as spectral separation (multicolored particles) of bothconventional microscopes and laser scanning systems butalso as internal as well as external fluorescence intensitystandards. Some examples for measurements with fluores-cent microspheres are shown in Fig. 9. The dually labeledbeads (FocalCheck, Molecular Probes) shown are appliedfor alignment purposes (parfocality, xy pixel-shift withcolor) in confocal and wide-field fluorescence microscopywhen two or more excitation/fluorescence channels haveto be acquired from one location in the 3D space. Theyallow to adjust for pixel-shift free recordings in the 3Dspace, see Fig. 9C and D, respectively. However, thesemicrospheres can act as an additional optical lens elementin the optical path, leading to severe optical distortions inthe 3D space as follows from Fig. 9B. The applicabilityof such particles is further limited by the fluorophore’sstability and often by the mounting medium.
Other suggested standards include concentrated so-lutions of fluorophores like fluorescein and rhodaminedyes on a regular slide [103] for shading or flat field correc-tion, fixed fluorescent cells [104] or fluorescent polymers,which can, however, suffer from spatial non-uniformityleading to inhomogeneous emission [105], immobilizedparticle arrays [106] or wax films doped with fluores-cent dyes [107]. Recently, organic and inorganic systemscontaining uniformly dispersed luminescent nanocrystalsat various concentrations have been suggested as poten-tial fluorescence standards for microscopy [108]. How-ever, aside from the generally advantageous spectroscopicproperties of quantum dots, i.e. size-tunable broad absorp-tion and narrow emission bands, and comparatively high

Quality Assurance in Fluorometry and Suited Fluorescence Standards 351
Fig. 9. Focal check beads usable for parfocal alignment and shift free multi-channelacquisition in confocal and wide-field fluorescence microscopes. The beads are labeledwith one color throughout and with a second color on the outer shell. (A) Overlay of athree-channel image acquired sequentially with 364, 488, and 543 nm excitation (mixtureof beads F-7237 and F-7238, Molecular Probes Inc., Eugene, USA). (B) Orthogonal x–zand y–z cross-section view from a two-channel z-stack (excitation at 364 and 488 nm). Itcan be seen, that the bead acts as an optical active element, leading to a distorted intensityprofile of the green colored shell. (C) x–z cross-section view of a bead squeezed betweentwo microscope slides, well-aligned collimator for UV/Vis illumination. (D) x–z cross-section after misaligning the collimator, which results in a shift of one color in relation tothe other. All images were recorded with a 63×/1.2 water immersion lens on a LSM 510Meta confocal microscope (Carl Zeiss GmbH, Jena, Germany).
fluorescence quantum yields in the long wavelength re-gion [109], the suitability of such systems as standardsrequires a very narrow and reproducible particle size dis-tribution and a time- and illumination-independent bright-ness [110]. The latter implies the overcome of the often ob-served increase in fluorescence intensity on illuminationor so-called photobrightening [111]. Also physical-typestandards like for instance lamp-based calibration assem-blies have been reported [94]. An intriguing approach is atest slide that contains a built-in regulated light-emittingdiode in feedback configuration with a PIN photodiodeand different pinholes to mimic the emission characteris-tics of fluorescent cells [112]. This assembly allows thedetermination of the linearity of the detection system ofa microscope. Another multifunctional standard is a mi-croscope test slide that contains side by side a photodiodefor power and pulse length measurements and a detectorfor wavelength measurements [113].
Despite of the enormous progress in fluorescencemicroscopy and the broad variety of fluorescence stan-dards suggested, up to now, the suitability of the availablematerials as well as the need for improved standards forthe characterization of fluorescence microscopes and forquantification purposes is still under debate [90]. This is
also true for the demand of internationally accepted pro-tocols for instrument calibration, control of instrumentspecifications, and IPV as well as signal quantification.Disadvantages of some of the available or recommendedfluorescence standards that need to be considered andeventually overcome, are high, not sample comparablefluorescence intensities emitted even at low excitation in-tensities which lead to enhanced calibration uncertain-ties caused by nonlinearities of the detection system orstray light effects within the instrument. Critical can bealso a non-adequate thickness of the fluorescence stan-dard that renders the identification of the appropriate fo-cal plane for the calibration procedure difficult. Also,the effect of the coverslip has to be taken into accountfor the design and selection of a suited standard. Mea-surements of a standard without a coverslip may be er-roneous due to distortion of the measured signal in thelight path, as most of the objectives for biological imag-ing are designed, i.e. calculated, for use with a cover-slip of 170 µm thickness. However, for objectives madefor application without a coverslip—water dipping lensesemployed in neurobiology or lenses for use in materialscience—coverslip-free standards are needed. Further-more, severe optical distortions due to strong refractive
352 Resch-Genger et al.
index mismatches between standard and immersion me-dia can be problematic and should be avoided when the3D dimension of the standard is of importance. Otherstandard-related problems and sources of error can be aninsufficient or not reported stability under laser illumina-tion that leads to photodecomposition of the fluorophoreand accordingly aging-inherent intensity and/or spectralvariations and/or an inhomogeneous distribution of thechromophore within the matrix for solid standards such ascolor slides.
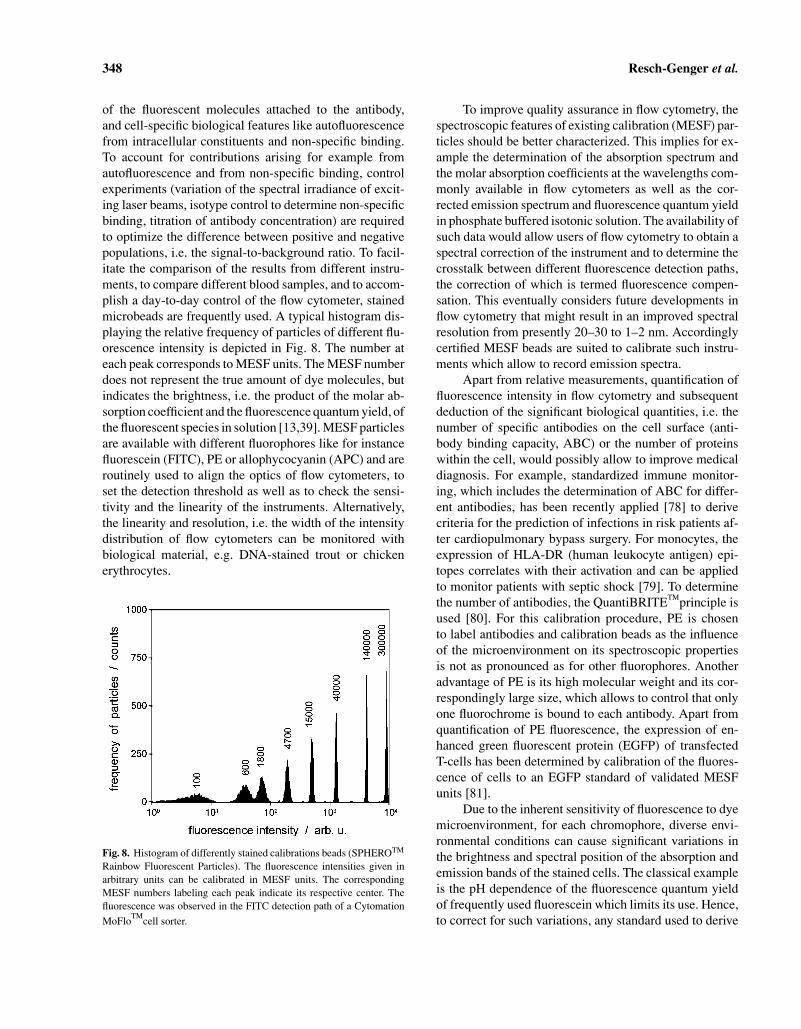
To the best of our knowledge, long-term stabilityproblems have been encountered for almost all types ofpotential standards for fluorescence microscopy. The in-fluence of such photoinduced effects is exemplary illus-trated in Fig. 10 for colored, fluorescent plastic slidesthat are used in confocal and wide-field microscopy forspectrally resolved measurements, spectral calibration aswell as adjustment or control of the homogeneity of theillumination. These slides may be also suited for the eval-uation of (fluctuations of) the excitation light intensity or
Fig. 10. Fluorescence emission spectra and photobleaching of plastic color microscope slides from different suppliers (Deltavision (DV), MM).(A) Emission spectra of the color slides recorded on a LSM 510 Meta (Carl Zeiss GmbH, Jena, Germany) confocal microscope with the appropriateprimary dichroic beamsplitter (DC) and a 63 × /1.2 water immersion lens. The bandwidth of the spectral Meta unit was set to 10.2 nm. A distortionof the real emission spectrum as a result of the optical properties of the DC was not taken into account. (B and C) Photo-stability/bleach resistanceof the calibration slides. The measurements of times series of images were performed as follows: Within regions of interest (ROI), marked withsolid lines, additional scans with maximum laser intensity were run to probe the bleaching characteristics of the slides. The settings for theseROI were: 1000 scan iterations, pixel time 1.4 µs, scanning time in total for the ROI ca. 2.5 s (DAPI Blue, Ex 364 nm,) or 25 s (DV 488/519,excitation at 488 nm). This was repeated with the DAPI Blue sample (B) every 2.5 s for 20 times and for DV 488/519 (C) every 2.5 s for 60 times.Images of the total area shown were taken in between the high-intensity ROI excitation: Five images (DAPI Blue) and 10 images (DV 488/519).Measurements of the emission intensity over time within the upper ROI positions result in the non-bleached curves (dashed lines), the ROIsmarked with solid lines yield the bleached curves.

Quality Assurance in Fluorometry and Suited Fluorescence Standards 353
the determination of the sensitivity of fluorescence micro-scopes. The emission spectra of these slides and the photo-stability studies are shown in Fig. 10A, 10B, and 10C,respectively. The low resistance to photodecomposition incombination with the presence of defects in the fluorescentlayer makes these slides not very attractive candidates forother than spectral calibration tasks provided that no light-induced spectral changes occur. To overcome problems re-lated to photodecomposition requires either materials ofan improved or at least better characterized photo-stabilityor single-use materials of excellent reproducibility.
A first step to the design of better-suited fluores-cence standards for fluorescence microscopy seems to bethe development of fluorophore-doped glass- or polymer-based slides and/or slides with fluorescent coatings forthe spectral region of ca. 450 to 900 nm that show ide-ally little photodecomposition under application-relevantconditions and a homogeneous distribution of a singleor a mixture of different fluorophores. The albeit statedphoto-stability should be given in terms of application-relevant light fluxes at typically used excitation wave-lengths. A more single-use type approach could includefor instance the application of slide-type cells or capil-laries with a defined optical pathlength filled with (re-newable) fluorophore solutions. With respect to the de-sired standardization of microscopic measurements, theapplication-relevant spectroscopic properties of these po-tential reference materials, that need to be tested with abroad variety of commercially available fluorescence mi-croscopes, should be preferably certified [37].
Fluorescence- and Biology-Related Problemsin the Microarray Technology
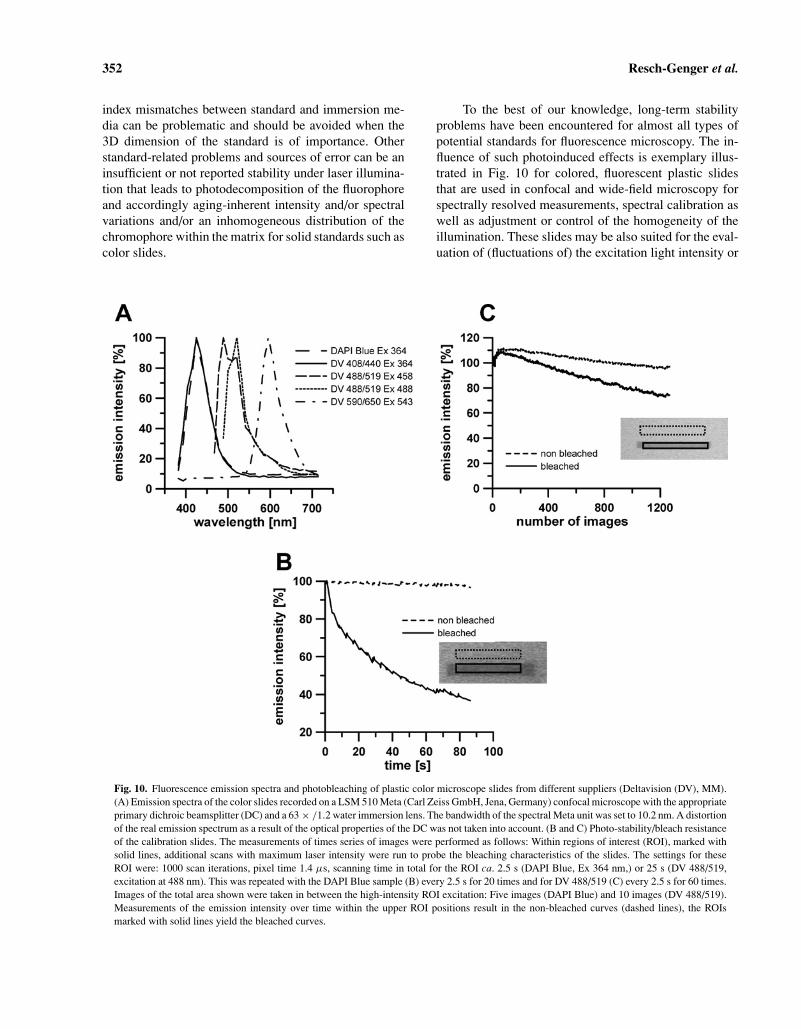
Biochips have become an increasingly important re-search tool for the biotechnology industry, molecular di-agnostics, and related fields of gene expression analysis,drug screening, nucleic acid sequencing, and mutationanalysis [114–119]. Such biochips consist of a pluralityof binding agents or so-called probes. Such probes can bepeptides, oligonucleotides, or up to ten thousands of sin-gle stranded DNA fragments representing a single gene orgenome that are deposited onto the surface of a solid sup-port like a coated glass slide in the form of an array withspot sizes in the 50 to 200 µm range. For typical DNA mi-croarray experiments with fluorescence detection, RNA orDNA from biological samples and from controls is iso-lated and—during a reverse transcription reaction—thattranscribes RNA into cDNA—labeled with two spectrallydistinguishable dyes like the cyanine dyes Cy3 (absorp-tion at ca. 550 nm, emission at ca. 565 nm) and Cy5(absorption at ca. 650 nm, emission at ca. 675 nm), re-
spectively. The labeled biomolecules are then reacted, i.e.hybridized with the microarray thereby binding to theircomplementary sequences present in the spotted probes.After processing, the microarrays are read out with anarray reader, typically a confocal laser scanner equippedwith a He–Ne laser (543,5, 594, 612, and 632.8 nm) ora Kr–Ar laser (488, 514, 568, and 647 nm) or less com-mon, a solid-state laser or a white light source and a PMTor a CCD (charge coupled device) detection system witha lateral resolution of 5–10 µm, respectively. This stepinvolves excitation at two different wavelengths and sub-sequent recording of integral fluorescence intensities intwo detection channels, the so-called green and red chan-nel [120]. Usually, the scanner software is able to com-bine signal intensities of both channels and to deliver afalse-color image. The amount of analyte bound to a spotfollows from the measured integral fluorescence inten-sity with abundant targets seen either in red or green andequal amounts in yellow. This allows for the estimationof relative expression levels of the genes from the fluores-cence intensities of the spots. For the generation of reliablegene expression data, several repetitions and controls arenecessary with the obtained expression values being sta-tistically analyzed and normalized. Further bioinformaticanalysis, e.g. hierarchical agglomerative clustering of thegene expression data, provides the basis for the interpre-tation of the alteration in gene expression of many genesin parallel [121–123].
Microarray experiments are performed either by ra-tio or direct measurements comparing two RNA samples,e.g. healthy and disease stage, or by absolute or indirectmeasurements comparing one RNA sample to a reference,e.g. standardized RNA or DNA. Accordingly, this yieldseither relative expression values (ratios) or absolute ex-pression values. To improve the reliability of the data,suitable controls are introduced that are incorporated intoevery experiment and are accordingly present on the arrayand spiked into the hybridization solution. This includesrange, ratio, negative, and contamination controls as wellas a positive control and a guide-dot for orientation af-ter scanning. As an example for both approaches, imagefiles of the two different experimental designs measur-ing direct (A) and indirect (B) gene expression valuesof the plant Arabidopsis thaliana during its growth areshown in Fig. 11, respectively. For the former, RNA fromtwo different stages are labeled either with Cy3 or Cy5and hybridized to an Arabidopsis microarray. For indirectmeasurement of gene expression values, the target sam-ple is labeled either with Cy5 or Cy3, and a vice versalabeled reference oligonucleotide that is complementaryto the PCR primers used for probe generation is spikedinto the hybridization solution and co-hybridized.
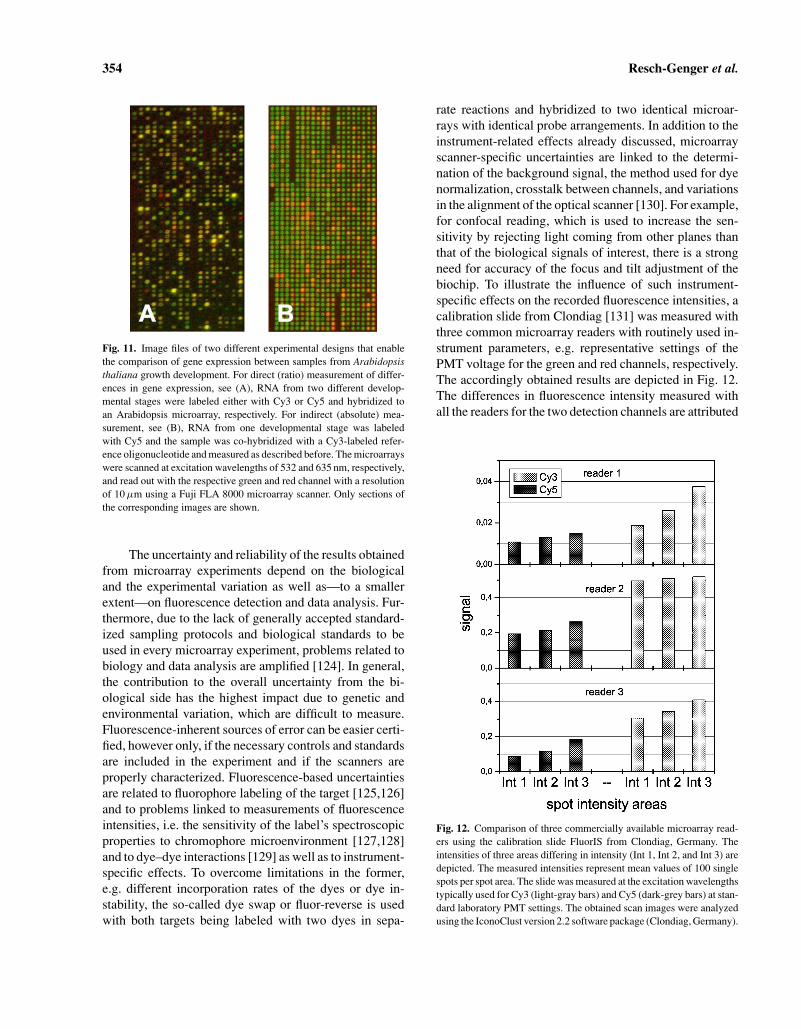
354 Resch-Genger et al.
Fig. 11. Image files of two different experimental designs that enablethe comparison of gene expression between samples from Arabidopsisthaliana growth development. For direct (ratio) measurement of differ-ences in gene expression, see (A), RNA from two different develop-mental stages were labeled either with Cy3 or Cy5 and hybridized toan Arabidopsis microarray, respectively. For indirect (absolute) mea-surement, see (B), RNA from one developmental stage was labeledwith Cy5 and the sample was co-hybridized with a Cy3-labeled refer-ence oligonucleotide and measured as described before. The microarrayswere scanned at excitation wavelengths of 532 and 635 nm, respectively,and read out with the respective green and red channel with a resolutionof 10 µm using a Fuji FLA 8000 microarray scanner. Only sections ofthe corresponding images are shown.
The uncertainty and reliability of the results obtainedfrom microarray experiments depend on the biologicaland the experimental variation as well as—to a smallerextent—on fluorescence detection and data analysis. Fur-thermore, due to the lack of generally accepted standard-ized sampling protocols and biological standards to beused in every microarray experiment, problems related tobiology and data analysis are amplified [124]. In general,the contribution to the overall uncertainty from the bi-ological side has the highest impact due to genetic andenvironmental variation, which are difficult to measure.Fluorescence-inherent sources of error can be easier certi-fied, however only, if the necessary controls and standardsare included in the experiment and if the scanners areproperly characterized. Fluorescence-based uncertaintiesare related to fluorophore labeling of the target [125,126]and to problems linked to measurements of fluorescenceintensities, i.e. the sensitivity of the label’s spectroscopicproperties to chromophore microenvironment [127,128]and to dye–dye interactions [129] as well as to instrument-specific effects. To overcome limitations in the former,e.g. different incorporation rates of the dyes or dye in-stability, the so-called dye swap or fluor-reverse is usedwith both targets being labeled with two dyes in sepa-
rate reactions and hybridized to two identical microar-rays with identical probe arrangements. In addition to theinstrument-related effects already discussed, microarrayscanner-specific uncertainties are linked to the determi-nation of the background signal, the method used for dyenormalization, crosstalk between channels, and variationsin the alignment of the optical scanner [130]. For example,for confocal reading, which is used to increase the sen-sitivity by rejecting light coming from other planes thanthat of the biological signals of interest, there is a strongneed for accuracy of the focus and tilt adjustment of thebiochip. To illustrate the influence of such instrument-specific effects on the recorded fluorescence intensities, acalibration slide from Clondiag [131] was measured withthree common microarray readers with routinely used in-strument parameters, e.g. representative settings of thePMT voltage for the green and red channels, respectively.The accordingly obtained results are depicted in Fig. 12.The differences in fluorescence intensity measured withall the readers for the two detection channels are attributed
Fig. 12. Comparison of three commercially available microarray read-ers using the calibration slide FluorIS from Clondiag, Germany. Theintensities of three areas differing in intensity (Int 1, Int 2, and Int 3) aredepicted. The measured intensities represent mean values of 100 singlespots per spot area. The slide was measured at the excitation wavelengthstypically used for Cy3 (light-gray bars) and Cy5 (dark-grey bars) at stan-dard laboratory PMT settings. The obtained scan images were analyzedusing the IconoClust version 2.2 software package (Clondiag, Germany).

Quality Assurance in Fluorometry and Suited Fluorescence Standards 355
to the different wavelength-dependent spectral responsivi-ties of the respective detection systems, see e.g. also Fig. 1.Typically, such detection systems are less sensitive in thelong wavelength region of ca. 675 nm as compared to a de-tection wavelength of ca. 565 nm. The obvious deviationsbetween the three data sets clearly demonstrate the needfor a general calibration tool to improve the reliability ofmicroarray data from the detection side.
To make microarray data world-wide comparable,there is a strong need for instrument standards, applica-tion of biological reference materials, and standardizedprocedures/protocols for the performance and evaluationof such experiments. For the reduction of biology- anddata evaluation-related uncertainties, the microarray re-search community has discussed since a long time theintroduction of quality controls (QCs) and SOPs as wellas biological reference materials such as for instance stan-dards based on genomic DNA, a reference RNA pool ora reference oligonucleotide for measuring more preciselyabsolute or indirect gene expression values [132,133]. Forinstance, only recently, two RNA reference materials havebeen defined to improve the standardization of gene ex-pression experiments [134]. Furthermore, working groupshave been founded to develop and share common stan-dards and guidelines for gene expression analysis in clini-cal trials and to cover standards for reference materials andquality control, SOPs as well as standard bioinformatic ap-proaches for data analysis and storage [135–138]. Severalguidelines for the performance of microarray experimentshave been proposed by the Microarray Gene ExpressionData (MGED) Society, including the Minimal Informa-tion About a Microarray Experiment (MIAME) descrip-tion and annotation [139] and the MAGE-ML mark-uplanguage [140]. For storage of the microarray data, severaldatabases have been established following the MIAMEguidelines [141,142].
To improve the reliability of microarray experimentsfrom the detection side, at present, there exist only veryfew standards. These are intensity standards designed e.g.for control of the performance of array scanners, channelcrosstalk, and effect of PMT voltage as well as for thecomparison of the performance of different instruments[143]. One of them offers some means for control of thespatial resolution [131]. This standard, however, that wasmeasured by us, see Fig. 12, suffers from photodegrada-tion, lack of reported absorption and emission spectra, anda comparatively small variation in fluorescence intensity,see for instance [131] and Fig. 12, which does not allowfor the determination of the linearity of the detection sys-tem(s). Moreover, some microarray reader manufacturerhave integrated a self-test using an internal light source,which runs at the start of the instruments and before every
scan (e.g. Fuji Photo Film Co.) to check PMT settingswhereas others (e.g. Axon Instruments Inc.) provide spe-cific calibration slides for an evaluation of the instrumentperformance.
To improve this situation, better-suited calibrationslides or calibration spots on every microarray are de-sired to help adjust the scanner settings and to deter-mine the instrument’s image/spatial resolution as wellas its day-to-day performance and long-term stability—ideally in combination with guidelines for their use. Fur-thermore, tested procedures in combination with recom-mended materials/systems are needed for the determina-tion of the range of linearity of the array scanners, theirdynamic range and sensitivity. The final goal is here toimprove the comparability of data generated by differentinstruments/laboratories and with different labels. Easy-to-use fluorescence standards that meet these require-ments should for instance either provide a stable outputat application-relevant wavelengths and photon fluxes orneed to be easily reproduced, should have minimum lo-cal and global non-uniformities in emission and shouldgenerate signals comparable to those observed for typicalsamples. With this respect, also the influence of spectraldeviations between the fluorescence spectra of the stan-dard and common labels needs to be examined. This ren-ders the availability of absorption and corrected emissionspectra of both the standard and the labels for application-relevant conditions, i.e. microenvironment(s), important.For testing of the instrument’s spatial resolution, whichshould be in the 5 µm range, uniformly patterned stan-dards are desired. Such standards must be applicable forthe majority of typically used microarray readers and la-bels, e.g. suited for typical excitation wavelengths andemission wavelength intervals as well as scanner formats.Moreover, they should have been tested with a broad va-riety of instruments in a Round Robin test. For the devel-opment of such purpose-fit fluorescence standards, inputnot only from instrument manufacturers but also fromthe community of users of the microarray technology isrequired. Additionally, future technological advances ofmicroarray readers should be considered that will mostlikely provide an enhanced spatial resolution, precision,and sensitivity as well as a higher dynamic range. Further-more, it needs to be decided on within the community ofusers of the microarray technology and instrument manu-facturers, whether stand-alone fluorescence standards likecalibration slides or the integration of fluorescence stan-dards into slides used for the performance of microarrayexperiments are to be favored. The former is for instancesufficient to characterize the day-to-day and long-terminstrument performance, whereas the latter approach—though more costly—may be tempting for an improved
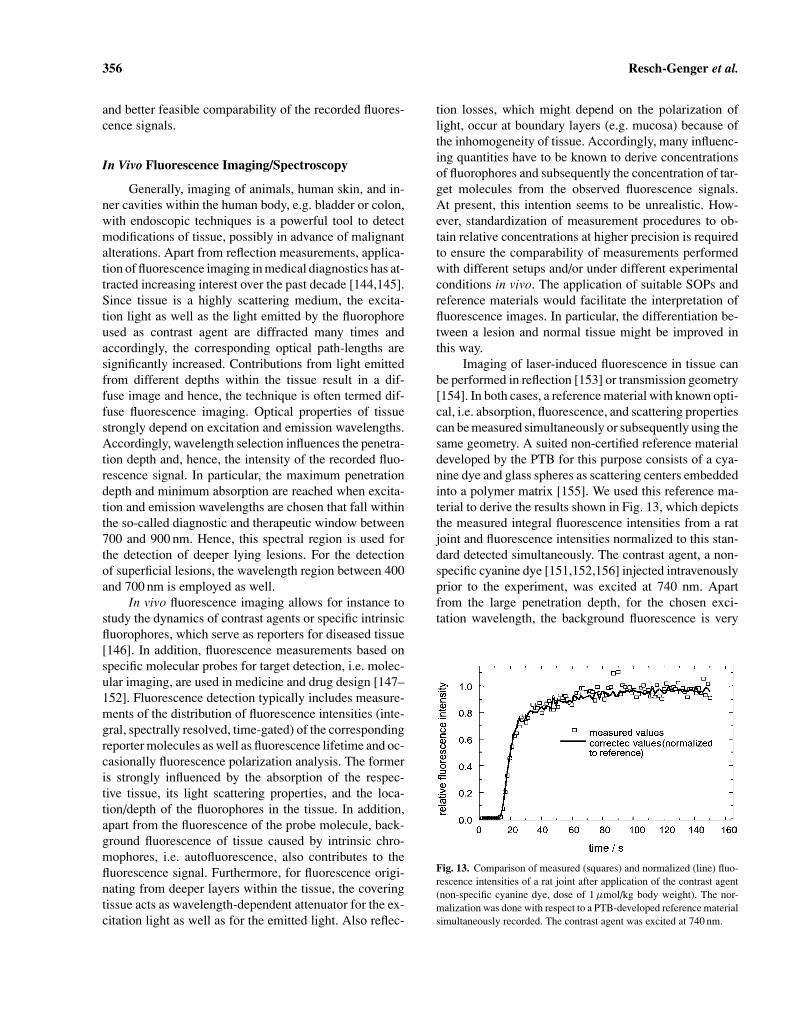
356 Resch-Genger et al.
and better feasible comparability of the recorded fluores-cence signals.
In Vivo Fluorescence Imaging/Spectroscopy
Generally, imaging of animals, human skin, and in-ner cavities within the human body, e.g. bladder or colon,with endoscopic techniques is a powerful tool to detectmodifications of tissue, possibly in advance of malignantalterations. Apart from reflection measurements, applica-tion of fluorescence imaging in medical diagnostics has at-tracted increasing interest over the past decade [144,145].Since tissue is a highly scattering medium, the excita-tion light as well as the light emitted by the fluorophoreused as contrast agent are diffracted many times andaccordingly, the corresponding optical path-lengths aresignificantly increased. Contributions from light emittedfrom different depths within the tissue result in a dif-fuse image and hence, the technique is often termed dif-fuse fluorescence imaging. Optical properties of tissuestrongly depend on excitation and emission wavelengths.Accordingly, wavelength selection influences the penetra-tion depth and, hence, the intensity of the recorded fluo-rescence signal. In particular, the maximum penetrationdepth and minimum absorption are reached when excita-tion and emission wavelengths are chosen that fall withinthe so-called diagnostic and therapeutic window between700 and 900 nm. Hence, this spectral region is used forthe detection of deeper lying lesions. For the detectionof superficial lesions, the wavelength region between 400and 700 nm is employed as well.
In vivo fluorescence imaging allows for instance tostudy the dynamics of contrast agents or specific intrinsicfluorophores, which serve as reporters for diseased tissue[146]. In addition, fluorescence measurements based onspecific molecular probes for target detection, i.e. molec-ular imaging, are used in medicine and drug design [147–152]. Fluorescence detection typically includes measure-ments of the distribution of fluorescence intensities (inte-gral, spectrally resolved, time-gated) of the correspondingreporter molecules as well as fluorescence lifetime and oc-casionally fluorescence polarization analysis. The formeris strongly influenced by the absorption of the respec-tive tissue, its light scattering properties, and the loca-tion/depth of the fluorophores in the tissue. In addition,apart from the fluorescence of the probe molecule, back-ground fluorescence of tissue caused by intrinsic chro-mophores, i.e. autofluorescence, also contributes to thefluorescence signal. Furthermore, for fluorescence origi-nating from deeper layers within the tissue, the coveringtissue acts as wavelength-dependent attenuator for the ex-citation light as well as for the emitted light. Also reflec-
tion losses, which might depend on the polarization oflight, occur at boundary layers (e.g. mucosa) because ofthe inhomogeneity of tissue. Accordingly, many influenc-ing quantities have to be known to derive concentrationsof fluorophores and subsequently the concentration of tar-get molecules from the observed fluorescence signals.At present, this intention seems to be unrealistic. How-ever, standardization of measurement procedures to ob-tain relative concentrations at higher precision is requiredto ensure the comparability of measurements performedwith different setups and/or under different experimentalconditions in vivo. The application of suitable SOPs andreference materials would facilitate the interpretation offluorescence images. In particular, the differentiation be-tween a lesion and normal tissue might be improved inthis way.
Imaging of laser-induced fluorescence in tissue canbe performed in reflection [153] or transmission geometry[154]. In both cases, a reference material with known opti-cal, i.e. absorption, fluorescence, and scattering propertiescan be measured simultaneously or subsequently using thesame geometry. A suited non-certified reference materialdeveloped by the PTB for this purpose consists of a cya-nine dye and glass spheres as scattering centers embeddedinto a polymer matrix [155]. We used this reference ma-terial to derive the results shown in Fig. 13, which depictsthe measured integral fluorescence intensities from a ratjoint and fluorescence intensities normalized to this stan-dard detected simultaneously. The contrast agent, a non-specific cyanine dye [151,152,156] injected intravenouslyprior to the experiment, was excited at 740 nm. Apartfrom the large penetration depth, for the chosen exci-tation wavelength, the background fluorescence is very
Fig. 13. Comparison of measured (squares) and normalized (line) fluo-rescence intensities of a rat joint after application of the contrast agent(non-specific cyanine dye, dose of 1 µmol/kg body weight). The nor-malization was done with respect to a PTB-developed reference materialsimultaneously recorded. The contrast agent was excited at 740 nm.

Quality Assurance in Fluorometry and Suited Fluorescence Standards 357
low compared to the fluorescence intensity of the contrastagent, see Fig. 13, observation times shorter than 15 s.The background fluorescence from the tissue is obtainedby imaging the animal before application of the contrastagent. As follows from Fig. 13, the integral fluorescenceintensity, plotted versus time after intravenous injection,strongly increases between 15 and 25 s and reaches a sat-uration value after about 90 s. Furthermore, the fluctu-ations in the bolus kinetic are considerably reduced onapplication of this normalization procedure as is evidentfrom the reduced signal variation. The remaining vari-ation of the fluorescence signal is associated with theheartbeat and respiration of the animal, respectively. Thisreferencing or normalization procedure allows to comparefluorescence intensities from different animals providedthe normalization is performed with the same referencematerial.
Fluorescence imaging and fluorescence spec-troscopy can be used to extend the potential of endoscopy-based techniques frequently used for clinical applications.As an example, in Fig. 14, an endoscopic image of thecolon mucosa of a patient with pancolitis is shown. Asidefrom the typical reflection image routinely observed, abright spot from the excitation light coupled through anoptical fiber and the fiber tip can be seen. To obtainlaser-induced fluorescence, aminolevulinic acid (ALA) issprayed into the colon shortly before endoscopy. ALA isa poorly fluorescing precursor of the fluorophore proto-
Fig. 14. Fluorescence-guided endoscopy of the colon of a patient withpancolitis. The laser light delivered by a fiber and the fiber tip can berecognized in the lower central part of the image. This investigationhas been performed at the 4th Medical Department, Charite, HumboldtUniversity, Berlin, Germany by Dr. G. Schachschal.
Fig. 15. Prompt and delayed fluorescence spectrum of a dysplasia inBarrett’s oesophagus. The background fluorescence is efficiently sup-pressed in the time delayed spectrum of PpIX. The arrows indicate thewavelengths and amplitudes used for normalization.
porphyrin IX (PpIX), the formation of which is enhancedin diseased tissue, e.g. in low- and high-grade dysplasia.To monitor regions with enhanced PpIX concentrationon-line together with the conventional endoscopic image,pulsed laser light for the excitation of the fluorophore anda monochromator coupled to an intensified photodiodearray for the detection of the emitted light are used. Forexcitation and observation of laser-induced fluorescencean optical fiber is inserted into the working channel ofan endoscope. This technique enables the measurementof spectrally resolved fluorescence data at a single point[157,158] and can be applied for fluorescence-guidedbiopsy. The fluorescence spectra from the blue spot inFig. 14 taken at two different delay times relative to theexciting laser pulse are illustrated in Fig. 15. As is evidentfrom a comparison of the prompt and delayed emissionspectra, application of this time-gated technique results inan effective suppression of tissue autofluorescence. Sincegeometrical factors remain unchanged, analysis of bothspectra can be exploited to eliminate geometrical effects,which otherwise hamper the interpretation and quantifica-tion of the measurement. To this end [158], we introducethe PpIX-specific quantity
I spn (λ, 20 ns) = In(599 nm, 20 ns)
{In(λ, 20 ns)
In(599 nm, 20 ns)
− In(λ, 0 ns)
In(599 nm, 0 ns)
}(1)
In Eq. (1), the prompt I(λ, 0 ns) and delayed I(λ,20 ns) fluorescence spectra, see Fig. 15 are normalized tothe maximum intensity I(635 nm, 0 ns) of the prompt flu-orescence spectrum. The resulting normalized quantitiesare indicated by the lower index n. The normalization to

358 Resch-Genger et al.
I(635 nm, 0 ns) is chosen with respect to the maximumemission of PpIX and the division by the spectral am-plitude at λ = 599 nm is performed because non-specificfluorescence and PpIX fluorescence spectra do not over-lap in this region. In this way, the contribution from non-specific autofluorescence can be subtracted, provided thatthe optical properties of diseased and normal tissue aresimilar. This assumption is generally justified for the de-tection of early stages of cancerous tissue. On the basis ofthis normalization procedure, a significant discriminationbetween diseased and non-diseased tissue is possible ashas been shown for example by Ortner et al. for dysplasiasin Barrett’s oesophagus [157].
For fluorescence imaging in vivo, for spectral cor-rection as well as for the determination of the linearity ofthe detection system, its dynamic range, and its sensitiv-ity, solutions of the corresponding contrast agents or otherspectrally suited dyes could be used. However, to improvethe comparability and reliability of in vivo applications offluorescence imaging, on our opinion, the use of referenceprocedures including mathematical analysis and properlychosen fluorescence standards seems to be the method ofchoice, as has been demonstrated exemplary for molec-ular imaging experiments with small animals and fluo-rescence endoscopy of human colon. Reference materialssuited for signal quantification must also mimic the scat-tering properties of the investigated tissue. To this end, forthe comparability of different in vivo applications, a setof well-characterized and preferably certified standardsof liquid or solid nature is desired that covers the spectralrange from 400 up to 900 nm.
CONCLUSION AND OUTLOOK
As has been illustrated for selected fluorescence tech-niques, there is still a considerable need to improve the re-liability and the comparability of fluorescence data as wellas the comparability of instrument characterization andperformance validation. The latter forms the basis for stan-dardization. To achieve this and to improve quality assur-ance in fluorometry, well-characterized instrument-typeand application-specific fluorescence standards for theUV/Vis/NIR spectral region are mandatory, that closelymatch the optical properties of measured samples. Inthis context, close resemblance stands for comparable ab-sorption and emission features, emission intensities andcharacteristics, scattering and measurement geometry. Inaddition to (certified) reference materials, internationallyaccepted SOPs for the characterization and validation ofcommon types of fluorescence instruments are needed aswell as guidelines for the performance of fluorescence
measurements that are relevant for a broad community ofusers of fluorescence techniques. The intention of the lat-ter should be also to reduce sample-related and handling-related uncertainties in fluorescence analysis. On our opin-ion, guidelines—preferably in combination with suitedmaterials or standards—are for instance required for thedetermination of the range of linearity, dynamic range, andsensitivity of fluorescence instruments as well as for theperformance of quantitative fluorescence measurementsand for the determination of fluorescence quantum yields.The availability of suited certified standards and guide-lines is of special importance for fluorescence measure-ments in medical diagnosis and clinical applications offluorometry, where standardization of instrument charac-terization and performance of measurements is eventuallyrequested.
Novel fluorescence standards for the establishmentof an improved quality assurance in fluorometry ona broad level should be not only designed and char-acterized for use under application-relevant conditions,easy-to-operate, and commercially available, but alsocharacterized with respect to all the application-relevantspectroscopic and analytical properties. Furthermore, the(wavelength-dependent) uncertainty of the calibration-relevant fluorometric quantity/quantities needs to be pro-vided including method of determination. To guaranteethe standard’s reliability, such reference materials shouldbe preferably certified. The rational design and testing ofsuch fluorescence standards with improved properties andthe development of the aforementioned guidelines, how-ever, requires a close contact between National Metrolog-ical Institutes (NMIs), standardization bodies, regulatoryagencies, scientific associations, manufacturers of instru-mentation, users of fluorescence techniques as well asmanufacturers of fluorescent labels, reagents and othermaterials for fluorescence analysis. Within this context,also the necessary level of traceability in fluorometry hasto be defined and recent developments in instrumenta-tion as well as in fluorescent dyes need to be taken intoaccount. Particular attention should be focused also onprocedures for the evaluation of software used for dataanalysis, at least for more advanced fluorescence methodslike time-resolved fluorometry, fluorescence imaging, andfluorescence-based microarray techniques.
ACKNOWLEDGMENTS
Financial support from the German Ministry of Eco-nomics and Labor (BMWA) is gratefully acknowledged(BMWA VI A2-17/03). We thank Mrs. A. Hoffmann andMrs. M. Spieles for technical assistance, Dr. D. Pfeifer for

Quality Assurance in Fluorometry and Suited Fluorescence Standards 359
stimulating discussions and Dr. J. Enderlein for carefullyreading the section on fluorescence microscopy.
REFERENCES
1. J. R. Lakowicz (Ed.) (1999). Principles of Fluorescence Spec-troscopy, 2nd edn., Kluwer Academic/Plenum Press, New York.
2. J. R. Lakowicz (Ed.) (1992–2004). Topics in Fluorescence Spec-troscopy Series, Vols. 1–8, Plenum Press, New York.
3. O. S. Wolfbeis (Series Ed.) (2001–2004). Springer Series on Flu-orescence, Methods and Applications, Vols. 1–3, Springer, Berlin.
4. S. G. Schulman (Ed.) (1985–1993). Molecular Luminescence Spec-troscopy Parts, Vols. 1–3, Wiley Interscience, New York.
5. W. T. Mason (1999). Fluorescent and Luminescent Probes for Bi-ological Activity, 2nd edn., Academic Press, San Diego.
6. A. J. Pope, U. M. Haupts, and K. J. Moore (1999). Homogenousfluorescence readouts for miniaturized high-throughput screening:Theory and practice. Drug Discov. Today 4(8), 350–362.
7. E. Zubritsky (1999). Microplate readers reach critical mass. Anal.Chem. News Features 71, 39A–43A.
8. C. T. Wittwer, K. M. Ririe, R. V. Andrew, D. A. David, R. A.Gundry, and U. J. Balis (1997). The light cycler: A microvolumemultisample fluorimeter with rapid temperature control. Biotech-niques 22, 176–181.
9. Supplement (1998). Fluoreszenzspektroskopie. Nachr. Chem. Tech.Lab. 46, S121–S132.
10. Analytical Methods Committee (1998). Evaluation of analytical in-strumentation. Part XI Instrumentation for molecular fluorescencespectrometry. Analyst 123, 1649–1656.
11. J. W. Eastman (1966). Standardization of fluorescence spectra andthe calibration of spectrofluorimeters. Appl. Optics 5(7), 1125–1132.
12. W. Galbraith, K. W. Ryan, N. Gliksman, D. L. Taylor, and A. S.Waggoner (1989). Multiple spectral parameter imaging in quanti-tative fluorescence microscopy. I: Quantitation of bead standards.Comput. Med. Imag. Graph. 13, 47–60.
13. A. K. Gaigalas, L. Li, O. Henderson, R. Vogt, J. Barr, G. Marti, J.Weaver, and A. Schwartz (2001). The development of fluorescenceintensity standards. J. Res. Natl. Inst. Stand. Technol. 106(2), 381–389.
14. C. A. Parker (1968). Photoluminescence of Solutions, Elsevier,Amsterdam.
15. J. N. Miller (1981). Standards in Fluorescence Spectrometry, Ul-traviolett Spectrometry Group, London.
16. D. F. Eaton (1988). Reference materials for fluorescence measure-ment. Pure Appl. Chem. 60, 1107–1114.
17. R. A. Velapoldi and M. S. Epstein (1989). In M. C. Goldberg(Ed.), Luminescence Applications in Biological, Chemical, Envi-ronmental and Hydrological Sciences, ACS Symposium Series,Vol. 383, American Chemical Society, Washington, DC, pp. 98–126.
18. W. D. Niles and F. S. Cohen (1995). Radiometric calibrationof a video fluorescence microscope for the quantitative imag-ing of resonance energy transfer. Rev. Sci. Instrum. 66, 3527–3536.
19. EN ISO/IEC 17025; GLP/GMP, GLP: Good laboratory praxis;GMP: Good manufacturing praxis.
20. Burgess and D. G. Jones (1995). Spectrophotometry, Luminescenceand Colour: Science and Compliance, Elsevier, Amsterdam.
21. O. D. D. Soares and J. L. C. Costa (1999). Spectrophotometersintercomparison for spectrocolorimetric scale harmonization. Rev.Sci. Instrum. 70(12), 4471–4481.
22. J. C. Travis, J. C. Zwinkels, F. Mercader, A. Ruiz, E. A. Early,M. V. Smith, M. Noel, M. Maley, G. W. Kramer, K. L. Eckerle,and D. L. Duewer (2002). An international evaluation of holmiumoxide solution reference materials for wavelength calibration in
molecular absorption spectrophotometry. Anal. Chem. 74, 3408–3415.
23. ASTM E 169-87 (reapproved 2003). Standard Practices for generalTechniques of Ultraviolet-Visible Quantitative Analysis, and hereinreferenced ASTM standards.
24. CIE-Publ. 15.2, Colorimetry, 2nd edn., 1986.25. K. D. Mielenz (1987). In C. Burgess and K. D. Mielenz (Eds.),
Advances in Standards and Methodology in Spectrophotometry,Elsevier, Amsterdam, pp. 49–62.
26. D. C. Rich and D. Martin (1999). Improved model for improvingthe inter-instrument agreement of spectrocolorimeters. Anal. Chim.Acta 380, 263–276.
27. K. Witt (2002/2003). Haben wir die UV/vis-Spektrometerie lumi-neszierender Materialien im Griff? Die Farbe 46(1/2), 31–51.
28. ASTM E 388-72 (reapproved 2003). Spectral bandwidth and wave-length accuracy of fluorescence spectrometers.
29. ASTM E 578-83 (reapproved 2003). Linearity of fluorescence mea-suring system.
30. ASTM E 579-84 (reapproved 2003). Limit of detection of fluores-cence of quinine sulfate.
31. A. Schwartz and E. Fernandez-Repollet (1993). Development ofclinical standards for flow cytometry. Ann. N. Y. Acad. Sci. 677,28–39.
32. A. Schwartz, M. Mendez, G. Santiago, L. Diaz, and E. Fernandez-Repollet (1997). Applications of common quantitative fluorescentstandards to multiple platforms: Comparison of commercial fluo-rescent calibration standards used in quantitative flow cytometry.Clin. Immunol. 17(1), 14–18.
33. A. Schwartz, G. E. Marti, J. W. Gratama, and E. Fernandez-Repollet(1998). Standardizing flow cytometry: A classification system offluorescence standards used for flow cytometry. Cytometry 33, 106–114.
34. J. W. Gratama, J. L. D’Hautcourt, F. Mandy, G. Rothe, D. Barnett,G. Janossy, S. Papa, G. Schmitz, and R. Lenkei (1998). Flow cy-tometric quantitation of immunofluorescence intensity: Problemsand perspectives. Cytometry 33, 166–178.
35. R. A. Velapoldi (1987). Liquid standards in fluorescence spectrom-etry. In C. Burgess and K. D. Mielenz (Eds.), Advances in Standardsand Methodology in Spectrophotometry, Elsevier, Amsterdam,pp. 175–193.
36. I. Billard, E. Ansoborlo, K. Afferson, S. Arpigny, M. E. Azenha,D. Brich, P. Bros, H. D. Burrows, G. Choppin, L. Couston,V. Dubois, T. Fanghanel, G. Geipel, S. Hubert, J. I. Kim, T.Kimura, R. Klenze, A. Kronenberg, M. Kumke, G. Lagarde, G.Llamarque, S. Lis, C. Madic, G. Meinrath, C. Moulin, R. Nagaishi,D. Parker, G. Plancque, F. Scherbaum, E. Simoni, S. Sinkov, andC. Viallesoubranne (2003). Appl. Spectrsc. 57(8), 1027–1038.
37. For clear definition of the metrological hierarchy of reference ma-terials, see International Vocabulary of Basics and General Termsin Metrology (1994), 2nd edn., Beuth Verlag GmbH.
38. R. A. Velapoldi and K. D. Mielenz (1980). A fluorescence standardreference material: Quinine sulfate dihydrate, NBS Spec. Publ. 260-264, PB 80132046, Springfield, VA.
39. A. Schwartz, L. Wang, E. Early, A. Gaigalas, Y.-Z. Zhang, G. E.Marti, and R. F. Vogt (2002). Quantitating fluorescence intensityfrom fluorophore: The definition of MESF assignment. J. Res. Natl.Inst. Stand. Technol. 107(1), 83–91.
40. U. Resch-Genger, D. Pfeifer, C. Monte, W. Pilz, A. Hoffmann, M.Spieles, J. Hollandt, R. D. Taubert, B. Schonenberger, P. Nording(in press), Traceability of fluorometry. Part II: Spectral fluorescencestandards. J. Fluoresc. 15(3), 325.
41. J. W. Verhoeven (1996). Molecular terms used in photochemistry(recommendations 1996). Pure Appl. Chem. 68(12), 2223–2286.
42. J. Hollandt, R. D. Taubert, J. Seidel, A. Gugg-Helminger, U. Resch-Genger, D. Pfeifer, C. Monte, and W. Pilz (in press), Traceabilityof fluorometry. Part I: Physical standards. J. Fluoresc. 15(3), 311.
43. E. D. Cehelnik, K. D. Mielenz, and R. A. Velapoldi (1975). Po-larization effects on fluorescence measurements. J. Res. Natl. Bur.Stand. A 79A(1), 1–15.
360 Resch-Genger et al.
44. U. Resch-Genger, K. Hoffmann, and A. Engel, manuscript inpreparation.
45. T. Erdogan, A. Pradhan, and V. Mizrahi (2003). Optical filtersimpact fluorescence fidelity. Biophotonics Int. 10(10), 38–43.
46. J.W. Hofstraat and M. J. Latuhihin (1994). Correction of fluores-cence spectra. Appl. Spectrosc. 48(4), 436–446.
47. J. A. Gardecki and M. Maroncelli (1998). Set of secondary emissionstandards for calibration of the spectral responsivity in emissionspectroscopy. Appl. Spectrosc. 52(9), 1179–1189.
48. R. J. Kovach and W. M. Peterson (1994). The measurement ofsensitivity in fluorescence spectroscopy. Am. Lab. 32G–32K.
49. R. B. Thompson, I. Gryczynski, and J. Malicka (2002). Fluores-cence polarization standards for high-throughput screening andimaging. Biotechniques 32(1), 34–41.
50. See for instance Molecular Probes, Starna GmbH, Matech Pre-cision Dynamics Coorp., Labsphere Inc., Fluka GmbH, Lamb-daChem GmbH, and SUMITA Optical Glass Inc. as well as NIST(RM 8640, SRM 936a, and 1932).
51. R. F. Chen (1972). Measurement of absolute values in biochemicalfluorescence spectroscopy. J. Res. Nat. Bur. Stand. A 76(6), 593–606.
52. R. B. Thompson, I. Gryczynski, and J. Malicka (2002). Fluores-cence polarization standards for high-throughput screening andimaging. Biotechniques 32(1), 34–41.
53. I. T. Lifshotz and M. L. Meilman (1989). Standard sample forcalibrating wavelength scales of spectral fluorimeters. Sov. J. Opt.Technol. 55(8), 487–489.
54. S. A. Wise, L. C. Sander, and W. E. May (1993). Determinationof polycyclic aromatic hydrocarbons by liquid chromatography.J. Chromatogr. 642, 329–349.
55. SRM 1647b, NIST.56. A. Schwartz, A. K. Gaigalas, L. Wang, G. E. Marti, R. F. Vogt, and
E. Fernandez-Repollet (2004). Formalization of the MESF unit offluorescence intensity. Cytometry 57B(1), 1–6.
57. RM 8640, NIST.58. P. Froehlich (1989). Under the sensitivity specification for a fluo-
rescence spectrophotometer. Int. Lab. 42–44.59. R. J. Kovach and W. M. Peterson (1994). The measurement of
mensitivity in fluorescence spectroscopy. Am. Lab. 32G–32K.60. ISO (1993). Guide to the expression of uncertainty in measurement.61. J. N. Demas (1982). In K. D. Mielenz (Ed.), Optical Radiation
Measurements, Vol. 3, Academic Press, New York, p. 195.62. W. Geffken (1962). The molar absorption of different ions in
glasses. Glastechn. Berichte 35, 27–35.63. M. Mizuguchi, H. Hosono, and H. Kawazone (1999). Time-
resolved photoluminescence for diagnostic of photoluminescenceto ArF excimer laser damage to CaF2 single crystals. J. Opt. Soc.Am. 7(16), 1153–1159.
64. P. de Rose (2003). Bioanalytical and biomedical applications offluorescence techniques: Instrument characterization and valida-tion, traceability, and need for reference materials, in FluorescenceWorkshop, BERM-9, Berlin.
65. D. Ehrt, P. Ebeling, U. Natura, U. Kohlberg, K. Naumann, and S.Ritter (2001). Redox equilibria and ultraviolet radiation induceddefects in glasses. Int. Cong. Glass 1, 84–96.
66. J. W. Chan, T. Huster, J. S. Hayden, S. H. Risbud, and D. M. Krol(2002). J. Am. Ceram. Soc. 85(5), 1037–1040.
67. A. Engel, K. Knapp, B. Speit, G. Wehrhan, and E. Morsen (2001).High quality CaF2 used for 157 nm micro lithography. Fab. Tech.14, 177–184.
68. C. Muhlig, W. Triebel, G. Topfer, and A. Jordanov (2003). CaF2for ArF lithography—Characterisation by in-situ and LIF mea-surements, CHOCLAB II final report—Optics Characterization,pp. 257–267.
69. A. Engel, W. Triebel, C. Muhlig, J. Alkemper, A. Kramer, J.Kandler, K. Knapp, and E. Morsen (2000). Visualization of laserdamage in 157 nm material CaF2 and BaF2, 1st 157 nm Symposium,Dana Point CA, pp. 391–398.
70. A. Engel, R. Haspel, and V. Rupertus (2003). Advanced indus-trial fluorescence metrology used for qualification of high-qualityoptical materials. SPIE Proc. 5118-5120, 182–189.
71. R. A. Velapoldi (1971). Fluorescence. Nat. Bur. Stand. Tech. Note584, 53–83.
72. H. Pick (1972). Structure of trapped electron and trapped holecenters in alkali halides. In J. Abeles (Ed.), Optical Properties ofSolids, North Holland, pp. 653–668.
73. D. W. Pack, W. J. Manthey, and D. S. Mc Clure (1989). Productionof color centers with ionizing irradiation in alkali halides. Phys.Rev. B 40(14), 9930–9935.
74. M. Letz, A. Engel, L. Parthier, U. Natura, and K. Knapp(2004). CaF2 for DUV lens fabrication: Basic material propertiesand dynamic light-matter interaction. SPIE Proc. 5377, OpticalMicrolithography XVII, 1797–1804.
75. Japanese Optical Glass Industrial Standards, JOGIS, 03-1975.76. W. Gellermann (1989). J. Chem. Solids 52, 249–254.77. W. Goehde, U. Cassens, L. G. Lehman, Y. Traore, W. Goehde
jun., P. Berkes, C. Westerberg, and B. Greve (2003). Individualpatient-dependent influence of erythrocyte lysing procedures onflow-cytometric analysis of leukocyte subpopulations. TransfusionMed. Hemother. 30, 165–170.
78. J.-C. Strohmeyer, C. Blume, C. Meisel, W.-D. Doecke, M. Hummel,C. Hoeflich, K. Thiele, A. Unbehaun, R. Hetzer, and H.-D. Volk(2003). Standardized immune monitoring for the prediction oninfections after cardiopulmonary bypass surgery in risk patients.Cytometry 53B, 54–62.
79. G. Monneret, N. Elmenkouri, J. Bohe, A. L. Debard, A. C.Gutowski, J. Bienvenu, and A. Lepape (2002). Analytical require-ments for measuring monocytic human lymphocyte antigen DRby flow cytometry: Application to the monitoring of patients withseptic shock. Clin. Chem. 48, 1589–1592.
80. S. B. Iyer, M. J. E. Bishop, B. Abrams, V. C. Maino, A. J.Ward, T. P. Christion, and K. A. Davis, QuantiBRITETM: A newstandard for fluorescence quantification, www.bdbiosciences.com/immunocytometry systems (see download literature, White Papers,QuantiBRITETM White Paper).
81. Y. Gerena-Lopez, J. Nolan, L. Wang, A. Gaigalas, A. Schwartz, andE. Fernandez-Repollet (2004). Quantification of EGFP expressionon Molt-4 T cells using calibration standards. Cytometry 60A, 21–28.
82. J. B. Pawley (Ed.) (1995). Handbook of Biological Confocal Mi-croscopy, 2nd edn., Kluwer Academic Publishers, New York.
83. S. Inoue (Ed.) (1986). Video Microscopy, Plenum Publishers, NewYork.
84. D. B. Murphy (Ed.) (2001). Fundamentals of Light Microscopyand Electronic Imaging, Wiley-Liss, New York.
85. X. F. Wang, A. Periasamy, B. Herman, and D. M. Coleman(1992). Fluorescence lifetime imaging microscopy (FLIM): Instru-mentation and applications. Crit. Rev. Anal. Chem. 23(5), 369–395.
86. Special issue on the use of ion-sensitive fluorophores for mak-ing accurate intracellular ion measurements at high spatial and/ortemporal resolution (1990). Cell Calcium, February/March.
87. M. Andreeff and D. Pinkel (Ed.) (1999). Introduction to Fluores-cence in Situ Hybridization: Principals and Clinical Applications,Wiley-Liss, New York.
88. V. E. Centonze, A. Takahashi, E. Casanova, and B. Herman (2000).Quantitative fluorescence microscopy. J. Histotechnol. 23(3), 229–234.
89. W. D. Niles and F. C. Cohen (1995). Radiometric calibration ofa video fluorescence microscope for quantitative imaging of reso-nance energy transfer. Rev. Sci. Instrum. 66(6), 3527–3536.
90. R. Nitschke (2004). Standardization and quantification in mi-croscopy, Workshop AK PhotonicNet, Wetzlar.
91. The point-spread function is determined by the product of theexcitation intensity distribution and the light collection efficiencyfunction.

Quality Assurance in Fluorometry and Suited Fluorescence Standards 361
92. J. S. Ploem (1970). Standards for fluorescence microscopy, in E. J.Holborow (Ed.), Standard for Immunofluorescence Symposium,Blackwell Scientific Publications, Oxford, pp. 137–153.
93. W. Galbraith, K. W. Ryan, N. Gliksman, D. Lansing Taylor, andA. S. Waggoner (1989). Multiple spectral parameter imaging inquantitative fluorescence microscopy. I: Quantitation of bead stan-dards. Comp. Med. Imag. Graphics 13(1), 47–60.
94. J. M. Lerner and R. M. Zucker (2004). Calibration and validationof confocal spectral imaging systems. Cytometry 62A, 8–34.
95. M. Sernetz and A. Thaer (1970). A capillary fluorescence standardfor microfluorometry. J. Microscopy 91(1), 43–52.
96. F. W. D. Rost (1991). Quantitative Fluorescence Microscopy,Cambridge University Press, Cambridge, p. 236.
97. D. S. Kaplan and G. L. Picciolo (1989). Characterization of in-strumentation and calibrators for quantitative microfluorometry forimmunofluorescence tests. J. Clin. Microbiol. 27, 442–447.
98. A. P. M. Jongsma, W. Hijmans, and J. S. Ploem (1971). Quantitativeimmunofluorescence. Histochemie 25, 329–343.
99. R. A. Velapoldi, J. C. Travis, W. A. Cassatt, and W. T. Yap (1975).Inorganic ion-doped glass fibres as microspectrofluorimetric stan-dards. J. Microsc. 103(3), 293–303.
100. R. P. Haugland (Ed.) (2002). Handbook of Fluorescent Probes andResearch Products, 9th edn., Molecular Probes, Section 24.1.
101. J. J. Haaijman and J. P. R. van Dalen (1974). Quantification inimmunofluorescence microscopy: A new standard for fluoresceinand rhodamine emission measurement. J. Immunol. Methods 5,359–374.
102. S. J. Lockett, K. Jacobson, and B. Herman (1992). Quantitativeprecision of an automated fluorescence-based image cytometer.Anal. Quant. Cytol. Histol. 14, 187–202.
103. M. A. Model and J. K. Burkhardt (2001). A standard for calibrationand shading correction of a fluorescence microscope. Cytometry 44,309–316.
104. J. E. Sisken (1989). Fluorescent standards. Methods Cell Biol. 30,113–126.
105. S. G. Turney, S. M. Culican, and J. W. Lichtman (1996). A quan-titative fluorescence-imaging technique for studying acetylcholinereceptor turnover at neuromuscular junctions in living animals.J. Neurosci. Methods 64, 199–208.
106. P. W. Stevens and D. M. Kelso (2003). Imaging and analysis ofimmobilized particle arrays. Anal. Chem. 75, 1147–1154.
107. A. C. Jones, M. Millington, J. Muhl, J. M. De Freitas, J. S. Barton,and G. Gregory (2001). Calibration of an optical fluorescencemethod for film thickness measurement. Meas. Sci. Technol. 12,N23–N27.
108. Evident Technologies, Product Catalogue, February 2004.109. A. P. Alivisatos (1996). Semiconductor clusters, nanocrystals, and
quantum dots. Science 271, 934–937.110. A. Knight, J. Gaunt, T. Davidson, V. Chechik, and S. Windsor
(2004). Evaluation of the suitability of quantum dots as fluores-cence standards. NPL report DQL-AS 007.
111. W. G. J. H. M. van Sark, P. L. T. M. Frederix, D. J. van denHeuvel, H. C. Gerritsen, A. A. Bol, J. N. J. van Lingen, C. de MelloDonega, and A. Meijerink (2001). Photoxidation and photobleach-ing of single CdSe/ZnS quantum dots probed by room-temperaturetime resolved spectroscopy. J. Phys. Chem. B 105(10), 8281–8284.
112. I. T. Young (1983). The use of digital image processing techniquesfor the calibration of quantitative microscopes. Proc. SPIE 387,326–335.
113. APE GmbH, Berlin; www.ape-berlin.de.114. M. C. Pirrung (2002). How to make a DNA chip. Angew. Chem.
Int. Ed. 41(8), 1276–1289.115. J. R. Epstein, I. Biran, and D. R. Walt (2002). Fluorescence-based
nucleic acid detection and microarrays. Anal. Chim. Acta 469, 3–36.
116. B. Lemieux, A. Asharoni, and M. Schena (1998). Overview ofDNA chip technology. Mol. Breed. 4, 277–289.
117. P. Hedge, R. Qi, K. Abernathy, C. Gay, S. Dharap, R. Gaspard,J. E. Hughes, E. Snesrud, N. Lee, and J. Quackenbush (2000). Aconcise guide to cDNA microarray analysis. Biotechniques 29(3),548–562.
118. C. B. V. Christensen (2002). Arrays in biological and chemicalanalysis. Talanta 56, 289–299.
119. Biochips (Market survey) (2003). New Drugs 26–29.120. M. Schena, D. Shalon, R. W. Davis, and P. O. Brown (1995).
Quantitative monitoring of gene expression patterns with a com-plementary DNA microarray. Science 270(5235), 467–470.
121. M. B. Eisen, P. T. Spellman, P. O. Brown, and D. Botstein (1998).Cluster analysis and display of genome-wide expression patterns.Proc. Natl. Acad. Sci. U.S.A. 95(25), 14863–14868.
122. S. Granjeaud, F. Bertucci, and B. R. Jordan (1999). Expressionprofiling: DNA arrays in many guises. Bioassays 21(9), 781–790.
123. M. B. Eisen and P. O. Brown (1999). DNA arrays for analysis ofgene expression. Meth. Enzymol. 303, 179–205.
124. A. Butte (2002). The use and analysis of microarray data. Nat. Rev.Drug Discov. 1, 951–960
125. M. Taniguchi, K. Miura, H. Iwao, and S. Yamanaka (2001). Quan-titative assessment of DNA microarrays—Comparison with North-ern Blot analyses. Genomics 71, 34–39.
126. M. Bartosiewicz, M. Trounstine, D. Barker, R. Jonston, and A.Buckpitt (2000). Development of a toxicological gene array andquantitative assessment of this technology. Arch. Biochem. Biophys.376(1), 66–73.
127. E. A. Winzeler, M. Schena, and R. W. Davis (1999). Fluorescence-based expression monitoring using microarrays. Meth. Enzymol.306, 3–18.
128. Z. Guo, R. A. Guilfoyle, A. J. Thiel, R. Wang, and L. M. Smith(1994). Direct fluorescence analysis of genetic polymorphism byhybridization with oligonucleotide arrays an glass supports. Nu-cleic Acids Res. 22(24), 5456–5465.
129. J. B. Randolph and A. S. Waggoner (1997). Stability, specifityand fluorescence brightness of multiply-labeled fluorescent DNAprobes. Nucleic Acids Res. 25(14), 2923–2929.
130. F. Perraut, A. Lagrange, P. Pouteau, O. Peyssonneaux, P. Puget, G.McGall, L. Menou, R. Gonzalez, P. Labeye, and F. Ginot (2002). Anew generation of scanners for DNA chips. Biosens. Bioelectron.17, 803–813.
131. K. Adelheim, E. Emantraut, T. Kaiser, and J. Tuchscheerer (2002).Smart chip for array experiment standardization. New Drugs 22–23.
132. A. M. Dudley, J. Aach, M. A. Steffen, and G. M. Church (2002).Measuring absolute expression with microarrays with a calibratedreference sample and an extended signal intensity range. Proc. Natl.Acad. Sci. U.S.A. 99(11), 7554–7559.
133. M. R. Weil, T. Macatee, and H. R. Garner (2002). Toward a uni-versal standard: Comparing two methods for standardizing spottedmicroarray data. Biotechniques 32(6), 1310–1314.
134. M. Cronin, K. Ghosh, F. Sistare, J. Quackenbush, V. Vilker, and C.O’Connell (2004). Universal RNA Reference Materials for GeneExpression. Clin. Chem. [meeting review].
135. Y. F. Leung and D. Cavalieri (2003). Fundamentals of cDNA mi-croarray data analysis. Trends Genet. 19(11), 649–659.
136. T. Forster, D. Roy, and P. Ghazal (2003). Experiments using mi-croarray technology: Limitations and standard operating proce-dures. J. Endocrinol. 178(2), 195–204.
137. Tumor Analysis Best Practices Working Group (2004). Expressionprofiling—Best practices for data generation and interpretation inclinical trials. Nat. Rev. Genet. 5(3), 229–237.
138. A. T. Weeraratna, J. E. Nagel, V. d. V. Mello-Coelho, and D. D. Taub(2004). Gene expression profiling: from microarrays to medicine.J. Clin. Immunol. 24(3), 213–224.
139. A. Brazma, P. Hingamp, J. Quackenbush, G. Sherlock, P. Spellman,C. Stoeckert, J. Aach, W. Ansorge, C. A. Ball, H. C. Causton, T.Gaasterland, P. Glenisson, F. C. Holstege, I. F. Kim, V. Markowitz,J. C. Matese, H. Parkinson, A. Robinson, U. Sarkans, S. Schulze-

362 Resch-Genger et al.
Kremer, J. Stewart, R. Taylor, and J. Vilo (2001). Vingron M.Minimum information about a microarray experiment (MIAME)-toward standards for microarray data. Nat. Genet. 29(4), 365–371.
140. P. T. Spellman, M. Miller, J. Stewart, C. Troup, U. Sarkans,S. Chervitz, D. Bernhart, G. Sherlock, C. Ball, M. Lepage,M. Swiatek, W. L. Marks, J. Goncalves, S. Markel, D. Iordan,M. Shojatalab, A. Pizarro, J. White, R. Hubley, E. Deutsch, M.Senger, B. J. Aronow, A. Robinson, D. Bassett, C. J. Jr. Stoeckert,and A. Brazma (2002). Design and implementation of microar-ray gene expression markup language (MAGE-ML). Genome Biol.3(9), RESEARCH0046.
141. A. Brazma, H. Parkinson, U. Sarkans, M. Shojatalab, J. Vilo, N.Abeygunawardena, E. Holloway, M. Kapushesky, P. Kemmeren,G. G. Lara, A. Oezcimen, P. Rocca-Serra, and S. A. Sansone (2003).ArrayExpress—A public repository for microarray gene expressiondata at the EBI. Nucleic Acids Res. 31(1), 68–71.
142. J. Gollub, C. A. Ball, G. Binkley, J. Demeter, D. B. Finkelstein,J. M. Hebert, T. Hernandez-Boussard, H. Jin, M. Kaloper, J. C.Matese, M. Schroeder, P. O. Brown, D. Botstein, and G. Sherlock(2003). The Stanford Microarray Database: Data access and qualityassessment tools. Nucleic Acids Res. 31(1), 94–96.
143. See for example, Clondiag Chip Technologies GmbH; Full MoonBiosystems Inc.
144. G. A. Wagnieres, W. M. Star, and B. C. Wilson (1998). In vivo flu-orescence spectroscopy and imaging for oncological applications.Photochem. Photobiol. 68, 603–632.
145. R. Richards-Kortum and E. M. Sevick-Muraca (1996). Quantitativeoptical spectroscopy for tissue diagnosis. Annu. Rev. Phys. Chem.47, 555–606.
146. D. J. Cruccia, F. Bevilacqua, A. J. Durkin, S. Merritt, B. J.Tromberg, G. Gulsen, H. Yu, J. Wang, and O. Nalcioglu (2003). Invivo quantification of optical contrast agent dynamics in rat tumorsby use of diffuse optical spectroscopy with magnetic resonanceimaging coregistration. Appl. Opt. 42, 2940–2950.
147. D. Y. Paithankar, A. U. Chen, B. W. Pogue, M. S. Patterson, andE. M. Sevick-Muraca (1997). Imaging of fluorescent yield and life-time from multiply scattered light reemitted from random media.Appl. Opt. 36, 2260–2272.
148. R. Weissleder and U. Mahmood (2001). Mol. Imag. Radiol. 219,316–333.
149. V. Ntziachristos, J. Ripoll, and R. Weissleder (2002). Would near-infrared fluorescence signals propagate through large human organsfor clinical studies? Opt. Lett. 27, 333–335.
150. R. Weissleder and V. Ntziachristos (2003). Shedding light onto livemolecular targets. Nat. Med. 9, 123–128.
151. M. Rudin and R. Weissleder (2003). Molecular imaging in drugdiscovery and development. Nat. Rev. Drug Discov. 2, 123–131.
152. V. Ntziachhristos, C. Bremer, and R. Weissleder (2003). Fluores-cence imaging with near-infrared light: New technological ad-vances that enable in vivo molecular imaging. Eur. Radiol. 13,195–208.
153. A. Becker, C. Hessenius, K. Licha, B. Ebert, U. Sukowski, W.Semmler, B. Wiedenmann, and C. Grotzinger (2001). Receptor-targeted optical imaging of tumors with near-infrared fluorescentligands. Nat. Biotechnol. 19, 327–331.
154. E. E. Graves, J. P. Culver, J. Ripoll, R. Weissleder, and V.Ntziachristos (2004). Singular-value analysis and optimization ofexperimental parameters in fluorescence molecular tomography.J. Opt. Soc. Am. A Opt. Image Sci. Vis. 21, 231–241.
155. U. Sukowski, F. Schubert, D. Grosenick, and H. Rinneberg (1996).Preparation of solid phantoms with defined scattering and absorp-tion properties for optical tomography. Phys. Med. Biol. 41, 1823–1844.
156. K. Licha (2002). Contrast agents for optical imaging. Topics Curr.Chem. 222, 22–29.
157. M.-A. E. J. Ortner, B. Ebert, E. Hein, K. Zumbusch, D. Nolte,U. Sukowski, J. Weber-Eibel, B. Fleige, M. Dietel, M. Stolte,G. Oberhuber, R. Porschen, B. Klump, H. Hortnagel, H. Lochs,and H. Rinneberg (2003). Time gated fluorescence spectroscopy inBarrett’s oesophagus. Gut 52, 28–33.
158. K. T. Moesta, B. Ebert, T. Handke, D. Nolte, C. Nowak, W. E.Haensch, R. K. Pandey, T. J. Dougherty, H. Rinneberg, andP. M. Schlag (2001). Protoporphyrin IX occurs naturally incolorectal cancers and their metastases. Cancer Res. 61, 991–999.