how to become data driven for startups - keboola
TRANSCRIPT
StartUPsHow to become data driven
London October 2015
@Pabu01@Keboola
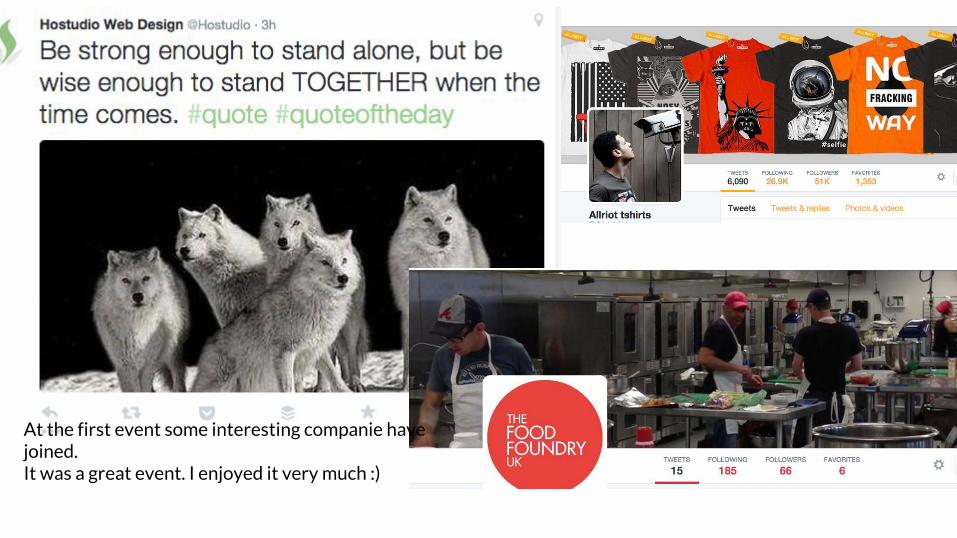
At the first event some interesting companie have joined. It was a great event. I enjoyed it very much :)
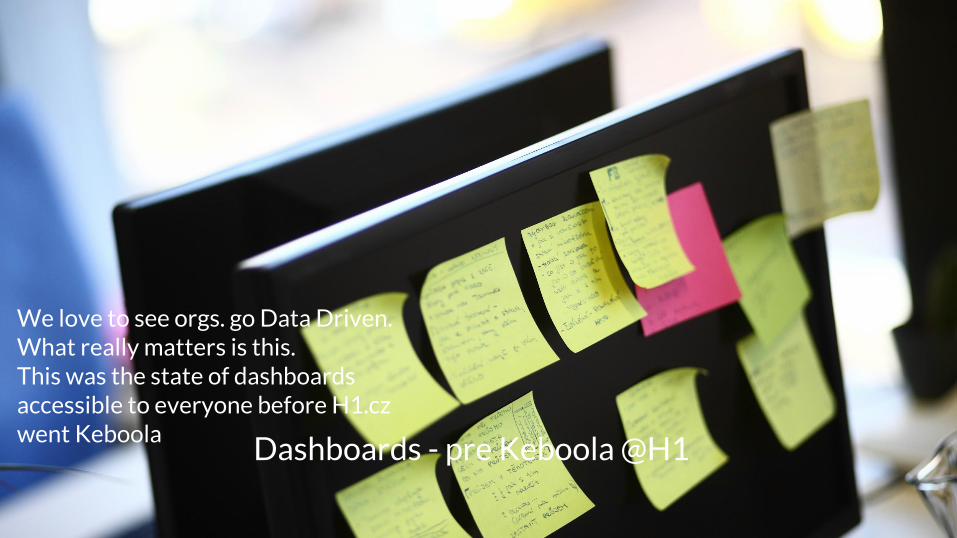
Dashboards - pre Keboola @H1
We love to see orgs. go Data Driven.What really matters is this.This was the state of dashboards accessible to everyone before H1.cz went Keboola
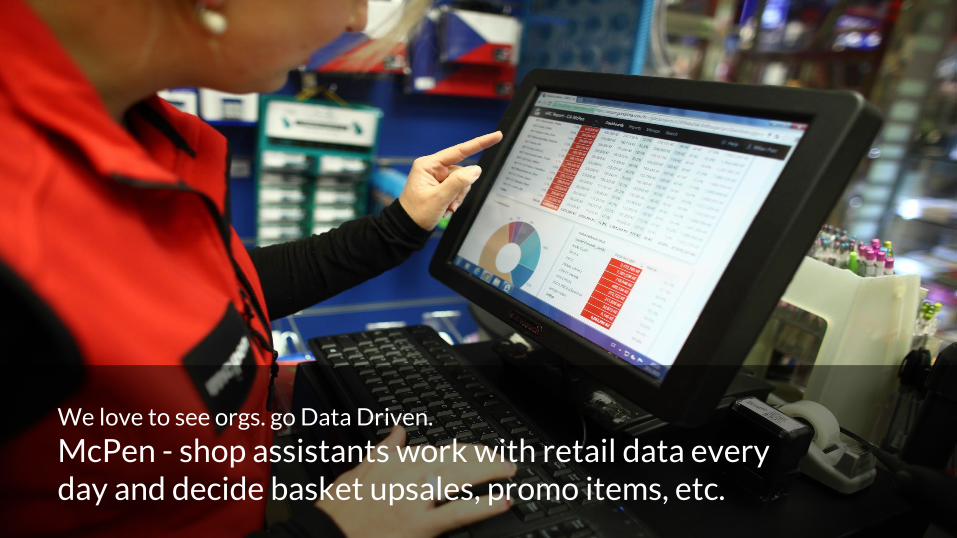
We love to see orgs. go Data Driven.
McPen - shop assistants work with retail data every day and decide basket upsales, promo items, etc.
The best example is this 55yr old lady. She has a basic education, runs a stationery goods shop at Prague Main train station and every day spends 15 minutes analyzing her data. Comparing it y/y, doing basket analyzes, promo goods, etc.Thanks to the “total” data integration and democratization (not only top management, but line workers have access to their data) and actively USE it EVERY DAY!!!Thanks to this McPen - the parent company - was able to grow 100% y/y which totally outpaced whole competition in the region.
She is a data business analyst !
Companies transformations through data - that’s what we love to see ! What drives us! “In data we trust”
McPen - if they can be Data Driven, you can be too!!!
Some history
Atlas - Czech, Slovak, Ukraine - largest portal network in CEE
Ataxo - 15.000 clients / 4 countries
*Ataxo Social Insider - acquired by SocialBakers - Twttr history, FB, etc. listening
*Trixam - purchased by Allegro
joined Keboola to work on $ to data @pabu01 #keboola
0. think data
@pabu01 #keboola
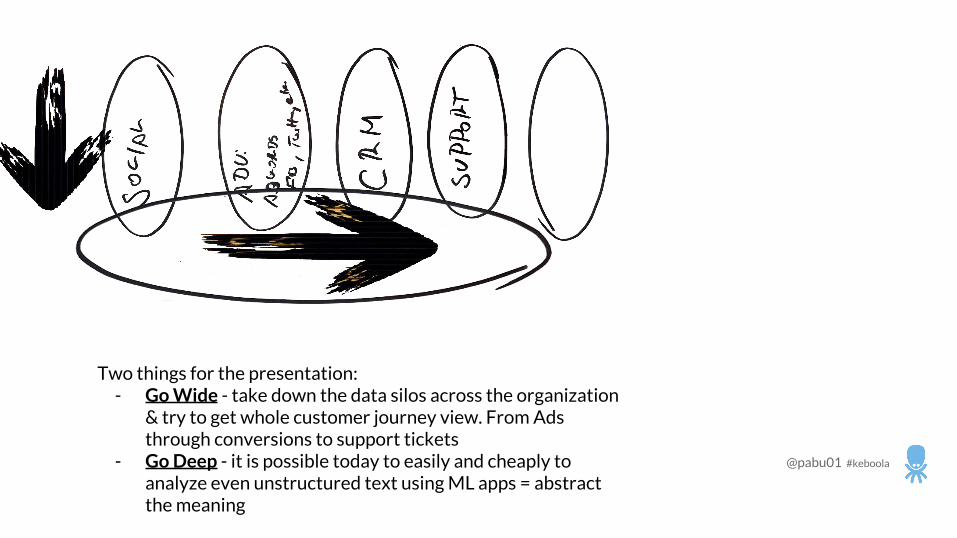
Two things for the presentation:- Go Wide - take down the data silos across the organization
& try to get whole customer journey view. From Ads through conversions to support tickets
- Go Deep - it is possible today to easily and cheaply to analyze even unstructured text using ML apps = abstract the meaning
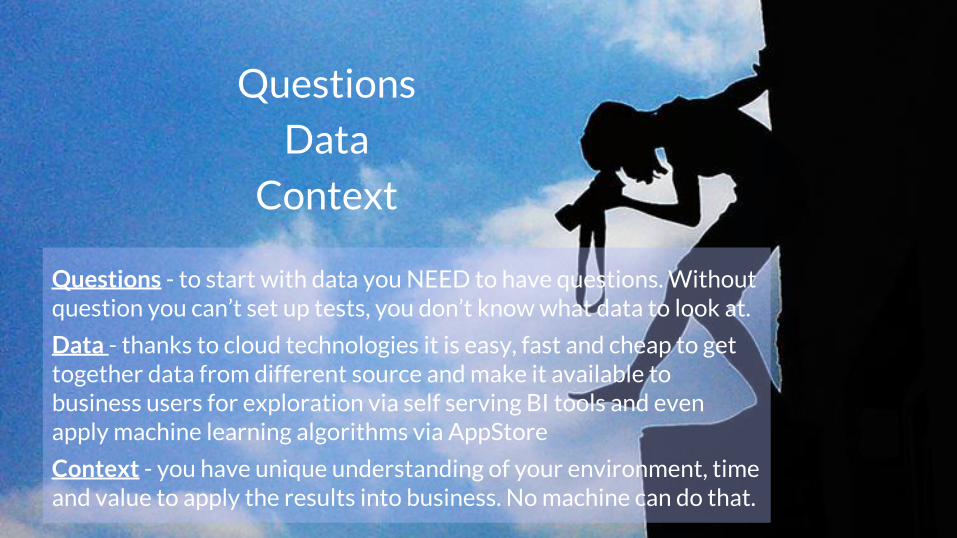
Questions
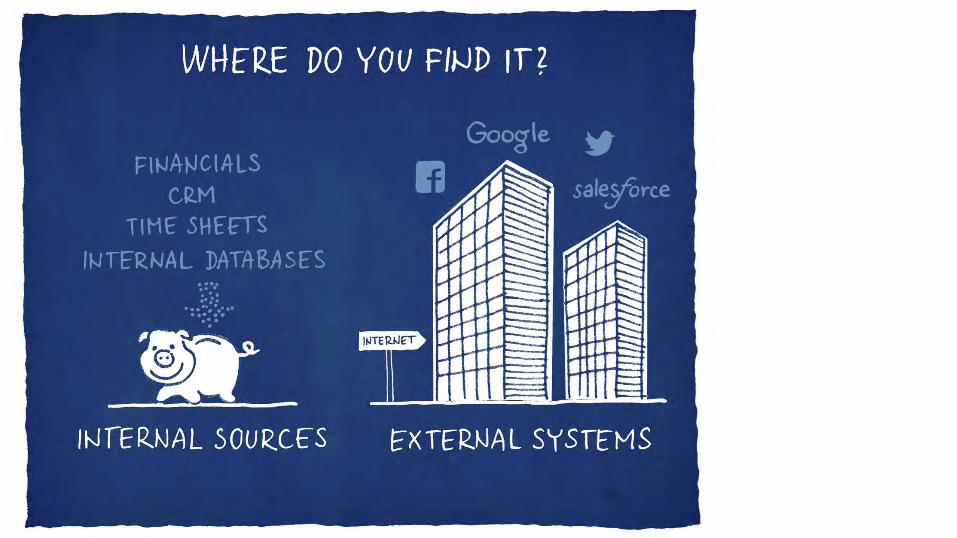
Data
Context
Questions - to start with data you NEED to have questions. Without question you can’t set up tests, you don’t know what data to look at.
Data - thanks to cloud technologies it is easy, fast and cheap to get together data from different source and make it available to business users for exploration via self serving BI tools and even apply machine learning algorithms via AppStore
Context - you have unique understanding of your environment, time and value to apply the results into business. No machine can do that.
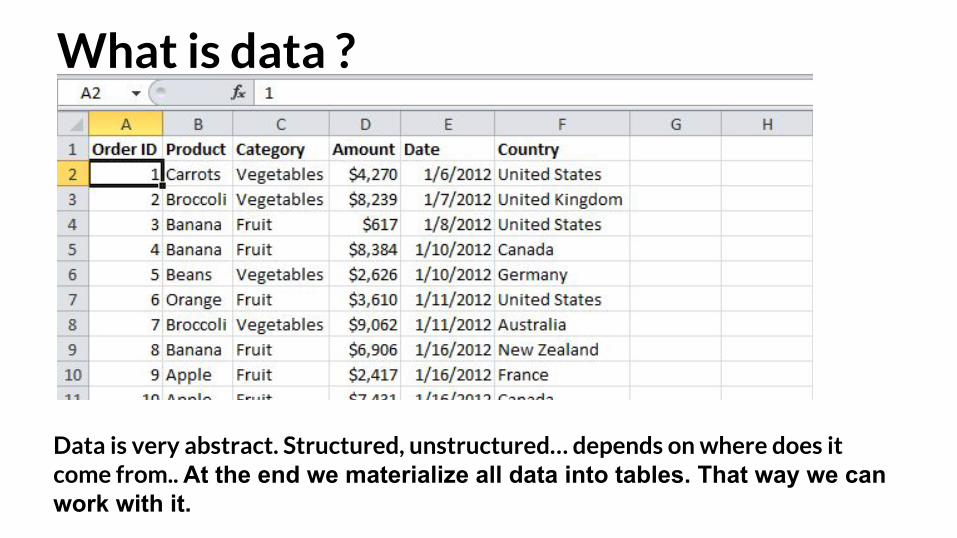
What is data ?
Data is very abstract. Structured, unstructured… depends on where does it come from.. At the end we materialize all data into tables. That way we can work with it.

1. ?
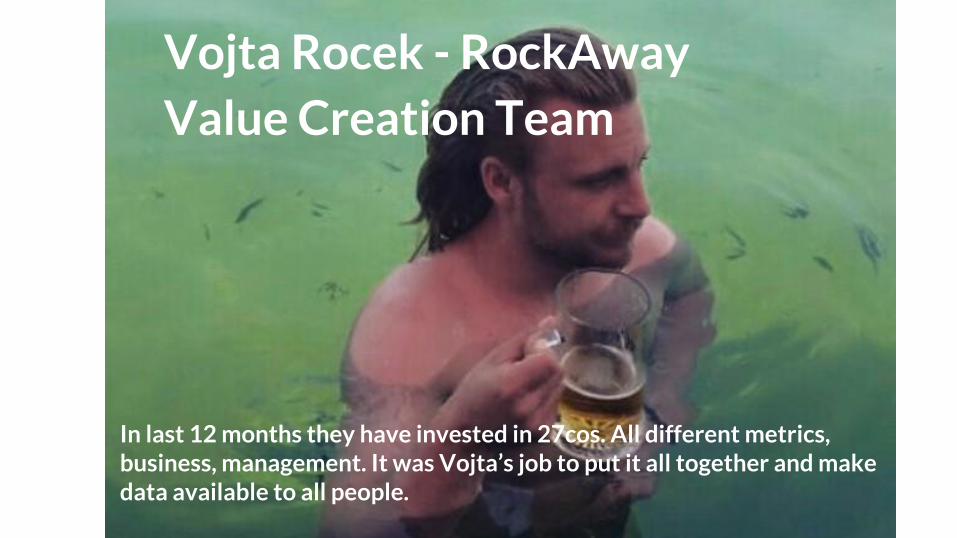
Vojta Rocek - RockAwayValue Creation Team
In last 12 months they have invested in 27cos. All different metrics, business, management. It was Vojta’s job to put it all together and make data available to all people.
Rocek’s Zen
Founders are afraid to measure. They are afraid to put number to their intuition. But if you don’t quantify, how will you know what was the success based on ?
Startups have big problem. They don’t have processes.
If you want to get beyond Google Analytics and want self serve BI you need process otherwise you have nothing to measure.
They don’t have processes ‘cause they don’t have defined vision of what they are. They can’t have it, because they pivot all the time in order to find product/market fit .
But you don’t know who you are, what do you want to measure?
Rocek’s ZenBut...you should already have values...from values you will get the vision. And I don’t mean to make shit loads of money, but to have happy customers.
Have customers- can be measured
Happiness - can be measured
If I would be making shoes, I would love to measure how many miles people walk in them every day...
@pabu01 #keboola
WHY?
StartUps => Product/Market fit => StartUps Pivot all the time!!!
StartUps to find product market fit. The lean is great for that. And for that, you need to measure.
@pabu01 #keboola

2.no bs
Waste - vanity metricsFB likes, etc.PV/UVetc.Always ask how does the metric help you to achieve your goals? $, engagement, etc.
Check out:http://a16z.com/2015/08/21/16-metrics/
Worth
Engagement!Happiness$ = effectiveness (not efficiency at first)In the beginning you want to know WHAT to do and only then make it much better.
OKM - Concept of One Key Metric tells you to choose 1 metric that you can bet your
company on and follow this one!
!!!
Paired metricsYou should always choose two metrics to observe at the same time. One can go up (like PV) and you need to know the other to know the quality (conversions).http://mattyford.com/blog/2014/6/11/paired-metrics
Cobra effectWatch what you look for!https://en.wikipedia.org/wiki/Cobra_effect
FIX the product!!!???
You need data (traffic) to improve conversions….Sometimes we see people to make a big mistake to trying to over optimize conversions, but they don’t have traffic for that. So it is statistically not significant.
Move in badges…..Follow lean methodology. Set up test. Bring traffic to it, evaluate, learn and apply.
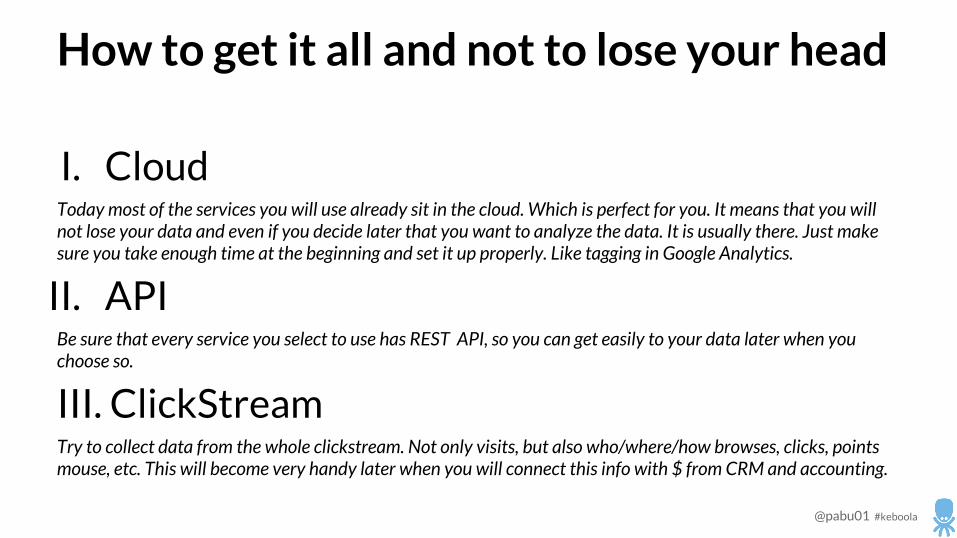
How to get it all and not to lose your head
I. CloudToday most of the services you will use already sit in the cloud. Which is perfect for you. It means that you will not lose your data and even if you decide later that you want to analyze the data. It is usually there. Just make sure you take enough time at the beginning and set it up properly. Like tagging in Google Analytics.
II. APIBe sure that every service you select to use has REST API, so you can get easily to your data later when you choose so.
III. ClickStreamTry to collect data from the whole clickstream. Not only visits, but also who/where/how browses, clicks, points mouse, etc. This will become very handy later when you will connect this info with $ from CRM and accounting.
@pabu01 #keboola
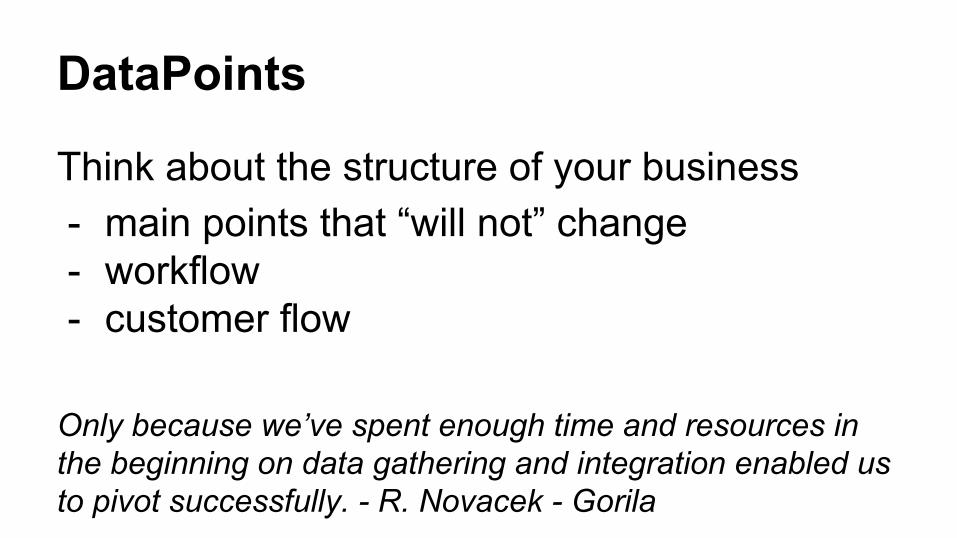
DataPoints
Think about the structure of your business- main points that “will not” change- workflow- customer flow
Only because we’ve spent enough time and resources in the beginning on data gathering and integration enabled us to pivot successfully. - R. Novacek - Gorila
Lots to do not enough time
Start small & build upon it.Focux on one step at a time
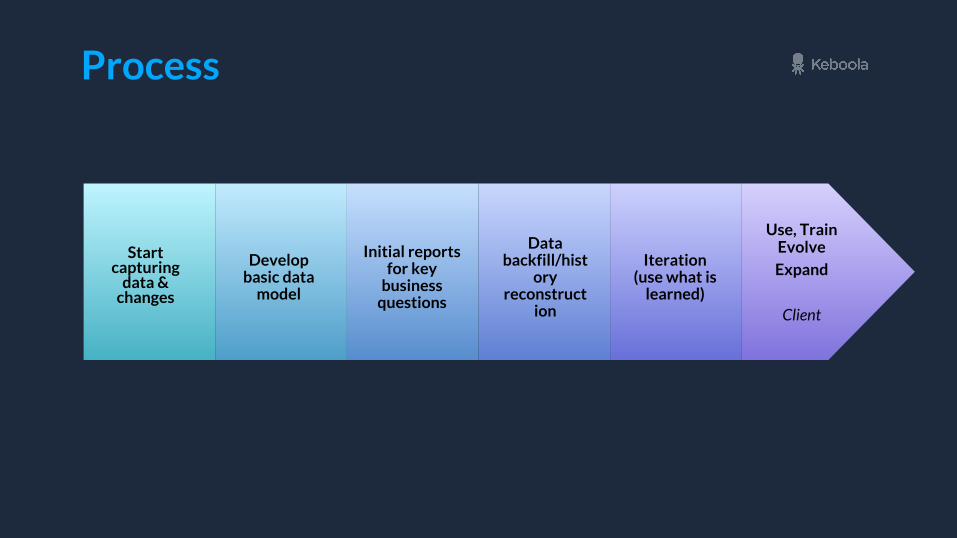
Start capturing
data & changes
Initial reports for key
business questions
Data backfill/hist
ory reconstruct
ion
Iteration (use what is
learned)
Use, Train Evolve
Expand
Client
Process
Develop basic data
model
Clients and Product
Yes, talk to your clients
Be the first line of defense on ZenDesk - be the one who HAS to
read all the tickets, solve them or assign them.
Use data to confirm your hypothesis
Get your hands dirty - choose BI tool that suits your needs and start answering your questions!
@pabu01 #keboola

3
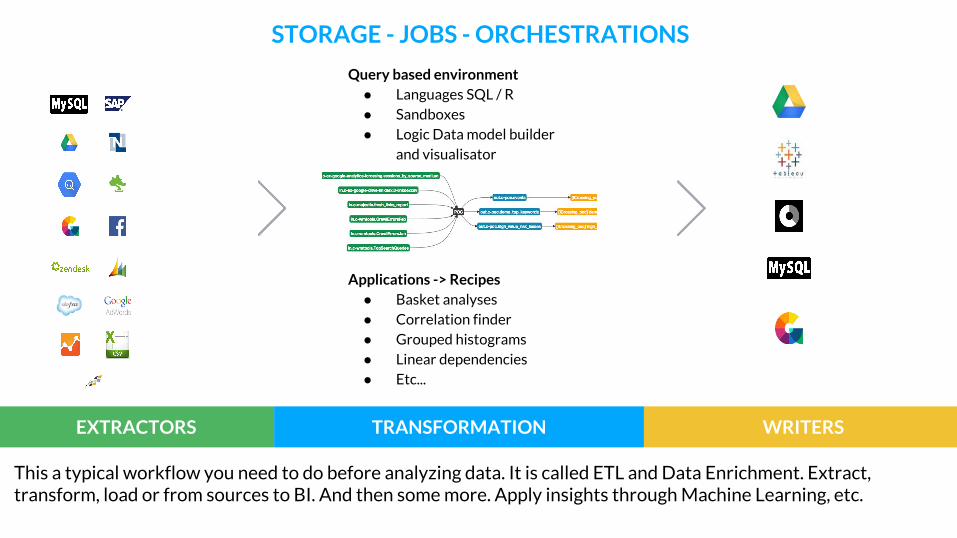
EXTRACTORS TRANSFORMATION WRITERS
Query based environment● Languages SQL / R● Sandboxes● Logic Data model builder
and visualisator
Applications -> Recipes● Basket analyses● Correlation finder● Grouped histograms● Linear dependencies● Etc...
STORAGE - JOBS - ORCHESTRATIONS
This a typical workflow you need to do before analyzing data. It is called ETL and Data Enrichment. Extract, transform, load or from sources to BI. And then some more. Apply insights through Machine Learning, etc.
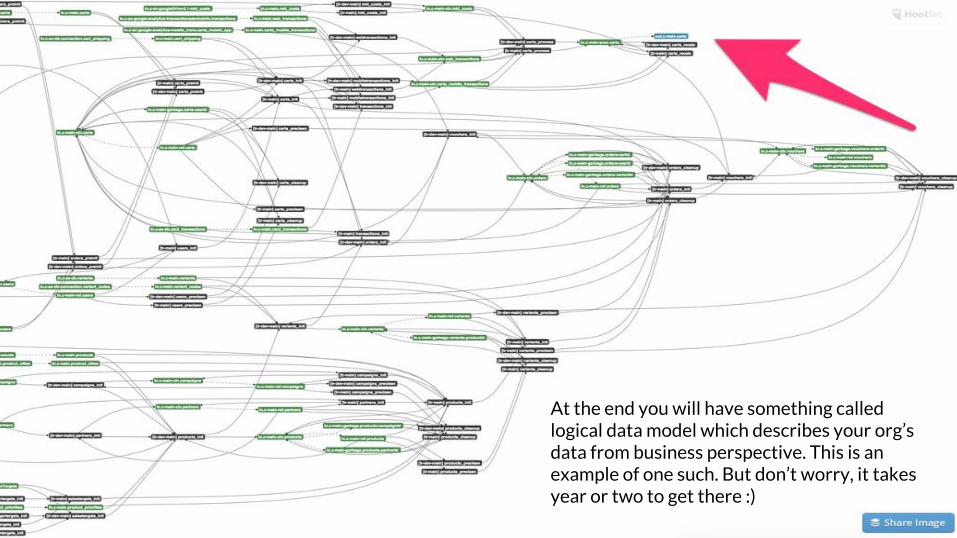
At the end you will have something called logical data model which describes your org’s data from business perspective. This is an example of one such. But don’t worry, it takes year or two to get there :)
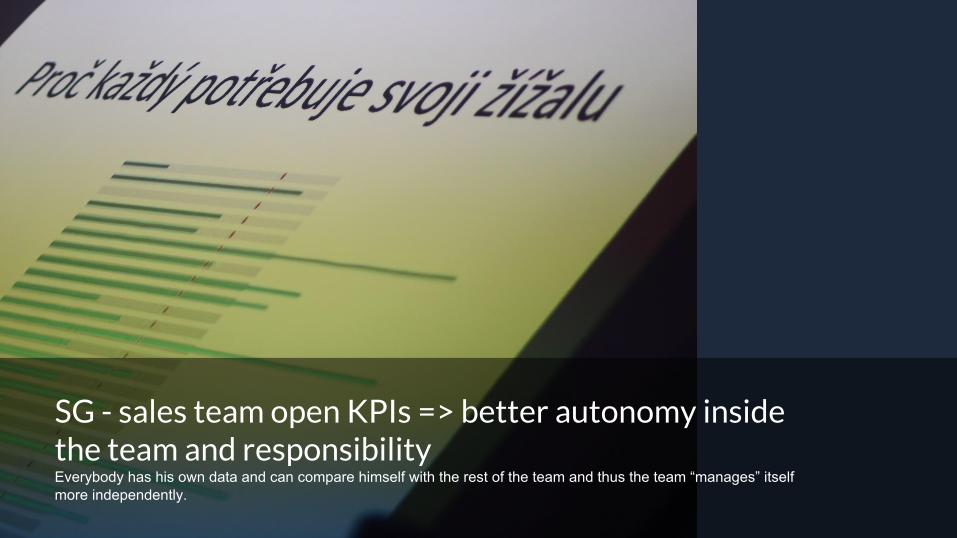
SG - sales team open KPIs => better autonomy inside the team and responsibilityEverybody has his own data and can compare himself with the rest of the team and thus the team “manages” itself more independently.
Three Data Pillars
I. Product II. Marketing
III. Operational
@pabu01 #keboola
@pabu01 #keboola
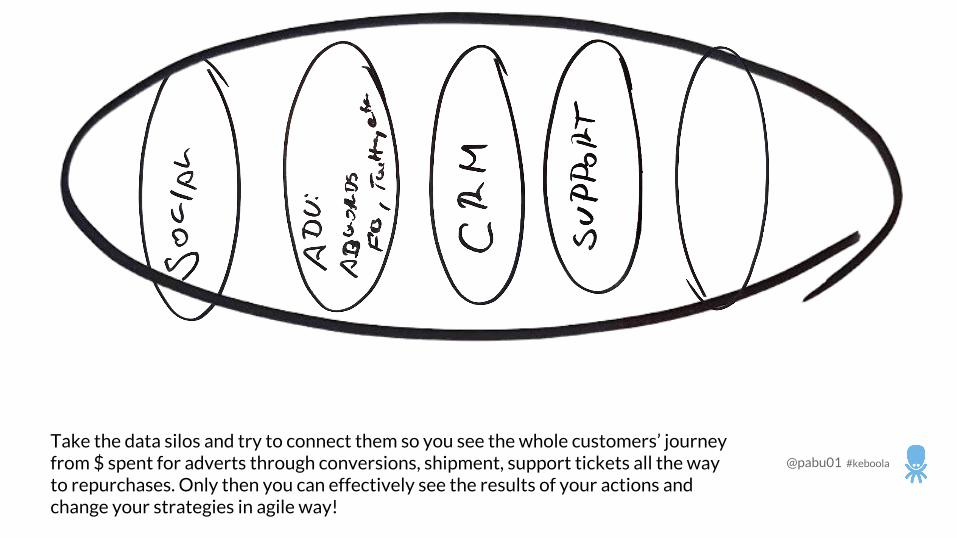
Take the data silos and try to connect them so you see the whole customers’ journey from $ spent for adverts through conversions, shipment, support tickets all the way to repurchases. Only then you can effectively see the results of your actions and change your strategies in agile way!
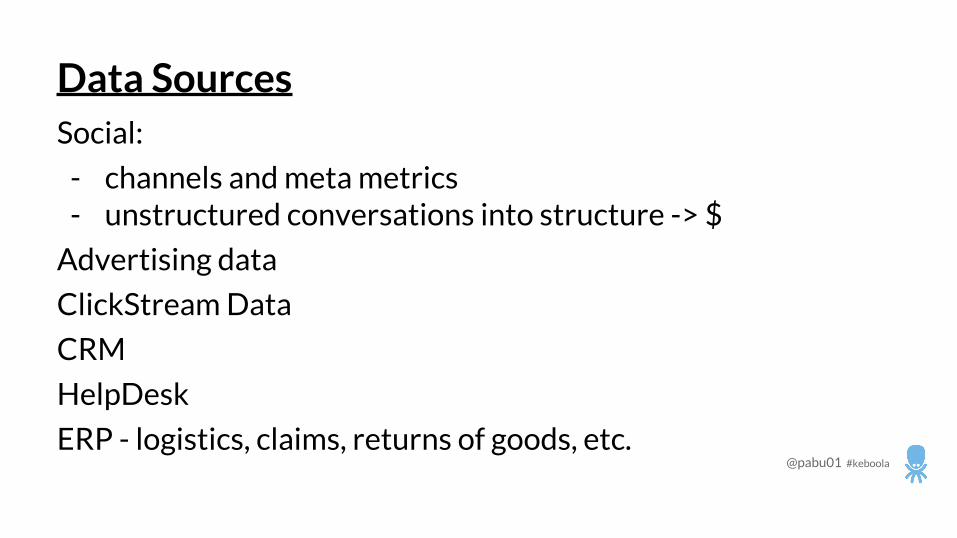
Data SourcesSocial:
- channels and meta metrics- unstructured conversations into structure -> $
Advertising data
ClickStream Data
CRM
HelpDesk
ERP - logistics, claims, returns of goods, etc.@pabu01 #keboola

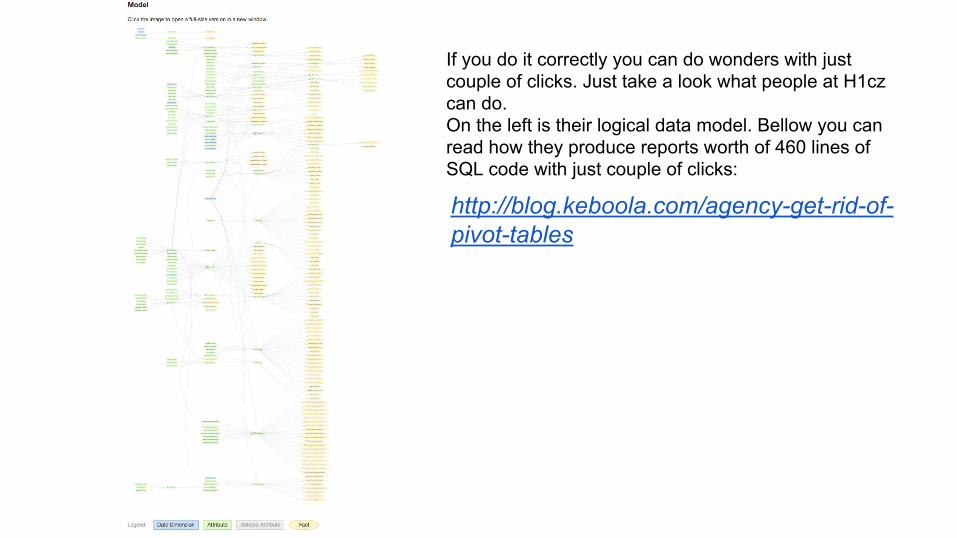
http://blog.keboola.com/agency-get-rid-of-pivot-tables
If you do it correctly you can do wonders with just couple of clicks. Just take a look what people at H1cz can do. On the left is their logical data model. Bellow you can read how they produce reports worth of 460 lines of SQL code with just couple of clicks:

Marketing
http://blog.keboola.com/agency-get-rid-of-pivot-tables
If you do it correctly you can do wonders with just couple of clicks. Just take a look what people at H1cz can do. On the left is their logical data model. Bellow you can read how they produce reports worth of 460 lines of SQL code with just couple of clicks:
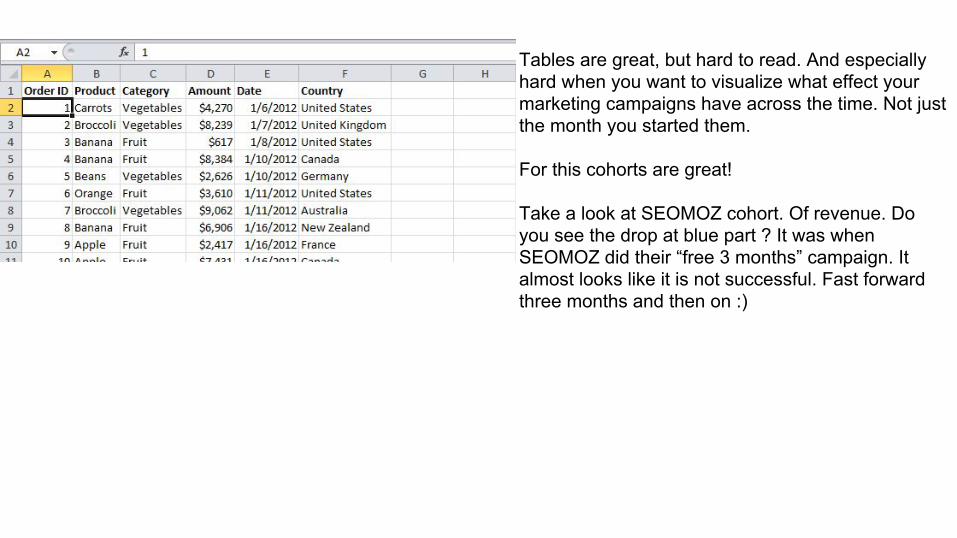
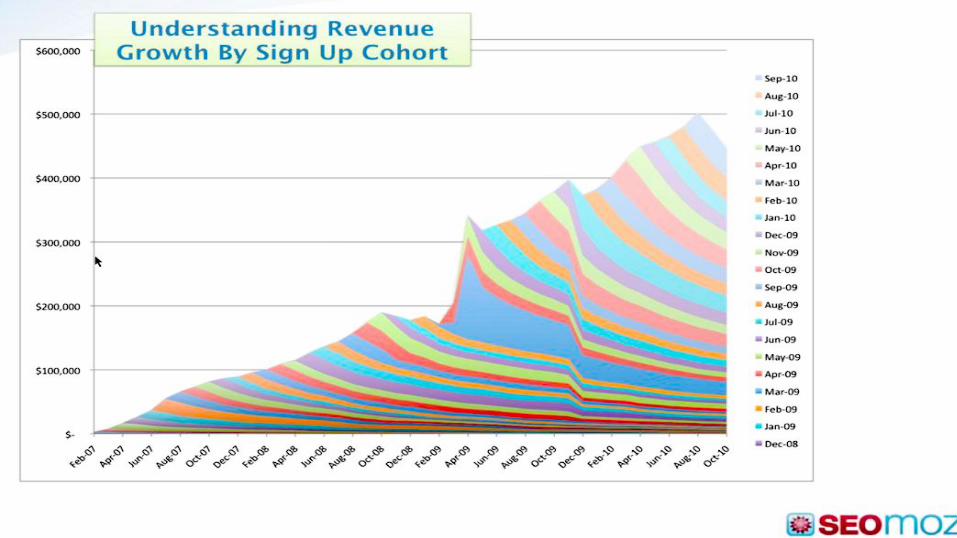
Tables are great, but hard to read. And especially hard when you want to visualize what effect your marketing campaigns have across the time. Not just the month you started them.
For this cohorts are great!
Take a look at SEOMOZ cohort. Of revenue. Do you see the drop at blue part ? It was when SEOMOZ did their “free 3 months” campaign. It almost looks like it is not successful. Fast forward three months and then on :)
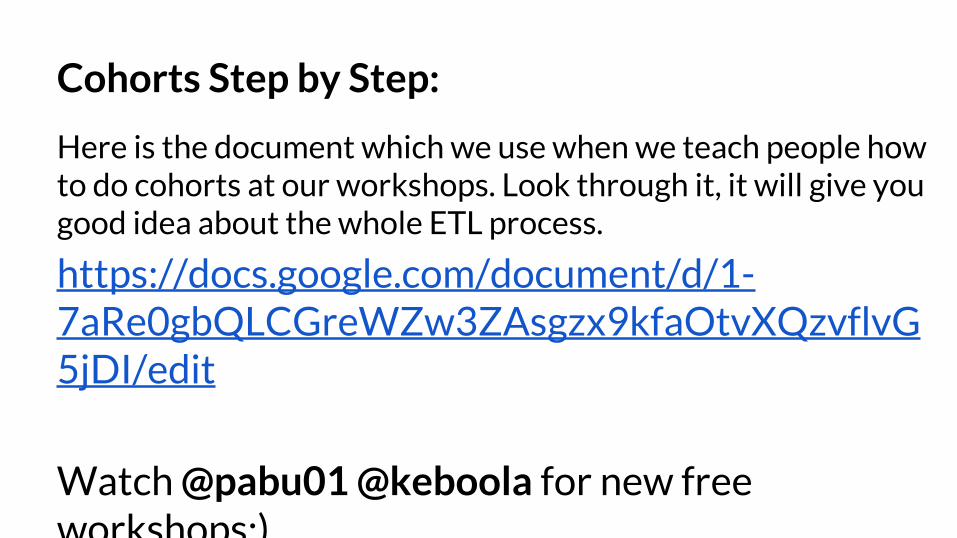
Cohorts Step by Step:
Here is the document which we use when we teach people how to do cohorts at our workshops. Look through it, it will give you good idea about the whole ETL process.
https://docs.google.com/document/d/1-7aRe0gbQLCGreWZw3ZAsgzx9kfaOtvXQzvflvG5jDI/edit
Watch @pabu01 @keboola for new free workshops:)

Tony Stark level
@pabu01 #keboola
Advanced analytics:
Beyond this basic level of company analytics, you can go many more levels deep and do some kick ass stuff….
Even without being Data Scientist!
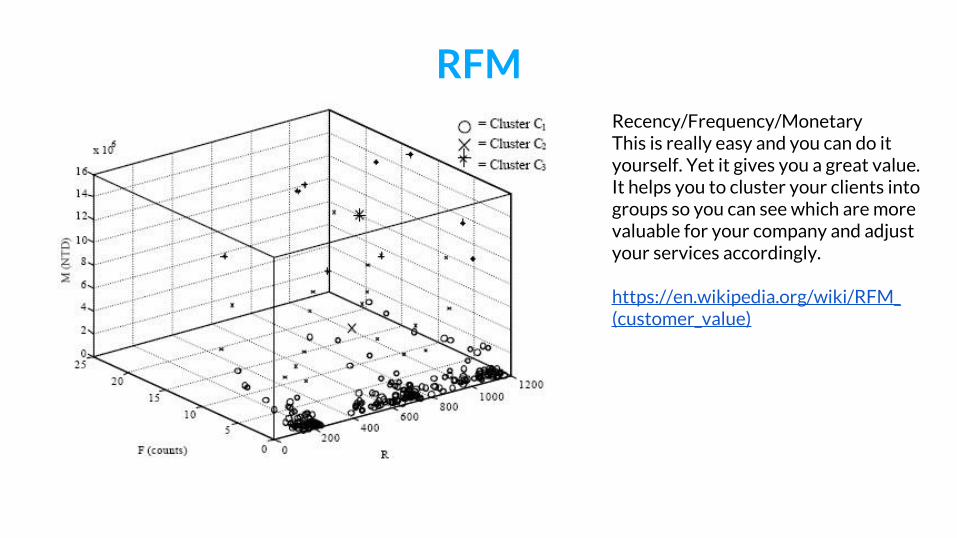
RFMRecency/Frequency/MonetaryThis is really easy and you can do it yourself. Yet it gives you a great value. It helps you to cluster your clients into groups so you can see which are more valuable for your company and adjust your services accordingly.
https://en.wikipedia.org/wiki/RFM_(customer_value)
Advance - ML:
Keboola Connection
Geneea app
Self service GoodData/TableauIf you want and need to apply some Data Science like basket analyses, next order prediction, etc. It is today possible and accessible even to business users. You can use DataScience Apps and just apply it to your data and results visualise in self serve BI tools like GoodData or Tableau. It will take you one day at max.
For example Avast one of our business clients used Keboola Connection to integrate and clean the data, applied Natural Language Processing App from Geneea.com and analyses results in Tableau and GoodData. @pabu01 #keboola
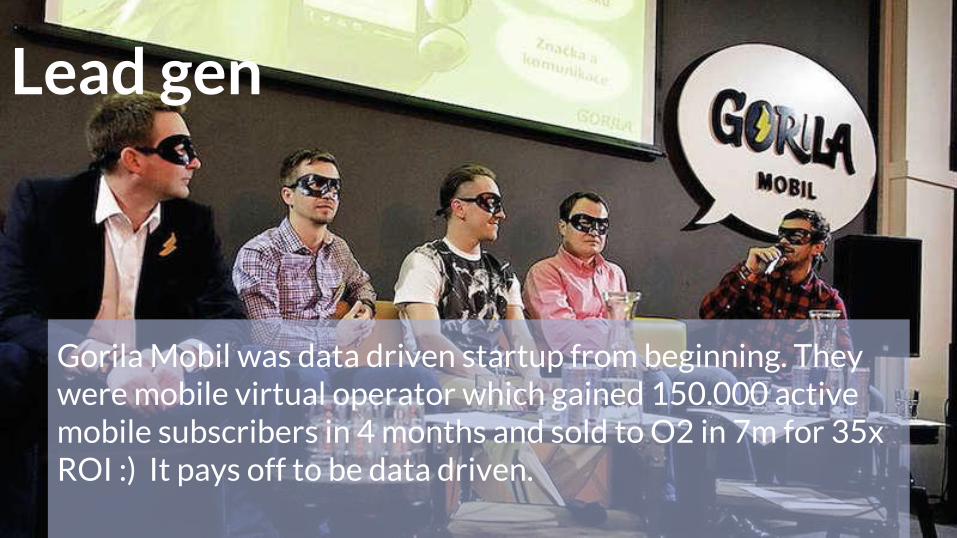
Lead gen
Gorila Mobil was data driven startup from beginning. They were mobile virtual operator which gained 150.000 active mobile subscribers in 4 months and sold to O2 in 7m for 35x ROI :) It pays off to be data driven.
Links
http://a16z.com/2015/08/21/16-metrics/
http://a16z.com/2015/09/23/16-more-metrics/
http://sufficientlyadvanced.net/bullshit-metrics
http://allthingsd.com/20121217/andreessen-and-mixpanel-call-for-an-end-to-bullshit-metrics/
https://en.wikipedia.org/wiki/Cobra_effect
http://mattyford.com/blog/2014/6/11/paired-metrics
http://pmarcatweetsasblogposts.tumblr.com/post/73631082205/measure-performance-with-paired-metrics-for-best

.Tools
Tools
Tableau great for quick discovery and great graphs!
@pabu01 #keboola
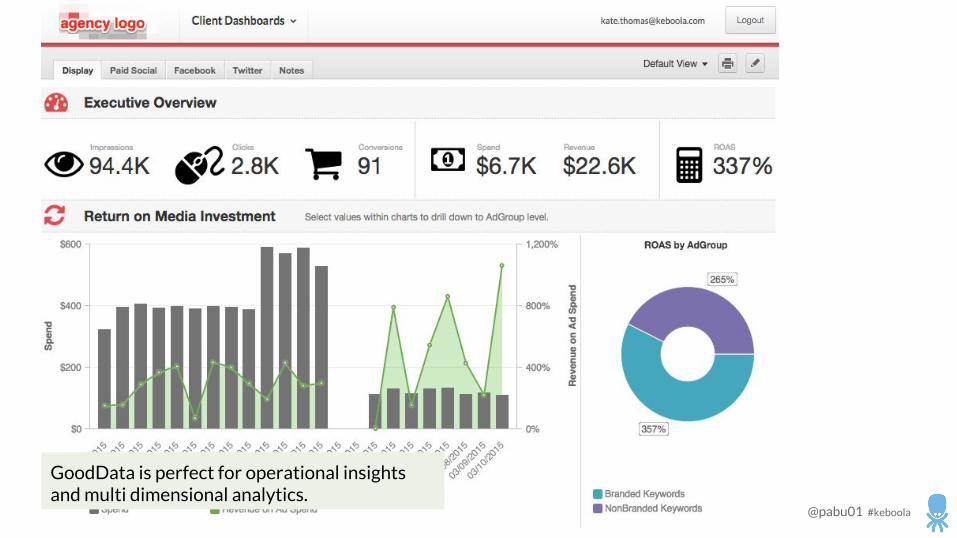
GoodData is perfect for operational insights and multi dimensional analytics.
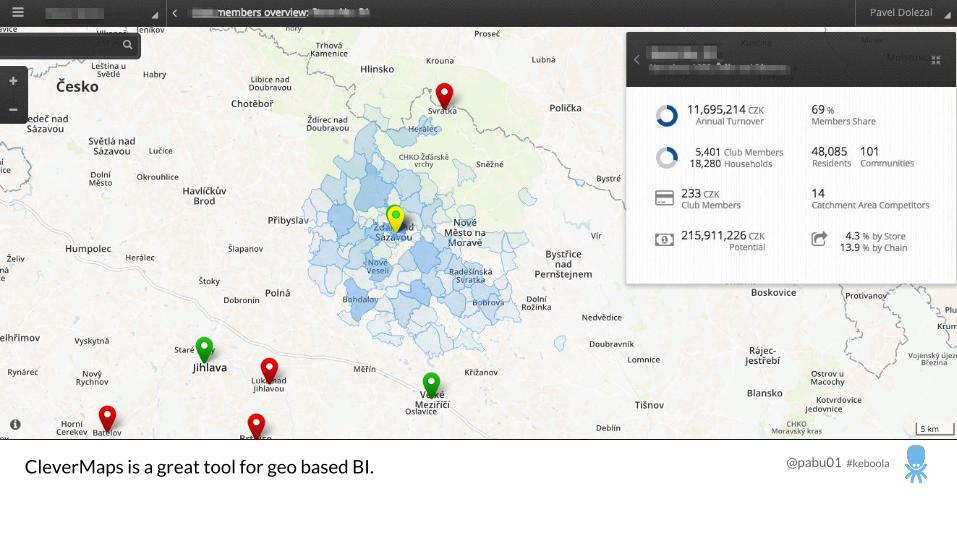
@pabu01 #keboolaCleverMaps is a great tool for geo based BI.

S
Know WHAT you want to achieve
Right KPIs that are not just vanity metrics, but business driven - who’s responsible?
Pair metrics.
Best Case Scenario:
Have them aligned /w department heads and C level = driven by data has to go across departments
@pabu01 #keboola
How To ?
★ Know WHAT you want to achieve
★ Data Sources
★ Bring $ (UK =£ :) into BI
★ Right Tools to consume
@pabu01 #keboola
Democratize DataSelf Serv
Share!!!!!!!
Orchestrate!!!
When everyone within the org makes 1.000pounds a month extra = you can double the profit… (McPen, Slevomat, Bata, ZenDesk)
@pabu01 #keboola
How to start
Stack Overflow
@pabu01 :)
How long should the process take:
1. Discovery - Q&A2. POC 4-10 MDs3. I/ phase up to one month @pabu01 #keboola

@pabu01
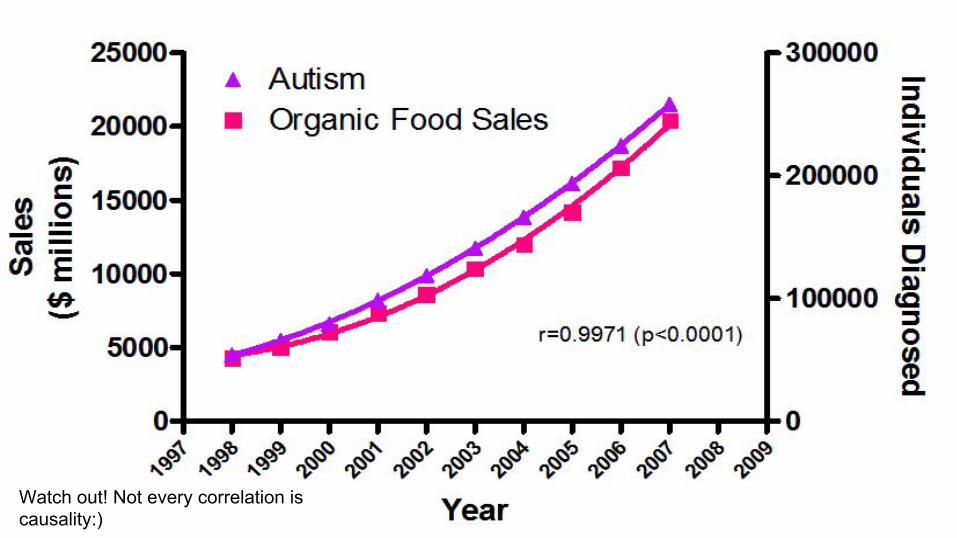
Watch out! Not every correlation is causality:)
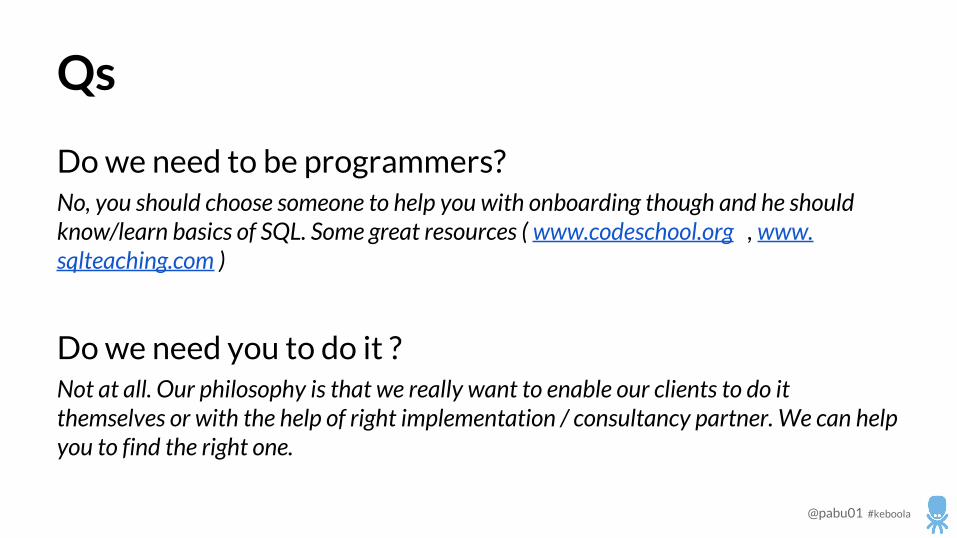
Qs
Do we need to be programmers?No, you should choose someone to help you with onboarding though and he should know/learn basics of SQL. Some great resources ( www.codeschool.org , www.sqlteaching.com )
Do we need you to do it ?Not at all. Our philosophy is that we really want to enable our clients to do it themselves or with the help of right implementation / consultancy partner. We can help you to find the right one.
@pabu01 #keboola
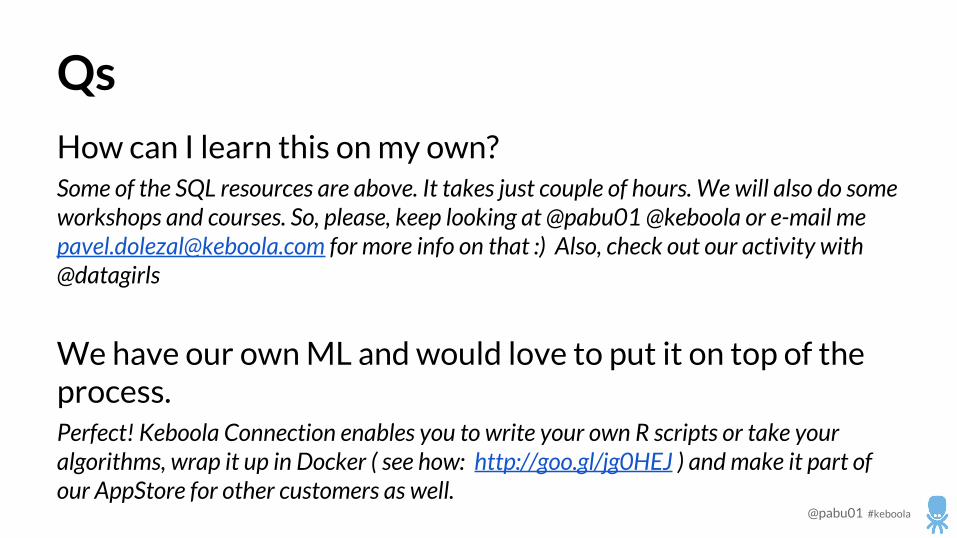
Qs
How can I learn this on my own?Some of the SQL resources are above. It takes just couple of hours. We will also do some workshops and courses. So, please, keep looking at @pabu01 @keboola or e-mail me [email protected] for more info on that :) Also, check out our activity with @datagirls
We have our own ML and would love to put it on top of the process.Perfect! Keboola Connection enables you to write your own R scripts or take your algorithms, wrap it up in Docker ( see how: http://goo.gl/jg0HEJ ) and make it part of our AppStore for other customers as well.
@pabu01 #keboola
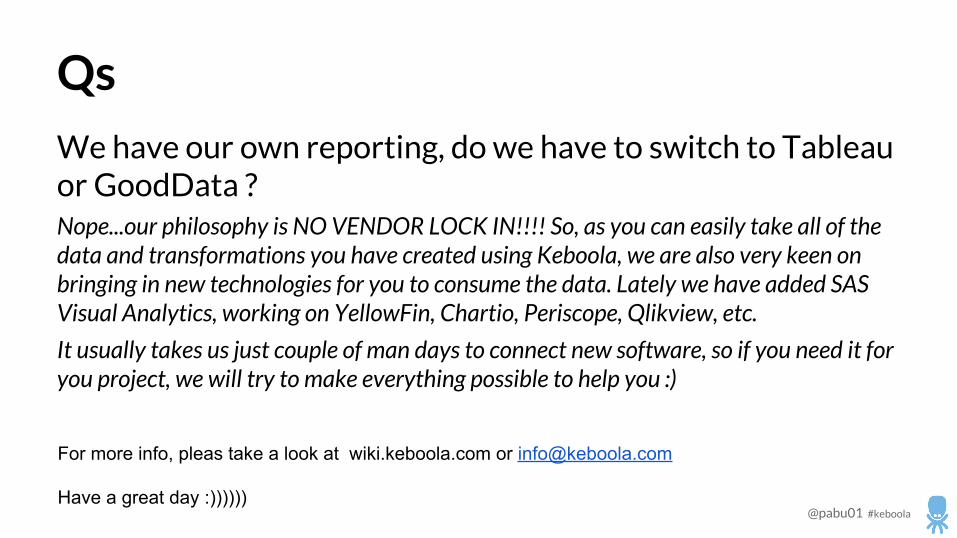
Qs
We have our own reporting, do we have to switch to Tableau or GoodData ?Nope...our philosophy is NO VENDOR LOCK IN!!!! So, as you can easily take all of the data and transformations you have created using Keboola, we are also very keen on bringing in new technologies for you to consume the data. Lately we have added SAS Visual Analytics, working on YellowFin, Chartio, Periscope, Qlikview, etc.
It usually takes us just couple of man days to connect new software, so if you need it for you project, we will try to make everything possible to help you :)
@pabu01 #keboola
For more info, pleas take a look at wiki.keboola.com or [email protected]
Have a great day :))))))
Also...
I am preparing an ebook and if there is enough interest I will prepare webinars and on site workshops in London, Prague, NYC and Vancouver.
If you are interested, please e-mail me [email protected] or Twitter @pabu01
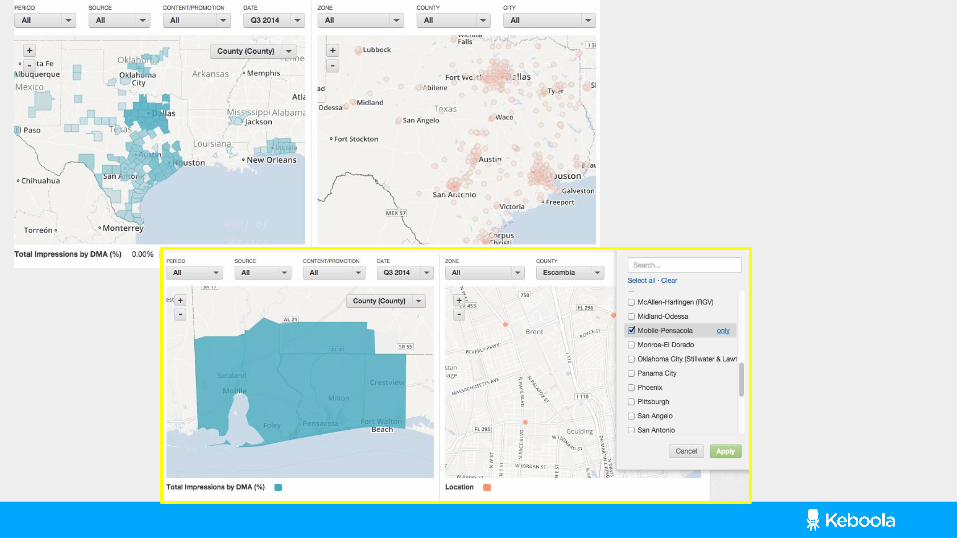
Back Up Slides
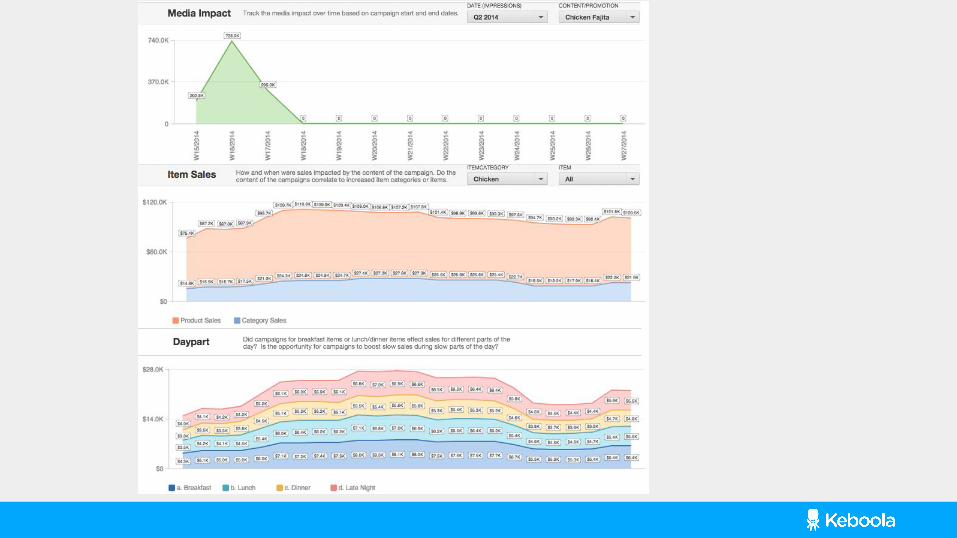
More examples of dashboards from advertising world...
@pabu01 #keboola
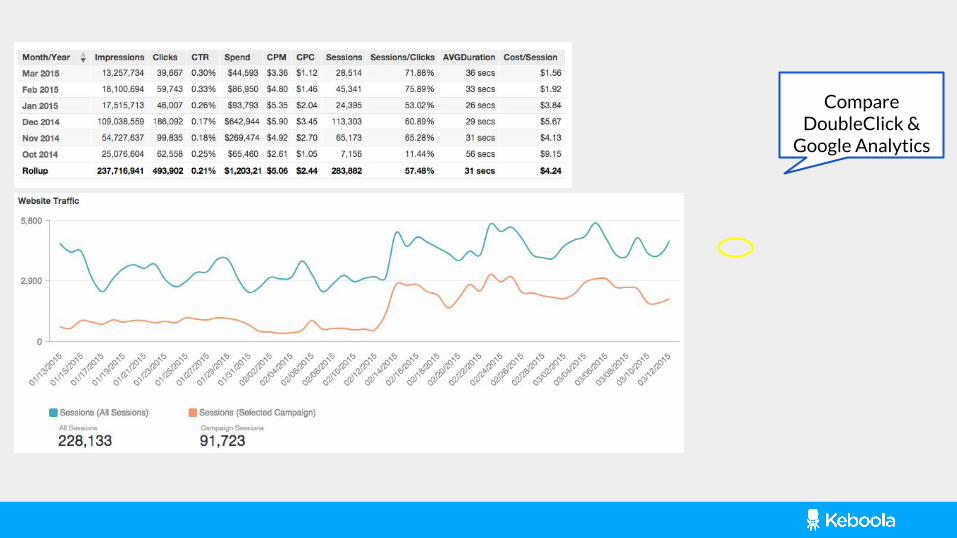
CompareDoubleClick &
Google Analytics
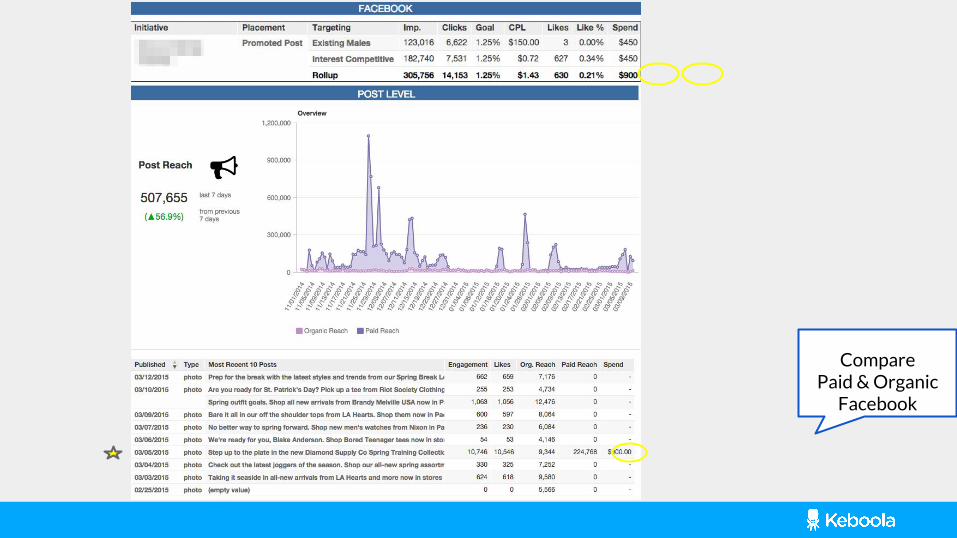
ComparePaid & Organic