how satisfied are home visitors with their caseloads?
TRANSCRIPT
F A M I L I E S
How Satisfied Are Home Visitors with Their Caseloads? A National Look at Home Visitors’ Perspectives on Caseload Fit
OPRE Report #2021-194
Heather Sandstrom, Cary Lou, and Sarah Benatar
September 2021
Early childhood home visitors work closely with families with young children and pregnant women to
provide education, support, and connections to community resources at a critical time in their lives. By
providing services directly in the home, home visitors provide a safe space for reflection and equip
parents with the tools to increase their confidence and strengthen their skills.
Home visiting work is rewarding but can also be challenging. As a relationship-based intervention
strategy, home visiting’s success depends on home visitors establishing trusting relationships with
families. To allow home visitors sufficient time to develop these relationships and work with families,
caseloads—defined as the number of children or families a home visitor serves— should be manageable.
Caseloads differ for a variety of reasons. Home visitors implement different home visiting models and
those models vary in terms of visit frequency (e.g., weekly or monthly visits)1 and duration of services.
Accordingly, expectations for caseload size tend to differ by model (NHVRC 2020). In addition, program
enrollment (shaped by local demand for services), staff size, and staff experience can all contribute to a
home visitor’s assigned caseload. Yet little is known about how home visitors feel about their caseloads
and how their caseload size affects their work experiences.
This brief summarizes descriptive findings from the Home Visiting Career Trajectories project
regarding staff perceptions of client caseloads (box 1). Specifically, this brief addresses the following
questions:
1. How do home visitors feel about their caseload size?
2. How do home visitors’ perceptions of caseload burden relate to their reports of on-the-job
stress, work-life conflict, and turnover intentions?
3. What types of home visitors report their caseloads are lighter or heavier than they can handle?
Key findings include the following:

2 H O W S A T I S F I E D A R E H O M E V I S I T O R S W I T H T H E I R C A S E L O A D S ?
Overall, 75 percent of home visitors are somewhat or completely satisfied with their caseload
size. Most home visitors (68 percent) report that their caseloads are “about right,” while 14
percent feel their caseloads are too heavy and 18 percent feel their caseloads are too light.
When caseloads are heavier than home visitors feel they can handle, home visitors are more
likely to report on-the-job stress and less work-life balance.
Perceived caseload fit varies by program and staff characteristics. Home visitors who perceive
caseloads as too light are typically new staff in their first year on the job. Home visitors are
more likely to perceive their caseloads as heavier than they can handle when their programs
have at least one staff vacancy. Reports of experiencing heavy caseloads are most common
among home visitors with three to five years of experience.
BOX 1
Overview of the Home Visiting Career Trajectories Project
The Home Visiting Career Trajectories project surveyed home visitors, home visiting supervisors, and program managers employed in local agencies nationwide receiving funding from the Maternal, Infant, and Early Childhood Home Visiting (MIECHV) Program in fiscal year 2017. With data collected in 2018, this descriptive study gathered information on staff qualifications, job experiences, and career pathways, and characteristics and practices of MIECHV-funded agencies before the COVID-19 pandemic. Interviews with program managers and supervisors and focus groups with home visitors in eight states conducted in fall 2018 provided qualitative information to supplement survey data. For more information, see the final study report: Heather Sandstrom, Sarah Benatar, Rebecca Peters, Devon Genua, Amelia Coffey, Cary Lou, Shirley Adelstein, and Erica Greenberg, Home Visiting Career Trajectories: Final Report (Washington, DC: Urban Institute, 2020), https://www.urban.org/research/publication/home-visiting-career-trajectories.
This brief draws on survey data related to home visitors’ caseloads in 2018. The Home Visitor/Supervisor Survey collected data on caseload size, caseload fit (i.e., caseload is heavier than home visitors can handle, just right, or lighter than they can handle), and satisfaction with caseload size on a scale of 1 to 4, ranging from very satisfied to very dissatisfied. The Program Manager Survey asked about program characteristics and current staff vacancies. We include key themes and illustrative quotes from focus groups with home visitors to supplement survey findings.

H O W S A T I S F I E D A R E H O M E V I S I T O R S W I T H T H E I R C A S E L O A D S ? 3
How Do Home Visitors Feel about Their Caseload Size? Caseload size depends on multiple factors: the selected home visiting model, agency policies regarding
maximum caseload, program enrollment and staffing, as well as the program’s overall management and
case assignment. Nearly all surveyed program managers (94 percent) reported having a policy on the
maximum number of families allowed per caseload. As shown in figure 1, the Home Visitor/Supervisor
Survey found that home visitors most commonly had 16 to 20 cases, with a median of 17.
FIGURE 1
Caseload Size Varies Widely but Is Typically between 10 and 25 Cases
0
2
4
6
8
10
12
1 3 5 7 9 11 13 15 17 19 21 23 25 27 29 31
Caseload size
Percentage of home visitors
Source: Home Visitor/Supervisor Survey.
Notes: N = 608. Less than 1 percent of home visitors reported caseloads greater than 32. These values are suppressed in this
figure because of low incidence.
The Home Visitor/Supervisor Survey asked home visitors how their caseload size compared with
their program’s expectations for caseload size. About half of home visitors reported meeting their
programs’ expectations for caseload size. Meanwhile, 11 percent said their caseloads were larger than
their expected caseloads and 40 percent said their caseloads were smaller than their expected
caseloads (figure 2).
4 H O W S A T I S F I E D A R E H O M E V I S I T O R S W I T H T H E I R C A S E L O A D S ?
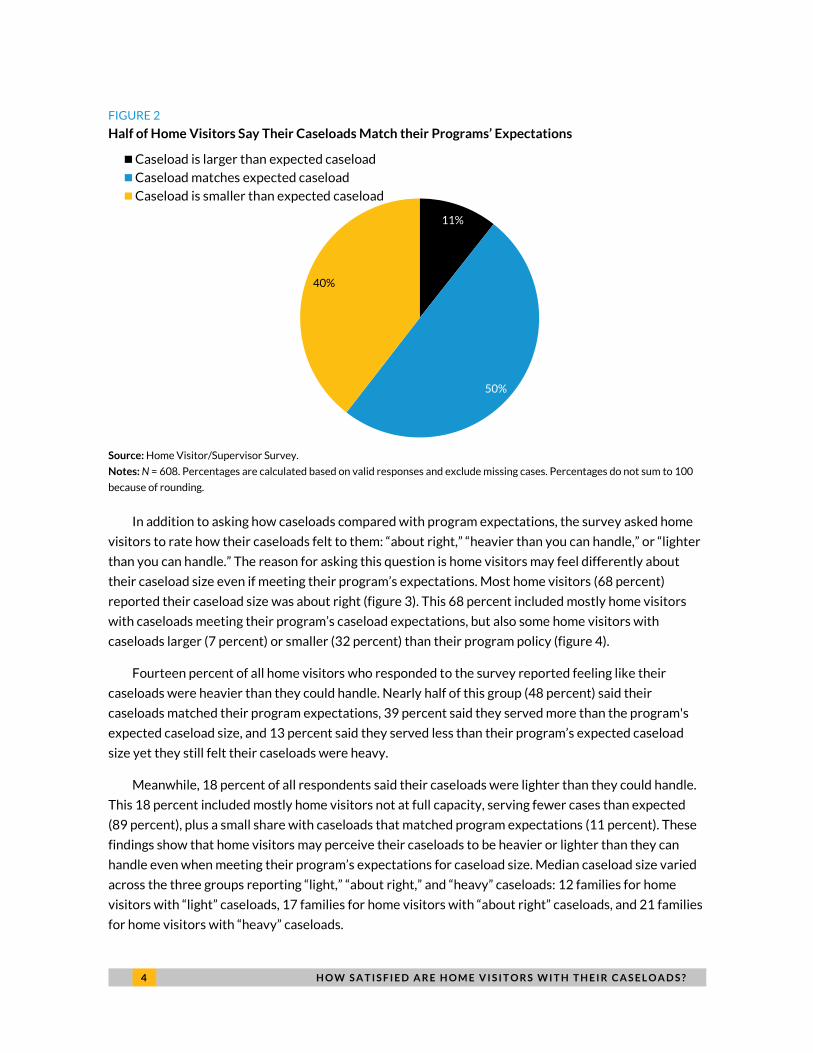
FIGURE 2
Half of Home Visitors Say Their Caseloads Match their Programs’ Expectations
11%
50%
40%
Caseload is larger than expected caseload
Caseload matches expected caseload
Caseload is smaller than expected caseload
Source: Home Visitor/Supervisor Survey.
Notes: N = 608. Percentages are calculated based on valid responses and exclude missing cases. Percentages do not sum to 100
because of rounding.
In addition to asking how caseloads compared with program expectations, the survey asked home
visitors to rate how their caseloads felt to them: “about right,” “heavier than you can handle,” or “lighter
than you can handle.” The reason for asking this question is home visitors may feel differently about
their caseload size even if meeting their program’s expectations. Most home visitors (68 percent)
reported their caseload size was about right (figure 3). This 68 percent included mostly home visitors
with caseloads meeting their program’s caseload expectations, but also some home visitors with
caseloads larger (7 percent) or smaller (32 percent) than their program policy (figure 4).
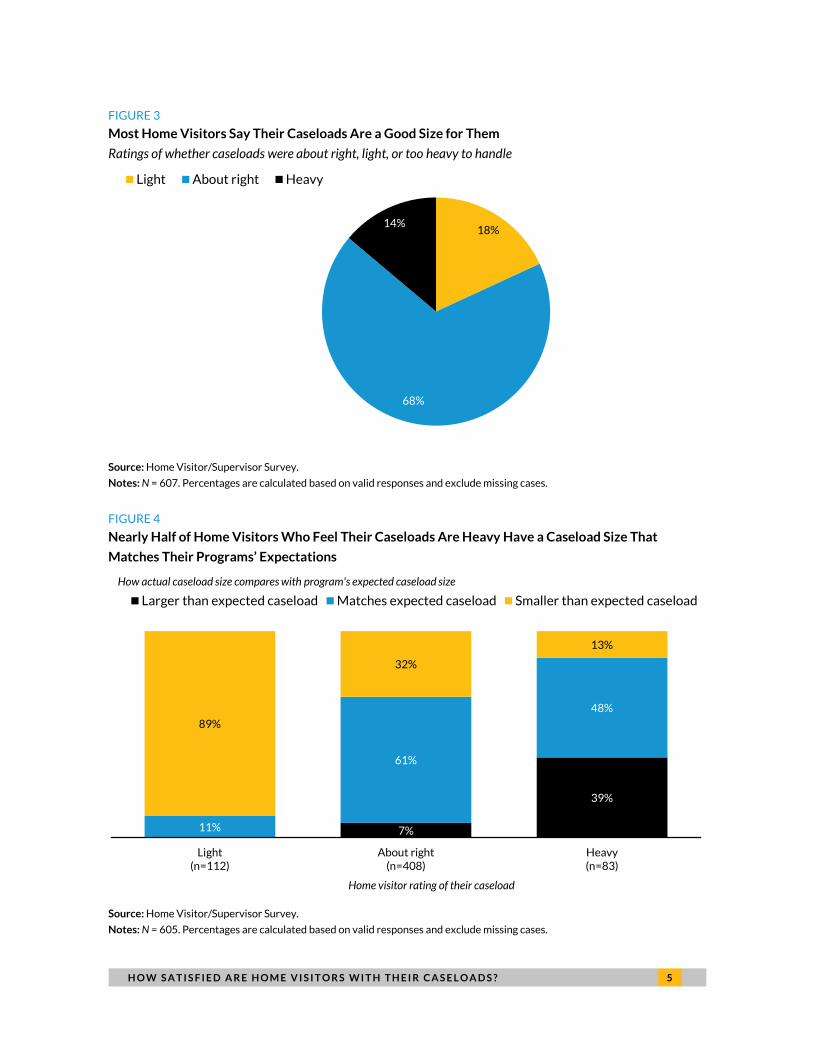
Fourteen percent of all home visitors who responded to the survey reported feeling like their
caseloads were heavier than they could handle. Nearly half of this group (48 percent) said their
caseloads matched their program expectations, 39 percent said they served more than the program's
expected caseload size, and 13 percent said they served less than their program’s expected caseload
size yet they still felt their caseloads were heavy.
Meanwhile, 18 percent of all respondents said their caseloads were lighter than they could handle.
This 18 percent included mostly home visitors not at full capacity, serving fewer cases than expected
(89 percent), plus a small share with caseloads that matched program expectations (11 percent). These
findings show that home visitors may perceive their caseloads to be heavier or lighter than they can
handle even when meeting their program’s expectations for caseload size. Median caseload size varied
across the three groups reporting “light,” “about right,” and “heavy” caseloads: 12 families for home
visitors with “light” caseloads, 17 families for home visitors with “about right” caseloads, and 21 families
for home visitors with “heavy” caseloads.
H O W S A T I S F I E D A R E H O M E V I S I T O R S W I T H T H E I R C A S E L O A D S ? 5
FIGURE 3
Most Home Visitors Say Their Caseloads Are a Good Size for Them
Ratings of whether caseloads were about right, light, or too heavy to handle
Source: Home Visitor/Supervisor Survey.
Notes: N = 607. Percentages are calculated based on valid responses and exclude missing cases.
18%
68%
14%
Light About right Heavy
FIGURE 4
Nearly Half of Home Visitors Who Feel Their Caseloads Are Heavy Have a Caseload Size That
Matches Their Programs’ Expectations
Source: Home Visitor/Supervisor Survey.
Notes: N = 605. Percentages are calculated based on valid responses and exclude missing cases.
7%
39%
11%
61%
48%
89%
32%
13%
Light(n=112)
About right(n=408)
Heavy(n=83)
Larger than expected caseload Matches expected caseload Smaller than expected caseload
Home visitor rating of their caseload
How actual caseload size compares with program's expected caseload size

6 H O W S A T I S F I E D A R E H O M E V I S I T O R S W I T H T H E I R C A S E L O A D S ?
The survey also asked home visitors to rate their satisfaction with aspects of their jobs, including
caseload size. This question was asked separately from the question about perceived caseload fit
because a home visitor could have a “light” caseload but be satisfied with it or have a “heavy” caseload
but still be somewhat satisfied with it. Home visitors most commonly reported they were “somewhat
satisfied” (48 percent) or “completely satisfied” (27 percent) with their caseload size (figure 5). Smaller
shares were “somewhat dissatisfied” (20 percent) or “completely dissatisfied” (6 percent).
Home visitors who reported a heavier caseload than they could handle were more likely to express
dissatisfaction with their caseloads (72 percent—including 22 percent who reported complete
dissatisfaction and 50 percent who were somewhat dissatisfied). Some home visitors who perceived
their caseloads were light also reported dissatisfaction with their caseloads (15 percent total; sample
sizes are too small to report separately for those completely or somewhat dissatisfied).
FIGURE 5
Most Home Visitors Are Satisfied with Their Caseload Size, But One Quarter Are Somewhat or
Completely Dissatisfied
27%
48%
20%
6%
Completely Satisfied Somewhat SatisfiedSomewhat Dissatisfied Completely Dissatisfied
Source: Home Visitor/Supervisor Survey.
Notes: N = 684. Percentages are calculated based on valid responses and exclude missing cases.
Focus groups with home visitors provided insights into their experiences that help explain these
survey findings. In the focus groups, they discussed how the number of cases is not the only important
criterium to consider when assigning cases and shared other reasons why caseloads can seem heavy or
light. For instance, the make-up of the caseload is important. Some families have greater or more
complex needs than others. As one home visitor described, “I’m supposed to have 19 or 20. I find that 16
to 17 is really appropriate given the mental health issues and other issues surrounding our families.”
The amount of required paperwork for each additional case can also contribute to home visitors’
sense of caseload manageability. One home visitor explained it was not only her large caseload that was
overwhelming to her, but also the families’ complex needs and the amount of paperwork:

H O W S A T I S F I E D A R E H O M E V I S I T O R S W I T H T H E I R C A S E L O A D S ? 7
Totally depends who you have on your caseload…We have a caseload of mental and behavioral
health [problems] and mainly untreated clients—and a collection of other things surrounding
poverty. Possibly medically sick babies and moms as well—it can feel quite overwhelming at
times. And you feel like all you are doing is see clients and stay above water…We do have a lot of
paperwork and we understand the reason why because we are an evidence-based program, but
over the years the paperwork has steadily increased.
Her colleague—who had a caseload that was approximately the same size—disagreed and shared
that she felt comfortable with her caseload after figuring out how to manage her paperwork
responsibilities:
I don’t feel that way. I have had a caseload of 25 and I never felt I was completely overwhelmed. It
balanced out for me personally. I think paperwork is bad; you just have to be organized.
A home visitor in another program similarly described, “If I stay on top of my case notes, it feels less
overwhelming.” However, the families these home visitors worked with could have had different and
less complex needs that made handling caseload responsibilities more manageable.
Another factor is whether or not home visitors are responsible for recruiting families or doing initial
assessments. One home visitor commented, “After a referral comes in and an assessment is done, the
supervisor makes a decision about who would be the best fit. There is a weight limit [meaning cases are
weighted according to families’ needs], so nobody gets overwhelmed.” In other programs where home
visitors actively recruited, they discussed the effort—and sometimes anxiety—involved in recruiting to
quickly fill slots as families graduated from the program. In some focus groups, home visitors discussed
the struggles of staff members with small caseloads who were having trouble recruiting new families
and feeling like their skills were underutilized.
Home visitors described being more heavily utilized when their programs had staff vacancies. They
had to take on additional cases temporarily until the program hired or families graduated from the
program. As one home visitor described,
We’ve been feeling the pressure of the [staff] openings we have. My caseload is way bigger than
it used to be…The interviewing process is harder now. You have to go through a bunch of people.
We used to be involved in the hiring process, and now we aren’t.
The Program Manager Survey asked about staff turnover and specifically what happens to a home
visitor’s cases when they leave their position. Nearly all respondents (95 percent) reported shifting
cases to other home visitors and many (75 percent) also shifted cases to home visiting supervisors
(figure 6).

8 H O W S A T I S F I E D A R E H O M E V I S I T O R S W I T H T H E I R C A S E L O A D S ?
FIGURE 6
Nearly All Program Managers Reported That Cases Are Shifted to Other Home Visitors When a
Home Visitor Leaves Their Position
95%
75%
40%
19%
6%
Shift responsibility forthose families to other
home visitors
Shift responsibility forthose families to
supervisor
Reduce the expectedvisit frequency for
those families
Graduate the families in that home visitor’s
caseload early
Stop services for the families in that home
visitor’s caseload
Source: Program Manager Survey.
Notes: N = 349. Respondents could select more than one response. Percentages are calculated based on valid responses and
exclude missing cases.
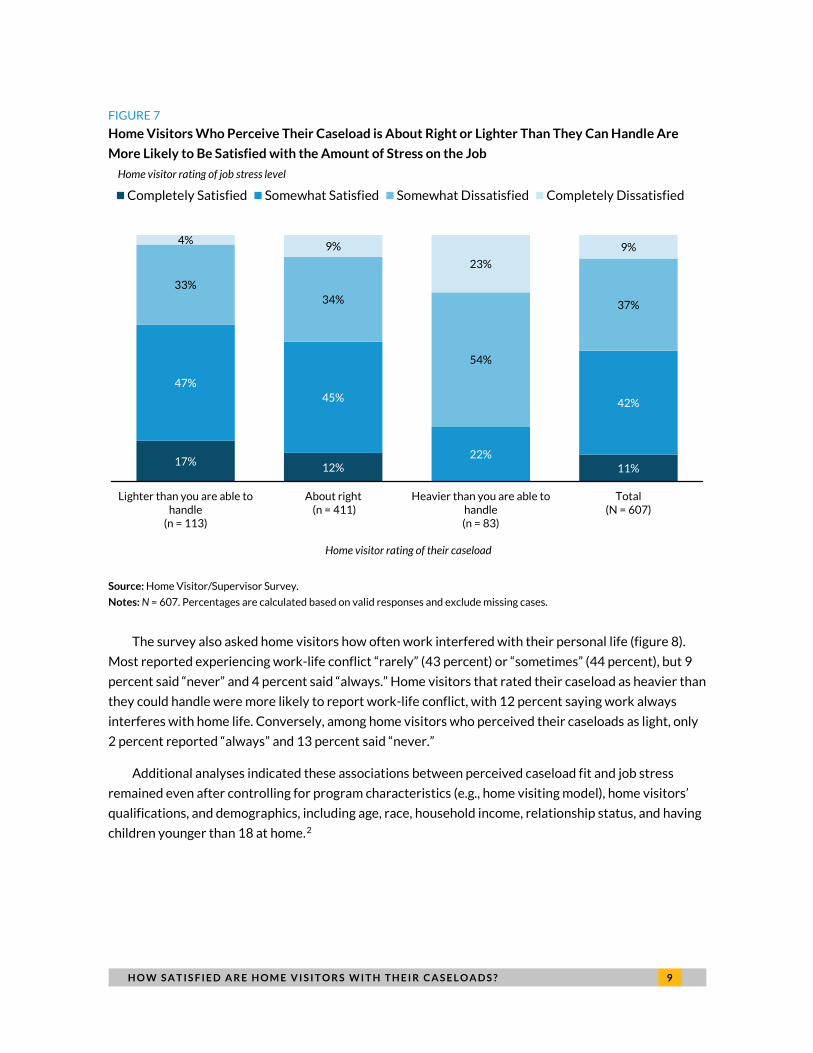
How Does Caseload Burden Relate to On-the-Job Stress, Work-Life Conflict, and Turnover Intentions? As with all jobs, some on-the-job stress is likely inherent to home visiting work. The survey asked home
visitors to rate their satisfaction with “the amount of on-the-job stress” they experienced. Overall, most
said they were somewhat satisfied (42 percent) or somewhat dissatisfied (37 percent) with their job
stress, whereas 11 percent said they were completely satisfied and 9 percent were completely
dissatisfied. Home visitors who rated their caseload as “about right” or “lighter” than they could handle
were more likely to report satisfaction with the level of job stress (figure 7). None of those who reported
a heavy caseload were completely satisfied with this aspect of their job.
H O W S A T I S F I E D A R E H O M E V I S I T O R S W I T H T H E I R C A S E L O A D S ? 9
FIGURE 7
Home Visitors Who Perceive Their Caseload is About Right or Lighter Than They Can Handle Are
More Likely to Be Satisfied with the Amount of Stress on the Job
Source: Home Visitor/Supervisor Survey.
Notes: N = 607. Percentages are calculated based on valid responses and exclude missing cases.
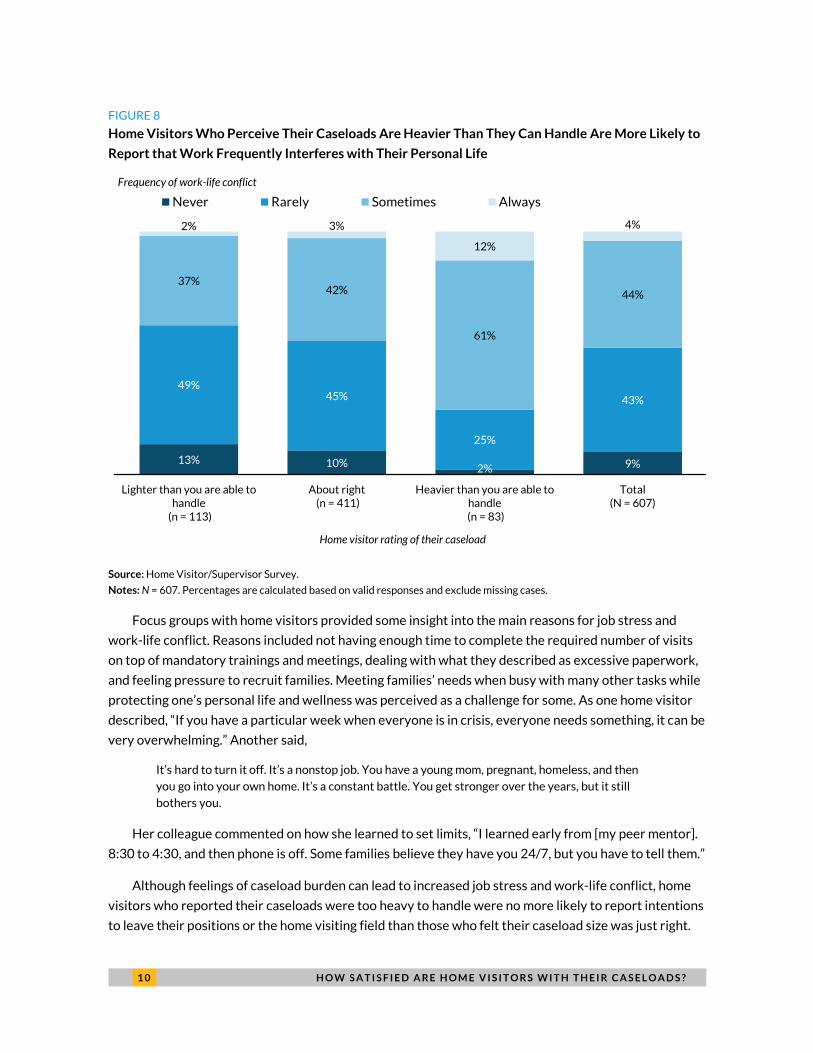
The survey also asked home visitors how often work interfered with their personal life (figure 8).
Most reported experiencing work-life conflict “rarely” (43 percent) or “sometimes” (44 percent), but 9
percent said “never” and 4 percent said “always.” Home visitors that rated their caseload as heavier than
they could handle were more likely to report work-life conflict, with 12 percent saying work always
interferes with home life. Conversely, among home visitors who perceived their caseloads as light, only
2 percent reported “always” and 13 percent said “never.”
Additional analyses indicated these associations between perceived caseload fit and job stress
remained even after controlling for program characteristics (e.g., home visiting model), home visitors’
qualifications, and demographics, including age, race, household income, relationship status, and having
children younger than 18 at home.
17% 12% 11%
47%45%
22%
42%
33%34%
54%
37%
4% 9%
23%
9%
Lighter than you are able tohandle
(n = 113)
About right (n = 411)
Heavier than you are able tohandle(n = 83)
Total(N = 607)
Completely Satisfied Somewhat Satisfied Somewhat Dissatisfied Completely Dissatisfied
Home visitor rating of their caseload
Home visitor rating of job stress level
2
1 0 H O W S A T I S F I E D A R E H O M E V I S I T O R S W I T H T H E I R C A S E L O A D S ?
FIGURE 8
Home Visitors Who Perceive Their Caseloads Are Heavier Than They Can Handle Are More Likely to
Report that Work Frequently Interferes with Their Personal Life
13% 10% 2% 9%
49%45%
25%
43%
37%42%
61%
44%
2% 3%
12%
4%
Lighter than you are able tohandle
(n = 113)
About right (n = 411)
Heavier than you are able tohandle
(n = 83)
Total(N = 607)
Never Rarely Sometimes Always
Frequency of work-life conflict
Home visitor rating of their caseload
Source: Home Visitor/Supervisor Survey.
Notes: N = 607. Percentages are calculated based on valid responses and exclude missing cases.
Focus groups with home visitors provided some insight into the main reasons for job stress and
work-life conflict. Reasons included not having enough time to complete the required number of visits
on top of mandatory trainings and meetings, dealing with what they described as excessive paperwork,
and feeling pressure to recruit families. Meeting families’ needs when busy with many other tasks while
protecting one’s personal life and wellness was perceived as a challenge for some. As one home visitor
described, “If you have a particular week when everyone is in crisis, everyone needs something, it can be
very overwhelming.” Another said,
It’s hard to turn it off. It’s a nonstop job. You have a young mom, pregnant, homeless, and then
you go into your own home. It’s a constant battle. You get stronger over the years, but it still
bothers you.
Her colleague commented on how she learned to set limits, “I learned early from [my peer mentor].
8:30 to 4:30, and then phone is off. Some families believe they have you 24/7, but you have to tell them.”
Although feelings of caseload burden can lead to increased job stress and work-life conflict, home
visitors who reported their caseloads were too heavy to handle were no more likely to report intentions
to leave their positions or the home visiting field than those who felt their caseload size was just right.
H O W S A T I S F I E D A R E H O M E V I S I T O R S W I T H T H E I R C A S E L O A D S ? 1 1
Other factors, including receiving a promotion, positive perceptions of work environment, schedule
control and flexibility, and supportive program management practices such as peer mentoring, were
more strongly and directly related to retention.3
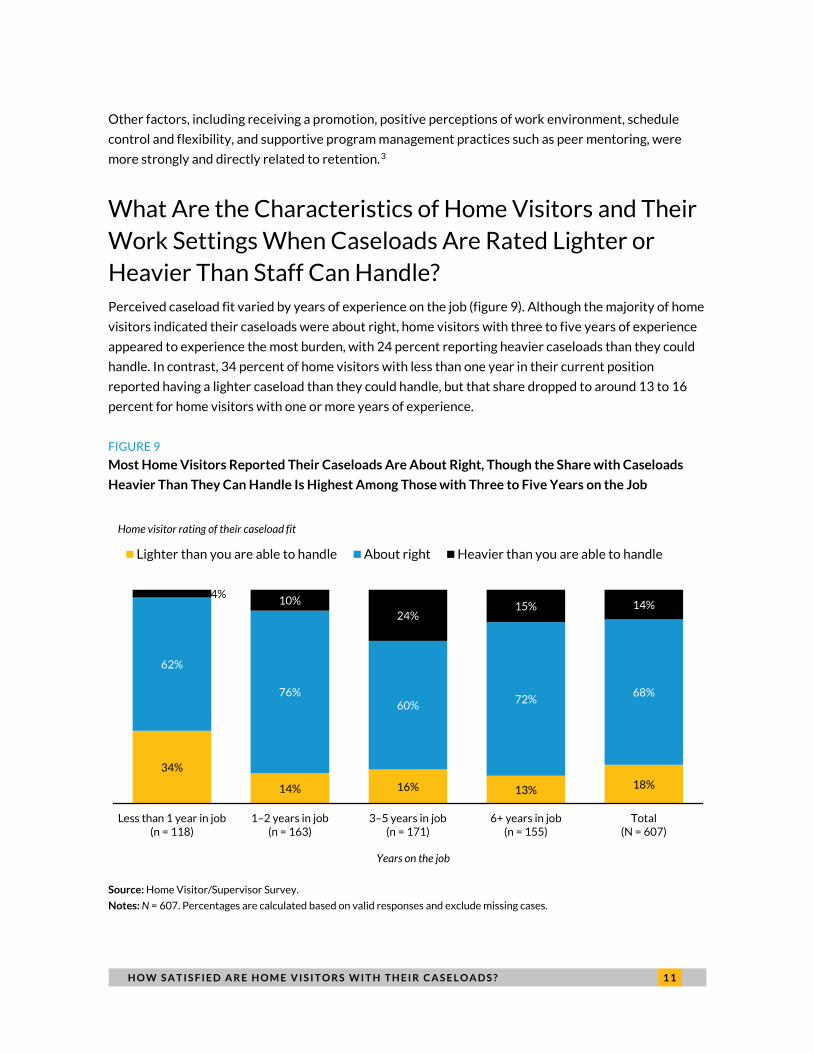
What Are the Characteristics of Home Visitors and Their Work Settings When Caseloads Are Rated Lighter or Heavier Than Staff Can Handle? Perceived caseload fit varied by years of experience on the job (figure 9). Although the majority of home
visitors indicated their caseloads were about right, home visitors with three to five years of experience
appeared to experience the most burden, with 24 percent reporting heavier caseloads than they could
handle. In contrast, 34 percent of home visitors with less than one year in their current position
reported having a lighter caseload than they could handle, but that share dropped to around 13 to 16
percent for home visitors with one or more years of experience.
FIGURE 9
Most Home Visitors Reported Their Caseloads Are About Right, Though the Share with Caseloads
Heavier Than They Can Handle Is Highest Among Those with Three to Five Years on the Job
34%
14% 16% 13% 18%
62%
76%60% 72%
68%
4%10%
24%15% 14%
Less than 1 year in job(n = 118)
1–2 years in job(n = 163)
3–5 years in job(n = 171)
6+ years in job(n = 155)
Total(N = 607)
Lighter than you are able to handle About right Heavier than you are able to handle
Home visitor rating of their caseload fit
Years on the job
Source: Home Visitor/Supervisor Survey.
Notes: N = 607. Percentages are calculated based on valid responses and exclude missing cases.
1 2 H O W S A T I S F I E D A R E H O M E V I S I T O R S W I T H T H E I R C A S E L O A D S ?
Multivariate analyses of survey data identified characteristics of home visitors and their
employment settings that are most related to their perceptions of their caseloads.4 When controlling
for multiple program and individual characteristics, home visitors were more likely to report caseloads
as heavier than they could handle when
they had held their current position for more than one year;
they attended school part time while working;
they held a degree in education, early education, or special education in comparison with degrees in nursing, social work, or psychology;
their programs had at least one staff vacancy;
they worked in public health departments versus other government agencies or hospitals; and
the majority of their clients lived in urban areas versus small towns.
Multiple demographic characteristics were also related to caseload fit: home visitors who were
White versus Black, single and not in a relationship compared with other relationship statuses, younger
than 35 compared with 65 and older, or with a higher household income (more than $60,000) were
more likely to report caseloads heavier than they could handle. These findings suggest home visitors’
caseload experiences vary by their work setting, background, and personal circumstances.
Focus groups with home visitors supported several of these survey findings. Specifically, home
visitors shared that more experienced home visitors often take on more work while newer staff spend
the first months training and then ramp up their caseloads in the first year. However, occasionally,
newer home visitors had to wait months to get fully trained, because of the scheduling of model-led
trainings, and could not yet serve families on their own. Others had small caseloads because of
challenges recruiting families. In these cases, they described feeling underutilized and dissatisfied with
their jobs.
As mentioned earlier, staff vacancies often added to home visitors’ workload as they took on
additional cases left from their past colleagues. Those balancing work and school also felt overwhelmed
at times handling their caseloads. Survey findings suggest young home visitors and those not in
relationships may voluntarily take on more work or involuntarily be more heavily utilized than others,
yet supporting evidence from case studies is unclear.
Summary and Implications Study findings suggest that caseloads are not as simple as one size fits all. At the time of the survey, most
home visitors felt their caseloads were “about right” and were satisfied with their caseload size.
However, 18 percent felt their caseloads were light and 14 percent reported having caseloads heavier
than they could handle. Light caseloads were most common among newer staff. Caseloads were
perceived as heavy when programs were understaffed, served urban communities, and when home
visitors were balancing work and school. Staff with a background in nursing, social work, or psychology

H O W S A T I S F I E D A R E H O M E V I S I T O R S W I T H T H E I R C A S E L O A D S ? 1 3
were less likely to report their caseloads were too heavy. The field may benefit from better
understanding the tools from these fields that are helping staff manage their caseloads.
We find that home visitors who reported caseloads heavier than they could handle also reported
higher job stress and work-life conflict; however, home visitors were no more likely to report intentions
to leave their positions or the home visiting field because of their perceived caseload fit. Other factors
related to workplace culture and advancement opportunities were more strongly related to turnover
(Lou, Sandstrom, and Benatar 2021).
The high level of staff satisfaction with caseloads and stress levels suggests most home visiting
programs are generally supporting their workers. However, to ensure all staff are feeling supported and
best utilizing their talents, programs may want to consider routinely assessing how home visitors are
feeling about their caseloads and making necessary adjustments. Taking a “pulse check” of home
visitors’ caseloads seems especially important when programs are facing long periods with staff
vacancies, given our findings that cases are shifted to other home visitors when staff turnover.
In focus groups, home visitors explained that caseload size is not the only important characteristic
to consider when assigning cases and assessing fit. In addition to closely monitoring when cases are
closing and new families are enrolling, the results of this study show that accounting for family needs
and home visitors’ strengths when assigning cases, and considering home visitors’ full work
responsibilities (e.g., paperwork, recruiting families) when setting expectations, are key aspects of
strong caseload oversight at the program level. Involving home visitors in new case assignment can also
promote staff morale and feelings of internal equity. Taking these steps to achieve good caseload fit can
help relieve work stress, encourage work-life balance, and better support staff in their work with
families.
Notes 1 Nearly 20 home visiting models meet HHS criteria for an evidence-based model and are approved for
implementation with funding from the Maternal, Infant, and Early Childhood Home Visiting (MIECHV) Program. See the Home Visiting Evidence of Effectiveness (HomeVEE) website for details on eligible models: https://homvee.acf.hhs.gov/HRSA-Models-Eligible-MIECHV-Grantees, accessed September 1, 2021.
2 We ran multivariate regression models to examine associations between home visitors’ perceptions of their caseload size and their ratings of job stress. These analyses controlled for home visitors’ demographic characteristics, highest educational attainment, area of study, current school enrollment, self-reported level of expertise, work experience, motivation to work in home visiting, reported benefits, schedule and scheduling policies, perceptions of work environment, frequency of supervisory meetings, and current caseload size as reported on the Home Visitor/Supervisor Survey. The analytic models also controlled for program characteristics reported on the Program Manager Survey, including agency type; agency size; home visiting model; years implementing model; HRSA region; share of clients in urban, suburban, small town, and rural areas; funding sources; program manager characteristics; program management practices; influence of employee input on program policies; current staff vacancies; whether programs weight caseloads based on family need; and policies on maximum caseload size.
3 See study final report (Sandstrom et al. 2020) and the companion brief (Lou, Sandstrom, and Benatar 2021) for more details on factors predicting turnover intentions.

1 4 H O W S A T I S F I E D A R E H O M E V I S I T O R S W I T H T H E I R C A S E L O A D S ?
4 We ran multivariate regression models to examine factors associated with home visitors’ experiencing heavier
caseloads than they can handle. Factors included home visitors’ demographic characteristics, work experience, highest educational attainment, and area of study, as reported on the Home Visitor/Supervisor Survey. Analytic models also included program characteristics reported on the Program Manager Survey, including whether programs weight caseloads based on family need, policies on maximum caseload size, current staff vacancies, program management practices, and engagement in reflective supervision.
References Lou, Cary, Heather Sandstrom, and Sarah Benatar. 2021. “Management Practices to Promote Home Visitor
Retention. What Does a National Study of the Home Visiting Workforce Tell Us?” OPRE Report 2021-193. Washington, DC:, Office of Planning, Research, and Evaluation, Administration for Children and Families, US Department of Health and Human Services.
NHVRC (National Home Visiting Resource Center). 2020. Home Visiting Yearbook. Arlington, VA: James Bell Associates and Urban Institute.
Sandstrom, Heather, Sarah Benatar, Rebecca Peters, Devon Genua, Amelia Coffey, Cary Lou, Shirley Adelstein, and Erica Greenberg. 2020. Home Visiting Career Trajectories: Final Report. OPRE Report #2020-11, Washington, DC: Office of Planning, Research, and Evaluation, Administration for Children and Families, US Department of Health and Human Services.
About the Authors
Heather Sandstrom is a principal research associate in the Center on Labor, Human Services, and
Population. Her research examines early childhood programs that support the development and well-
being of children and families, including home visiting and high-quality early care and education.
Cary Lou is a research associate in the Center on Labor, Human Services, and Population. His research
focuses on quantitative analysis and policies impacting children.
Sarah Benatar is a principal research associate in the Health Policy Center. Her research focuses on
maternal and child health, including perinatal health and access to care as well as early childhood
support and development.
Acknowledgments This brief was funded by the Administration for Children and Families’ Office of Planning, Research, and
Evaluation, in collaboration with the Health Resources and Services Administration. We are grateful to
them and to all our funders, who make it possible for Urban to advance its mission.
The views expressed are those of the authors and should not be attributed to the Urban Institute,
its trustees, or its funders. Funders do not determine research findings or the insights and
recommendations of Urban experts. Further information on the Urban Institute’s funding principles is
available at urban.org/fundingprinciples.

H O W S A T I S F I E D A R E H O M E V I S I T O R S W I T H T H E I R C A S E L O A D S ? 1 5
Suggested Citation: Sandstrom, Heather, Cary Lou, and Sarah Benatar. 2021. “How Satisfied Are Home
Visitors With their Caseloads? A National Look at Home Visitors’ Perspectives on Caseload Fit.” OPRE
Report #2021-194. Washington, DC: Office of Planning, Research, and Evaluation, Administration for
Children and Families, U.S. Department of Health and Human Services.
Sign-up for the OPRE Newsletter
Follow OPRE on Twitter @OPRE_ACF
Like OPRE on Facebook facebook.com/OPRE.ACF
Follow OPRE on Instagram @opre_acf
Connect on LinkedIn company/opreacf
500 L’Enfant Plaza SW Washington, DC 20024
www.urban.org
ABOUT THE URBAN INSTITUTE The nonprofit Urban Institute is a leading research organization dedicated to developing evidence-based insights that improve people’s lives and strengthen communities. For 50 years, Urban has been the trusted source for rigorous analysis of complex social and economic issues; strategic advice to policymakers, philanthropists, and practitioners; and new, promising ideas that expand opportunities for all. Our work inspires effective decisions that advance fairness and enhance the well-being of people and places.
Copyright © September 2021. Urban Institute. Permission is granted for reproduction of this file, with attribution to the Urban Institute.