how pro poor are productivity gains in agriculture? …
TRANSCRIPT

HOW PRO‐POOR ARE PRODUCTIVITY GAINS IN AGRICULTURE?
THE CASE OF THE NATIONAL AGRICULTURAL INVESTMENT PLAN OF BENIN
Harald Grethe, Jonas Luckmann, Khalid Siddig, Thierry KinkpeInternational Agricultural Trade and Development Group
Humboldt-Universität zu Berlin
23rd Annual Conference on Global Economic Analysis, Virtual Meeting, June 17-19, 2020

Background – Investments in Agriculture
Agricultural investments in developing countries: higher productivity/production lower food prices economic growth, poverty-alleviation (Breisinger et al. 2011)
Producers may be adversely affected: Cost reductions vs. decline in output prices Agricultural treadmill (Cochrane 1958; Evenson and Gollin 2003) Inelastic demand for staple crops Declining prices of more productive production factors More inequality (rural ↔ urban, poor ↔ rich)
Aim of this study: Analyzing distributive effects of increases in agricultural productivity and options to make such increases more pro-poor
Grethe, H., Luckmann, J., Siddig, K. and T. Kinkpe: How pro‐poor are productivity gains in agriculture?
2

Benin's Agriculture and the PNIASAN
Agriculture: 23% of GDP, 43% of labor force (World Bank 2020 a,b)
Important sector for Beninese economy and development Low productivity
National Plan for Agricultural Investment and Food and Nutritional Security (PNIASAN) 2017 – 2021 Main aim: boost agricultural productivity, reduce poverty Measures:
Better access to agricultural inputs Training & extension Improved infrastructure Mechanization
Financing: 2.7 billion USD Annually: 140 USD/ha, 5% of GDP in 2015 44% private funding 6% increase in overall government budget
Grethe, H., Luckmann, J., Siddig, K. and T. Kinkpe: How pro‐poor are productivity gains in agriculture?
3
Wikimedia, 2011

Yield, production and implicit area growth rates underthe PNIASAN, 2021 compared to 2011-15 average
Yield Production % %
Cotton 69.9 106.4Pineapple 35.5 63.0Rice 51.0 78.1Cashew 84.6 77.8Cassava 43.6 46.1Maize 11.4 42.3Tomato 21.1 25.0Pepper 15.2 25.0Potato 14.6 25.0Onion 13.7 25.0Okra 13.4 25.0Leafy vegetables 10.6 25.0Sum
Grethe, H., Luckmann, J., Siddig, K. and T. Kinkpe: How pro‐poor are productivity gains in agriculture?
4
(MAEP 2017, p.28)

5
Grethe, H., Luckmann, J., Siddig, K. and T. Kinkpe: How pro‐poor are productivity gains in agriculture?Grethe, H., Luckmann, J., Siddig, K. and T. Kinkpe: How pro‐poor are productivity gains in agriculture? (MAEP 2017, p.28)
Yield, production and implicit area growth rates underthe PNIASAN, 2021 compared to 2011-15 average
Yield Production Implicit Area% % % +1,000 ha
Cotton 69.9 106.4 21.5 55.6Pineapple 35.5 63.0 20.3 1.1Rice 51.0 78.1 17.9 11.7Cashew 84.6 77.8 -3.7 -12.8Cassava 43.6 46.1 1.8 4.7Maize 11.4 42.3 27.8 261.1Tomato 21.1 25.0 3.2 1.2Pepper 15.2 25.0 8.5 2.1Potato 14.6 25.0 9.1 0.0Onion 13.7 25.0 9.9 0.4Okra 13.4 25.0 10.2 1.5Leafy vegetables 10.6 25.0 13.0 1.4Sum 328.0

Modelling Approach – General Setup
Recursive dynamic CGE model based on Diao and Thurlow (2012)
2015 Social Accounting Matrix (SAM) for Benin:
4 primary factors: skilled labor, unskilled labor, capital, and land
10 household groups (rural and urban, each with five income quintiles)
38 production sectors, producing 38 commodities
Transdisciplinary setting
Grethe, H., Luckmann, J., Siddig, K. and T. Kinkpe: How pro‐poor are productivity gains in agriculture?
6

Modelling Approach – Closure Rules
Fixed exchange rate and foreign savings, flexible CPI
Investments fixed as share of total absorption, saving rates change uniformly (PNIASAN scenario: savings-driven investment)
Flexible government savings and fixed tax rates in the BAU (adjusted under PNIASAN and sensitivity analysis settings)
Fully employed factors, labor and land: mobile, capital: activity- specific (putty-clay)
Fixed world market prices
Grethe, H., Luckmann, J., Siddig, K. and T. Kinkpe: How pro‐poor are productivity gains in agriculture?
7
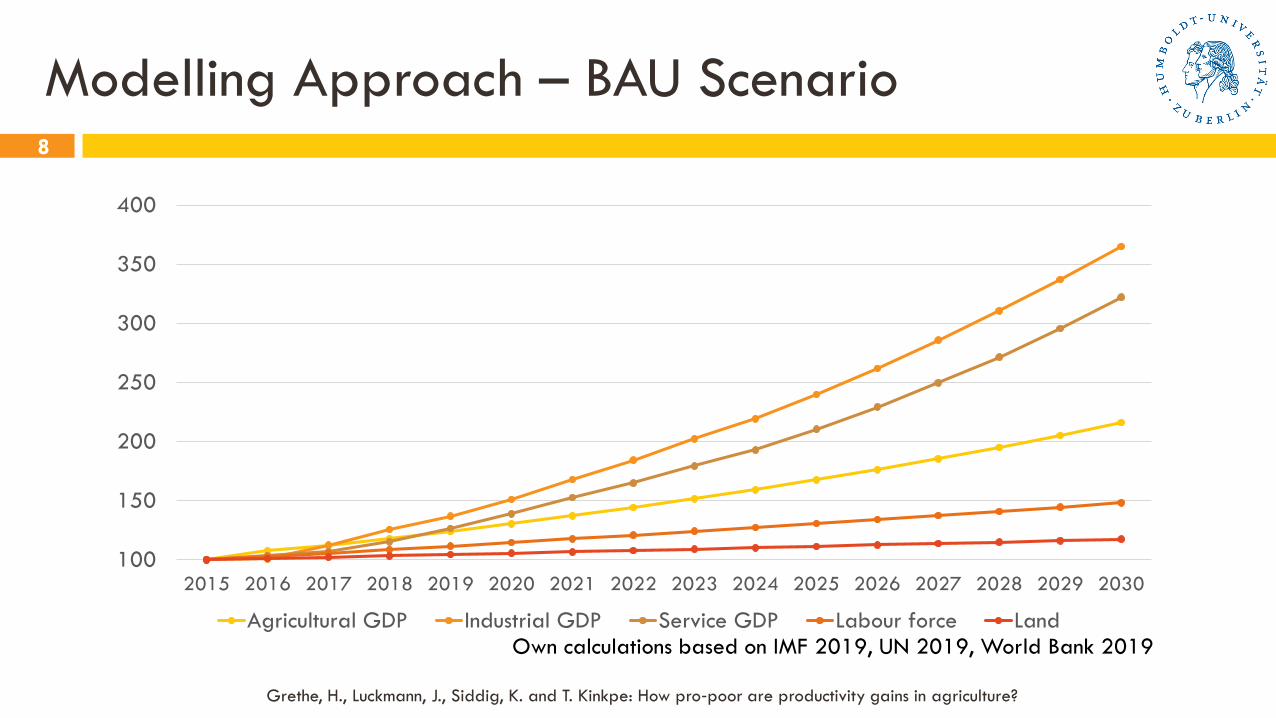
Modelling Approach – BAU Scenario
Grethe, H., Luckmann, J., Siddig, K. and T. Kinkpe: How pro‐poor are productivity gains in agriculture?
8
Own calculations based on IMF 2019, UN 2019, World Bank 2019
100
150
200
250
300
350
400
2015 2016 2017 2018 2019 2020 2021 2022 2023 2024 2025 2026 2027 2028 2029 2030
Agricultural GDP Industrial GDP Service GDP Labour force Land

Modelling Approach – PNIASAN Scenario9
Grethe, H., Luckmann, J., Siddig, K. and T. Kinkpe: How pro‐poor are productivity gains in agriculture?
%-point differences compared to BAU2017 2018 2019 2020 2021
Productivity increase of crops
Local maize 1.5 1.5 1.5 1.5 1.5Improved maize 10.1 10.1 10.1 10.1 10.1Rice 8.4 8.4 8.4 8.4 8.4Cassava 4.4 4.4 4.4 4.4 4.4Yam 1.5 1.5 1.5 1.5 1.5Pineapple 8.9 8.9 8.9 8.9 8.9Fresh vegetables and spices 1.5 1.5 1.5 1.5 1.5Other food crops 1.5 1.5 1.5 1.5 1.5Cotton 10.9 10.9 10.9 10.9 10.9Cashew 3.1 3.1 3.1 3.1 3.1Palm nut 1.5 1.5 1.5 1.5 1.5
Other crops for industry or export1.5 1.5 1.5 1.5 1.5
Productivity increase of animal products
Meat 5.6 5.6 5.6 5.6 5.6Milk 6.6 6.6 6.6 6.6 6.6Eggs and other husbandry 10.7 10.7 10.7 10.7 10.7
Investment in fishing/aquaculture sector 27.0 27.0 27.0 27.0 27.0
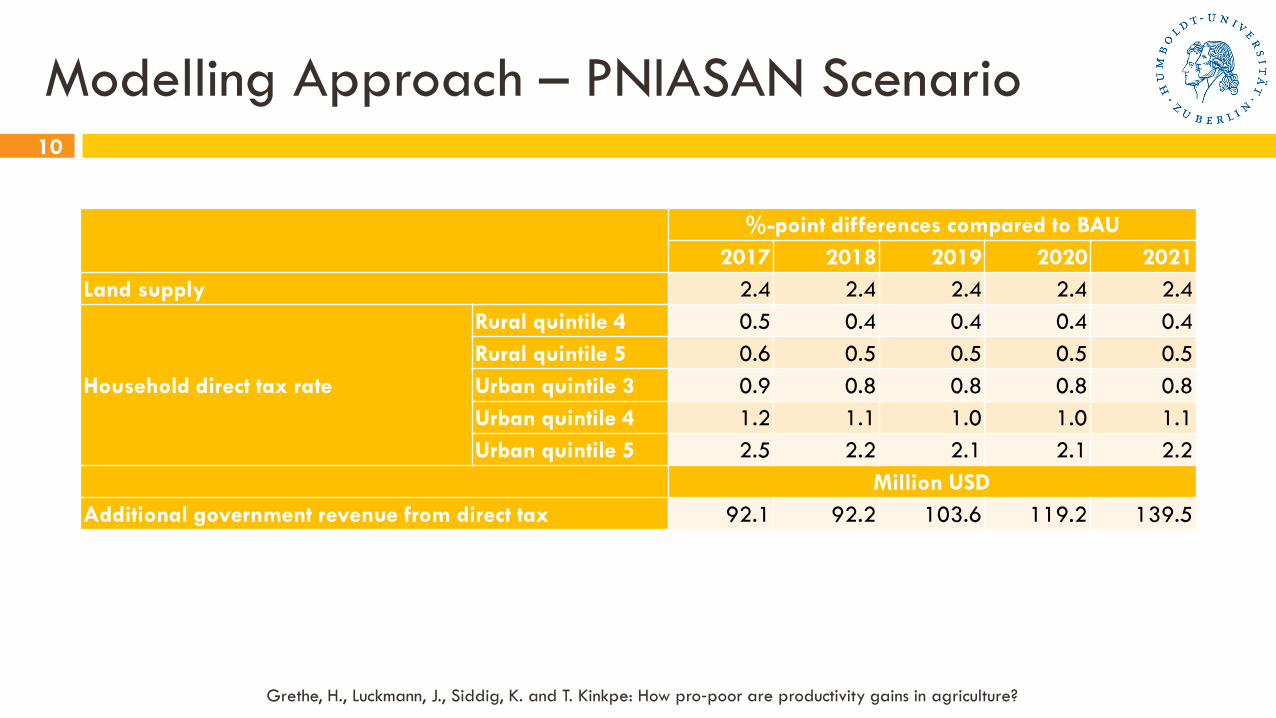
Modelling Approach – PNIASAN Scenario10
%-point differences compared to BAU2017 2018 2019 2020 2021
Land supply 2.4 2.4 2.4 2.4 2.4
Household direct tax rate
Rural quintile 4 0.5 0.4 0.4 0.4 0.4Rural quintile 5 0.6 0.5 0.5 0.5 0.5Urban quintile 3 0.9 0.8 0.8 0.8 0.8Urban quintile 4 1.2 1.1 1.0 1.0 1.1Urban quintile 5 2.5 2.2 2.1 2.1 2.2
Million USDAdditional government revenue from direct tax 92.1 92.2 103.6 119.2 139.5
Grethe, H., Luckmann, J., Siddig, K. and T. Kinkpe: How pro‐poor are productivity gains in agriculture?

Effects of the PNIASAN: Agriculture
17.1%
-15.1%
21.4%
-20%
-15%
-10%
-5%
0%
5%
10%
15%
20%
25%
Agricultural production Average agricultural prices Agricultural GDP
Diff
eren
ce in
202
1 co
mpa
red
to B
AU
scen
ario
GDP at constant prices(at current prices almostconstant)
Grethe, H., Luckmann, J., Siddig, K. and T. Kinkpe: How pro‐poor are productivity gains in agriculture?
11
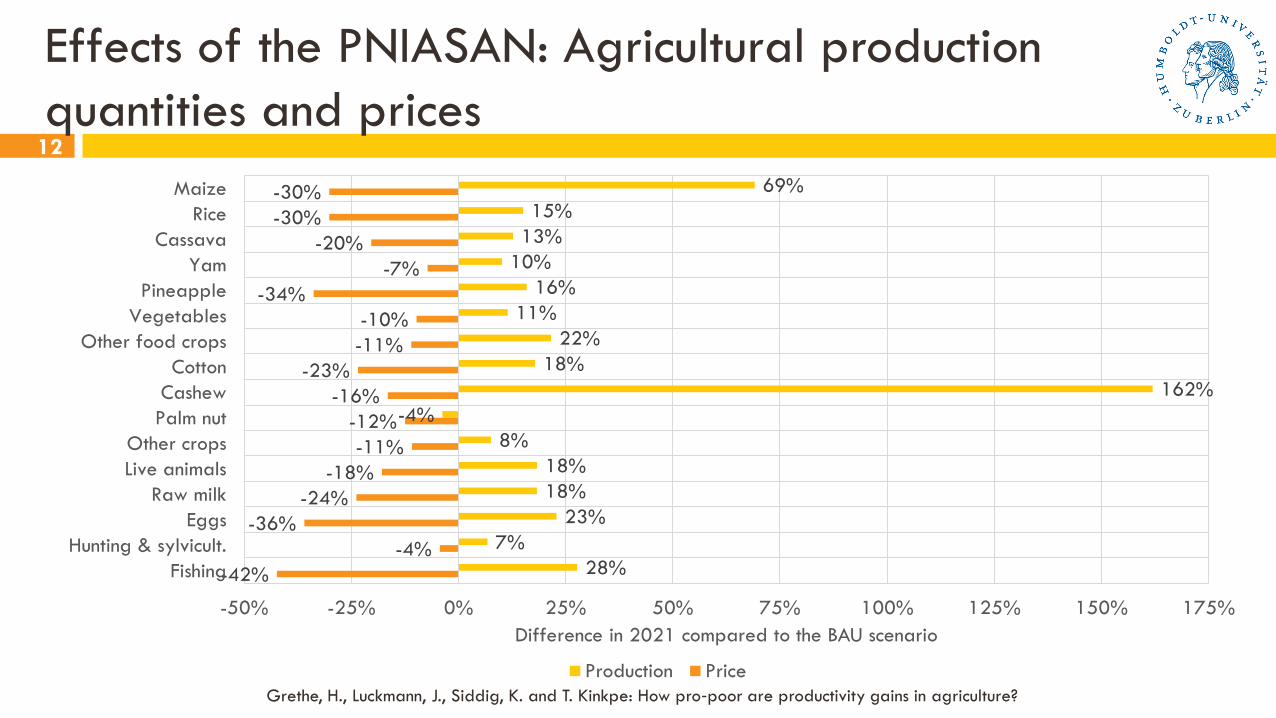
Effects of the PNIASAN: Agricultural production quantities and prices
69%15%
13%10%
16%11%
22%18%
162%-4%
8%18%18%
23%7%
28%
-30%-30%
-20%-7%
-34%-10%-11%
-23%-16%
-12%-11%
-18%-24%
-36%-4%
-42%
-50% -25% 0% 25% 50% 75% 100% 125% 150% 175%
MaizeRice
CassavaYam
PineappleVegetables
Other food cropsCotton
CashewPalm nut
Other cropsLive animals
Raw milkEggs
Hunting & sylvicult.Fishing
Difference in 2021 compared to the BAU scenario
Production PriceGrethe, H., Luckmann, J., Siddig, K. and T. Kinkpe: How pro‐poor are productivity gains in agriculture?
12

Effects of the PNIASAN: Macroeconomic indicators
4.7%
5.0%
6.0%
4.4%
0% 1% 2% 3% 4% 5% 6% 7%
Total absorption
GDP at factor cost
Total exports
Total imports
Difference in 2021 compared to the BAU scenario
Grethe, H., Luckmann, J., Siddig, K. and T. Kinkpe: How pro‐poor are productivity gains in agriculture?
13

Effects of the PNIASAN: household income
-2.9%
1.3%
3.4%
4.5%5.3%
1.4%
3.1%3.8% 3.9%
5.8%
4.4%
3.5%
5.1%
-4%
-2%
0%
2%
4%
6%
Q1 Q2 Q3 Q4 Q5 Q1 Q2 Q3 Q4 Q5 All Rural Urban
Rural Urban Aggregated
Diff
eren
ce in
202
1 co
mpa
red
to th
e BA
U
scen
ario
Grethe, H., Luckmann, J., Siddig, K. and T. Kinkpe: How pro‐poor are productivity gains in agriculture?
14

Effects of the PNIASAN: factor prices
2.4%
8.1%10.1%
-20.8%-25%
-20%
-15%
-10%
-5%
0%
5%
10%
15%
Unskilled labor Skilled labor Capital Land
Diff
eren
ce in
202
1 co
mpa
red
to th
e BA
U
scen
ario
Grethe, H., Luckmann, J., Siddig, K. and T. Kinkpe: How pro‐poor are productivity gains in agriculture?
15

Effects of the PNIASAN: Household welfare
1.3%
3.9%
5.4% 5.4%4.9% 4.9% 4.8%
4.1%
3.4%2.9%
3.8%
4.8%
3.2%
0%
1%
2%
3%
4%
5%
6%
Q1 Q2 Q3 Q4 Q5 Q1 Q2 Q3 Q4 Q5 All Rural Urban
Rural Urban Aggregated
Equi
vale
nt v
aria
tion
in %
of
base
line
inco
me
in 2
021
• The rural benefit more than the urban• The rural rich benefit more than the rural poor• The urban poor benefit more than the urban rich
Grethe, H., Luckmann, J., Siddig, K. and T. Kinkpe: How pro‐poor are productivity gains in agriculture?
16

Alternative: Funding via sales tax17
Grethe, H., Luckmann, J., Siddig, K. and T. Kinkpe: How pro‐poor are productivity gains in agriculture?
0%
1%
2%
3%
4%
5%
6%
Q1 Q2 Q3 Q4 Q5 Q1 Q2 Q3 Q4 Q5 All Rural Urban
Rural Urban Aggregated
Equi
vale
nt v
aria
tion
in %
of
base
line
inco
me
in 2
021
Direct tax Sales tax

Effect until 2030 – Household welfare
-1%
0%
1%
2%
3%
4%
5%
6%
7%
8%
9%
2015 2017 2019 2021 2023 2025 2027 2029Equi
vale
nt v
aria
tion
in %
of
base
line
inco
me
Rural Q1 Rural Q2 Rural Q3 Rural Q4 Rural Q5Urban Q1 Urban Q2 Urban Q3 Urban Q4 Urban Q5
Grethe, H., Luckmann, J., Siddig, K. and T. Kinkpe: How pro‐poor are productivity gains in agriculture?
18

Conclusions and policy implications
Two policy implications:1. Increasing productivity in agriculture and enhancing land supply leads to
lower agricultural and food prices Desirable from a consumer perspective but problematic for agricultural producers Facilitate agricultural supply from Benin to be processed as well as traded
especially to neighboring countries Market information systemsRoadsReduced red tape in export…
Grethe, H., Luckmann, J., Siddig, K. and T. Kinkpe: How pro‐poor are productivity gains in agriculture?
19

Conclusions and policy implications
2. While the productivity and land targets of the PNIASAN make the economy of Benin better off, their effects are not automatically pro-poor:
With respect to income, richer households benefit more than poorer households
Looking at total welfare, the effects are not pro-poor in rural areas
Complementary policies/measures needed in order to reach more balanced growth
Grethe, H., Luckmann, J., Siddig, K. and T. Kinkpe: How pro‐poor are productivity gains in agriculture?
20

Conclusions and policy implications
Pro-poor plan implementation Targeting of measures at low-income farm households:Extension servicesMicro-financeAccess to inputs
As high income households benefit most in absolute terms from the plan: Involve them overproportionally in the funding Collect taxes from a wider tax base and focus tax collection on high income
groups
Grethe, H., Luckmann, J., Siddig, K. and T. Kinkpe: How pro‐poor are productivity gains in agriculture?
21

Thank you for your attention!
Grethe, H., Luckmann, J., Siddig, K. and T. Kinkpe: How pro‐poor are productivity gains in agriculture?

Sources
Breisinger, C., Diao, X., Thurlow, J., & Hassan, R. M. A., 2011. Potential impacts of a green revolution in Africa-the case of Ghana. Journal of International Development, 23, (1, 82–102). doi:10.1002/jid.1641
Cochrane, W. W., 1958. Farm Prices: Myth and Reality. St. Paul: University of Minnesota Press. Diao, X. and J. Thurlow, 2012. A Recursive Dynamic Computable General Equilibrium Model. In Strategies and Priorities for African Agriculture:
Economywide Perspectives from Country Studies, edited by X. Diao, J. Thurlow, S. Benin, and S. Fan. pp. 17-50. Washington D.C.: International Food Policy Research Institute.
Evenson, R. E., & Gollin, D., 2003. Assessing the impact of the green revolution, 1960 to 2000. Science, 300, (5620, 758–762). doi:10.1126/science.1078710
FAO, 2019. FAOSTAT, http://www.fao.org/faostat/en/#home, accessed in September 2019. IMF, 2019. World Economic Outlook Database (International Monetary Fund (IMF), Ed.), Washington D.C.
https://www.imf.org/external/pubs/ft/weo/2019/02/weodata/index.aspx. MAEP, 2017. Plan Stratégique de Développement du Secteur Agricole (PSDSA) 2025 et Plan National d’Investissements Agricoles et de Sécurité
Alimentaire et Nutritionnelle PNIASAN 2017 – 2021. Ministry of Agriculture, Husbandry and Fishing. Cotonou, Benin. http://www.agriculture.gouv.bj/IMG/pdf/psdsa_2025_et_pniasan_2017_-_2021_version_finale_adoptee.pdf
United Nations, 2019. United Nations World Population Prospects: The 2019 Revision. Custom data acquired via website. New York: Department of Economic and Social Affairs, Population Division. Consulted on 05/09/2019. https://population.un.org/wpp/
World Bank, 2019. World Development Indicators. World Bank, accessed on 05/09/2019. https://databank.worldbank.org/source/world-development-indicators.
World Bank, 2020a. Benin Country Data accessed on 03/03/2020. https://data.worldbank.org/country/benin World Bank, 2020b. World Band DataBank Indicators, accessed on 03/03/2020. https://data.worldbank.org/indicator
Grethe, H., Luckmann, J., Siddig, K. and T. Kinkpe: How pro‐poor are productivity gains in agriculture?
23