how (not) to build support for climate policy?
TRANSCRIPT

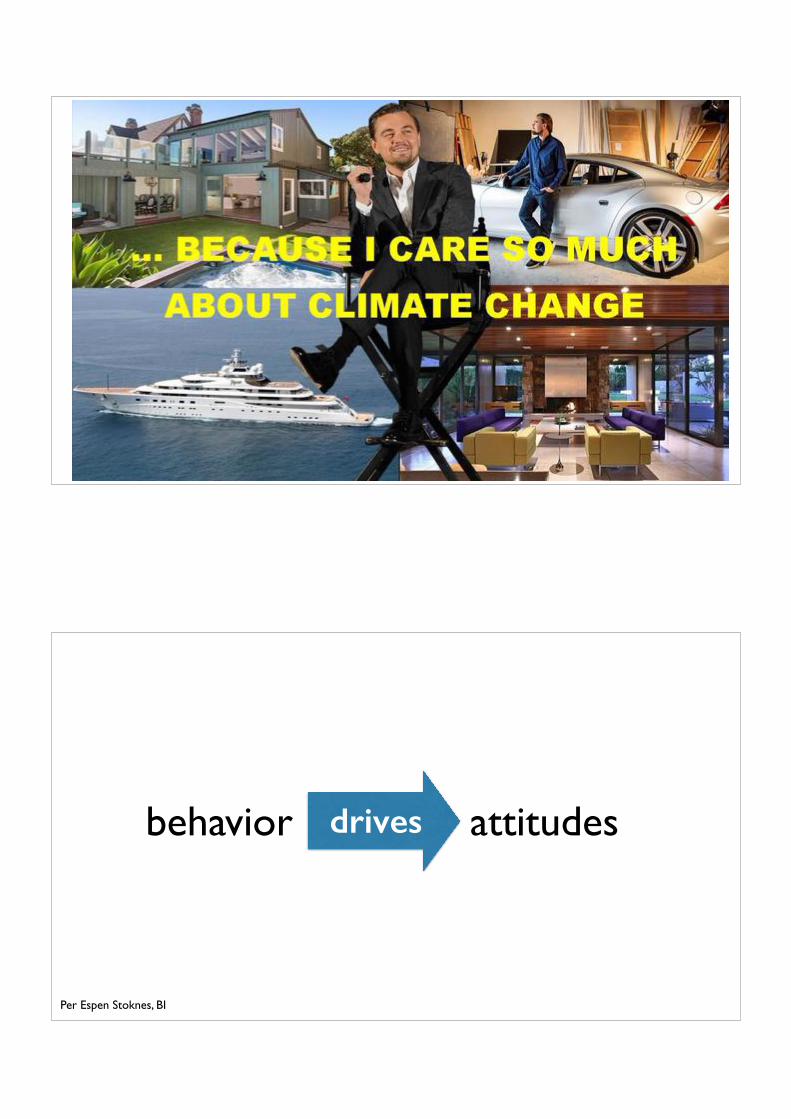
Per Espen Stoknes, BI
How (not) To Build Support for
Climate Policy?
Per Espen StoknesDirector
Center for Green GrowthNorwegian Business School
on twitter: @estoknes
Per Espen Stoknes, BI
The Climate Situation Summary for Policymakers
19
Figure SPM.7 | CMIP5 multi-model simulated time series from 1950 to 2100 for (a) change in global annual mean surface temperature relative to 1986–2005, (b) Northern Hemisphere September sea ice extent (5-year running mean), and (c) global mean ocean surface pH. Time series of projections and a measure of uncertainty (shading) are shown for scenarios RCP2.6 (blue) and RCP8.5 (red). Black (grey shading) is the modelled historical evolution using historical reconstructed forcings. The mean and associated uncertainties averaged over 2081−2100 are given for all RCP scenarios as colored verti-cal bars. The numbers of CMIP5 models used to calculate the multi-model mean is indicated. For sea ice extent (b), the projected mean and uncertainty (minimum-maximum range) of the subset of models that most closely reproduce the climatological mean state and 1979 to 2012 trend of the Arctic sea ice is given (number of models given in brackets). For completeness, the CMIP5 multi-model mean is also indicated with dotted lines. The dashed line represents nearly ice-free conditions (i.e., when sea ice extent is less than 106 km2 for at least five consecutive years). For further technical details see the Technical Summary Supplementary Material {Figures 6.28, 12.5, and 12.28–12.31; Figures TS.15, TS.17, and TS.20}
6.0
4.0
2.0
−2.0
0.0
(o C)
4232
39
historicalRCP2.6RCP8.5
Global average surface temperature change(a)
RC
P2.6
R
CP4
.5
RC
P6.0
RC
P8.5
Mean over2081–2100
1950 2000 2050 2100
Northern Hemisphere September sea ice extent(b)
RC
P2.6
R
CP4
.5
RC
P6.0
R
CP8
.5
1950 2000 2050 2100
10.0
8.0
6.0
4.0
2.0
0.0
(106 k
m2 )
29 (3)
37 (5)
39 (5)
1950 2000 2050 2100
8.2
8.0
7.8
7.6
(pH
uni
t)
12
9
10
Global ocean surface pH(c)
RC
P2.6
R
CP4
.5
RC
P6.0
R
CP8
.5
Year
SPM
inspiration?
or a big yawn?
Source: IPCC AR5

Per Espen Stoknes, BI
Per Espen Stoknes, BI
Norwegian Responses 1989-2013
0
10
20
30
40
50
60
70
80
90
100
1989 1991 1993 1995 1997 1999 2001 2003 2005 2007 2009 2011 2013
VerySomeLittleNot
“How concerned are your for greenhouse effects and climate change?”
Source: Ottar Hellevik, 2014, Ipsos MMI’s Survey ‘Norsk Monitor’,

Per Espen Stoknes, BI
US Responses 1989-20144 TH INK ING
So climate change enlightenment was fun while it lasted, as George Monbiot noted.7 But it is now limp and dead.
So dead, in fact, that it is moving backward. Surprisingly, the level of concern among both laypeople and politicians has actually been decreas-ing—especially in many wealthy countries—over the last two decades.8 This is the opposite of what you’d expect from scientific reasoning. As figure 1.1 shows, in the United States concern about climate change has weakened overall since 1989, despite that the objective data have been strengthened with thousands of studies and reports. The same holds true for other rich nations. Norway, a rich oil country, shows an even stronger decline in concern (see figure 1.2). Some psychological studies even point to a strange relationship between global warming denial and speaking English in particular, since the United States, UK, and Australia are coun-tries with waning levels of average public concern.9
In a 2013 study, the Pew Research Center asked people around the world to rate their concern over climate change, financial instability, and
0
10
20
30
40
50
60
70
80
90
100
1989 1991 1993 1995 1997 1999 2001 2003 2005 2007 2009 2011 2013 2014
A great dealFair amountA littleNot worried/no opinion
Year
Perc
ent
Figure 1.1. US responses to the question, “How much do you personally worry about the greenhouse effect or global warming?” Source: Gallup, 2014.
VerySomeLittleNot
0
10
20
30
40
50
60
70
80
90
100
1989 1991 1993 1995 1997 1999 2001 2003 2005 2007 2009 2011 2013Year
Perc
ent
Figure 1.2. Norwegian responses to the question, “How concerned are you for green-house effects and climate change?” Source: Ipsos MMI, 2014.
WhatWeThinkAbout_pgcx.indd 4 2/4/15 3:53 PM
“How much do you personally worry about
the greenhouse effect or global
warming?”
Source: Gallup, 2014.
Per Espen Stoknes, BI
How concerned are you about…
0
10
20
30
40
50
60
70
US EU Asia Latin America Global
Climate Change Int’l financial instability Islamic extremism
46%
Source: Pew Research Centre, Climate Change and Financial Instability Seen as Top Global Threats, June 24, 2013
% “very concerned”

Per Espen Stoknes, BI
International Responses 2014
“The climate change we’re currently seeing is largely the result of human activity.”
Source: Ipsos MORI Global Trends, 2014
Per Espen Stoknes, BI
the climate paradox
Source: Cook et al 2013, http://www.skepticalscience.com/Leiserowitz,, Maibach et al (2015). Climate change in the American mind: March, 2015.

Per Espen Stoknes, BI
Why? Certain
ty
Concern
➡5 Defenses➡5 Solutions

Per Espen Stoknes, BI
climate message
Per Espen Stoknes, BI
Distant in time …
Summary for Policymakers
19
Figure SPM.7 | CMIP5 multi-model simulated time series from 1950 to 2100 for (a) change in global annual mean surface temperature relative to 1986–2005, (b) Northern Hemisphere September sea ice extent (5-year running mean), and (c) global mean ocean surface pH. Time series of projections and a measure of uncertainty (shading) are shown for scenarios RCP2.6 (blue) and RCP8.5 (red). Black (grey shading) is the modelled historical evolution using historical reconstructed forcings. The mean and associated uncertainties averaged over 2081−2100 are given for all RCP scenarios as colored verti-cal bars. The numbers of CMIP5 models used to calculate the multi-model mean is indicated. For sea ice extent (b), the projected mean and uncertainty (minimum-maximum range) of the subset of models that most closely reproduce the climatological mean state and 1979 to 2012 trend of the Arctic sea ice is given (number of models given in brackets). For completeness, the CMIP5 multi-model mean is also indicated with dotted lines. The dashed line represents nearly ice-free conditions (i.e., when sea ice extent is less than 106 km2 for at least five consecutive years). For further technical details see the Technical Summary Supplementary Material {Figures 6.28, 12.5, and 12.28–12.31; Figures TS.15, TS.17, and TS.20}
6.0
4.0
2.0
−2.0
0.0
(o C)
4232
39
historicalRCP2.6RCP8.5
Global average surface temperature change(a)
RC
P2.6
R
CP4
.5
RC
P6.0
RC
P8.5
Mean over2081–2100
1950 2000 2050 2100
Northern Hemisphere September sea ice extent(b)
RC
P2.6
R
CP4
.5
RC
P6.0
R
CP8
.5
1950 2000 2050 2100
10.0
8.0
6.0
4.0
2.0
0.0
(106 k
m2 )
29 (3)
37 (5)
39 (5)
1950 2000 2050 2100
8.2
8.0
7.8
7.6
(pH
uni
t)
12
9
10
Global ocean surface pH(c)
RC
P2.6
R
CP4
.5
RC
P6.0
R
CP8
.5
Year
SPM

Per Espen Stoknes, BI
in space …CLIMATE CHANGE 2013The Physical Science Basis
Summary for Policymakers
INTERGOVERNMENTAL PANEL ON climate change
Per Espen Stoknes, BI
Distant socially…
Credit. http://inapcache.boston.com/

Per Espen Stoknes, BI
in responsibility …
Per Espen Stoknes, BI
Psychological distancing➡ low feeling of personal risk ➡ reduces sense of urgency➡ low issue priority
Sources: Leiserowitz, 2005, “American Risk Perceptions: Is Climate Change Dangerous?”. Risk Analysis, 25(6), 1433–1442. http://doi.org/10.1111/j.1540-6261.2005.00690.xSpence and Pidgeon, 2010, “Framing and communicating climate change: The effects of distance and outcome frame manipulations,” Global Environmental Change, vol. 20, no. 4, pp. 656–667, Oct..Spence, Poortinga, and Pidgeon, 2012, “The Psychological Distance of Climate Change: Psychological Distance of Climate Change,” Risk Analysis, vol. 32, no. 6, pp. 957–972,.

Per Espen Stoknes, BI
Per Espen Stoknes, BI
Too much doom?
18
leads to habituation, avoidance & stereotypingSource: O’Neill and S. Nicholson-Cole, “‘Fear Won’t Do It” Science Communication, vol. 30, no. 3, pp. 355–379, Jan. 2009. Painter, J. (2013). Climate change in the media. I. B. Tauris.

Per Espen Stoknes, BI 19Credit: www.AuthenticSustainability.com
Per Espen Stoknes, BI

Dissonance when actions conflict with knowledge
I fly and drive. Everyone does the same. Our governments want to pump more oil and
gas, so it can’t be that serious...
Photo Credit : plantronicsgermany
Per Espen Stoknes, BI
attitudesdrivesbehavior

Per Espen Stoknes, BI
“The alarmists on global warming got a problem because the science doesn't back them up. “Ted Cruz
Photo Credit: http://i.huffpost.com/gen/1305857/images/o-TED-CRUZ-facebook.jpg Quote: “Late Night with Seth Meyers” interview, March 17, 2015

both to know and not-to-know
Denial a “social contract”
better: “resistance”?
Norgaard, 2011, Living in Denial
Per Espen Stoknes, BI

Per Espen Stoknes, BI
Cars - express identity
Per Espen Stoknes, BI
“Rollin’ Coal”: identity-protective cognition
Source: https://www.youtube.com/watch?v=hsC0kLNSLAQ

Per Espen Stoknes, BI
defending one’s identity
Per Espen Stoknes, BI
identity overrides knowledge
Figure 6. Differential item function: belief in climate change. Predicted probabilities derived via Monte Carlo simulation based on logistic regression. Predicted probabilities for “Liberal Democrat” and “Conservative Republi-can” determined by setting Left_right scale at -1 and +1 SD, respectively. Colored bars reflect 0.95 confidence in-tervals.
That was the case in the sample to which I administered the OSI assessment instrument. The global-warming “belief” item was bifurcated, and subjects were treated as having responded correctly if they indicated both that “there [is] solid evidence that the average temperature on earth has been getting warmer over the past few decades” and that “the earth is getting warmer mostly because of human activi-ty such as burning fossil fuels” as opposed to “mostly because of natural patterns in the earth's environ-ment.” As was so for the NSF Indicator version of Evolution, the probability of a correct response was largely unresponsive to differences in OSI and close to 50% at both -1 and +1 standard deviations from the mean. In addition, the probability of a correct response varied dramatically in relation to political out-looks. At the OSI mean, an individual who identified as “Liberal” and “Democrat” had an 80% likeli-hood of answering the question correctly, whereas one who identified as “Conservative” and “Republi-can” had only a 20% likelihood of doing so. Indeed, the likelihood of a correct response sloped down-ward for individuals who were conservative Republicans: at +1 SD, the predicted probability of a correct answer was only 15% for such individuals (as opposed to 90% for liberal Democrats).
Thus, to say there is “no relationship” between science comprehension and belief in climate change would be incorrect. There is a very large one. But the nature of it depends on identity. Those whose cultural commitments predispose them to be concerned about climate change become even more so as their level of science comprehension increases. Those whose commitments predispose them to be less concerned become all the more skeptical. Far from increasing the likelihood that individuals will agree that human activity is causing climate change, higher science comprehension just makes the re-sponse that a person gives to a “global warming belief” item an even more reliable indicator of who he or she is.
4. Is identity-protective cognition irrational? The idea that “disbelief” in global warming is attributable to low “science literacy” is not the only
explanation for public conflict over climate change that fails to survive an encounter with actual evidence. The same is true for the proposition that such controversy is a consequence of “bounded rationality.”
Indeed, the “bounded rationality thesis” (BRT) is probably the most popular explanation for pub-lic controversy over climate change. Members of the public, BRT stresses, rely on “simplifying heuris-
0.1
.2.3
.4.5
.6.7
.8.9
1
-2.5 -2 -1.5 -1 -.5 0 .5 1 1.5 2 2.5
0.1
.2.3
.4.5
.6.7
.8.9
1
-2.5 -2 -1.5 -1 -.5 0 .5 1 1.5 2 2.5
Ordinary Science Intelligence Ordinary Science Intelligence
Prob
abili
ty o
f cor
rect
resp
onse
Prob
abili
ty o
f cor
rect
resp
onse
“[Is the earth] getting warmer (a) mostly because of human activity such as burning fossil fuels or (b) mostly because of natural patterns in the earth’s environment?”
LiberalDemocrat
ConservativeRepublican
- 12-
D. M. Kahan, 2014“Climate Science Communication and the Measurement Problem,” Advances in Political Psychology, vol. in press,.

Per Espen Stoknes, BI
Per Espen Stoknes, BI
How to break through the barriers ?
or maybe by-pass them?

PerEspenStoknes,BI
We’ve enough reports
Per Espen Stoknes, BI
The New Climate
Communication toolbox
36

Per Espen Stoknes, BI
Five new strategies
SocialSimple
Supportive
Story
Signals
Per Espen Stoknes, BI
Five new strategies
SocialSimple
Supportive
Story
Signals

PerEspenStoknes,BI
Make it social and local!
Use: • Social norms• Social media• Local issues• Flow & glow
Per Espen Stoknes, BI
1. Use Power of Social Networks:
rooftop solar is contagious
Sources: Graziano, M., & Gillingham, K. (2014). Spatial patterns of solar photovoltaic system adoption: the influence of neighbors and the built environment. Journal of Economic Geography. http://doi.org/10.1093/jeg/lbu036

Per Espen Stoknes, BI
1. Use Power of Social Networks:
Experimental studies to reduce domestic power consumption by comparing four groups:
1. for the sake of sustainability and the earth2. for future generations3. because it is profitable4. because your neighbours do it
Sources: Using Peer Pressure as a Tool to Promote Greener Choices by Richard Conniff: Yale Environment 360: Allcott, H., Social norms and energy conservation, J. Public Econ. (2011), doi:10.1016/j.jpubeco.2011.03.003
Per Espen Stoknes, BISources: Using Peer Pressure as a Tool to Promote Greener Choices by Richard Conniff: Yale Environment 360:
Allcott, H., Social norms and energy conservation, J. Public Econ. (2011), doi:10.1016/j.jpubeco.2011.03.003
“People don’t just want to conserve energy, they want to be acknowledged for conserving energy.” Robert Cialdini, Arizona S.U.
1. Use Power of Social Norms

Per Espen Stoknes, BI
Per Espen Stoknes, BI
Green Sports Alliance
• More peer messengers
• Use local-patriotism: LA vs SF, Texas vs California
• Make eco-teams out of existing groups and networksPhoto by Annie Marie Musselman
Per Espen Stoknes, BI
Five new strategies
SocialSimple
Supportive
Story
Signals

Per Espen Stoknes, BI
2. Simple to choose climate friendly
Default two-sided printing:
15% less paper
If applied to all US offices 800 ktCO2e/year
equvialent to 150.000 cars
Sources: Egebark and M. Ekström, “Can Indifference Make the World Greener?,” IFN Working Paper No. 975, 2013.Pichert and Katsikopoulos, “Green defaults: Information presentation and pro-environmental behaviour,” J. of
Environmental Psychology, vol. 28, no. 1, pp. 63–73, Mar. 2008
Per Espen Stoknes, BICheck to not pay carbon credits

Per Espen Stoknes, BI
Five new strategies
SocialSimple
Supportive
Story
Signals
Per Espen Stoknes, BI
“Expensive!”“Job-killing!!”

Per Espen Stoknes, BI
Health!photo credit: Parrchristie via Flickr
photo credit: deadlyvibe.com.au
Per Espen Stoknes, BI 50
solarroadways?
Source: Solarroads
endless opporunities!

Per Espen Stoknes, BI
Five new strategies
SocialSimple
Supportive
Story
Signals
0%
10%
20%
30%
40%
50%
60%
70%
80%
90%
It's real? It's us? Worried? Solvable?
82
44
32
186
5252
63
Yes No
The ‘Big 4’ Climate Beliefsit’s real — it’s us — it’s bad — it’s solvable
Source: Leiserowitz & al, Yale PCCC, Mar 2015, N=1,263, p. 27, 29, 30 ,39

Per Espen Stoknes, BI
When faced with hell, we sell the dream
green growth is smart!
54
Photo: Timothy Allen

Per Espen Stoknes, BI
Why smart, green growth?• Because it’s profitable
• Because it’s more expensive to continue as today
• The stone age didn't end because of lack of stones
• The petroleum age won’t end because of lack of oil, but…
• “Thank you, oil - It’s been good.”
$€
£
55
Ecological footprint
Quality of life
Tell stories of deep transformation

Per Espen Stoknes, BI
Five new strategies
SocialSimple
Supportive
Story
Signals
PerEspenStoknes,BI Source:KirstiBlikeng&al,MMGreenGrowthBI
CO2 footprint in the bank statement?

Per Espen Stoknes, BI
151514 TOMRA ANNUAL REPORT 201414
TOMRA’s mission is to create sensor-based solutions for optimal resource productivity so that its products and services contribute to better use of the world’s limited resources.
Over the past few years, TOMRA has implemented a number of initiatives to reduce its direct emissions as part of meeting its objective of reducing eco-intensity by 25% by the end of 2015. As previously reported and shown in the graphs (below), TOMRA has already achieved the target for energy consump-tion and greenhouse gas emissions. This was achieved partly through specific investments to reduce fuel consumption in TOMRA’s vehicle fleet, and partly from a move out of carbon-intensive activities.
TOMRA’s environmental targets are part of its Corporate Responsibility programme. As mentioned earlier in the report, targets for the new programme that will start in 2016 will be developed and agreed by the management team and Board of Directors during 2015.
In recent years TOMRA has invested significantly in new facilities in a number of locations.
In 2014 the new customer centre for TOMRA Sorting – Recycling in Germany was officially opened. The centre represents best practice in recycling management as it is built from sustainable materials and is extremely energy efficient, which is also a reflection of TOMRA’s values. As a result, TOMRA is proud that the new facility has been officially designated a ‘green building’. Qualifying criteria for this
BARR
ELS
OIL
/ V
A
TON
NES
CO
2/
VA
Energy Consumption per unit of value added*
2009 2010 2011 2012 2013 2014 2015 2009 2010 2011 2012 2013 2014 2015
25
20
15
10
5
0
60
50
40
30
20
10
0
Greenhouse Gas Emissions from Operationsper unit of value added*
TA
RG
ET
TA
RG
ET
BARR
ELS
OIL
/ V
A
TON
NES
CO
2/
VA
Energy Consumption per unit of value added*
2009 2010 2011 2012 2013 2014 2015 2009 2010 2011 2012 2013 2014 2015
25
20
15
10
5
0
60
50
40
30
20
10
0
Greenhouse Gas Emissions from Operationsper unit of value added*
TA
RG
ET
TA
RG
ET
accreditation in Rhineland-Palatinate include energy use at least 25 percent lower than the already strict German standard along with requirements covering water efficiency, use of materials and resources, and ecological standards inside the building. TOMRA’s new production and distribution facility in Slovakia, which also opened in 2014, is equipped with state-of-the-art technology and incorporates sustainable solutions such as LED lighting. This facility will become the main production centre for TOMRA Sorting Solutions and it also meets strict environ-mental standards, which again is in line with TOMRA’s mis-sion to lead the resource revolution.
This year’s climate change account shows a slight reduction in direct emissions (scope 1 + 2) from TOMRA’s operations. This is mainly due to lower diesel consumption, a result of initiatives in the United States started in 2012. The complete environ-mental report is available on the following pages.
ENVIRONMENTALREVIEW
Companies doing their fair share
59 Source: Tomra Corporate Responsibility report, 2012
-5%/yr
Per Espen Stoknes, BI
34
2.3.4 Green growth
As described in the sections above, Denmark and Copenhagen’s levels of GDP and GVA are among the highest in the OECD. At the same time, the growth in the city’s population and economy has been delivered whilst simultaneously improving the city’s environmental performance and transitioning to a low carbon economy, as shown below (Figure 2.10). This has resulted in Copenhagen being one of the greenest and most economically productive metropolitan regions in the world.
Figure 2.10 Sustainable growth in Copenhagen Copenhagen’s metropolitan economy, measured as Gross Value Added (GVA) per capita grew by nearly 25% from 1994 to 2010. Over the same period, greenhouse gas (GHG) emissions per capita in the City of Copenhagen decreased by 40% from 7.31 tCO2e to 4.38 tCO2e. (GHG emissions are for transport, heat, and electricity only. Comparable GHG data for the metropolitan scale were not available. Variables are indexed: 1993 = 100.
Sources: Brookings Institution, LSE Cities et al. 2010; City of Copenhagen 2013b; COWI 2013
60
80
100
120
140
1994
1996
1998
2000
2002
2004
2006
2008
2010
Inde
xed
grow
th
GVA per capita
GHG emissions per capita
The long term trend is compelling and demonstrates that sustainable growth – the decoupling of economic growth and negative environmental impacts – can be delivered effectively in the long term. Part of Copenhagen’s success in reducing environmental impacts is likely to be due to its high levels of wealth, which have driven environmental improvements. However, as Copenhagen’s urban environment continues to become greener, the economic benefits should also increase. As the city’s ‘green appeal’ grows, it should attract more international students, skilled professionals and innovative businesses that help maintain Copenhagen’s high level of human capital, productivity growth and inward investment in a virtuous cycle of green growth. This green appeal nests within Copenhagen’s broad strategy of using quality of life as a driver for economic growth, as many features of the two are synonymous.
Other indicators suggest Copenhagen’s green economic success relative to other cities. In 2009, the Siemens European Green City Index assessed and compared European cities based on their environmental performance. Copenhagen ranked first due to its particularly strong record on CO2 emissions, air quality, buildings, transport and overall environmental governance. Coupled with one of the highest levels of GVA per capita, Copenhagen is indeed a green economy leader (Figure 2.11).
Smart City Green Growth
60
5% per year 1994-2010
Source: The New Clmate Economy Report, 2015
CopenhagenDenmark

Per Espen Stoknes, BI
Conclusions: Are humans inevitably short-term?
61
1.Rational facts are insufficient to create lasting engagement
2.Humans will act for the long-term when conducive conditions are in place: social norms, supportive frames, simple actions, stories and signals
3.Individual actions do not solve the climate problem, but do build bottom-up support for structural change
Per Espen Stoknes, BI
on twitter: @estoknes62
“Outstanding Academic Title of 2015”
American Libraries Association