how much does new york city now spend on children’s services? · clive belfield emma garcia...
TRANSCRIPT

Clive BelfieldEmma Garcia
October 2011
How Much Does New York City Now Spend on Children’s Services?
Campaign Educational Equity
The for
Teachers College, Columbia University
# 3 Providing Comprehensive Educational Opportunity to Low-Income Students


Clive BelfieldEmma Garcia
October 2011
How Much Does New York City Now Spend on Children’s Services?
Campaign Educational Equity
The for
Teachers College, Columbia University
# 3 Providing Comprehensive Educational Opportunity to Low-Income Students

The Campaign for Educational Equity is a nonprofit research and policy center at Teachers College, Columbia University, that champions the right of all children to meaningful educational opportunity and works to define and secure the full range of resources, supports, and services necessary to provide this opportunity to disadvantaged children. Founded in 2005 by educational law scholar and advocate Michael A. Rebell, the Campaign pursues systems change through a dynamic, interrelated program of research, legal analysis, policy development, coalition building, curriculum development, and advocacy dedicated to developing the evidence, policy models, curricula, leadership, and collaborations necessary to advance this agenda at the federal, state, and local levels.
The Campaign for Educational Equity is funded primarily through foundation grants. The content produced and disseminated by the Campaign – or by its collaborators with funding from the Campaign — does not necessarily reflect the views of Teachers College, its trustees, administration, or faculty.
Campaign for Educational Equity Teachers College, Columbia University 525 W. 120th Street, Box 219 New York, NY 10027
Phone: 646-745-8282 Fax: 646-745-8292 Email: [email protected] Website: www.equitycampaign.org
This series includes the following reports:
Part 1. A Legal Framework
by Michael A. Rebell
Part 2. How Much Does It Cost?
by Richard Rothstein, Tamara Wilder, and Whitney Allgood
Part 3. How Much Does New York City Now Spend on Children’s Services?
by Clive Belfield and Emma Garcia
Part 4. What Are the Social and Economic Returns?
by Clive Belfield, Fiona Hollands, and Henry Levin
Part 5. A Proposal for Essential Standards and Resources
A Report of the Task Force on Comprehensive Educational Opportunity
by Michael A. Rebell and Jessica R. Wolff
This report should be cited as follows:Belfield, C., & Garcia, E. (2011). Providing comprehensive educational opportunity to low income students: How much does New York City now spend on children’s services? New York, NY: Campaign for Educational Equity, Teachers College, Columbia University
Achievable Affordable + Providing Comprehensive Educational
Opportunity to Low-Income Students

Table of Contents Executive Summary . . . . . . . . . . . . . . . . . . . . . . . . . . . . . . . . . . . . . . . . . . . . . . . . . . . . . . . . . . 1
1. Introduction . . . . . . . . . . . . . . . . . . . . . . . . . . . . . . . . . . . . . . . . . . . . . . . . . . . . . . . . . . . . . . . . 2
2. Method . . . . . . . . . . . . . . . . . . . . . . . . . . . . . . . . . . . . . . . . . . . . . . . . . . . . . . . . . . . . . . . . . . . . 2
3. Template Fiscal Map . . . . . . . . . . . . . . . . . . . . . . . . . . . . . . . . . . . . . . . . . . . . . . . . . . . . . . . . 4
4. Fiscal Expenditures for Children in New York City . . . . . . . . . . . . . . . . . . . . . . . . . . . . . . 8
4.1 Fiscal Expenditures by Source and Level . . . . . . . . . . . . . . . . . . . . . . . . . . . . . . . . . . . . 9
4.2 Fiscal Expenditures by Government Agency . . . . . . . . . . . . . . . . . . . . . . . . . . . . . . . .10
4.3 Fiscal Expenditures by Child Disadvantage . . . . . . . . . . . . . . . . . . . . . . . . . . . . . . . . .12
4.4 Fiscal Expenditures by Domain . . . . . . . . . . . . . . . . . . . . . . . . . . . . . . . . . . . . . . . . . . .13
4.5 Fiscal Expenditures by Age of Child . . . . . . . . . . . . . . . . . . . . . . . . . . . . . . . . . . . . . . .15
4.6 Fiscal Expenditures by Purpose . . . . . . . . . . . . . . . . . . . . . . . . . . . . . . . . . . . . . . . . . . .16
5. Sensitivity Analysis . . . . . . . . . . . . . . . . . . . . . . . . . . . . . . . . . . . . . . . . . . . . . . . . . . . . . . . . 17
6. Conclusions . . . . . . . . . . . . . . . . . . . . . . . . . . . . . . . . . . . . . . . . . . . . . . . . . . . . . . . . . . . . . .18
References . . . . . . . . . . . . . . . . . . . . . . . . . . . . . . . . . . . . . . . . . . . . . . . . . . . . . . . . . . . . . . . . .20
Appendix 1. Web-Based Information Sources . . . . . . . . . . . . . . . . . . . . . . . . . . . . . . . . . . .23
Appendix 2. Programs and Services by New York City Department . . . . . . . . . . . . . . . .25
Appendix 3. Expenditures by Programs by New York City Department . . . . . . . . . . . . .28
Tables
Table 1. Total Expenditures on Children in New York City . . . . . . . . . . . . . . . . . . . . . . . . . . . . . 8
Table 2. Expenditures on NYC Children by Source . . . . . . . . . . . . . . . . . . . . . . . . . . . . . . . . .10
Table 3. Public Expenditures on NYC Children by NYC Government Agency . . . . . . . . . . .11
Table 4. Expenditures on NYC Children by Family Disadvantage . . . . . . . . . . . . . . . . . . . . . .12
Table 5. Expenditures on NYC Children by Domain . . . . . . . . . . . . . . . . . . . . . . . . . . . . . . . . .14
Table 6. Expenditures on NYC Children below 185% of the Federal Poverty Level . . . . . . .15
Table 7. Expenditures on NYC Children by Age . . . . . . . . . . . . . . . . . . . . . . . . . . . . . . . . . . . .16
Table 8. Expenditures on NYC Children by Recipient, Intent, and Commitment . . . . . . . . . 17
FiguresFigure 1. Fiscal Map of Spending on Children . . . . . . . . . . . . . . . . . . . . . . . . . . . . . . . . . . . . . . 5


THE CAMPAIGN FOR EDUCATIONAL EQUITY 1
Executive Summary1
This report sets out to estimate the total annual expenditures on children in New York City and to create a “fiscal map” to detail them. This fiscal map describes these expenditures according to a series of clas-sifications, including age of child (early childhood, elementary, and high school); source of funding (public, tax-related, and philanthropic); level of government (city, state, and federal); and child disadvantage as measured using poverty criteria. The goal of the map, derived from analysis of budgetary data and official sources, is to depict expenditures on children in a clear and comprehensive fashion.
Based on data for 2010, we estimate that annual fiscal spending for the average child in New York City is $15,630, which, adjusting for inflation, represents a slight decline over the period since 2005. For all 2.02 million city children, this amounts to a total of $31.5 billion, Most of that money is spent on schooling; expenditures for developmental supports for children, such as early childhood care and education and out-of-school time programs, as well as medical care and critical programs such as homeless services, amount to less than one-third of the total. Over the period, the pattern of expenditures changed significantly.
Our fiscal map also shows that the primary source of funding for New York City children is the city government, which provides almost half of the direct funding for programs for children. The state is the next largest source. Direct expenditures by the federal government are nearly equaled by the resource implications of rules on tax-related expenditures (such as the Earned Income Tax Credit). Notably, the map does show that public investments are disproportionately allocated toward disadvantaged children. Whereas average annual direct public spending per child is $13,340 (net of tax-related expenditures and philanthropic contributions), spending for a child who lives in a household with an income that is less than 185% of the federal poverty level is $19,280. However, we caution that the full amount of this spending gap should not be interpreted as a redistribution to benefit those with the greatest needs: it includes spending on rehabilitative programs and the juvenile justice system, for example, and includes very little spending that might be classed as preventive.
1 The authors acknowledge generous support from Ethan Berman and Fiona Hollands, and are grateful to the Robert Sterling Clark Foundation for support of this research. The authors also appreciate comments and advice from John Albert, Fiona Hollands, Andrew Goodman, Henry Levin, Michael Rebell, Matthew Reilly, and Jessica Wolff.

HOW MUCH DOES NYC NOW SPEND ON CHILDREN’S SERVICES?2
1. Introduction
Public expenditures on services for children represent an important investment in the future of our nation (Belfield & Levin, 2007). They also help to make good on the American dream that all children will have an equal opportunity to succeed in life. But these expenditures come from many sources and in many forms. For this reason, it is difficult to know how much is actually being spent for these services in total, much less whether the amount is optimal or whether alternative spending patterns might be more effective or efficient. Obtaining a basic understanding of public expenditures is therefore an important first step for any public dialogue or policy debate about whether more (or less) might be invested and for what types of services. With respect to government expenditures, at least at the federal level, existing evidence suggests that chil-dren are shortchanged. Infants and toddlers, for example, despite accounting for 4.2% of the population and despite substantial evidence that early investments are critical (Heckman, 2008), received only 2.1% of federal domestic spending in 2007 (Macomber, Isaacs, Vericker, Kent, & Johnson, 2007). While the pro-portion of total federal spending on Social Security, Medicare, and Medicaid has more than doubled over time, the proportion spent on children has fallen (Isaacs, Vericker, Macomber, & Kent, 2009). Demographic pressures and rising health care commitments may exacerbate this trend in the future, further jeopardizing investments in children.
The goal of this report is to create a fiscal map of nonfamily spending on children who live in New York City. This map accounts for federal, New York State, and New York City government expenditures on city children from prenatally to age 18 and includes philanthropic expenditures and tax offsets. The map allows for estimates of the amount of money currently being spent on services for children from low-income families (as well as the proportion allocated generally to all children). In addition, the map classifies expenditures according to a set of key, policy-relevant categories.
The report is structured as follows. The next section (Section 2) describes the research method, which yields a template for the fiscal map in Section 3. This template may be applied across any locality to yield a better understanding of how resources are allocated for children. In Section 4, we present the results from our investigation for New York City. In Section 5, we test our assumptions and the robustness of the findings, as well as methodological challenges in conducting this mapping exercise, through a sensitivity analysis. Finally, in Section 6, we summarize our findings.
2. Method
The research method was designed both to derive a template map for understanding public or nonfamily spending on children and to calculate the actual dollar amounts spent. To achieve both objectives, three approaches were combined.
First, we reviewed the existing literature on fiscal expenditures on children. In this analysis we refer to the group aged 0-18, which includes all born children up to their final expected year of high school (17 going on 18). Our analysis covers two years: the most recent year, 2010, and 2005, which was selected as the peak of the economic cycle and as the year for which we would have the most comparable data. The litera-ture is extensive and includes academic research, web-based data sets, and literature from policy agencies. The literature provided information on how existing studies classify spending amounts, as well as data on the actual amounts spent. A full list of web-based sources, divided into government and general sources, is catalogued in Appendix 1.
Second, we scrutinized data and documentation from government agencies in New York City or with direct relevance for New York City. These documents provide extensive detail on expenditures, but not generally in the form appropriate for creating or calculating a fiscal map. The primary source document from

THE CAMPAIGN FOR EDUCATIONAL EQUITYHOW MUCH DOES NYC NOW SPEND ON CHILDREN’S SERVICES? 3
which much data were derived is the Budget Function Analysis (BFA), created by the Office of the Mayor of the City of New York. The BFA is an annual document, and we used the June 2009 and June 2010 ver-sions. It includes a detailed breakdown of the each agency’s budget by function or intervention, and, for the most recent year, the sources of funding for the interventions and programs are also reported. How-ever, the BFA has only been available since 2006, and it does not include information on all city agencies. For agencies and departments that are not included in the Budget Function Analysis document (notably the Department of Education), we collected information from the Supporting Schedules documents from FY2006 to FY2010 and the Expense Revenue Contract (June 2010).2 We also relied on publications and web content from the Independent Budget Office. Finally, the BFA does not include federal or state spend-ing that is not channeled through city agencies (such as Early Head Start). These items were added on a case-by-case basis.3
Our fiscal map also includes expenditures by philanthropic organizations. Unfortunately, aggregate data on philanthropic funding is not available in a centralized database or on an annual basis. Also, even where in-formation on philanthropies within New York City is available, this information does not distinguish between grants made within the city and those made to agencies outside the city.4 The best source of information available is a 2002 study by the Foundation Center that reports on funding by New York metropolitan area charities and by location and type of donation. This information is likely to be an underestimate of total philanthropic expenditures: it is not a complete catalog of spending; and it does not capture the growth in charitable activities since 2002.
Third, we conducted interviews with key personnel with policy experience in the individual areas of government provision.5 These interviews served multiple purposes. Interviewees were asked about possible alternative sources for information on spending, transfers between agencies and levels of government, and potential problems or inaccuracies in the best available data. This information was also used to set up our sensitivity analysis. In addition, after we had initially derived the fiscal map, we asked the interviewees to comment on its feasibility and utility.
Each of these approaches was applied iteratively, in light of our preliminary findings. This allowed us to revise the template map and to identify key issues for our sensitivity analysis (Section 5 below).
This fiscal map analysis is an extension and updating of prior work (e.g., Flores, Douglas, & Ellwood, 1998). It is also intended to complement recent work by Rothstein, Wilder, and Allgood (2011) and Wilder, Allgood, and Rothstein (2008), who have examined the optimal amount of spending needed to narrow the achievement gap for low-income children, and Connors-Tadros and Silloway (2008), who have looked at spending more broadly for New York State. Similar descriptive exercises have been performed for some investments (e.g., health, see Elixhauser et al., 2001; Simpson et al., 2005) and at the federal level (Isaacs et al., 2009). Some states have also calculated their own “children’s budget” (e.g., Ohio), and there are ag-gregated estimates up to the year 2004 across each of the 50 states (Billen et al., 2007). However, we are
2 These departments are Education; Health and Hospitals Corporation; City University; and Public Libraries (as well as other departments that have zero spending on children).
3 The BFA does not include any federal or state expenditures in New York City that were not routed through city agencies. Thus, it likely understates spending on children. Where possible, we included federal expenditures that we knew were not included in the BFA (such as Early Head Start). To check the extent of the understatement, we compared our estimates of federal and state spending included in the BFA with comparable total federal and state expenditures for New York City from Isaacs et al. (2009) and Billen, Boyd, Dadayan, and Gais (2007), respectively. Our per-child estimates of federal spending were $2,895 in 2005 and $2,950 in 2010; these compare with $3,040 and $3,350 per child respectively in Isaacs et al. (2009). A similar discrepancy is also found at the state level. Given the differences in data availability and terminology, we therefore believe that, although our figures are understatements, the magnitude is not significant.
4 See, e.g., www.guidestar.org.
5 The authors appreciate the contributions of the following interviewees: Joydeep Roy, senior economist, Independent Budget Office; George Sweeting, executive director, Independent Budget Office; Jennifer March-Joly, executive director, Citizens’ Committee for Children; Nancy Kolben, executive direc-tor, Center for Children’s Initiatives.

HOW MUCH DOES NYC NOW SPEND ON CHILDREN’S SERVICES?4
not aware of any recent investigation of expenditures for children in New York City or one that accounts for and classifies all nonfamily expenditures from all sources.
One limitation of our approach (and of those by other researchers) is that it uses budgetary documenta-tion to calculate spending. From an economic perspective, the best approach would be to measure the “op-portunity cost” of resource investments in children (i.e., as compared with other investment options). Budget statements may be inaccurate for several reasons. First, they only count the direct spending of a particular agency: this may not correspond to the market value of a particular program (e.g., medical or teachers’ aides may be volunteers who are not compensated with a full market wage). Second, annual budget statements may not accurately capture changes in the capital component of government services (e.g., many public schools in New York City are very old but their depreciated value is uncertain).6 Third, budget statements do not capture resource use by persons outside the budget (e.g., families may spend privately on health care and education in ways that raise the productivity of government services). Finally, budget statements do not include the economic consequences of raising taxes to pay for government services (the so-called “deadweight loss”). But perhaps the most important caveat is that expenditures do not necessarily reflect need: we are not able to calculate what should be spent, only what is spent. To emphasize, this is a map of expenditures, not of costs or investments. That is, these money amounts are a combination of expenditures on investments and preventive services (such as education), on maintenance services (e.g., public assis-tance), and social protection services (e.g., juvenile justice programs).
3. Template Fiscal Map
The template of our fiscal map is depicted in Figure 1. The goal of the map is to describe the full set of public expenditures on children, both in total and per child, as well as to classify these expenditures according to policy-relevant features. This template may be applied to any spending locality, not just New York City, and we believe it has relevance in a broader context. The key features of the map are set out here.
Age. The amount of expenditures will vary according to the age of the child (up to age 18). A substantial literature argues for investments in early childhood (such as preschool), on the grounds that early invest-ments both act as a foundation for future investments (Heckman, 2008) and serve a preventive role against future need (Conyers, Reynolds, & Ou, 2003). However, many services are mainly provided for or targeted toward older children (e.g., the juvenile justice system) and, of course, children’s health needs vary according to their age (Gold & Sonfield, 2001; Jack, Lear, & Klerman, 1988; Newacheck, Wong, Galbraith, & Hung, 2003; Phillips & Adams, 2001).
Child poverty status. Fiscal expenditures on children are motivated both as investments to meet effi-ciency goals and as redistributions to meet equity goals. As such, some government services are intended to enhance all children’s development, and others are for children who lack opportunities because of family circumstance (Currie & Gruber, 1996). For this map, we divide spending into amounts allocated to all children and amounts only allocated to children who reside in households with incomes below 185% of the federal poverty level. This division allows us to identify the extent to which disadvantaged children are receiving additional public resources and so to evaluate the likely equalizing influence of government programs (Grissmer & Flanagan, 2004; on health spending, see Fossett & Thompson, 2005; Wong, Galbraith, Kim, & Newacheck, 2005). Where possible, we distinguish between eligibility and actual case-loads by poverty status, recognizing that access to services is far from complete and targeting may be
6 Capital expenditures are generally paid over a shorter period than the life of an asset in terms of their bond service. Therefore, assets that are already “paid” for, but still in use, are provided at no cost on current accounting statements. Annual debt service for newer buildings will be accounted for at greater than the value of the services provided in a year and will be overstated. Since the capital stock in New York City is generally old, this suggests an understatement of the cost of capital.

THE CAMPAIGN FOR EDUCATIONAL EQUALITY 5
Intent Recipient Commitment Domain
Figure 1. Fiscal Map of Spending on Children
Administration
Child AgeLevel of
GovernmentChild Poverty
Agencies and Programs
Year Source
Human Services
Pediatric care
Tax related Before/after/ summer school
Private donors K-12 education
Other health
Social
City Housing Early childhood care and education
Youth/High school
Ages 14-18
Prenatal/Early childhood Ages 0-4
<185% federal poverty level
Public Federal Education General or routine
Child Mandatory Prenatal care2005
State Health Preventive Family DiscretionaryElementary/ Middle school
Ages 5-13
Family support>185% federal poverty level
2010

HOW MUCH DOES NYC NOW SPEND ON CHILDREN’S SERVICES?6
imperfect (e.g., on dental health, see Hughes, Duderstadt, Soobader, & Newacheck, 2005; on early child-hood, see Adams, Tout, & Zaslow, 2007; on substitute care, see Sanchez, Gomez, & Davis, 2010; on foster care, see English, Morreale, & Larsen, 2003). This may be the most important of the classifications we describe, but, as we outline below, these figures must be interpreted cautiously.
Year. It is important to identify the fiscal year in which the expenditures are made. (The effects of infla-tion are adjusted for using a price index.) Government expenditures are a function of its revenues, such that expenditures will be lower when economic conditions are poor. But need also varies according to the economic cycle: in a downturn more families will rely on public health services and other government programs (Carroll, Corman, Noonan, & Reichman, 2007; Lykens & Jargowsky, 2002). For New York City, based on interviews and economic data, we have identified the peak of the most recent economic cycle as 2005 and the current trough as 2010 (the most recent fiscal year). This peak-trough map should encompass the full extent of volatility both in total and per-child expenditures. Ideally, data for previous decades would provide a broader historical context, although budgetary reporting is often inconsistent across longer time horizons.
Source. This refers to the distribution between spending by public (government), tax-related, and private philanthropic sources. (No accounting for private family expenditures is made.)7 We refer to public spend-ing as direct spending and the other two categories as “indirect.” There are several types of “tax-related” sources of funds: the refundable portion of tax credits for families with zero tax liability; tax expenditures (reductions in a family’s tax liability based on having children); and the dependent exemption for children (see Isaacs, Steuerle, Rennane, & Macomber, 2010). Tax-related sources are only included if children are necessary in order to qualify for them. It may be objected that these tax credits may not be spent entirely or directly on children. Nevertheless, it is appropriate to include them in this fiscal map: these credits represent resources available to families with children, and when eligibility regulations or credit amounts are changed, there are genuine economic consequences. Finally, philanthropic organizations may play an important role in providing programs to address urgent needs or where public assistance or programs are not available. These organizations also provide economic resources to families that may be affected by government policies. Importantly, all these sources are linked: government provision may be viewed as a substitute for tax breaks or subsidies to allow for private choices, and where need is especially strong and government capacity inadequate, philanthropic organizations may intervene to provide services directly.8 Thus, all these sources may either displace or complement each other (e.g., Blumberg, Dubay, & Norton, 2000; Sheils & Wolfe, 1992).
Level of government. Within the government source, each level of government must be differentiated. As with funding sources, there is a potential for the separate levels of government to displace or comple-ment expenditures by each other; government budgets typically show large intergovernmental transfers (Cassetty & Hutson, 2005; Landon, McMillan, Muralidharan, & Parsons, 2006). Three other factors make this distinction salient. First, the tax base varies across government levels. Second, rules governing chil-dren’s eligibility for services also vary depending on the level of government. And, third, different levels of government may be differentially effective and efficient at providing particular services (e.g., for health programs, see Baughman, 2007).
Government agency. To describe more fully the purposes of spending on children, we disaggregate spending according to each government agency. (Where possible and appropriate, we disaggregated
7 Specifically, we do not account for private schooling in any form: we do not include private tuition fees paid by parents, nor do we directly include either philanthropic expenditures or tax-related exemptions on private schools or scholarships. (The external philanthropic expenditures are likely to be small; most philanthropic expenditures are from enrolled families and serve as proxies for tuition payments.)
8 In addition, philanthropic expenditures are a combination of private spending and tax deductions. Absent the tax deductions, government would have a larger tax base and so may be able to offer more services publicly.

THE CAMPAIGN FOR EDUCATIONAL EQUITYHOW MUCH DOES NYC NOW SPEND ON CHILDREN’S SERVICES? 7
spending to an even more refined level of programs within departments; this information is given in Ap-pendices 2 and 3.) At this departmental level, it is possible to apportion spending across more refined categories, including the following.
Recipient. Although much funding for children is in direct programs targeted to a specific need, there are also related programs that may help children indirectly. Hence, the map distinguishes the recipients of the expenditure as either the child per se or his/her family. This distinction is useful because some ser-vices — particularly basic ones such as housing and food — are not allocated directly to children (Breysse et al., 2004; Fertig & Reingold, 2007; Ma, Gee, & Kushel, 2008). Moreover, these services might have substantial, perhaps countervailing effects on children’s opportunities (e.g., if they increase mothers’ labor market participation, see Blau & Tekin, 2007; Edin, 1995; Maume, 1991).
Intent. This classification indicates the extent to which services are explicitly preventive of future spend-ing (regardless of age). Otherwise, spending is classified as general or routine, to include universal ser-vices as well as services to address emergent needs. This classification is most salient for health care programs: immunizations, for example, might save on future spending to treat health conditions.
Commitment. One key aspect of funding for children’s programs is that they may be sensitive to eco-nomic and political conditions. Hence, we investigate whether programs are mandatory (entitlements that are indexed to inflation) or discretionary (subject to periodic reauthorization and not indexed to inflation).
Domain. We include a set of nine domains to which all spending may be allocated. These domains are purposively related to developmental goals for children and are adapted from a classification utilized by Rothstein, Wilder, and Allgood (2011); other researchers use slightly different classifications (see Isaacs et al., 2009). As given in Figure 1, the first five domains – as per Rothstein et al. (2011) – are (1) prenatal care; (2) family supports; (3) early childhood care and education; (4) pediatric care; and (5) before-, after-, and summer school (i.e., expanded learning programs that are wrapped around the traditional school day and year).9 To provide a more comprehensive map, we also include (6) K-12 educational spending; (7) health-related spending (other than pediatric care); (8) social spending (general programs to aid child de-velopment); and (9) administrative spending (to account for resources that are used to organize services for children, but are not actual services). In addition to providing basic information about how the funding is spent, classifying expenditures by domain may help to illuminate whether spending is optimal in relation to developmental goals.10 Also, by far the largest public investment in children is via the school system: the use of multiple domains allows us to see where the balance of the investment is allocated.
By setting out the features of the map, we are able to evaluate the relative contributions from each area (Cohen, 2003). Unless all the elements of programs are identified, it is not possible to provide an overall assessment of spending (see Juszczak, Melinkovich, & Kaplan, 2003; Lear, 2002; Russ, Garro, & Halfon, 2010). As articulated clearly by Currie (2008), because investments in children are fragmented, that is, divided among many programs, cuts in services that may appear slight in isolation may be signifi-cant in the aggregate; overall effects cannot be easily detected by looking at separate programs. The map helps chart resource changes across all areas.
9 Separating prenatal care from pediatric care is challenging. Prenatal care includes expenditures on the age-eligible food stamp recipients, WIC partici-pants, and Medicaid expenditures.
10 We recognize that each domain is not truly independent of the others in its effects on development and that, even if spending in one domain appears suboptimal, it is still necessary to find effective programs to justify further investments.

HOW MUCH DOES NYC NOW SPEND ON CHILDREN’S SERVICES?8
4. Fiscal Expenditures for Children in New York City
We begin by reporting aggregate expenditures for children in New York City; in subsequent sections we describe in more detail the breakdown of these expenditures across elements of the fiscal map. The figures are expressed in total, as well as per child, and are expressed in 2010 dollars. Over the period since 1992, the child population of New York State has been relatively stable at around 6% of the total population (Bil-len et al., 2007). In New York City, there were 2.02 million children aged 0-18 in 2010 (with 2.03 million in 2005), which equates to just over 100,000 children in each age cohort.11 Of these children, 46% live in families with incomes that are below 185% of the federal poverty line.12 In presenting per-child figures below, we divide total expenditures by the appropriate number of children, a number that varies according to the classification. Straightforwardly, aggregate expenditures are divided by 2.02 million to derive the aver-age spending per child. However, total expenditures on children below the 185% poverty threshold are di-vided by the estimated 920,000 in that category to derive the average spending per disadvantaged child.13 For spending on education, for example, we divide by the number of school-aged children (adjusting for the children in private schooling).14 Therefore, both aggregate totals and expenditures per child are informative of the resource investments in children.
As shown in Table 1, total expenditures on children in New York City in 2010 were $31.5 billion. This represents a real (adjusted for inflation) change of less than 0.5% from 2005, when total expenditures were slightly higher at $31.6 billion. Of this 2010 total, $26.9 billion (85%) was direct public expenditures and $3.6 billion (11%) was indirect tax-related expenditures; the remaining $1 billion (4%) was philanthropic spending by private donors. Despite approximately zero real growth in spending since 2005, there has been a slight change in the distribution of spending. Specifically, direct public expenditures grew by 2.4% over the period, while tax-related contributions fell by 21%.
Per child aged 0-18, average expenditures in New York City in 2010 were $15,630. This includes all
11 For demographic data, see http://cps.ipums.org/cps-action/variables/group/demog. For federal poverty line, see U.S. Census Bureau, 2005.
12 See http://internal.usa.ipums.org/usa-action/variables/POVERTY. We do not account for families who move above and below this threshold intermit-tently. We do adjust for differences in the poverty rate across children’s ages, but the rate varies only slightly across ages.
13 Therefore, to calculate the disparity between spending on disadvantaged children and spending on nondisadvantaged children, it is necessary to reca-librate the aggregate figure per child using only nondisadvantaged children.
14 Otherwise, we do not adjust for private school enrollments.
Table 1. Total Expenditures on Children in New York City Children
2005 2010
Total expenditures (millions) $31,636 $31,518
Public $26,248 $26,897
Tax related $4,388 $3,621
Private donors $1,000 $1,000
Children aged 0-18 (millions) 2.03 2.02
Average expenditures per child $15,610 $15,630
Sources: Population figures from U.S. Census Bureau, American Community Survey. For expenditure amounts, see Appendix 3; Bureau of Labor Statistics, Consumer Price Index, www.bls.gov/cpi/cpi_dr.htm. Notes: All values in 2010 dollars. Per child figures reported to nearest ten dollars.

THE CAMPAIGN FOR EDUCATIONAL EQUITYHOW MUCH DOES NYC NOW SPEND ON CHILDREN’S SERVICES? 9
children aged up to and including 18, not just school-aged children. These expenditures are almost identical to those in 2005, as the number of children was only slightly lower in 2010.
4.1 Fiscal Expenditures by Source and LevelFiscal expenditures are sourced directly through public provision via federal, state, and local agencies. In addition, there are indirect resource allocations through tax-related and philanthropic contributions. Disag-gregated figures for these separate categories are reported in Table 2.
The city is the primary source of direct public expenditures on children. In 2010, New York City spending on children was $11.6 billion, down significantly from $12.7 billion in 2005; these amounts represent 43% and 48% of total public spending, respectively. New York State is the source for just over one-third of total public spending, with the state contribution growing significantly over the period from $9.2 billion to $9.9 bil-lion. Finally, in 2010, the federal contribution – at $5.4 billion – represents one-fifth of total public spending; this contribution also grew the fastest, increasing by 23% since 2005.15
In addition to this public provision, there are also tax-related sources of support for children. We include three federal child-related tax provisions as calculated by Isaacs et al. (2010), as well as the dependent exemption. These are as follows:
The Child Tax Credit. Since 2001, the credit is worth $1,000 per child; in addition, it is partially refund-able for families earning over a threshold. This income threshold was reduced in 2008 to $8,500 and in 2009 to $3,000. These reductions increased the numbers of families eligible for a refund.
The Earned Income Tax Credit. The size of this refundable credit depends on the number of children in the family and family income.
Child and Dependent Care Tax Credit. This nonrefundable credit reimburses families for a percentage of their child care expenses, up to $3,000 per child ($6,000 per family).
All three credits are designed to target tax relief to lower-income families, although the incidence of the credit (i.e., which families receive it) depends on several key features: the extent to which the family pays taxes (the dependent care tax credit is not refundable and so does not benefit families who do not pay taxes); the size of the family; and the claimant rates.
Deriving estimates from Isaacs et al. (2010), we calculate these tax-related amounts as being valued at $3.6 billion in 2010, down slightly from $4.3 billion in 2005. Combining refundable and nonrefundablve components, these amounts are sourced in the proportions of 44% through the Child Care Tax Credit; 31% through the Earned Income Tax Credit; and 23% through the dependent exemption. (We do not count these tax-related expenditures as being “funded” by the federal government, although in 2005 they were comparable in size to the federal government’s direct expenditures.)
Finally, there are philanthropic sources of funds. As noted above, we rely on survey data on New York metropolitan charities conducted by the Foundation Center in 2002. This survey provides data specifically on New York City charitable expenditures, categorized by type of expenditure. For the latter, we count only expenditures on education, health, and human services; these amount to just over one-third of all charitable giving in New York City, and we weight them across the population. To avoid making arbitrary assumptions about the growth of philanthropic donations, we apply the same figure for both 2005 and 2010.
15 It should be noted that the 2010 federal contribution includes expenditures through the American Reinvestment and Recovery Act of 2009. As these amounts are not separately itemized, it is not possible to identify this spending.

HOW MUCH DOES NYC NOW SPEND ON CHILDREN’S SERVICES?10
4.2 Fiscal Expenditures by Government AgencyTotal public expenditures on children are derived from the reports of a range of government departments. We identified 16 agencies that allocate funds directly to programs or services for children. Their expendi-tures are given in Table 3.
As shown in Table 3, the Department of Education represents the largest source of spending, at $18.7 billion in 2010. Education spending has grown by 11% since 2005, when the total spending was $16.9 bil-lion, and it is now almost 70% of total public spending on children. Of the remainder, two other departments are significant: Social Services ($3.1 billion) and Administration for Children’s Services ($2.7 billion). The other 13 departments comprise 9% of total spending on children.
Per child, spending on education amounts to $9,270 (including all children, not just school-aged children). For each child, spending for social services is $1,550 and spending by the Administration for
Table 2. Expenditures on New York City Children by Source
2005 2010
Total (millions)
Public expenditures $26,247 (100%) $26,897 (100%)
City $12,668 (48%) $11,564 (43%)
State $9,173 (35%) $9,902 (37%)
Federal $4,406 (17%) $5,431 (20%)
Tax related $4,388 (100%) $3,621 (100%)
Earned Income Tax Credit refundable $1,170 (27%) $1,076 (30%)
Earned Income Tax Credit nonrefundable $154 (4%) $112 (3%)
Dependent care $92 (2%) $116 (3%)
Child Tax Credit refundable $1,062 (24%) $668 (18%)
Child Tax Credit nonrefundable $887 (20%) $706 (19%)
Dependent exemption $1,023 (23%) $943 (26%)
Private donors $1,000 (100%) $1,000 (100%)
Total expenditures (millions) $31,636 $31,518
Per child
Public expenditures $12,950 $13,340
City $6,250 $5,730
State $4,530 $4,920
Federal $2,170 $2,690
Tax related $2,170 $1,790
Private donors $490 $500
Total per child $15,610 $15,630
Sources: See text and appendices. Tax-related expenditures derived from Isaacs et al. (2010). Notes: All values in 2010 dollars. Per child estimates reported to nearest ten dollars.

THE CAMPAIGN FOR EDUCATIONAL EQUITYHOW MUCH DOES NYC NOW SPEND ON CHILDREN’S SERVICES? 11
Children’s Services is $1,360. Whereas education spending has grown significantly, per-child spending on most of these other programs and services is unchanged over the five year period; the exception is social services spending, which has fallen by almost one-third.
For our subanalyses performed below, we identified from each of these 16 agencies the specific programs or funding line items that were for children. Further detail on the specific programs is given
Table 3. Public Expenditures on New York City Children by New York City Government Agency
2005 2010
Total (millions)
Public expenditures (100%) $26,897 (100%)
Education 64% $18,693 69%
Social Services $4,665 18% $3,124 12%
Administration for Children’s Services $2,439 9% $2,738 10%
Health and Mental Hygiene $839 3% $853 3%
Homeless Services $269 1% $373 1%
Police $247 1% $298 1%
Youth and Community Development $211 1% $272 1%
Housing Preservation and Development $184 1% $223 1%
Juvenile Justice $118 >1% $141 >1%
Other public expenditures— $87 >1% $89 >1% not agencies
Correction $31 >1% $32 (100%)
Probation $17 >1% $25 >1%
Health and Hospitals Corporation $214 1% $16 >1%
City University $7 >1% $7 >1%
Parks and Recreation $0 >1% $7 >1%
Public Libraries $10 >1% $3 >1%
Aging $2 >1% $2 >1%
Per child
Public expenditures $12,950 $13,340
Education $8,370 $9,270
Social Services $2,310 $1,550
Administration for Children’s Services $1,210 $1,360
Health and Mental Hygiene $420 $420
Other departments and agencies $650 $740
Notes: All values in 2010 dollars. Per child estimates reported to nearest ten dollars. Per child figures are not weighted by age. Departments assumed to have no expenditures on children: Cultural Affairs; Citywide Admin-istrative Services; Law; and Environmental Protection.

HOW MUCH DOES NYC NOW SPEND ON CHILDREN’S SERVICES?12
in Appendices 2 and 3.16 Therefore, our estimates for separate components of the fiscal map rely on these disaggregated program-level figures, not simply the department totals. That is, we divide agency spending into parts and then allocate these accordingly for each component. For example, we allocate the prekindergarten Department of Education spending to those aged five or under and to the domain of early childhood. In this sense, the lowest units of analysis are the programs, not departments.
4.3 Fiscal Expenditures by Child DisadvantageHere we disaggregate total expenditures according to child disadvantage. This provides some indication of the extent to which public resource allocations are redistributive according to family circumstances and, specifically, whether they are weighted toward disadvantaged families. As noted above, disadvantage is determined by whether a child resides in a household below 185% of the federal poverty level (a criterion adjusted for family size), which in New York City in 2010 includes 920,000 children (down from 960,000 in 2005). Recent studies, such as Duncombe and Yinger (2005), show that the amount of additional funding that disadvantaged students receive varies significantly from state to state and that it is likely that no state
16 The city departments assumed to have no expenditures on children are Cultural Affairs; Citywide Administrative Services; Law; and Environmental Pro-tection. These departments may have some spending that is used by children (such as museums or lead screening), but these amounts are distributed across the entire city population (and may include nonresidents of the city), and therefore they are assumed to be close to zero.
Table 4. Expenditures on New York City Children by Family Disadvantage
2005 2010
Total (millions)
Public expenditures $26,248 $26,897
On children below 185% of the federal $18,277 70% $17,797 66% poverty level (FPL)
On children above 185% of the FPL $7,971 30% $9,100 34%
All forms of spendinga $31,636 $31,518
On children below 185% of the FPL $20,200 64% $19,450 62%
On children above 185% of the FPL $11,436 36% $12,068 38%
Per child
Public expenditures $12,950 $13,340
On children below 185% of the FPL $19,010 $19,280
On children above 185% of the FPL $7,490 $8,320
Extra per disadvantaged child +$11,520 +154% $10,960 +132%
All forms of spendinga $15,610 $15,630
On children below 185% of the FPL $21,010 $21,070
On children above 185% of the FPL $10,740 $11,040
Extra per disadvantaged child +$10,270 +96% $10,030 +91%
Notes: All values in 2010 dollars. Per child estimates reported to nearest ten dollars. Per child figures are not weighted by age. aAll forms of spending includes tax-related expenditures, philanthropic contributions, and public expenditures.

THE CAMPAIGN FOR EDUCATIONAL EQUITYHOW MUCH DOES NYC NOW SPEND ON CHILDREN’S SERVICES? 13
has a sufficiently redistributive weighting to counter the many developmental impediments faced by disad-vantaged children. As we noted above, judgment about whether spending per disadvantaged child is right or optimal – equitable or efficient – will depend on the purpose and intent of the programs and services. These spending totals are not transfers to disadvantaged families: they include, for example, spending on the juvenile justice system as well as spending on pediatric health care and special education. Another im-portant factor in the calculations relates to private school enrollments. We exclude these children from the population counts for educational expenditures, and, because a very high proportion of these children come from wealthier families, this increases the disparity in spending between those above and below 185% of the federal poverty level.
Table 4 shows spending by family disadvantage, separated into direct and indirect forms. In terms of direct public spending in 2010, $17.8 billion of the total is allocated to children below 185% of the federal poverty level. Thus, disadvantaged children, who are 48% of the child population in New York City, receive 66% of the total spending. If indirect spending is included, the total expenditure on disadvantaged children is $19.5 billion, which represents 62% of the total. Indirect spending has countervailing effects: some tax-related expenditures are targeted to low-income families, but some components are not refundable (or are conditional on employment), and low-income families tend to have lower take-up rates. The net effect is to shift the balance somewhat toward expenditures evenly across the population.
The difference in spending per child is given in the bottom panel of Table 4. Direct public spending per disadvantaged child is $19,280, compared with $8,320 for children above the threshold and $14,850 for the average child in New York City. Relative to a child who is not disadvantaged, the additional spending is $10,960 or 132% more. This difference is slightly lower than in 2005, when a disadvantaged child received 154% more than a nondisadvantaged child in direct spending. As shown in the final rows of Table 4, if all forms of spending are included the difference in spending falls to $10,030. Spending on a disadvantaged child is exactly 91% more than a child who is not disadvantaged.
4.4 Fiscal Expenditures by DomainTable 5 shows resource allocations across our nine domains. These amounts are reported for all forms of spending (with indirect spending listed separately) both in total and per child, weighted according to the relevant (eligible) number of children. Unsurprisingly, most of the spending is on K-12 education; this is 59% of the total expenditure. One-fifth of the expenditure is on social investments.
However, the per-child estimates are more salient. As in Table 1, spending per child in New York City was $15,630 in 2010. To better interpret the results, per-child amounts per domain are expressed in terms of the relevant population of children. So, for example, there are 110,000 prenatal “children” and spending on each of these children amounts to $1,040. Spending on family support is low (at $370), as is spend-ing on before-, after-, and summer school programs, other health, and administration. The largest domains are (unsurprisingly) education, early childhood, and pediatric care. Finally, of interest is how much is spent across the five domains of prenatal care, family support, early childhood, pediatric care, and before/af-ter/summer school. These domains correspond to the realms identified by Rothstein, Wilder, and Allgood (2011) for narrowing the achievement gap. In total, spending in these five domains is $5.587 billion.
Table 6 reports the same information as Table 5, but only for students who are below 185% of the fed-eral poverty level. In 2010, these students received $19.5 billion in spending, of which just over 50% is on K-12 education; one-fifth on social programs; and one-tenth on early childhood care and education and pe-diatric care respectively. Again, the per-child estimates are more salient. These estimates may be expressed as amounts each child would receive per year (even if they were not strictly eligible by virtue of their age) or amounts per eligible population (e.g., early childhood spending on children who are the appropriate age).

HOW MUCH DOES NYC NOW SPEND ON CHILDREN’S SERVICES?14
Similarly, we can separate out the five domains identified by Rothstein, Wilder, and Allgood (2011). Per child amounts for each eligible child are reported in the bottom panel of Table 6.
For each child below 185% of the poverty threshold, and expressed as amounts per year regardless of age, we estimate that $6,070 is currently being spent on these five domains per year.17 This figure is best estimated as a “steady-age” amount (equivalent to a steady state) that does not vary with the age of the child. In reality, and as shown below in Table 7, the amounts that children receive vary across their ages.
17 This is calculated as $5,587 million (the amount spent in the five domains for all children) divided by 920,000 children (the number of disadvantaged children in 2010). Per domain, the annual per child amounts are $130 on prenatal care, $820 on family support, $2,540 on early childhood care and education, $2,320 on pediatric care, and $260 on before/after/summer school.
Table 5. Expenditures on New York City Children by Domain
2005 % 2010 %
Total (millions)
All forms of spendinga $31,636 $31,518
Prenatal care $191 (1%) $118 (0%)
Family support $600 (2%) $757 (2%)
Early childhood $1,696 (5%) $2,339 (7%)
Pediatric care $3,899 (12%) $2,137 (7%)
Before/after/summer school $169 (1%) $236 (1%)
K-12 education $16,992 (54%) $18,442 (59%)
Health (other) $200 (1%) $215 (1%)
Social $7,179 (23%) $6,583 (21%)
Administration $708 (2%) $692 (2%)
Children Children Per child (millions) (millions)
All forms of spendinga $15,610 2.03 $15,630 2.02
Prenatal care $1,680 0.11 $1,040 0.11
Family support $300 2.03 $370 2.02
Early childhood $2,520 0.67 $3,490 0.67
Pediatric care $2,040 1.91 $1,120 1.90
Before/after/summer school $140 1.24 $190 1.23
K-12 education $13,700 1.24 $14,960 1.23
Health (other) $100 1.91 $110 1.90
Social $3,750 1.91 $3,460 1.90
Administration $370 1.91 $360 1.90
Notes: All values in 2010 dollars. Per-child estimates reported to nearest ten dollars. Per-child figures for each domain are weighted by age. Average spending per child is not the sum of each domain. aAll forms of spending includes tax-related expenditures, philanthropic contributions, and public expenditures. Number of children reported in millions.

THE CAMPAIGN FOR EDUCATIONAL EQUITYHOW MUCH DOES NYC NOW SPEND ON CHILDREN’S SERVICES? 15
Nevertheless, if an optimal amount of “steady-age” spending is estimated, this amount should be subtracted in order to get the net increment needed to narrow the achievement gap.
4.5 Fiscal Expenditures by Age of ChildExpenditures vary across a child’s age. As noted above, the bulk of spending is on K-12 education, which creates a gap in spending between school-aged and younger children. For other items, there is a uniformity of spending by age. Medical Expenditure Panel Survey data indicate that, broadly, spending on health care does not vary substantially by years of age in childhood, and, across K-8 spending on education, the amount spent per child is roughly constant (Rubenstein, Schwartz, & Stiefel, 2009). Of course, this uniformity of actual spending may not correspond to need or to an efficient allocation of resources.
Table 6. Expenditures on New York City Children below 185% of the Federal Poverty Level by Domain
2005 % 2010 %
Total (millions)
All forms of spendinga $20,200 $19,450
Prenatal care $180 (1%) $100 (1%)
Family support $407 (2%) $530 (3%)
Early childhood care and education $1,379 (7%) $1,865 (10%)
Pediatric care $3,440 (17%) $1,770 (9%)
Before/after/summer school $109 (1%) $142 (1%)
K-12 education $10,194 (50%) $10,668 (55%)
Other health $123 (1%) $134 (1%)
Social $3,837 (19%) $3,733 (19%)
Administration $531 (3%) $508 (3%)
Children Children Per child (millions) (millions)
All forms of spendinga $21,010 0.96 $21,070 0.92
Prenatal care $3,470 0.05 $1,980 0.05
Family support $420 0.96 $570 0.92
Early childhood care and education $4,420 0.31 $6,220 0.30
Pediatric care $3,780 0.91 $2,030 0.87
Before/after/summer school $180 0.60 $250 0.57
K-12 education $17,070 0.60 $18,640 0.57
Other health $130 0.91 $150 0.87
Social $4,220 0.91 $4,280 0.87
Administration $580 0.91 $580 0.87
Notes: All values in 2010 dollars. Per child estimates reported to nearest ten dollars. Per child figures for each domain are weighted by age. Average spending per child is not the sum of each domain. a All forms of spending includes tax-related expenditures, philanthropic contributions, and public expenditures.

HOW MUCH DOES NYC NOW SPEND ON CHILDREN’S SERVICES?16
Table 7 shows total and per child expenditures by age. Total direct spending on children aged 0-4 is $4.0 billion (or $5.2 billion if we include indirect spending). This is 16% of the total, even as this group represents just over one-third of the relevant population. Children aged 5-13 are allocated $18.3 billion in direct spending and those aged 14-18 receive $8.1 billion. For both groups, these amounts are overpro-portionate to their population size.
The bottom panel of Table 7 shows the differences in spending per child across each age group. Annual spending on children before they reach school age is less than one-third of the spending for school-aged children. For the age group 0-4, total direct spending per child is $7,540, compared with $20,150 per child for those aged 5-13 and $19,010 per child for those aged 14-18.
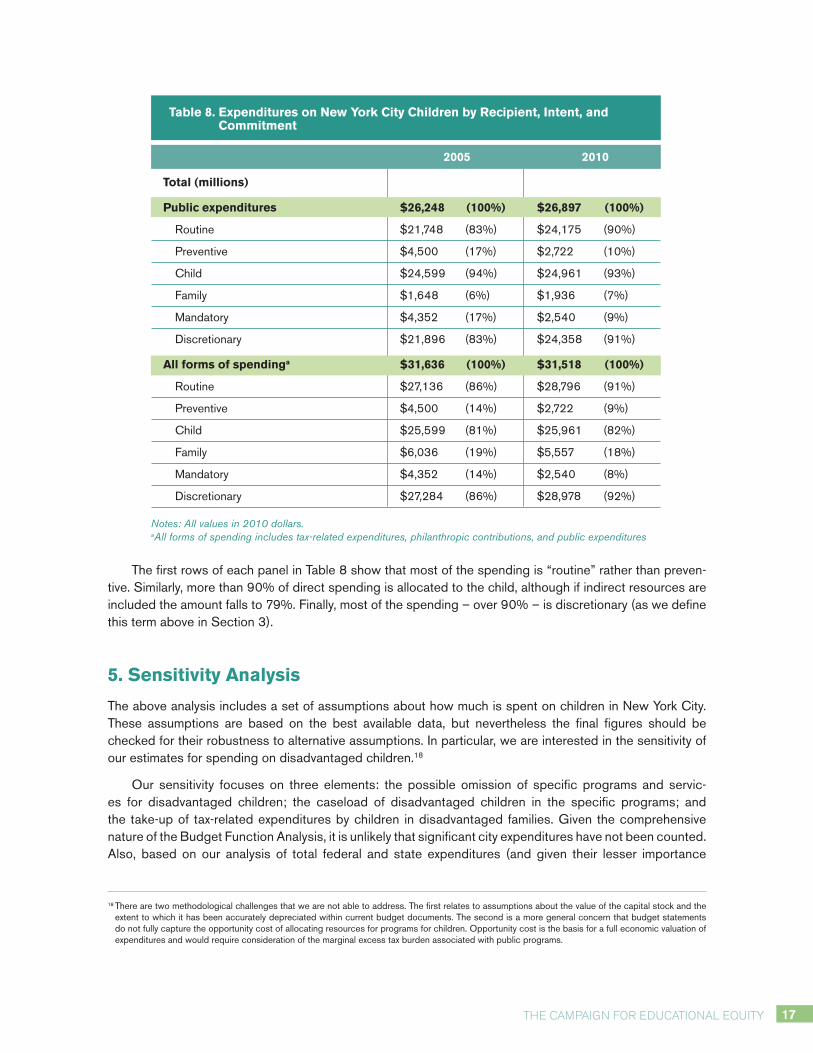
4.6 Fiscal Expenditures by PurposeThe final set of tabulations is useful for interpreting how resources are spent on children. Table 8 describes the distribution of total spending according to recipient, intent, and commitment. The totals are reported for direct expenditures only (top panel) and for both direct and indirect expenditures (bottom panel).
Table 7. Expenditures on New York City Children by Child Age
2005 2010
Total (millions)
Public expenditures (millions) $26,248 $26,897
Aged 0-4 $3,996 (15%) $3,967 (15%)
Aged 5-13 $15,368 (59%) $15,877 (59%)
Aged 14-18 $6,884 (26%) $7,053 (26%)
All forms of spendinga $31,636 $31,518
Aged 0-4 $5,428 (17%) $5,157 (16%)
Aged 5-13 $18,106 (57%) $18,252 (58%)
Aged 14-18 $8,101 (26%) $8,109 (26%)
Per child
Public expenditures $12,960 $13,340
Aged 0-4 $5,870 $5,800
Aged 5-13 $16,860 $17,520
Aged 14-18 $15,860 $16,540
All forms of spendinga $16,610 $15,630
Aged 0-4 $7,980 $7,540
Aged 5-13 $19,860 $20,150
Aged 14-18 $18,670 $19,010
Notes: All values in 2010 dollars. Per child estimates reported to nearest ten dollars. Per child figures are weighted by age. aAll forms of spending includes tax-related expenditures, philanthropic contributions, and public expenditures.
THE CAMPAIGN FOR EDUCATIONAL EQUITYHOW MUCH DOES NYC NOW SPEND ON CHILDREN’S SERVICES? 17
The first rows of each panel in Table 8 show that most of the spending is “routine” rather than preven-tive. Similarly, more than 90% of direct spending is allocated to the child, although if indirect resources are included the amount falls to 79%. Finally, most of the spending – over 90% – is discretionary (as we define this term above in Section 3).
5. Sensitivity Analysis
The above analysis includes a set of assumptions about how much is spent on children in New York City. These assumptions are based on the best available data, but nevertheless the final figures should be checked for their robustness to alternative assumptions. In particular, we are interested in the sensitivity of our estimates for spending on disadvantaged children.18
Our sensitivity focuses on three elements: the possible omission of specific programs and servic-es for disadvantaged children; the caseload of disadvantaged children in the specific programs; and the take-up of tax-related expenditures by children in disadvantaged families. Given the comprehensive nature of the Budget Function Analysis, it is unlikely that significant city expenditures have not been counted. Also, based on our analysis of total federal and state expenditures (and given their lesser importance
18 There are two methodological challenges that we are not able to address. The first relates to assumptions about the value of the capital stock and the extent to which it has been accurately depreciated within current budget documents. The second is a more general concern that budget statements do not fully capture the opportunity cost of allocating resources for programs for children. Opportunity cost is the basis for a full economic valuation of expenditures and would require consideration of the marginal excess tax burden associated with public programs.
Table 8. Expenditures on New York City Children by Recipient, Intent, and Commitment
2005 2010
Total (millions)
Public expenditures $26,248 (100%) $26,897 (100%)
Routine $21,748 (83%) $24,175 (90%)
Preventive $4,500 (17%) $2,722 (10%)
Child $24,599 (94%) $24,961 (93%)
Family $1,648 (6%) $1,936 (7%)
Mandatory $4,352 (17%) $2,540 (9%)
Discretionary $21,896 (83%) $24,358 (91%)
All forms of spendinga $31,636 (100%) $31,518 (100%)
Routine $27,136 (86%) $28,796 (91%)
Preventive $4,500 (14%) $2,722 (9%)
Child $25,599 (81%) $25,961 (82%)
Family $6,036 (19%) $5,557 (18%)
Mandatory $4,352 (14%) $2,540 (8%)
Discretionary $27,284 (86%) $28,978 (92%)
Notes: All values in 2010 dollars. aAll forms of spending includes tax-related expenditures, philanthropic contributions, and public expenditures

HOW MUCH DOES NYC NOW SPEND ON CHILDREN’S SERVICES?18
to the overall total spending), it is unlikely that significant amounts from these two levels are omitted (see footnote 2 above).
We performed a Monte Carlo simulation (a method for taking samples of values of key variables in the model and then recomputing estimates) to calculate the range of possible expenditures on disadvantaged children for 2010. For each of the agency-level components of spending, we derived a probability distribution for the proportions of the caseloads that fell into our category of disadvantaged (below 185% of the federal poverty line). We applied two different distributions, depending on the evidence regarding targeting of programs toward disadvantaged groups. For some components of spending, we simulated a normal distribution of caseloads where 95% of all caseloads were within +/–15% of the base case. For other components of spending, we simulated a distribution of caseloads that were a random draw +/–5% of the base case. Separately, we simulated a normal distribution using the upper and lower bounds for Department of Education spending on disadvantaged children from Duncombe and Yinger (2005). These bounds were assumed to cover 95% of all possible values for Department of Education spending. Finally, we simulated a normal distribution for the number of children who might be classified as disadvan-taged in New York City based on the mean value across the period 2005–2010 (0.92 million children). The number of children is used to derive per child spending, given total spending. We executed 1,000 trials for these simulations.
The Monte Carlo simulation yielded very stable estimates of the total amount of spending on disadvan-taged children in New York City. Our base case estimate of spending is $17.9 billion in total or $19,420 per child. Monte Carlo simulation yields a total of $17.8 billion and $19,300 per child, that is, slightly below the base case. Across the 1,000 trials, the standard deviation of expenditures is very low, at $320 million in total spending or $430 per child. Alternatively expressed, this sensitivity analysis suggests that 68% of all possible estimates of total spending would be within +/–$320 million of our base case; and 68% of all possible estimates of per child spending would be within +/–$430 of our base case. These bounds appear to be reasonably narrow.
Finally, we can compare our analysis for New York City with that for New York State by Connors-Tadros and Silloway (2008) using 2007-08 data. They estimate total spending across all children in the state of $65 billion (2010 dollars), which amounts to $14,500 per child. This estimate is lower than ours, in part because of differences in cost of living, in the needs of the children, and in what expenditures are included. Connors-Tadros and Silloway calculate that direct public expenditures are divided 43% local, 39% state, and 18% federal; these proportions are very close to ours as reported in Table 2. They also find that the distribution of spending is skewed toward school-aged children relative to those aged under five. However, Connors-Tadros and Silloway estimate a weighting toward low-income children of 1.24, which is somewhat lower than our estimate.
6. Conclusions
This fiscal map shows the amount of public resources committed to children in New York City. This map, derived from budgetary data, is an attempt to depict expenditures on children in a clear and comprehensive fashion. It is then possible to determine if this amount is equitable and efficient. This determination, which may reflect political circumstances as well as financial constraints, is not performed here. However, we do not believe such a determination can be made without knowledge of what is being spent.
Based on data for 2010, fiscal spending for the average child in New York City is $15,630, which represents a slight decrease over the period since 2005. However, most of that money is spent on K-12 education; expenditures on developmental supports for children, as well as medical care and critical programs such as homeless services, amount to less than one-third of this total. Although the average

THE CAMPAIGN FOR EDUCATIONAL EQUITYHOW MUCH DOES NYC NOW SPEND ON CHILDREN’S SERVICES? 19
amount of resources has not increased over the period, the contributions across departments and agen-cies have changed.
Our fiscal map provides a number of additional insights, and we highlight two of them here. First, the primary source of funding for children is the city government, which provides almost half of the direct fund-ing for programs for children. Notably, direct expenditures by the federal government are nearly equaled by the resource implications of rules on tax-related expenditures on children (such as the Earned Income Tax Credit). From a resource perspective, tax-related rules are an important way in which the federal government influences resource allocations toward children.
Second, the map does show that public investments are disproportionately allocated in favor of disad-vantaged children. Whereas average public spending per child is $13,340 (net of tax-related expenditures and philanthropic contributions), spending for a child who lives in a household with an income that is less than 185% of the federal poverty level is $19,280. Implicitly, spending on these children is “weighted” at 2.32 times that of children in households with an income above 185% of the federal poverty level. However, we repeat our caution that this spending gap should not be interpreted as a resource transfer: it includes spending on rehabilitative programs and the juvenile justice system, for example, and includes very little spending that might be classed as preventive. Thus, although these spending amounts are larger for disad-vantaged children, they may be below what is optimal and/or may be allocated imperfectly across programs.

HOW MUCH DOES NYC NOW SPEND ON CHILDREN’S SERVICES?20
References
Adams, G., Tout, K., & Zaslow, M. (2007). Early care and education for children in low-income families: Patterns of use, quality, and potential policy implications. Working paper no. 4. Washington, DC: The Urban Institute.
Baughman, R. (2007). Differential impacts of public health insurance expansions at the local level. International Journal of Health Care Finance and Economics, 7 (1), 1-22.
Belfield, C.R., & Levin, H.M. (eds.) (2007). The price we pay. Economic and social consequences of inadequate educa-tion. Washington, DC: Brookings Institution.
Billen, P., Boyd, D., Dadayan, L., & Gais, T. (2007). State funding for children: Spending in 2004 and how it changed from earlier years. Albany, NY: The Nelson A. Rockefeller Institute of Government.
Blau, D., & Tekin, E. (2007). The determinants and consequences of child care subsidies for single mothers in the USA. Journal of Population Economics, 20 (4), 719-741.
Blumberg, L.J., Dubay, L.,& Norton, S.A. (2000). Did the Medicaid expansions for children displace private insurance? An analysis using the SIPP. Journal of Health Economics, 19 (1), 33-60.
Breysse, P., Farr, N., Galke, W., Lanphear, B., Morley, R., & Bergofsky, L. (2004). The relationship between housing and health: Children at risk. Environmental Health Perspectives, 112 (15), 1583-1588
Carroll, A., Corman, H., Noonan, K., & Reichman, N. E. (2007). Why do poor children lose health insurance in the SCHIP era? The role of family health. The American Economic Review, 97 (2), 398-401.
Cassetty, J.H., & Hutson, R. (2005). Effectiveness of federal incentives in shaping child support enforcement outcomes. Children and Youth Services Review, 27 (3), 271-289.
Citizens’ Committee for Children. (2008). Keeping track of New York City’s children 2008. New York, NY: Author.
Citizens’ Committee for Children. (2010). Keeping track of New York City’s children 2010. New York, NY: Author.
Cohen, S. B. (2003). Design strategies and innovations in the Medical Expenditure Panel Survey. Medical Care, 41 (7, Suppl.), pp. III5-III12.
Connors-Tadros, L., & Silloway, T. (2008, November). Fiscal mapping analysis of the resources to support children and youth in New York. Paper presented at the Equity Symposium of the Campaign for Educational Equity, Teachers Col-lege, Columbia University. Retrieved from http://www.financeproject.org/publications/NYFMReport.pdf
Conyers, L.M., Reynolds, A. J., & Ou, S. (2003). The effect of early childhood intervention and subsequent special edu-cation services: Findings from the Chicago Child-Parent Centers. Educational Evaluation and Policy Analysis, 25 (1), 75-95.
Currie, J. (2008). The invisible safety net: Protecting the nation’s poor children and families. Princeton, NJ: Princeton University Press.
Currie, J., & Gruber, J. (1996). Health insurance eligibility, utilization of medical care, and child health. Quarterly Journal of Economics, 111 (2), 431-466.
Duncombe, A., & Yinger, J. (2005). How much more does a disadvantaged student cost? Economics of Education Review, 24, 513-532.
Edin, K. (1995). Single mothers and child support: The possibilities and limits of child support policy. Children and Youth Services Review, 17 (1-2), 203-230
Elixhauser, A., Machlin, S.R., Zodet, M. W., Chevarley, F.M., Patel, N., McCormick, M.C., & Simpson, L. (2001). Health

THE CAMPAIGN FOR EDUCATIONAL EQUITYHOW MUCH DOES NYC NOW SPEND ON CHILDREN’S SERVICES? 21
care for children and youth in the United States: 2001 annual report on access, utilization, quality, and expenditures. Ambulatory Pediatrics, 2, 419-437.
English, A., Morreale, M., & Larsen, J. (2003). Access to health care for youth leaving foster care: Medicaid and SCHIP. Journal of Adolescent Health, 32 (6, Suppl. 1), 53-69.
Fertig, A.R., & Reingold, D.A. (2007). Public housing, health, and health behaviors: Is there a connection? Journal of Policy Analysis and Management, 26 (4), 831-859.
Flores, K., Douglas, T. & Ellwood, D. (1998). A detailed analysis on spending on low income children’s programs in 13 states. Washington, DC: Urban Institute.
Fossett, J., & Thompson, F.J. (2005). Administrative responsiveness to the disadvantaged: The case of children’s health insurance. Journal of Public Administration Research and Theory, 16 (3), 369-392.
The Foundation Center. (2002). New York metropolitan area foundations. New York, NY: Author. Retrieved from www.fdncenter.org.
Gold, R.B., & Sonfield, A. (2001). Reproductive health services for adolescents under the State Children’s Health Insur-ance Program. Family Planning Perspectives, 33 (2), 81-87.
Grissmer, D., & Flanagan A. (2004). The role of federal resources in closing the achievement gaps of minority and dis-advantaged students. In T. Loveless (ed.), Closing the gap: Promising approaches to reducing the achievement gap. Washington, DC: Brookings.
Heckman, J.J. (2008). Schools, skills, and synapses. IZA Discussion Paper, 3515. Retrieved from http://www.heck-manequation.org/system/files/Schools_Skills_Synapsis.pdf
Hughes, D.C., Duderstadt, K.G., Soobader, M.J., & Newacheck, P.W. (2005). Disparities in children’s use of oral health services. Public Health Reports, 120 (4), 455-462.
Isaacs, J., Steuerle, E., Rennane, S., & Macomber, T. (2010). Kids’ share 2010. Washington, DC: Brookings and Urban Institute.
Isaacs, J., Vericker, T., Macomber, T., & Kent, A. (2009). Kids’ share 2009. Washington, DC: Brookings and Urban Institute.
Jack, M.S, Lear, J.G., & Klerman, L. (1988). Organization of adolescent health services: Study group report. Journal of Adolescent Health Care, 9 (6, Suppl. 1), S33-S35.
Juszczak, L., Melinkovich, P., & Kaplan, D. (2003). Use of health and mental health services by adolescents across mul-tiple delivery sites. Journal of Adolescent Health, 32, 108-118.
Landon, S., McMillan, M.L., Muralidharan, V., & Parsons, M. (2006). Does health-care spending crowd out other provin-cial government expenditures? Canadian Public Policy / Analyse de Politiques, 32 (2), 121-141.
Lear, J. G. (2002). Schools and adolescent health: Strengthening services and improving outcomes. Journal of Adoles-cent Health, 31, 310-320.
Lykens, K.A., & Jargowsky, P.A. (2002). Medicaid matters: Children’s health and Medicaid eligibility expansions. Journal of Policy Analysis and Management, 21 (2), 219-238.
Ma, C.T., Gee, L., & Kushel, M.B. (2008). Associations between housing instability and food insecurity with health care access in low-income children. Ambulatory Pediatrics, 8, 50-57.
Macomber, J., Isaacs, J., Vericker, T., Kent, A., & Johnson, P. (2007). Federal expenditures on infants and toddlers in 2007. Washington, DC: Urban Institute and Brookings Institution.
HOW MUCH DOES NYC NOW SPEND ON CHILDREN’S SERVICES?22
Maume, D.J., Jr. (1991). Child-care expenditures and women’s employment turnover. Social Forces, 70 (2), 495-508.
Newacheck, P.W., Wong, S. T., Galbraith, A.A., & Hung, Y.Y. (2003). Adolescent health care expenditures: A descriptive profile. Journal of Adolescent Health, 32 (6, Suppl. 1), 3-11.
Phillips, D., & Adams, D. G. (2001). Child care and our youngest children. The Future of Children, 11 (1), 34-51.
Rothstein, R., Wilder, T., & Allgood, W. (2011). Providing comprehensive educational opportunity to low income students: How much does it cost? New York, NY: Campaign for Educational Equity, Teachers College.
Rubenstein, R., Schwartz, A., & Stiefel, L. (2009). Spending, size and grade-span in K-8 schools. Journal of Education Finance and Policy, 4, 234-256.
Russ, S., Garro, N., & Halfon, N. (in press). Meeting children’s basic health needs: From patchwork to tapestry. Children and Youth Services Review.
Sanchez, K., Gomez, R., & Davis, K. (2010). Fostering connections and medical homes: Addressing health disparities among children in substitute care. Children and Youth Services Review, 32 (2), 286-291.
Sheils, J.F., & Wolfe, P.R. (1992). The role of private health insurance in children‘s health care. The Future of Children, 2 (2), 115-133.
Simpson, L., Owens, P.L., Zodet, M.W., Chevarley, F.M., Dougherty, D., Elixhauser, A., & McCormick, M.C. (2005). Health care for children and youth in the US. Ambulatory Pediatrics, 5 (1), 6-65.
U.S. Census Bureau. (2005). American community survey. Selected economic characteristics. http://factfinder.census.gov/servlet/ACSSAFFPeople?_event=&geo_id=01000US&_geoContext=01000US&_street=&_county=&_cityTown=&_state=&_zip=&_lang=en&_sse=on&ActiveGeoDiv=&useEV=&pctxt=fph&pgsl=010&_submenuId=people_6&ds_name=null&_ci_nbr=null&qr_name=null®=null%3Anull&_keyword=&_industry=
Wilder, T., Allgood, W., & Rothstein, R. (2008, November). Narrowing the achievement gap for low-income children: A 19-year life cycle perspective. Paper prepared for the 2008 Equity Symposium of the Campaign for Educational Equity, Teachers College, Columbia University.
Wong, S.T., Galbraith, A., Kim, S., & Newacheck, P. W. (2005). Disparities in the financial burden of children’s healthcare expenditures. Archives of Pediatric and Adolescent Medicine, 159, 1008-1013.

THE CAMPAIGN FOR EDUCATIONAL EQUITYHOW MUCH DOES NYC NOW SPEND ON CHILDREN’S SERVICES? 23
Appendix 1. Web-Based Information Sources
The following sources were used to collect, verify, or search for information related to fiscal expenditures.
Agencies and Government InstitutionsAccess NYC https://a858-ihss.nyc.gov/ihss1/en_US/IHSS_homePage.do
Agency for Healthcare Research and Quality (http://www.ahrq.gov)
Center for Health and Health Care in Schools (web-based surveys) http://www.healthinschools.org/
Center on Budget and Policy Priorities (CBPP) www.cbpp.org/index.html
Congressional Budget Office (CBO) www.cbo.gov
Council on Children and Families http://www.ccf.state.ny.us/index.htm
Department of Health and Human Services (HHS http://www.hhs.gov/)
Education Commission of the States http://www.ecs.org/
Education Resources Information Center (http://www.eric.ed.gov/)
Healthcare Cost and Utilization Project (with Nationwide Inpatient Sample (NIS) and State Inpatient Databases (SID),
among others) http://hcupnet.ahrq.gov/
Insure Kids (state-specific information about Medicaid and CHIP programs) http://www.insurekidsnow.gov/About%20
Us/index.html
Medical Expenditure Panel Survey http://meps.ahrq.gov/mepsweb/data_stats/meps_query.jsp
National Association of State Budget Officers (NASBO) www.nasbo.org
National Center for Education Statistics (NCES) http://nces.ed.gov/
National Conference of State Legislatures (NCSL) www.ncsl.org
New York City Department of Health and Mental Hygiene http://www.nyc.gov/html/doh/html/home/home.shtml
New York State Department of Education http://www.nysed.gov/
New York State Department of Family, Office of Children and Family Services http://www.ocfs.state.ny.us/main/
New York State Department of Health http://www.health.state.ny.us/
NYC Independent Budget Office (http://www.ibo.nyc.ny.us/)
Office of Management and Budget (OMB) www.whitehouse.gov/omb
U.S. Census Bureau: http://www.census.gov/
U.S. Department of Education http://www.ed.gov/ and http://data.ed.gov/
U.S. Department of Health and Human Services, Administration for Children and Families http://www.acf.hhs.gov/.
U.S. Department of Health and Human Services, Administration for Children and Families, Office of Child Care http://
www.acf.hhs.gov/programs/ccb/
U.S. Government Accountability Office http://www.gao.gov/index.html

HOW MUCH DOES NYC NOW SPEND ON CHILDREN’S SERVICES?24
Policy Research Centers, Think Tanks, and Other Private Institutions American Enterprise Institute for Public Policy Research (AEI) www.aei.org
Annie E. Casey Foundation http://www.aecf.org/
Brookings Institution http://www.brookings.edu
CATO Institute www.cato.org
Citizens’ Committee for Children of New York http://www.cccnewyork.org/aboutkt.html
Center for Health and Health Care in Schools http://www.healthinschools.org/
Chapin Hall at the University of Chicago http://www.chapinhall.org/.
Child Care & Early Education Research Connections http://www.researchconnections.org/childcare/welcome
Children’s Budget Org http://www.childrensbudget.org/
Committee for Economic Development http://ced.issuelab.org/research
Finance Research Consortium http://www.albany.edu/edfin/
First Focus (http://www.firstfocus.net/)
Foundation for Child Development http://www.fcd-us.org/
Governing www.governing.com
Guidestar http://www2.guidestar.org/
Heritage Foundation www.heritage.org
Kids Count http://datacenter.kidscount.org/
National Association for the Education of Young Children http://www.naeyc.org/
National Center for Early Development and Learning http://www.fpg.unc.edu/~ncedl/
National Center for Health Statistics http://www.cdc.gov/nchs/Default.htm
National Center for Policy Analysis http://www.ncpa.org/
National Institute for Early Education Research www.nieer.org
National Institute of Child Health and Human Development http://www.nichd.nih.gov/ or https://secc.rti.org/home.cfm
National Medical Care Utilization and Expenditure Survey (NMCUES) http://www.cdc.gov/nchs/products/elec_prods/
subject/nmcues.htm
National Medical Expenditure Survey http://www.icpsr.umich.edu/icpsrweb/ICPSR/series/00045
National Survey of Children with Special Health Care Needs http://www.cshcndata.org/Content/Default.aspx
National Survey of Children with Special Health Care Needs http://www.cshcndata.org/Content/Default.aspx
NICHD Early Child Care Research Network http://www.nichd.nih.gov/ or https://secc.rti.org/home.cfm
Rockefeller Institute www.rockinst.org
Stateline.org www.stateline.org
The Children’s Cabinet http://www.childrenscabinet.org/main.asp?pID=1

THE CAMPAIGN FOR EDUCATIONAL EQUITYHOW MUCH DOES NYC NOW SPEND ON CHILDREN’S SERVICES? 25
Appendix 2. Programs and Services by New York City Department
Administration for Children’s ServicesPrograms and services for children: Head Start; foster care services; foster care support; adoption ser-
vices; child care services; child welfare support; Department of Education residential care; preventive homemaking
services; preventive services; protective services; and general administration (proportionate to allocation of total budget
directed to children (92%)).
Notes: Head Start (not including Early Head Start) full budget allocated to ages 3-5. Foster care services, foster
care support, protective services, and preventive services budgets allocated net of children aged over 18, with services
evenly distributed by age (www.nyc.gov/html/acs/downloads/pdf/ACS_09_assessment.pdf (for 2006, based on Citi-
zens Committee for Children, 2008; for 2008, Citizens Committee for Children, 2010). This division does not take into
consideration the fact that cost per age might not be constant. Also, it ignores that there might be some other child char-
acteristics (such as a health condition) that would introduce budget differences. Fostered children are below the poverty
level. Adoption services, age profile 6-18, are 60% of budget, with 12% aged over 18, see www.nyc.gov/html/acs/html/
become_parent/meet_our_kids.shtml. Children care services and child welfare support targeted to low-income working
families or those on public assistance. Age profile (from www.nyc.gov/html/acs/html/child_care/child_care_information.
shtml) indicates children spread between ages 0-12. Dept. of Education residential care and preventive homemaking
services assumed allocated evenly across age groups and all low-income families. ACS’s BFA analysis is known for all
fiscal years starting in FY2007 (including budget contributions of city, state, and federal funds). For the allocation of
FY2006 budget by sources of funding we make the following assumption: weight of city/state/federal (C/S/F) funding
in FY2007 budget = weight of CSF funding in FY2006.
Police DepartmentPrograms and services for children: School safety; community affairs; and general administration (propor-
tionate to allocation of total budget directed to children (15%)).
Notes: For the allocation of the FY2006 budget by sources of funding we make the following assumption: weight of
C/S/F funding in FY2009 budget = weight of CSF funding in FY2006. Proportion of school safety program/(PD bud-
get minus administration) is kept from the administration budget. The age profile is assumed even across school-aged
children for school safety. Community affairs budget is divided across children aged 12-18.
Department of Youth and Community DevelopmentPrograms and services for children: Summer youth employment program; runaway and homeless youth;
out-of-school youth programs; out-of-school time; other youth programs; in school youth programs; community develop-
ment programs; Beacon Community Centers; and general administration (proportionate to allocation of total budget
directed to children (97%)).
Notes: Youth program age profiles are based on an annual summary of the program for children aged 14 and over
(children aged over 18 are subtracted). For runaway and homeless youth, 40% of budget is allocated to children aged
0-18. Proportions assumed allocated to disadvantaged children. Out-of-school time age profile is available for FY
2008 and applied to FY2006 and FY2010. In-school youth programs serve eligible high school students. Community
development programs cover students aged 16-21, so only 17% of budget is included, allocated to those aged 16-18.
Beacon Community Centers’ age allocation is based on caseload data for participants aged under 19 from FY2009.

HOW MUCH DOES NYC NOW SPEND ON CHILDREN’S SERVICES?26
Department of Juvenile JusticePrograms and services for children: Health services providers; in-detention program services; non-secure
detention; re-entry support services; resident movement services; secure detention; and general administration (propor-
tionate to allocation of total budget directed to children (100%)).
Notes: Age profile on admission to juvenile justice facilities from www.nyc.gov/html/djj/html/numbers.html. Adminis-
tration costs split by age from groups 7-18.
Department of Social ServicesPrograms and services for children: CEO evaluation; domestic violence services; food assistance pro-
grams; food stamp operations; HIV and AIDS services; Medicaid--eligibility; Medicaid and homecare; Office of Child
Support Enforcement; public assistance child care; public assistance grants; public assistance support grants; public
assistance grants; and general administration (proportionate to allocation of total budget directed to children (80%)).
Notes: Food assistance programs/food stamp operations/public assistance grants/public assistance support
grants based on information from the following quarterly supplement facts (www.nyc.gov/html/hra/downloads/pdf/hra-
facts_2009_07.pdf) to identify the profile of participants younger than 18. For HIV and AIDS service according to www.
nyc.gov/html/hra/downloads/pdf/HASA_factsheet.pdf, 1% of admissions/caseloads are younger than 17; 1% of total
budget is allocated to persons aged under 18 and evenly split among all age groups.
Department of Homeless ServicesPrograms and services for children: Family shelter administration and support; family shelter intake and
placement; family shelter operations; prevention and aftercare; rental assistance and housing placement; and general
administration (proportionate to allocation of total budget directed to children (70%)).
Notes: CEO evaluation/domestic violence services provides services to families (household unit of four persons),
with funds allocated proportionate to household size and only child allocations included. Office of Child Support En-
forcement assumes total budget allocated evenly across age groups.
Department of Parks and RecreationPrograms and services for children: Youth recreation program.
Notes: Budget extrapolated from FY2006-09 data to FY2010.
Housing Preservation and DevelopmentPrograms and services for children/families: Housing operations – Section 8 programs.
Department of Health and Mental HygienePrograms and services for children: Environmental health — day care; environmental health--food safety;
health care access and improvement – insurance, oral health, primary care, maternal and child care, school health, early
intervention, mental health services; disease prevention and treatment — immunization; and general administration (propor-
tionate to allocation of total budget directed to children).
Notes: Some programs of the department are fully allocated to children. For the remaining programs, we assume that the
usage by ages is constant (that is, we divide the total amount per NYC’s population and multiply by number of 0-18 year olds).

THE CAMPAIGN FOR EDUCATIONAL EQUITYHOW MUCH DOES NYC NOW SPEND ON CHILDREN’S SERVICES? 27
Department of AgingPrograms and services for children: Foster grandparents.
Notes: Budget extrapolated from FY2006-09 data to FY2010.
Department of EducationPrograms and services for children: Special education prekindergarten; prekindergarten; and compulsory
education.
Notes: All of Department of Education functions included, with special education pre-K allocated to 3-4 year olds
(www.nyc.gov/html/acs/downloads/pdf/ACS_09_assessment.pdf, p.199); prekindergarten allocated to four year olds
(www.nyc.gov/html/acs/downloads/pdf/ACS_09_assessment.pdf, p.118); for compulsory education, age profile allo-
cated to those aged 5-18. Disadvantaged children assumed to receive 1.196 amount of average child (Duncombe &
Yinger, 2005), calculated for the non-preschool and non-special-education budgets only. Spending per age for compul-
sory education assumed to be even across ages (Rubenstein et al., 2009).
Public LibrariesPrograms and services for children: Connecting Libraries and School Program (CLASP). Notes: Budget
extrapolated from FY2006-09 data to FY2010.
City University of New YorkPrograms and services for children: Child care program.
Notes: For FY 2007, http://www.childcareinc.org/publications/2008_CCI_Primer.pdf, provides the funding for City
University of New York child care programs (by sources of funding). Proportions for FY2007 applied to FY2006 and
FY2010, with funding distributed among children aged 0-4.
Health and Hospitals CorporationPrograms and services for children: General medical care.
Notes: General caseload of HHC applied on age-weighted formula from expenditures by age from the Medical Ex-
penditure Panel Survey. Budget data is retrieved from the Supporting Schedules.
Department of ProbationPrograms and services for children: Activities based on Community Corrections Centers programs.
Notes: Only caseload information is that the department provides intake services, investigations, and/or probation
supervision for more than 60,000 adults and 20,000 juveniles each year. Assumed 80% of children are low-income.
Notes: Persons aged over 16 are counted as adults and remanded to the Department of Correction as adolescents
and separate from inmates aged over 18. http://www.nyc.gov/html/doc/html/adolescent/doc_stats_adol.shtml. Data on
proportion of persons aged under 18 are unknown.

HOW MUCH DOES NYC NOW SPEND ON CHILDREN’S SERVICES?28
Appendix 3. Expenditures by Programs by New York City Department
Millions of nominal dollars
2005 2010
Administration for Children’s Services
Department total 2,326 2,880
Child-related spending 2,148 2,685
Head Start 196 222
Foster care services 522 573
Foster care support 50 45
Adoption services 318 339
Child care services 514 871
Child welfare Support 47 49
Dept. of Ed. residential care 72 66
Preventive services 135 185
Protective services 166 197
Police Department
Department total 3,794 4,787
Child-related spending 217 293
Administration 19 23
School Safety 191 257
Community affairs 7 13
Youth and Community Development
Department total 303 416
Child-related spending 186 267
Summer Youth employment program(SYEP) 38 45
Runaway and homeless youth (RHY) 3 5
Out-of-school youth programs (OSY) 3 6
Out of school time (OST) 48 110
Other youth programs 16 14
In school youth programs 17 20
Community development programs 16 16
Beacon community centers 26 36
General administration (YCD) 18 15
Juvenile Justice
Department total 104 138
Child-related spending 104 138
Health services provider 7
In-detention program services 1 0

THE CAMPAIGN FOR EDUCATIONAL EQUITYHOW MUCH DOES NYC NOW SPEND ON CHILDREN’S SERVICES? 29
Millions of nominal dollars
2005 2010
Non-secure detention 17 18
Re-entry support services 1 1
Resident movement services 10 4
Secure detention 30 40
Administration—JJ 45 69
Social Security
Department total 6,936 8,487
Child-related spending 4,107 3,063
CEO evaluation 1
Domestic violence services 38 48
Food assistance programs 12 16
Food stamp operations 36 53
General administration 198 187
HIV and AIDS services 2 2
Medicaid-eligibility and administration 58 71
Medicaid and homecare 2,809 1,505
Office of child support enforcement 45 74
Public assistance grants 888 1,020
Public sssistance support grants 21 86
Homeless Services
Department total 1,510 1,771
Child-related spending 237 366
Family shelter administration and support 2 3
Family shelter intake and placement 11 13
Family shelter operations 166 195
General adminstration — HS 30 31
Prevention and aftercare 8 18
Rental assistance and housing placement 19 105
Parks and Recreation
Department total 308 389
Child-related spending 0 6
Administration — general 0 0
Youth recreation program 0 6

HOW MUCH DOES NYC NOW SPEND ON CHILDREN’S SERVICES?30
Millions of nominal dollars
2005 2010
Housing Preservation and Development
Department total 543 802
Child-related spending 162 219
Adminstration 9 9
Housing operations — section 8 programs 144 199
Family shelter operations — emergency housing 9 11
Department of Corrections
Department total 900 1,012
Child-related spending 27 31
Funding for central administrative services 1 1
Jail operations 23 29
Operations — hospital prison ward 1 0
Operations — Rikers security and operations 2 1
Health and Mental Hygiene
Department total 1,510 1,771
Child-related spending 738 836
Administration — general 139 159
Environmental health — day care 9 11
Environmental health—food safety 3 5
Health care access & improvement — insurance 3 2
Health care access & improvement — oral health 2 0
Health care access & improvement — primary care 3
Health promo & disease prevention — maternal & child 18 33
Health promo & disease prevention — school health 54 89
Mental hygiene — early intervention 471 486
Mental hygiene — mental health services 38 43
Disease prevention & treatment — immunization 3 4
Department of Aging
Department total 276 295
Child-related spending 2 2
Administration and contract agency support 0 0
Foster grandparents 2 2

THE CAMPAIGN FOR EDUCATIONAL EQUITYHOW MUCH DOES NYC NOW SPEND ON CHILDREN’S SERVICES? 31
Millions of nominal dollars
2005 2010
Department of Education
Department total 14,887 18,326
Child-related spending 14,887 18,326
Prekindergarten 166 267
Special education pre-K 533 839
Compulsory K-12 education 14,187 17,220
City University of New York
Department total 647 797
Child related spending 6 8
CUNY child care 6 8
Public Libraries
Department total 242 194
Child-related spending 8 3
Connecting libraries and school programs 8 3
Department of Probation
Department Total 83 87
Child-related spending 15 25
Program probation 15 25
Health and Hospitals Corporation
Department total 1,418 115
Child-related spending 353 28
Program HHC 198 15