“how much do you spend gambling?” ambiguities in survey questionnaire items
TRANSCRIPT
Brief Report
"How Much Do You Spend Gambling?" Ambiguitiesin Survey Questionnaire Items
A. BlaszczynskiV. Dumlao
University of New South Wales, Australia
M. LangeHolyoke Community College, Massachusetts
The validity of a survey's findings is dependent upon the clarity and lack of ambiguitycontained in each individual item yet minimal attention has been directed to this issuein most prevalence studies. Researchers have shown a tendency to accept the uncriticalassumption that respondents interpret seemingly simple and straightforward items suchas 'how much do you spend gambling?' in a consistent manner. No attempt is made toconfirm the uniformity of responses by clarifying the mathematical formulae used byrespondents to derive their answers. The purpose of this paper was to examine theconsistency shown by a sample of 181 medical undergraduate subjects in estimating thelevel of gambling expenditure in a series of five case vignettes describing various sce-narios of wins and losses during a session of gambling. Results revealed a wide variationin calculated figures depending upon whether or not subjects interpreted the item tomean net expenditure or turnover. Only two thirds or less of subjects calculated thefigure to be the difference between the initial amount risked and the residual at theconclusion of the session. It is suggested that more attention be paid in prevalence andclinical studies to providing subjects with clear instructions on how to calculate expen-diture estimates.
Address correspondence to Professor Alex Blaszczynski, PhD, Director, Impulse Control Disor-der Clinic, Level 4, Health Services Building, Liverpool Hospital, Liverpool NSW 2170, Australia.
Journal of Gambling Studies Vol. 13(3), Fall 1997© 1997 Human Sciences Press, Inc. 237
JOURNAL OF GAMBLING STUDIES
INTRODUCTION
A major objective of population prevalence studies is to obtaindata on gambling expenditure in order to identify changing trends incommunity participation, differential patterns of involvement amongspecific subgroups, and an index of the degree and severity of prob-lem gambling behaviour. Such data is generally derived from re-sponses to survey questionnaire items which seek to elicit self-reportestimates of amounts gambled by respondents over a defined timeframe, generally the immediate preceding week, month, six months,year or lifetime period.
The impetus for this study arose from a research committee meet-ing in which the chief investigators spent considerable time debatingthe correct interpretation of one key questionnaire item of a commu-nity survey which contained the phrase, 'how much do you spendgambling' (Dickerson, Allcock, Blaszczynski, Nicholls, Williams & Mad-dern, 1996). It was variably argued that the phrase could be inter-preted to mean either the net amount lost, amount initially staked ortotal amount gambled during a session. The implication of this debatewas that responses could vary considerably depending on the individ-ual interpretation of the meaning of the phrase. This raises the con-cern as to the accuracy of reported survey data on expenditure pro-vided by population and problem gambler samples.
While much discussion has centered on survey methodology anddesign, it would appear that minimal attention has been directed tothe wording and derived meaning of individual questionnaire itemsand its impact on results obtained. In reviewing the literature, it be-came increasingly apparent that no clear guidelines on how to inter-pret the meaning of items such as 'how much do you spend gambling'or 'amount gambled per session' is offered in studies determininggambling expenditure. In most cases, the standard procedure is toaccept at face value the given response irrespective of the basis uponwhich the respondent calculated the figure. Such figures are then av-eraged to obtain an estimate of community or sub-population expen-diture patterns. For example, Dickerson, Baron, Hong and Cottrell(1996) calculated the 'number of days spent gambling multiplied bythe dollars spent in each session' to derive an estimate of weekly ex-penditure.
The Journal ofGambling Studies Special Issue, Vol. 12 (2) (1996) pro-
238

A. BLASZCZYNSKI, V. DUMLAO, AND M. LANGE
vides a comprehensive review and critique of international communityprevalence studies to date while Table 1 presents a brief summary oflevels of gambling expenditure by problem gamblers reported by anumber of studies in America, Europe and Australia.
In the majority of prevalence and clinical studies clear instructionson how to calculate the relevant amount are not provided, for exam-ple, whether to use net expenditure or turnover figures (wins subse-quently reinvested within the session). Respondents are simply askedto offer an estimate of the amount gambled during a session. Thisfigure is accepted as an index of that gambler's gambling expenditurewithout consideration of the arithmetic strategy used to derive it. Thisis a potential source of confusion in that it is not possible to determineif responses obtained refer to amount staked, outlay, turnover or netexpenditure (Haig, 1985). Each of these terms contains a specificmeaning and/or different nuance which has significant ramificationsfor the final figure. For example, use of turnover as compared to netexpenditure figures would serve to inflate the overall estimate. Accu-rate estimates of expenditure are important as these are often used asa clinical marker for risk behaviour and problem gambling (Walker &Dickerson, 1996; Volberg, Dickerson, Ladouceur and Abbott, 1996).
The purpose of this paper was to examine the consistency of re-sponses shown by a sample of respondents to which on the surfaceappears a simple and straightforward question included in surveys andclinical interviews; 'how much did you spend gambling over thelast. . . . .?'.
METHOD
Procedure
A brief questionnaire seeking information on basic gambling be-haviours and five case vignettes were presented to a group of 181 sec-ond year undergraduate medical students during the course of a se-mester lecture. The five case vignettes constructed each described ascenario of a person attending a gambling setting with a definedamount to invest, winning and/or losing during the course of play,and then leaving with a residual amount. The five case vignettes arelisted in Appendix 1. Instructions given to students required them to
239

240 JOURNAL OF GAMBLING STUDIES

A. BLASZCZYNSKI, V. DUMLAO, AND M. LANGE 241

242 JOURNAL OF GAMBLING STUDIES
answer three questions; 'how much was won', 'how much was lost'and the key item of interest, an estimate of 'how much was spentgambling'.
None of the vignettes presented described the gambler win-ning, that is, leaving the gambling premises with an amountgreater than that initially invested even though wins occurred dur-ing the course of individual sessions.
Subjects
All one hundred and eighty one students at the designated lec-ture returned the questionnaire. As some students missed individualitems, the number of respondents per item reported in the Resultssection varies between n = 169 to 181.
There were 99 (55%) males and 82 (45%) females in the sample.The average age of the total sample was 19.3 (sd = 1.3, range = 18-26) with no significant difference in gender or age (males; mean =19.4, sd = 1.5; females; mean = 19.2, sd = 0.9).
Table 2 provides a list of the proportion of subjects participatingin their reported favourite form of gambling.
Subjects reported taking an average of $AUD 72 (sd = $AUD 747,range = $AUD 0-10,000) of their own money to risk over a one dayperiod of gambling. The median amount taken over a day was $AUD 5with 82% of the sample taking $AUD 20 or less. Approximately 5%
Table 2Favourite Form of Gambling Reported by n = 181
Undergraduate Medical Students
Form of Gambling
CardsSlot machinesLotteriesHorse bettingMahjongOtherNone
No. ofSubjects
3821191289
72
Percentage(%)
21.211.710.66.74.55.5
39.8

A. BLASZCZYNSKI, V. DUMLAO, AND M. LANGE 243
risked amounts greater than $AUD 50 with three students (1.8%)each risking $AUD 200, $AUD 500 and $AUD 10,000, respectively.
The majority of subjects (63%) stated that they had rarelynever gambled. Thirty four percent reported sometimes gamblingwith 1.2% reporting doing so often or very frequently.
A further four subjects (2.9%) admitted that they had, or didhave, a problem with their gambling. A one-way analysis of varianceshowed a significant difference (F = 55.43, df = 1, 168, p <0.000) in amount taken to gamble with between those subjects ad-mitting a problem (m = $AUD 2,530, sd = $AUD 4,980, range$AUD 20-10,000) and the remainder of the sample (m = $AUD17, sd = $AUD 45, range = $AUD 0-500).
RESULTS
In order to limit the discussion of the results to the main objec-tives of this paper, only responses to the item 'how much was spentgambling?' have been presented. Specific responses and their frequen-cies are reported in Tables 3-7.
The information provided in Vignette No. 1 suggested that the
Table 3Responses to Questionnaire Item for N = 180 Students
(Vignette 1)
N
1153010
75
13
180
%
63.916.75.6
3.92.87.3
100
ResponseGiven
$40$120$160
$100$180
Type of Expenditure
Net expenditure: ($120 - ($120 + 60 -100))Initial investment: ($120)Initial investment pluss losses minus winnings:($120 + $100 -$60)Session loss: ($100)Investment plus winning: ($120 + $60)Other
Total

244 JOURNAL OF GAMBLING STUDIES
amount taken to the session was $120. Wins during the sessionamounted to a total of $60, followed by a loss $100.
At least five strategies were used in determining an estimate ofexpenditure. Two thirds of the sample derived expenditure in the fol-lowing manner. Subjects initially subtracted the $100 loss from thesum of the $120 investment plus $60 win to obtain a figure $80. This$80, the residual at the conclusion of the gambling session, was thensubtracted from the original $120 investment to arrive at the net ex-penditure figure of $40.
Thirty students (16.7%) said that amount spent was simply theinitial investment of $120. Other students (3.9%) believed thatamount spent was the amount lost during the course of the session,i.e. $100 while five students referred to the sum of winnings ($60) andamount invested ($120).
Ten students (5.6%) calculated the figure by considering the ini-tial amount invested as a loss together with losses incurred during thesession less any winnings. Only 2.8% provided an estimate equivalentto turnover. Other responses each offered by three or fewer studentswere $0, $5.50, $20, $80, $140, $220, and $300. It was not possible todetermine how such amounts were calculated by subjects.
In Vignette 2, there were two gambling sessions. Subjects wereinformed that the gambler entered the casino with an initial invest-
Table 4Responses to Questionnaire Item for N = 170 Students
(Vignette 2)
N
11428
227
8
179
%
63.715.6
12.33.9
4.5
100
ResponseGiven
$375$425
$400$450
Type of Expenditure
Net expenditure: ($400-$25)Initial investment plus winnings less residual:($400 + $50 - $25)Initial investmentInitial investment plus winnings: ($400 +$50)Other
Total
A. BLASZCZYNSKI, V. DUMLAO, AND M. LANGE 245
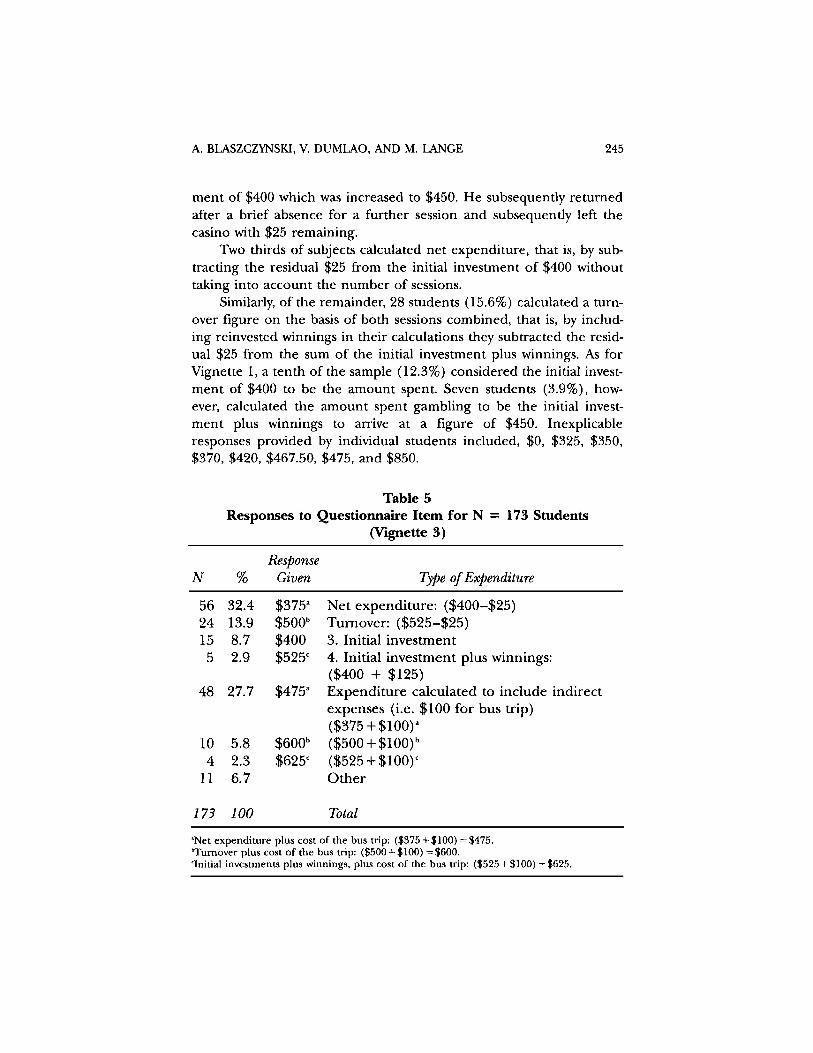
ment of $400 which was increased to $450. He subsequently returnedafter a brief absence for a further session and subsequently left thecasino with $25 remaining.
Two thirds of subjects calculated net expenditure, that is, by sub-tracting the residual $25 from the initial investment of $400 withouttaking into account the number of sessions.
Similarly, of the remainder, 28 students (15.6%) calculated a turn-over figure on the basis of both sessions combined, that is, by includ-ing reinvested winnings in their calculations they subtracted the resid-ual $25 from the sum of the initial investment plus winnings. As forVignette 1, a tenth of the sample (12.3%) considered the initial invest-ment of $400 to be the amount spent. Seven students (3.9%), how-ever, calculated the amount spent gambling to be the initial invest-ment plus winnings to arrive at a figure of $450. Inexplicableresponses provided by individual students included, $0, $325, $350,$370, $420, $467.50, $475, and $850.
Table 5Responses to Questionnaire Item for N = 173 Students
(Vignette 3)
N
5624155
48
104
11
173
%
32.413.98.72.9
27.7
5.82.36.7
100
ResponseGiven
$375a
$500b
$400$525C
$475a
$600b
$625C
Type of Expenditure
Net expenditure: ($400-$25)Turnover: ($525-$25)3. Initial investment4. Initial investment plus winnings:($400 + $125)Expenditure calculated to include indirectexpenses (i.e. $100 for bus trip)($375 + $100)a
($500 + $100)b
($525 + $100)c
Other
TotalaNet expenditure plus cost of the bus trip: ($375 + $100) =$475.bTurnover plus cost of the bus trip: ($500 + $100) =$600.cInitial investments plus winnings, plus cost of the bus trip: ($525 + $100) =$625.

JOURNAL OF GAMBLING STUDIES
Vignette 3 introduced expenses incidental to the gambling ses-sion, that is, an amount of $100 spent on a bus trip to travel to thecasino. As shown in Table 5, there was a greater variability in amountsrecorded for this vignette. Students were told that the gambler's initialinvestment was $400 which was increased to $450 after one session ofgambling. That amount increased to $525 from further winnings butthe gambler finally ended the session with only $25 left.
Fewer subjects, (32%) reported a net expenditure. Twenty foursubjects (13.9%) reported turnover, that is subtracting the remainingamount of $25 from the sum of the initial investment and winnings.Fifteen subjects (8.7%) considered the initial investment of $400 theamount spent in gambling.
Five subjects combined the initial amount invested with winningsfrom both sessions of gambling and reported this figure of $525 as theamount spent.
More than one third of the subjects (35.8%) included the cost oftransport within their definition of money gambled thus giving threedifferent estimates depending on which of the above strategies wereused in their calculations.
Again, inexplicable amounts reported included figures of $0,$125, $425, $512, $550, $1375. Excluding these inexplicable responses,we found that the overall recorded amounts ranged between $375 to$625.
In Vignette 4, we were interested in determining whether subjectswould include further withdrawals of gambling funds in their esti-mates. Students were informed that the gambler invested $75 in herfirst gambling session. During this session she won $25 but also lost$25. By the end of the session, she had no money left and conse-quently withdrew a further $50 which she gambled during secondgambling session. At the conclusion of this session, she was left withonly $15.
Slightly more than half the subjects (54.3%) provided a figurebased on net expenditure which incorporated the withdrawal. Twenty-two percent indicated that the amount spent in gambling was simplyequal to total amount invested in the gambling activity, i.e. $75 and$50.
Some responses were more difficult to interpret. Ten subjects re-ported that the gambler had spent $100. This amount was derived bycombining the initial investment of $75 with the $25 win.
246

Table 7Responses to Questionnaire Item for N = 171 Students
(Vignette 5)
N
10634118
12
171
%
62.019.96.44.77.0
100
ResponseGiven
$5$11$6$0
Type of Expenditure
Initial investmentTurnover ($5 + $6)Reinvested winningsNil amount spentOther
Total
Table 6Responses to Questionnaire Item for N = 173 Students
(Vignette 4)
N
94
38
10
7
24
173
%
54.3
22.0
5.8
4.0
13.9
100
ResponseGiven
$110
$125
$100
$135
Type of Expenditure
Net expenditure:($75 + $50 + $25 -$25 -$15)Initial investment plus supplemental with-drawal: ($75 + $50)Initial investment plus winning($75 + $25) ignoring lossesInitial investment plus supplemental with-drawal plus winnings minus residual($75 + $50 + $25 -$15)Other
Total
A. BLASZCZYNSKI, V. DUMLAO, AND M. LANGE 247

Seven subjects (4.0%) reported an estimate based on total invest-ments plus winnings but less the residual at the end of the secondsession. Other responses each reported by four subjects or fewer in-cluded, $0, $10, $45, $60, $90, $95, $105, $115, $120, $130, $142,$150, and $160.
In Vignette 5, subjects were provided with information that thegambler had spent $5 in total for 5 instant scratch lottery tickets. Ofthose tickets she had won $6 and she cashed them in for 6 moretickets which did not lead to any further wins. Sixty-two percent ofrespondents said that the gambler spent $5 in gambling which was theinitial investment on the first purchase of tickets.
However, a fifth (19.9%) of the subjects calculated turnover andsuggested the gambler had spent $11, an amount which was calculatedby adding the initial investment of $5 to the winning of $6. Curiously,eight students considered that the gambler had not spent any amountgambling in this vignette, possibly disregarding the initial $5 requiredto purchase the first 5 tickets. Eleven subjects said that the gamblerhad spent $6, referring to the total value of the six non-winning ticketsbut disregarding the initial investment. Other answers provided by twoor fewer students included, $1, $2, $3, $8, $9, $10, $12, and $16.
DISCUSSION
The results of this study suggest that the phrase 'how much doyou spend gambling' can be interpreted in various ways by survey re-spondents leading subjects to use different mathematical strategies incalculating estimates. Bets may include the re-investment of winningsreceived from earlier wagers. Therefore, the interpretation of what ismeant by 'expenditure' is determined by the decision to include orexclude wins (return to gambler) when arriving at an estimate ofamount gambled over any given time frame. In this exploratory survey,two thirds or less of a sample of non problem gambling medical un-dergraduate students interpreted the question 'how much do youspend gambling' to mean net expenditure calculated as the differentbetween the initial amount available at the commencement of a gam-bling session and the amount remaining at its conclusion. However,the remainder offered estimates based on turnover with a smaller pro-portion using alternative methods depending on characteristics associ-
248 JOURNAL OF GAMBLING STUDIES

ated with the vignettes. For example, a minority included incidentalexpenses such as travel costs which were spent to allow the gamblingto take place, or combined two separate sessions in close temporalproximity.
The extent to which overall results of surveys are biased will de-pend, of course, on the proportion of the sample who apply net ex-penditure rather than turnover criteria in calculating their response.Inflated estimates will be functionally related to the proportion of sub-jects who report turnover and/or include incidental expenses in theirfigures. Whether or not the resulting bias will significantly distort thetrue picture, or if problem gamblers show a similar variability in theirmethod of calculating estimates is yet to be determined. But the find-ings of this study suggests that greater attention needs to be directedto clarifying precisely what is being asked for in survey items. A con-sensus should be reached amongst researchers as to whether net ex-penditure or turnover is the more accurate or desirable statistic toreport. Following this, survey instructions should include clear defini-tions of the terms used and guidelines to apply in calculating estimatesin order to achieve standardized data.
Some definitions are offered as a guide. A 'stake' can be consid-ered as the amount risked on an individual event; a horse race, oneplay on a gaming device or one draw of a lottery. 'Outlay' refers to thetotal of multiple bets risked on one event or over a specified timeframe such as one gambling session. Only the first stake ever taken canbe construed as unambiguously representing the gambler's real net or'out-of-pocket' expenditure. This is a real cost to the gambler if theoutcome is a loss. Subsequent stakes may include the re-investment ofearlier wins, that is, turnover.
Turnover refers to the total amount gambled inclusive of winswhich are re-invested. Expenditure is used to describe the amountgambled less winnings, that is, gross profit to the operator. This isequivalent to 'net expenditure' or its synonym, 'out-of-pocket' expen-diture. Turnover has the effect of inflating estimates of gambling ex-penditure.
It is suggested that the most relevant estimate of gambling expen-diture is net expenditure. This reflects the actual amount of moneythe gambler has gambled and represents the true cost of gambling tothe individual. It is recommended that future prevalence studies pro-vide adequate instructions on how to calculate the net expenditure by
A. BLASZCZYNSKI, V. DUMLAO, AND M. LANGE 249

JOURNAL OF GAMBLING STUDIES
drawing subjects' attention to the difference between amounts in-vested and the residual at the conclusion of each session. It is sug-gested that wins reinvested during particular individual sessionsshould be ignored.
REFERENCES
Abbott, D.A., & Cramer, S.L. (1993). Gambling attitudes and participation: a Midwestern survey.Journal of Gambling Studies, 9 (3), 247-263.
Bergh, C., & Kuhlhorn, E. (1994). Social, psychological and physical consequences of pathologicalgambling in Sweden. Journal of Gambling Studies, 10 (3), 275-285.
Dickerson, M. G., Hinchy, J., & Legg England, S. (1990). Minimal treatments and problem gam-blers: a preliminary investigation. Journal of Gambling Studies, 6 (1), 87-102.
Dickerson, M.G., Allcock, C., Blaszczynski, A., Nicholls, B., Williams, J. & Maddern, R. (1996). Anexamination of the socio-economic effects of gambling on individuals, families and the community, includ-ing research into the costs of problem gambling in New South Wales. Sydney: Australian Institute forGambling Research.
Dickerson, M. G., Baron, E., Hong, S., Cottrell, D. (1996). Estimating the extent and degree ofgambling related problems in the Australian population: a national survey. Journal of GamblingStudies, 12(2), 161-178.
Haig, B. (1985). Expenditure on legal gambling. In G. Caldwell, B. Haig, M. Dickerson, & L. Sylvan(eds.) Gambling in Australia. Sydney: Southwood Press.
Ladouceur, R., Boisvert, J-M., Pepin, M., Loranger, M., & Sylvain, C. (1994). Social cost of patholog-ical gambling, Journal of Gambling Studies, 10 (4), 399-409.
Mikesell, J.L. (1991). Lottery expenditure in a non-lottery state. Journal of Gambling Studies, 7 (2),89-98.
Schwarz, J. & Lindner, A. (1992). Inpatient treatment of male pathological gamblers in Germany.Journal of Gambling Studies, 8 (1), 93-109.
Smith, GJ. (1992). Sucker bet or sure thing: a critical analysis of sports lotteries. Journal of GamblingStudies, S (4), 331-349.
Volberg, R.A., Dickerson, M., Ladouceur, R., & Abbott, M.W. (1996). Prevalence studies and thedevelopment of services for problem gamblers and their families. Journal of Gambling Studies,12(2), 215-231.
Walker, M.B., & Dickerson, M.G. (1996). The prevalence of problem and pathological gambling: acritical analysis. Journal of Gambling Studies, 12 (2), 233-249.
Received December 17, 1997; accepted December 23, 1997.
250
APPENDIX 1
Five Case Vignettes Used in the Study
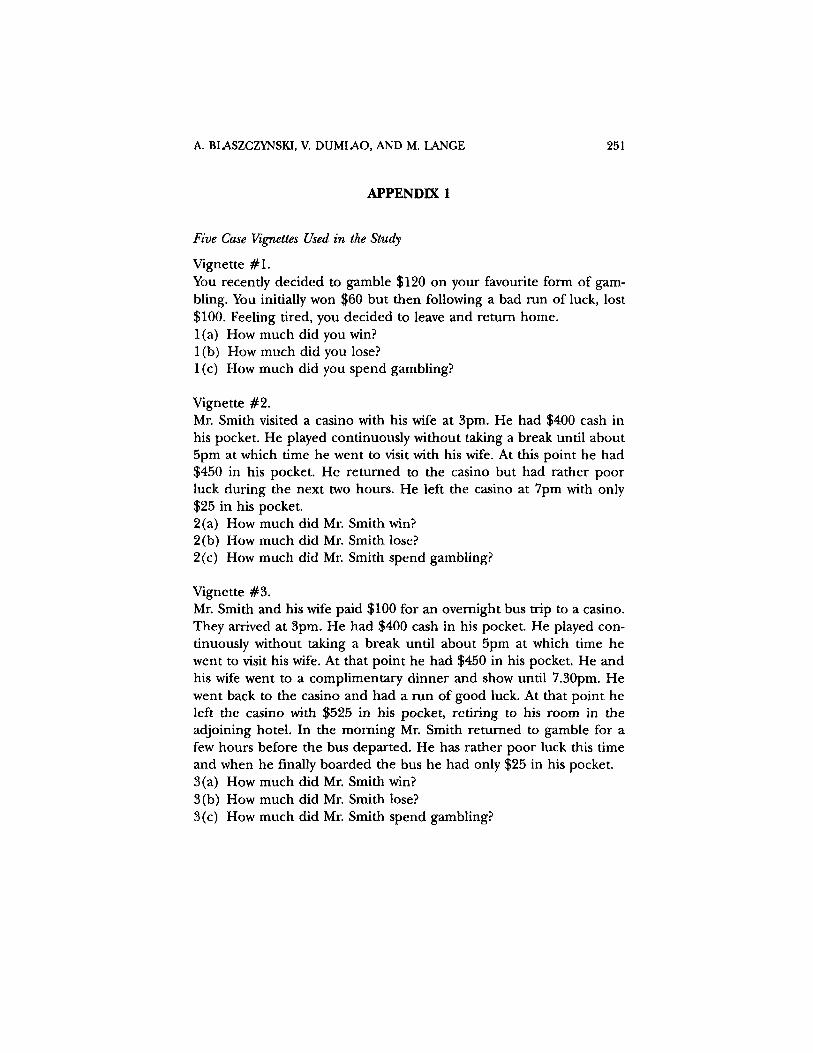
Vignette #1.You recently decided to gamble $120 on your favourite form of gam-bling. You initially won $60 but then following a bad run of luck, lost$100. Feeling tired, you decided to leave and return home.1 (a) How much did you win?1 (b) How much did you lose?1 (c) How much did you spend gambling?
Vignette #2.Mr. Smith visited a casino with his wife at 3pm. He had $400 cash inhis pocket. He played continuously without taking a break until about5pm at which time he went to visit with his wife. At this point he had$450 in his pocket. He returned to the casino but had rather poorluck during the next two hours. He left the casino at 7pm with only$25 in his pocket.2 (a) How much did Mr. Smith win?2(b) How much did Mr. Smith lose?2(c) How much did Mr. Smith spend gambling?
Vignette #3.Mr. Smith and his wife paid $100 for an overnight bus trip to a casino.They arrived at 3pm. He had $400 cash in his pocket. He played con-tinuously without taking a break until about 5pm at which time hewent to visit his wife. At that point he had $450 in his pocket. He andhis wife went to a complimentary dinner and show until 7.30pm. Hewent back to the casino and had a run of good luck. At that point heleft the casino with $525 in his pocket, retiring to his room in theadjoining hotel. In the morning Mr. Smith returned to gamble for afew hours before the bus departed. He has rather poor luck this timeand when he finally boarded the bus he had only $25 in his pocket.3 (a) How much did Mr. Smith win?3 (b) How much did Mr. Smith lose?3(c) How much did Mr. Smith spend gambling?
A. BLASZCZYNSKI, V. DUMLAO, AND M. LANGE 251
JOURNAL OF GAMBLING STUDIES
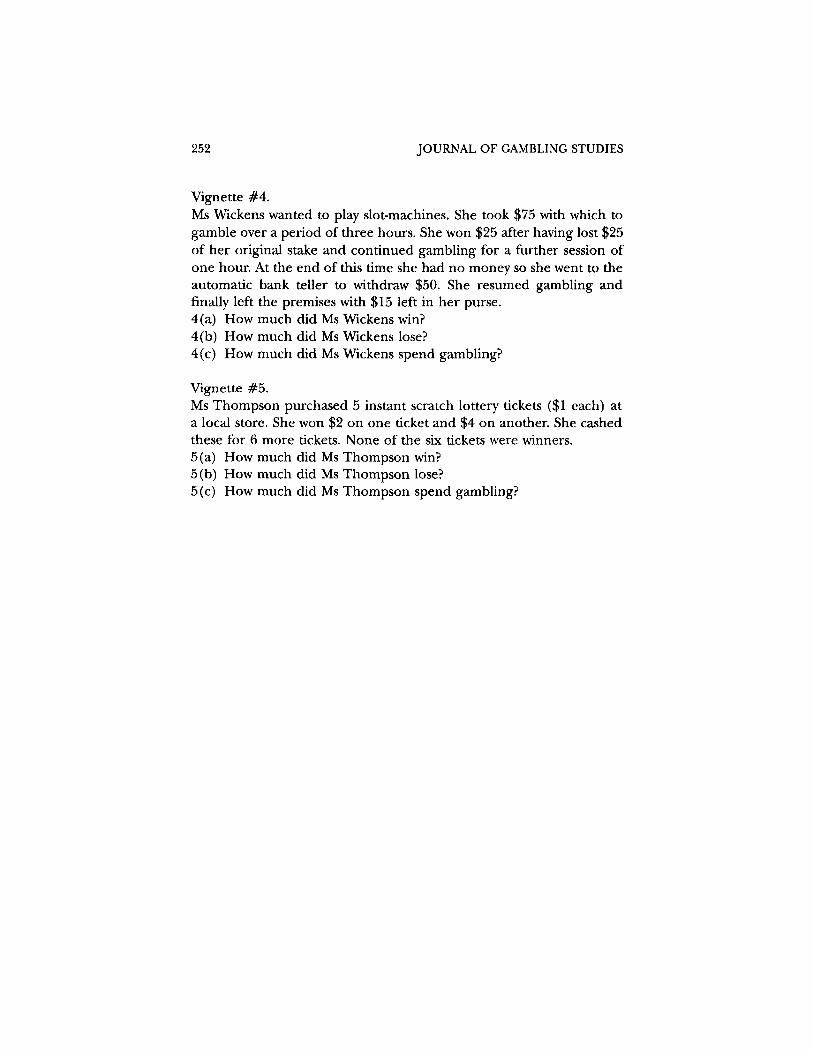
Vignette #4.Ms Wickens wanted to play slot-machines. She took $75 with which togamble over a period of three hours. She won $25 after having lost $25of her original stake and continued gambling for a further session ofone hour. At the end of this time she had no money so she went to theautomatic bank teller to withdraw $50. She resumed gambling andfinally left the premises with $15 left in her purse.4 (a) How much did Ms Wickens win?4(b) How much did Ms Wickens lose?4(c) How much did Ms Wickens spend gambling?
Vignette #5.Ms Thompson purchased 5 instant scratch lottery tickets ($1 each) ata local store. She won $2 on one ticket and $4 on another. She cashedthese for 6 more tickets. None of the six tickets were winners.5 (a) How much did Ms Thompson win?5(b) How much did Ms Thompson lose?5(c) How much did Ms Thompson spend gambling?
252