how leader s age is related to leader effectiveness ...essay.utwente.nl/67403/1/final thesis carlijn...
TRANSCRIPT
How leader’s age is related to leader
effectiveness: Through leader’s affective state and leadership behavior
Author: Carlijn Boerrigter
University of Twente P.O. Box 217, 7500AE Enschede
The Netherlands
Supervisors:
Drs. A.M.G.M. Hoogeboom
Prof. Dr. C.P.M. Wilderom
ABSTRACT This study examines the effect of leader’s age on leader’s affective state, leadership behavior and the overall leader
effectiveness. Methods used in the present study entail: 1) inter-reliable coding of leader behaviors, captured
through video recordings made during regular staff meetings; and 2) surveys that measured followers’ perception
of the leader and leaders’ perception of the staff meeting and of their own leadership skills. The data consist of 32
leaders and 405 followers who are employed by a large Dutch public-sector organization. No direct and indirect
relationship between leaders’ age and leader effectiveness is found. Instead, the results revealed a significant
negative link between leader’s negative affect and transformational leadership. In the discussion we reflect on the
findings of the study, sketch some practical implications, and highlight some strengths and limitations.
Keywords Age, affective state, Positive Affect, Negative Affect, PANAS, observed leadership behavior, transactional
leadership behavior, transformational leadership behavior, effective leadership.
Permission to make digital or hard copies of all or part of this work for personal or classroom use is granted without fee provided that copies are
not made or distributed for profit or commercial advantage and that copies bear this notice and the full citation on the first page. To copy otherwise, or republish, to post on servers or to redistribute to lists, requires prior specific permission and/or a fee.
5th IBA Bachelor Thesis Conference, July 2nd, 2015, Enschede, The Netherlands.
Copyright 2015, University of Twente, The Faculty of Behavioural, Management and Social sciences.
1. INTRODUCTION Effective leadership is an important factor for organizational
success. Especially within the field of leadership, behavior is
widely regarded to be one of the most influential factors. An
important classification or behavioral taxonomy is that of
Avolio (1999) and Bass (1998); the transactional-
transformational leadership theory. Transactional leaders
motivate their followers to fulfil their leaders’ expectations by
rewarding and monitoring followers’ task executions (Burns,
1978). Transactional leadership behavior is similar to task-
oriented behavior (Yukl, Gorden & Taber, 2002). Task-oriented
leadership reflects behaviors focused on promoting efficient and
effective task accomplishment, clarifying, explaining and
informing (Yukl, 2013). In contrast to transactional behavior,
there are also leaders who show transformational behaviors
(Yukl, 2013). Transformational leaders inspire followers to
work for collective goals and move beyond their own self-
interests. Transformational behavior relates to relation-oriented
behavior (Bass, 1990). This leadership behavior tries to
motivate and stimulate their followers to perform well.
Relation-oriented leadership reflects behaviors that display the
urgency of interpersonal relationships (e.g., treating followers
as equals, being friendly and approachable; Yukl, 2013). Yukl’s
taxonomy shows convincingly that leaders’ relation-oriented
and task-oriented behaviors are both important and should be
included when studying leader behaviors in organizational
settings such as regular staff meetings.
Apart from leader behavior, which has been found to be an
important determinant for leadership effectiveness in the
literature, age is considered to be another important
determinant. Drawing upon the early trait theories (Bass, 1990;
Stogdill, 1948), a leaders’ chronological age is one of the most
important demographic factors in relation to effectiveness.
Particularly noteworthy is the relation between the age of
world’s greatest political leaders and the world’s greatest
political revolutionaries. The group ‘world’s political
revolutionaries’ is characterized predominantly by younger
individuals rather than older ones, while nearly all political
leaders achieve top political positions over the age of 40. In
addition, most nascent entrepreneurs tend to be younger than 35
whereas the median age for the CEO’s of Fortune 500
companies is 55 (Blondel, 1980; Korunka, Frank, Lueger, &
Mugler, 2003; Rejai & Phillips, 1979). The patterns mentioned
above, show that both younger and older leaders are effective in
their own field. Therefore, leader effectiveness is interesting to
study with a wide variance in age.
The study of leadership behavior and age is interesting for
several reasons (Zacher & Frese, 2009). For instance,
demographic changes (i.e., the anticipation of longer working
lives results in an outlook of a rapidly aging workforce) have
led to an increased interest in the study of leadership behavior
and age (Farr & Ringseis, 2002; Kanfer & Ackerman, 2004).
Therefore, studying leadership in relation to age is also of
practical importance for organizations. Older workers remain
employed longer (due to changing political regulations) and
declining birth rates have dramatically increased the share of
older employees (Hedge, Borman & Lammheim, 2006).
Accordingly, issues surrounding the management of an aging
workforce are beginning to take center-stage in many areas of
organizational research (Hedge & Borman, 2012). More
generally, Schaie and Wilis (2011) studied the psychological
effects of aging. From a leadership perspective, the most
interesting findings in this literature are that an individual’s age
has consequences for their emotional functioning and affective
state (Scheibe & Zacher, 2013). Because leadership is
inherently an emotional phenomenon, age may decisively
influence key aspects of leadership, such as the behavior that
they show (Ashkanasy & Tse, 2000; George, 2000). With this,
we examine the effect of leaders’ age on their positive affective
and negative affective state.
Zacher, Rosing and Frese (2011) conclude that “leadership
researchers have hardly considered age as a substantial
concept” (p. 43). Current studies about leaders’ age and
leadership behaviors have shown mixed results (DeRue,
Nahrgang, Wellman & Humphrey, 2011). Moreover, in
contemporary research leaders’ age has featured as control
variable (Walter & Scheibe, 2013). During this study, we tested
the direct effect of age on leader effectiveness and examined the
indirect effect of leaders’ age on leader effectiveness, mediated
by leader affective state and leadership behavior. Besides that,
DeRue et al. (2011) designed a classification scheme which
summarized studies that linked age and leadership behavior.
Most studies in this classification scheme rely only on
quantitative survey measures (Hit & Tyler, 1991; Barbuto,
Fritz, Matkin, & Marx, 2007; Ng & Sears, 2012). Based on this
scheme, Walter and Scheibe (2013) developed a novel,
theoretical, emotion-based framework that explained age-
leadership behavior linkages. They have integrated theories of
emotional aging with research on emotions and leadership, but
empirical work is missing. We bridge this gap by empirically
testing leadership behavior with leaders’ age and their affective
state.
Furthermore, there is hardly any literature linking age and
leader affective state. Joseph, Dhanani, Shen, McHugh,
McCord, (2015) examined in their meta-analysis the
relationship between leader trait affectivity and leadership
criteria such as transformational leadership, transactional
leadership and leadership effectiveness. The analysis of Joseph,
Dhanani, Shen, McHugh and McCord (2015) does not address
the variable ‘age’ with leader trait affect and leadership criteria.
Through our present study we aim to contribute to the extant
literature by examining whether leadership effectiveness is
influenced by age. In order to do this, we will assume a research
model of leaders’ age and leadership effectiveness and examine
whether two additional variables, leaders’ affective state and
leadership behavior, mediate this relationship. In the appendix,
a figure is added which contains the research model.
So the research question is: “What is the influence of leader’s
age on leadership effectiveness and how mediate leader’s
affective state and leadership behavior this relationship? “
Furthermore, the present study differs among others through the
use of a video observation method. The behavior of leaders and
their followers during regular staff meetings will be observed
and coded using a behavioral coding scheme. Few existing
studies used such observational methods.
2. THEORY AND HYPOTHESES According to the psychological literature, researchers suggest
that age relates to leadership in a complicated way. Evidence
for the relation between age and leadership can be found in
professions that require a substantial amount of specialized
knowledge and experience, such as in science, politics, and arts
(Van Vugt, 2006). As previously noted, it is commonly
believed that age and experience may play important roles in
the behaviors that leaders display. However, most studies on
age and leadership are limited to either retirement or
adolescence (Barbuto, et al., 2007). In this section, we set out
theoretical background of age, leaders’ affective states and
leadership behavior. First, we discuss the trait variable ‘age’.
Second, we set out positive and negative affective states and

examine the relationship of age and affective states. After that,
we set out the different leadership behaviors (transactional
leadership behavior and transformational leadership behavior)
and examine the relationship between affective state and
leadership behavior and the relationship between age and
leadership behavior. Following that we shall propose how
effective leadership might be related to transactional or
transformational-oriented leadership behavior. In the appendix,
an illustrated hypotheses scheme is added.
2.1 Age Styles of leadership may vary based upon age. Cagle (1988) has
emphasized that age is one of the most important factors that
determine the leadership style. It is commonly believed that age
and experience are important contributors when determining
which behavior a leader displays. Ahiazu (1989) suggests that
in many cultures people see experience as a function of age.
Emotional aging research has identified common changes in the
emotional experience which influence behavior. These changes
concern specific gains and losses in individuals’ affectivity
(Watson & Naragon, 2012). Walter and Scheibe (2013) argued
that such changes can influence leaders’ behaviors and
outcomes and, thus, may serve as mediating mechanisms
between age and leadership behavior. In our research we link
the developments of emotional aging; which is a dependent
outcome of age, toward leaders’ positive and negative affective
state. In the current research we focus on chronological age.
Schalk et al. (2010) identified chronological age as “the first
and primary conception of age” (p. 79). In this study we focus
solely on chronological age, as the measure of leaders’ age
consisted only of one question in our survey such as: ‘How old
are you?’
2.2 Positive affect and negative affect Watson, Clark and Tellegen (1988) presented a two-factor –
positive affect and negative affect – model. This so-called
‘PANAS schedule’ consists of positive and negative affect
scales and is considered to be reliable and valid. The positive
affect and negative affect scales represent affective state
dimensions. The following ten sufficient descriptors for positive
affect scale are developed in the PANAS method: attentive,
interested, alert, excited, enthusiastic, inspired, proud,
determined, strong and active (Watson, Clark & Tellegen,
1988). High positive affect is a state of high energy, full
concentration, and pleasurable engagement (Watson &
Tellegen, 1985). This kind of state reflects stable individual
differences in positive emotional experience (Watson &
Naragon, 2009). Positive affect is associated with top-down
processing used in response to familiar and kindly
environments. This means that positive affect used heuristic
approaches that rely on existing knowledge and assumptions
(i.e., in the field of organizational decision making) (Forgas &
Bless, 2006).
In contrast, negative affect is a general dimension of subjective
distress and unpleasable engagement that expresses a variety of
aversive mood states, including anger, contempt, disgust, guilt,
fear, and nervousness. The PANAS method developed ten
sufficient descriptors for negative affect scale. These ten final
versions consisted of two terms from each of the other five
traits: distressed, upset (distressed); hostile, irritable (angry);
scared, afraid (fearful); ashamed, guilty (guilty); and nervous,
jittery (jittery). Tellegen (1985) suggested that high negative
affect is a major feature of anxiety and depression. Negative
affect is related to self-reported stress and coping (Clark &
Watson, 1986). Negative affect is associated with bottom-up
processing in response to unfamiliar or problematic
environments, and promotes controlled approaches that rely on
externally drawn information (Forgas & Bless, 2006).
Also positive affect and negative affect are related to individual
differences in positive and negative emotional reactivity
(Tellegen, 1985; Watson & Clark, 1984). Positive affect and
negative affect correspond to the dominant personality factors
of extraversion and anxiety, and are related to individuals’
emotional experience (Tellegen, 1985; Watson & Clark, 1984;
Watson & Naragon, 2012). Another important finding is that
research has identified that positive affect is relatively
independent from negative affect (Watson & Clark, 1984).
Other scholar also mentioned this, for instance Thompson
(2007). In his qualitative and exploratory quantitative study he
developed and validated a short-form of the PANAS schedule.
Thompson (2007) reported positive affect and negative affect
with low correlating dimensions. Also Bradburn (1969)
demonstrates that the two affect dimensions were independent
of one another. Hence, scores on one affect dimension did not
predict the score on the other affect dimension: therefore,
positive and negative affect was not an extreme pole of one
underlying dimension, but of two separate dimensions.
Therefore, in this study the two affective state dimensions are
discussed independently of one another, and we discuss how
they are related to age and leadership behavior.
2.2.1 Relation between age and affective state Existing studies have found significant age effects on leaders’
affective state and overall effectiveness. Surprisingly, there are
complex and contradictory pattern of findings (Walter &
Scheibe, 2013). Doherty (1997), for example, reported that
younger leaders were perceived as more effective than older
leaders. In contrast, Shore, Cleveland and Goldberg (2003)
found that leader age and follower satisfaction were positively
related among older followers but negatively related among
younger followers. Overall, studies regarding the relation
between positive and negative affect and age predict that as
people get older, they are increasingly motivated to experience
positive feelings and avoid negative feelings (Scheibe &
Zacher, 2013). This assumption is supported by other work. For
instance, Blanchard-Fields (2007) argued that older individuals
repeatedly encounter emotional situations and so they learn to
better comprehend and resolve such events. Besides that, older
individuals can predict the emotions elicited by future events
more correctly. Löckenhoff, O’Donoghue and Dunning (2011);
Scheibe, Mata and Carstensen (2011) report that older
individuals have higher control of their emotions. Also, other
recent studies have shown that older individuals’ daily emotions
are more positive and stable compared to younger individuals’
(Scheibe, et al., 2011; Riediger, Schmiedek, Wagner, &
Lindenberger, 2009). This implies that older leaders’ shown
more positive affect. This development is mainly driven by a
reduction in high-arousal negative affective state (e.g., anger)
and an increase in low-arousal positive state (e.g., contentment)
whereas low-arousal negative affective state (e.g., sadness) and
high-arousal positive affective state (e.g., enthusiasm) remain
relatively unchanged (Scheibe, English, Tsai, & Carstensen,
2013; Stone, Schwartz, Broderick, & Deaton, 2010). Another
important finding is that older individuals prioritize positive
information over negative information (Reed & Carstensen,
2012) and therefore pay greater attention to positive versus
negative social cues, which positively affects the display of
positive affective emotions (Kellough & Knight, 2012).
As mentioned in the previous paragraph, negative affect is
associated with bottom-up processing in response to unfamiliar
or problematic environments. Younger leaders are less
experienced and therefore more dependent upon outside
information with controlled approaches that relies on externally

drawn information (Forgas & Bless, 2006). This result
contributes to the prediction that younger leaders show more
negative affective state. Hence, we propose the following
hypotheses:
H1a: An older leader displays more positive affective state.
H1b: A younger leader displays more negative affective state.
2.3 Leadership behavior In the past half century, hundreds of survey studies have
examined the correlation between leadership behavior and
various indicators of leadership effectiveness (Bass, 1990;
Yukl, 2002). A major problem in research and theory on
effective leadership has been the lack of agreement about which
behavior categories are relevant and meaningful for leaders
(Yukl Gordon & Taber, 2002). Scholars are aware of how
difficult it is to compare and integrate results from studies that
use different sets of behavioral categories. Occasionally,
different terms have been used to refer to the same type of
behavior. At other times, the same term has been defined
differently by various theorists. Based on previous observations
in an existing study (Rackham & Morgan, 1977), a leader
shows various activities in a group context. These activities
include: ‘seeking information, giving information, testing
understanding, summarizing, procedural proposals, content
proposals, supporting, disagreeing, defending/attacking and
building’. Hence, when examining leader behavior, it is
therefore important to take into account the so-called “full
range” of leadership behavior (Bass & Bass, 2008; Avolio,
Bass, & Jung, 1999; Bass, 1985; Bass & Avolio, 1994). The full
range of leadership behavior consists of three general types of
leadership: transactional (contingent reward, active
management by exception, passive management by exception),
transformational (individual consideration, idealized influence,
intellectual stimulation, and inspirational motivation) and
laissez-faire. This full range model was developed to broaden
the range of leadership styles typically investigated in the field.
It is necessary to measure the validity of the full range of
leadership behaviors. Bass (1985) developed ‘the Multifactor
Leadership Questionnaire (MLQ)’. The MLQ measured both
transactional and transformational leader behavior. It includes
the complementary dimensions of transformational and
transactional leadership with sub-scales to further differentiate
leader behavior. Also Yukl (2012) developed an instrument,
namely, the 2-factor ‘task-versus relation oriented behavior
model’. Yukl’s and Bass’ leader behavior models overlap each
other in the leadership literature. Therefore, in our study we
examine transactional versus transformational leadership
behavior.
2.3.1 Transactional leadership behavior Bass (1990) characterizes a transactional leader as one which
focuses on transactions between leaders and employees. This
transaction includes: “The transaction of promising and reward
for good performance, and on the other hand threatening and
disciplining for poor performance” (p. 20). The leader gets
things done by making and fulfilling the promises of
recognition. Prominent examples include initiating structure
(e.g., clarifying task roles, coordinating followers’ actions
structure and structuring the conversation). Two dimensions
that characterize transactional leadership style are contingent
reward and management-by-exception (active and passive).
Contingent reward consists of offering rewards for good
performance and effort. Employees receive incentives after they
accomplish their tasks to stimulate their task motivation.
Management by exception is split up into two forms. The active
form consists of watching and searching for deviations from
rules and standards and takings corrective action (i.e., actively
monitoring before mistakes are made). Passive management by
exception is shown after standards are not met (i.e., correcting
after mistakes are made). In the passive form, the leader does
not give direction if the old ways are satisfying and followers
still achieve the performance goals (Hater & Bass, 1988). Bass
and Riggio (2006) suggest leaders with a large span of control
used management by exception passive more often. Bass and
Riggio (2006) suggest that some behaviors lead to more
committed, loyal and satisfied followers than others. Also
Waldman, Bass and Yammarino (1990) showed in their study
that contingent reward behavior can be seen as the basis of
effective leadership. Contingent reward is transactional when
these incentives are material (e.g., bonus). These findings are
also established by Bass and Avolio (1994). In their full range
of leadership model, contingent reward leadership was the only
leadership behavior that was seen as effective. More ineffective
compared with contingent reward is management by exception.
Bass and Avolio (1994) showed that leaders who use
management by exception lack both inspirational appeal and
motivational power.
Since transactional leadership is based on the concept of
exchange, whereby the leader engages in monitoring follower
activities, task monitoring can be seen as a key transactional
leader behavior (Bass, 1990). Besides the rewarding behavioral
dimension of transactional leadership behavior, Judge and
Piccolo (2004); Lowe, Kroeck and Sivasubramaniam (1996)
and Podsakoff, Bommer, Podsakoff, and MacKenzie, 2006)
have highlighted the importance of task monitoring in
leadership. Hence, we linked transactional leadership with task-
oriented leadership behavior. Yukl et al. (2002) founds that
transactional leadership include some task behaviors. These
task behaviors include: short-term planning, clarifying
responsibilities and performance objectives and monitoring
operations and performance (Yukl et al., 2002). Hogdgson
(2004) noted that task-oriented style leads to relative goal
stability with active planning and structuring. Followers know
what is expected of them and they clearly understand the
messages and goals to be reached (Putman and Sorenson,
1982). This is a main objective of the transactional leadership
style.
2.3.2 Transformational leadership behavior Scholars have introduced the concept of transformational
leadership. House (1977) has published an article on
transformational leadership, Burns (1978) write about
transformational leadership, and Bass (1985) published his
book ‘Leadership and Performance beyond Expectations’. An
important insight is that Bass (1985) differs from Burns’ work.
Burns (1978) viewed transactional and transformational
leadership as opposites ends of the same continuum and leaders
could only be transformational if results and goals are satisfied.
Bass (1985) noted that “most leaders do both but in different
amounts” (p. 22). He argued that transactional leadership
provides the base for effective leadership and performance at
expected standards, while transformational leadership leads to
performance beyond expectations. Hence, transactional leaders
ensure that expectations are met, which is the foundation on
which transformational leaders build to motivate their followers
to perform beyond expectations. This opinion is shared in other
work (e.g., Burns, 1978; Trottier, Van Wart, and Wang 2008).
Hater and Bass (1988) and Howell and Avolio (1993) have
shown that the more effective leaders are both transactional, in
a path goal sense, and transformational, which is referred to as
‘the augmentation effect’. This effect assumes that the
transformational leadership style is expected to be ineffective
without a transactional relationship between leader and follower
(Bass, Avolio & Goodheim, 1987). Therefore, transactional

leadership behavior adds to the effectiveness of a leader with a
transformational leader behavior (Bass, Avolio, Jung, &
Berson, 2003; Hater & Bass, 1988; Bass, 1985; Wofford &
Goodwin 1994).
Bass (1990) defined transformational leadership as “superior
leadership” (p. 21). Transformational leadership is
characterized by the four l’s: Idealized influence, inspirational
motivation, individual consideration and intellectual
stimulation. Idealized influence means that followers identify
with their leaders and respect and trust them. Inspirational
motivation refers to creating and communicating an attractive
vision of the future and to the leaders’ own optimism about this
future. These behaviors are important in motivating followers to
use their capabilities for collective goals and emphasizing
collective identities. Individual consideration means that leaders
are mentors for followers and that they have attention for the
fact that every follower had his or her own needs and abilities.
Thereby, leaders enhance the personal development of
followers (Bass et al., 2003). Individualized consideration is
recognized by several leadership scholars as a key factor in
influencing follower satisfaction as well as high performance
outcomes (Bass & Bass, 2008; Gardner, Avolio, Luthans, May,
& Walumbwa, 2005; Schriesheim, Wu & Scandura, 2009;
Yukl, 2006). The reason for this isat leaders who show
individualized consideration address the uniqueness of
individuals. This results in progressing individual potency.
Finally, intellectual stimulation refers to challenging followers
to rethink some of their ideas and to take a different perspective
on the problems they face in their work. Hereby, new thinking
patterns are encouraged (Avolio & Bass, 2004).
Leaders who applied transformational leader behavior may be
charismatic to their followers and thus inspire them. Besides
that, they may meet the emotional needs of each employee and
they may therefore intellectually stimulate followers (Bass,
1990). Charismatic leaders inspire and excite their employees
with the idea that they may be able to accomplish great things
with extra effort. Therefore, charismatic leadership is a central
succeeding characteristic.
2.4 Relation between age, leader affective
state, leadership behavior In the previous paragraphs we explored the effects of positive
affective state and negative affective state on leaders’ age and
we discussed the two main leadership behaviors; transactional
leadership behavior and transformational leadership behavior.
In this paragraph we connect leader affective state and
leadership behavior to each other. Subsequently, we relate
leadership behavior to age.
2.4.1 Relation between positive and negative
affective state and leadership behavior Joseph et al. (2015) noted that the role of leader affective state
is a meaningful predictor of leadership behavior. In their meta-
analysis, Joseph et al. (2015) studied the relationship between
leader trait affectivity and several leadership criteria (including
transformational leadership, transactional leadership and
leadership effectiveness) and found that the relationship
between leader’s affectivity states and leadership effectiveness
operates through transformational leadership. Transformational
leaders display positive emotions to communicate a vision,
motivate followers and elicit positive behavioral change (Rubin,
Munz & Bommer, 2005). Bass and Avolio (1994) also shared
this view by suggesting that leader’s positive emotional
displays (a characteristic of transformational behavior) foster
high quality follower relationships and engender positive
emotions in followers. Relevant to the current study, the
scholarly literature on leader affect and leadership behavior
suggests that leaders who score high on positive affect often
display positive affective state which also influence follower
positive affective state (Bono & Ilies 2006; Eberly & Fong
2013; Johnson, 2009; Newcombe & Ashkanasy, 2002; Sy, Côté
& Saavedra, 2005). This process is the so-called mood
contagion processes. The relationship between leader’s positive
affective state and leadership criteria (i.e., leadership behavior)
proposed a positive relationship that is driven by this mood
contagion processes. This process suggests that positive affect
of the leader influences followers’ positive affective state that
subsequently results in leadership effectiveness. Thus, as noted
by George and Brief (1992), ‘leaders who feel enthusiastic and
energetic themselves are likely to similarly energize their
followers, whereas leaders who feel distressed and hostile are
likely to negatively activate their followers’ (p.84). Recently
scholars (Gaddis, Connelly & Mumford, 2004; Lewis, 2000 and
Newcombe & Ashkanasy, 2002) argued that leaders who
express positive affect are perceived as more effective and
charismatic than those who do not. Hereby, the expressions of
positive affect can be seen as one of the specific behavior
indicators of charismatic leadership (Bass, 1985). Charisma is a
central point in transformational leadership. Damen,
Knippenberg and Knippenberg (2008) have also supported the
positive relationship between positive affect and
transformational leadership behavior. In their scenario
experiment, Damen, Knippenberg and Knippenberg (2008)
found that charismatic leaders display more positive emotions.
Bono and Ilies (2006) have supported this point as well.
Moreover, Avolio and Bass (2002) mentioned that
transformational leadership behavior consists of affect-related
content (e.g., displays of optimisms), while a leader who shows
transactional leadership behavior is more focused on rewarding
followers for their task-related exchanges. Therefore,
transactional leadership is more of an economic exchange
between leaders and followers (i.e., if followers perform well,
they are rewarded) and less of an emotional exchange, which is
involved in transformational leadership behavior. Thus, we
expect that positive affective state is positively related to
transformational leadership behavior.
In contrast, negative affect displays feelings of distress, anger
and fear. Existing research mentioned that mood contagion
processes can also be applied to leaders’ negative affect-
leadership relation (Johnson, 2008; Sy et al., 2005). In addition,
Gaddis, Connelly and Mumford (2004), Lewis (2000) argued
that the process of contagion results in lower ratings of
transformational leadership and leadership effectiveness.
Moreover, we could argue that leaders’ negative affective state
should be a part of a leader’s transactional exchange process
with a follower who is underperforming. This transactional
exchange process consists of the transaction of promising and
reward for good performance, and on the other hand threatening
and disciplining for underperforming. Therefore, we could
assume that negative affect is related to transactional leadership
behavior.
In sum, the previous arguments lead to the following
hypotheses:
H2a: Positive affective state is positively related to
transformational leadership behavior.
H2b: Negative affective state is positively related to
transactional leadership behavior
2.4.2 Relation between age and leadership
behavior Leaders who used a transformational leadership style create an
emotional bond between leader and follower by arousing

enthusiasm for a common vision. Therefore transformational
leadership goes beyond rational exchanges. This statement is
examined by Kearney (2008). In his field study Kearney
showed a positive relationship between leaders’ age and
transformational leadership behavior. Kearney (2008) argued
that a team with an older leader is more open to leader’s
transformational behavior because the followers may be more
accepting of the leader’s special status.
On the other hand, younger leaders lack experience. Younger
leaders are therefore more dependent on outside information
with controlled approaches that rely on externally drawn
information (Forgas & Bless, 2006). Therefore, we suggest that
such leadership approach displays task-controlled leader
behavior that characterized transactional leadership behavior.
Based on the foregoing arguments and hypotheses, we propose
the following hypotheses:
H3a: An older leader shows more transformational leadership
behavior
H3b: A younger leader shows more transactional leadership
behavior
2.5 Leadership effectiveness Thus far, we have discussed leader’s age as a predictor of leader
affective state, and leader affective state and age as predictor of
leadership behavior. Now the following question arises: “Does
transformational or transactional leadership behavior make a
difference in leadership effectiveness?” Existing studies have
tried to tackle this question. Many of whom have documented a
positive link between transformational leadership style and
leader effectiveness (e.g., Judge & Piccolo, 2004). On the other
hand, we know far less about the transactional style in relation
to leader effectiveness. Transactional leadership is based on the
concepts of exchange or rewarding (e.g., contingent reward
style) and on the concept of task-monitoring. Task-monitoring
has not featured prominently in transactional leadership
literature (Wilderom & Hoogeboom, 2013). According to Bass
and Avolio (1994) management by exception active, a
transactional component, is neither effective nor ineffective.
Therefore it seems unlikely that leaders who use management
by exception active are able to influence their employees’ work
engagement and are thus less effective. Moreover, Van der
Weide and Wilderom (2004) suggest that followers dislike
negative task-directed controlling behavior. Such leader
behavior demotivates followers. This argument is also shared in
other work (e.g., Howell & Avolio, 1993; Nederveen-Pieterse,
Van Knippenberg, Schippers, & Stam, 2010). Several
leadership scholars recognize individualized consideration, one
of the four transformational dimensions, as a key factor in
influencing follower satisfaction as well as high performance
outcomes (Bass & Bass, 2008; Gardner, et al., 2005;
Schriesheim et al., 2009; Yukl, 2006). Based on the foregoing,
we expect the following hypotheses:
H4a: Transformational leadership behavior is positively
related to leadership effectiveness.
H4b: Transactional leadership behavior is negatively related
to leadership effectiveness.
3. METHODS
3.1 Design of study In this cross sectional study design different data sources are
used: (1) A reliably video-coded monitoring leaders’ and
followers’ behavior during regular staff meetings, (2) a survey
measured followers’ perception of the leader, and another
survey measured leaders’ perception of the staff meeting and of
their own leadership skills. The overall effectiveness of the
leader was rated by survey scores and video coding. The survey
measured the perception of the followers about leader
effectiveness. In addition, systematic video-coding measured
the observed leaders’ behaviors. By using variety of methods
and sources, common source bias is reduced in this study
(Podsakoff, MacKenzie, Lee & Podsakoff, 2003)
3.2 Sampling The leader sample consisted of 32 leaders employed in a large
Dutch public sector organization. Those leaders were either
from M1 level of management or M2 level of management
within this Dutch public organization. The sample comprised of
22 male (67.7%) and 9 female (29 %) leaders (one leader did
not complete the survey) and the average age was 50.68 years
old, ranging from 42 to 61 (SD=5.3). The average job tenure of
the leader sample is 9.25 years ranging from 6 months to 43
years (SD = 12.59)
In addition to the leader sample, the sample of the followers
consisted of 405 employees employed at the same large Dutch
public sector organization as the leaders. The sample was
comprised of 261 male (64.4%) and 104 female followers
(25.7%) (40 followers did not fill in this question) and the
average age was 49.25 years old, ranging from 21 to 64
(SD=9.91). The average job tenure of the followers is 24.7
years (SD=13.48), ranging from 3 days to 46 years.
The leaders and followers were asked, directly after the video
recorded staff meeting, to fill out a survey. Leaders were asked
to rate their expression during the meeting and followers were
asked to note how effective the leader was.
3.3 Measures Age Leaders’ age was asked in the survey questionnaire. The
average leaders’ age is 50.68 years old, ranging from 42 to 61
(SD=5.3)
Positive affect – negative affect. The Positive and Negative
Affect Schedule (PANAS) consists of a 10-item negative affect
scales and 10-item positive affect scales. In this study we used a
reduced number of items of the PANAS schedule, developed by
Watson, Clark and Tellegen (1988). The 4 descriptors we used
for the positive scale are: enthusiastic, interested, inspired and
proud. The Cronbach’s Alpha was 0.82.
In contrast, we used three validated descriptors for the negative
affective scale: scared, nervous, irritable. The Cronbach’s
Alpha was 0.64.
Watson, Clark and Tellegen tested the PANAS on reliability
and validity. The positive and negative affective scales are
reliable and valid and also brief and easy to administer.
The leaders’ positive and negative affective state was measured
with a question about the ambiance. The response categories
ranged from 1(never) to 7(always).
Observed leader behavior Actual leadership behavior was
systematically video-coded, using specialized Noldus software.
An average of 90 minutes of videotapes material was collected
per regular staff meeting. A behavioral transcription software
program – the Observer XT 12 – was used to analyze the
videotapes (Noldus, et al., 2000; Zimmerman et al., 2009). Two
independent trained coders systematically analyzed each
videotape in the leadership lab at the University of Twente.
During the coding activity they used a preset coding scheme
containing 15 mutually exclusive behaviors to ensure
systematic and reliable coding (Luff & Heath, 2012; Van Der
Weide, 2007).
The coding scheme includes key transactional leader behaviors,
transformational leader behaviors and negatively or
counterproductive leader behaviors. The codebook included
detailed indications for coding 15 mutually exclusive leader
behaviors. These behaviors can be grouped into 3 meta-
categories (see also Gupta, Wilderom, & Van Hillegersberg
2009): self-defending, steering and supporting. Behaviors in the
categories steering and supporting consist of transactional and
transformational behavior, which we used in the hypotheses.
The behaviors were coded on the basis of duration and
frequencies of the observed behavior. For an overview of the
behaviors that are coded, with some illustrative examples, see
Appendix.
Observed leadership behavior – transformational and
transactional leadership behavior In this study we focus on
the observed transformational leadership behavior. Therefore,
we used the observed frequency variables of ‘individual
consideration and positive attention’.
On the other hand, we also focused on the observed
transactional leadership behavior. Therefore, we used the
observed frequency variables of ‘negative feedback’ and ‘task-
monitoring’.
The Cronbach’s Alpha for the observed transformational and
transactional behavior separately was <0.70. However we used
these behavior indicators because the behaviors are observed
and are therefore a good instrument to measure observed
transformational and transactional leadership behavior.
Leader effectiveness After the recorded meeting the follower
and leader filled in a survey to evaluate the meeting and the
degree to which a leader is perceived as an effective leader. The
leader effectiveness is measured with the 4 overall-effectiveness
items from the Multi Leadership Questionnaire. These items
consist of questions such as: ‘My leader is leading our team
effective’, ‘My leader is effective in meeting my job-related
needs’, ‘My leader is effective in meeting organizational
requirements’ and ‘My leader is effective in representing my
team at a higher hierarchy’. The response categories ranged
from 1 (strongly disagree) to 7 (strongly agree). The followers
have filled in the score sheet independent of each other, so they
could not influence each other in giving scores. Follower rating
effectiveness scores were calculated by averaging the scores
given for each leader, which ranged from 1 to 7. The overall
Cronbach’s Alpha was 0.88.
3.4 Video Observation Method The videos were precisely coded and analyzed through the
behavioral software program “The Observer XT”. This program
is developed for the analysis, management and presentation of
observational data (Noldus et al., 2000).
Before actively participating in the coding process, each coder
received extensive training in using “The Observer XT”
software and learned in considerable detail how to work with
the coding scheme (Van der Weide, 2007). This training tends
to increase the accuracy and punctual coding of the different
behaviors (Psathas, 1961). In order to avoid subjectivity bias,
the two independent coders discussed their results after
minutely coding. They do this by using the so-called confusion
error matrix and inter-rater reliability outputs, generated by
“The Observer XT”. When significant differences existed
between the results of the coders, the video fragment was
retrieved and viewed again. The inter-rater reliability stands for
the percentage of agreement of a specific code within a
restricted time range of two seconds. The obtained average
inter-rater reliability percentage was 95%.
Prior to each meeting, the video cameras were stationed on
three fixed positions around the meeting room. According to
Erickson’s (1992) and Mead’s (1995), the presence of the video
cameras is forgotten short after the start of the meeting. Also
Kent and Foster (1997) argued that videotaping results
indifferences in leader and followers behavior. They behave
naturally. In addition, an observer, who took place in the field,
causes more obtrusive and abnormal behavior of leaders and
followers. Therefore, observer bias is avoided through the use
of video cameras instead of outsiders sitting in the same room
who observe the meeting and take notes. Also video recording
results in meetings that take place without any interference.
3.5 Behavioral coding scheme In order to capture specific leadership behavior during daily
work practices, a behavior coding scheme was developed
(Gupta et al., 2009; Nijhuis, Hulsman, Wilderom, & Van den
Berg 2009; Van der Weide, 2007). In the appendix, a table is
added that contains different behaviors, which are coded in this
study. Each behavior in the table contains illustrative examples
to understand the different behaviors in more detail. Bales
(1950) and Borgatta (1964) have developed a solid base for this
video behavior coding scheme. In their exploratory study they
observed interactions between leaders and their followers in
small group settings. Bales (1950) and Borgatta (1964) made a
distinction between neutral task-oriented behavior, positive-
social emotional behavior and remaining socio-emotional
behavior. Bales’ (1950) and Borgatta’s (1964) work led to a set
of mutually exclusive behaviors and provided a practical
scheme for coding of a range of leader’s actual behavior (Yukl,
2012). In addition, Feyerherm (1994) also measured leader
behavior. He has used an experimental approach and extended
the work of Bales and Borgatta with several task- and social-
oriented observable behaviors. The three frameworks (Bales,
1950; Borgatta, 1964; Feyerherm, 1994) have two
commonalities. First, all of the three schemes assessed directly
observable behavior. Second, all of the three studies used
behavioral schemes to code leader behavior in a group context
(e.g., Avolio et al., 1999; Bass & Avolio, 1995; Pearce et al.,
2003; Yukl et al., 2002). Yukl et al. (2002) has also developed a
behavior scheme. In this study, we also used Yukl’s et al.
(2002) taxonomy. Since leaders’ behavior can have several
objectives, it may be more accurately described in terms of fine-
grained, observable parts than in just one or two meta-
constructs (such as transformational/transactional leadership).
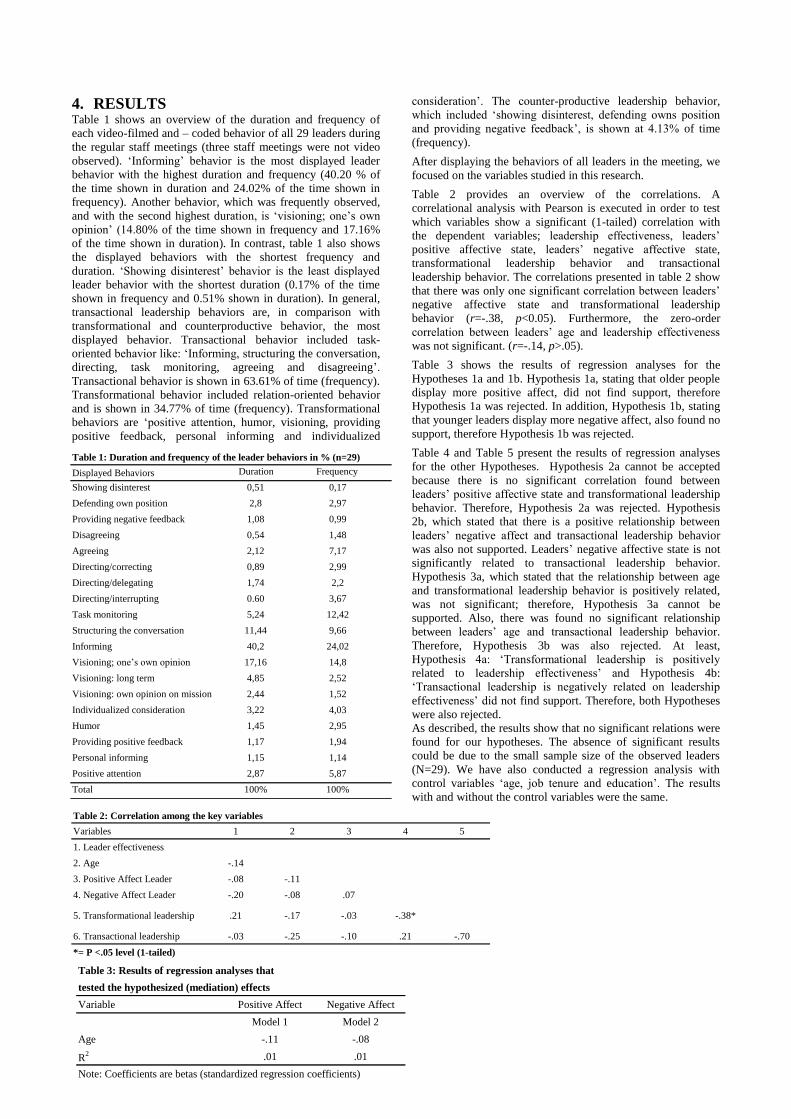
Table 1: Duration and frequency of the leader behaviors in % (n=29)
Displayed Behaviors Duration Frequency
Showing disinterest 0,51 0,17
Defending own position 2,8 2,97
Providing negative feedback 1,08 0,99
Disagreeing 0,54 1,48
Agreeing 2,12 7,17
Directing/correcting 0,89 2,99
Directing/delegating 1,74 2,2
Directing/interrupting 0.60 3,67
Task monitoring 5,24 12,42
Structuring the conversation 11,44 9,66
Informing 40,2 24,02
Visioning; one’s own opinion 17,16 14,8
Visioning: long term 4,85 2,52
Visioning: own opinion on mission 2,44 1,52
Individualized consideration 3,22 4,03
Humor 1,45 2,95
Providing positive feedback 1,17 1,94
Personal informing 1,15 1,14
Positive attention 2,87 5,87
Total 100% 100%
Table 2: Correlation among the key variables
Variables 1 2 3 4 5
1. Leader effectiveness
2. Age -.14
3. Positive Affect Leader -.08 -.11
4. Negative Affect Leader -.20 -.08 .07
5. Transformational leadership .21 -.17 -.03 -.38*
6. Transactional leadership -.03 -.25 -.10 .21 -.70
*= P <.05 level (1-tailed)
Table 3: Results of regression analyses that
tested the hypothesized (mediation) effects
Variable Positive Affect Negative Affect
Model 1 Model 2
Age -.11 -.08
R2 .01 .01
Note: Coefficients are betas (standardized regression coefficients)
4. RESULTS Table 1 shows an overview of the duration and frequency of
each video-filmed and – coded behavior of all 29 leaders during
the regular staff meetings (three staff meetings were not video
observed). ‘Informing’ behavior is the most displayed leader
behavior with the highest duration and frequency (40.20 % of
the time shown in duration and 24.02% of the time shown in
frequency). Another behavior, which was frequently observed,
and with the second highest duration, is ‘visioning; one’s own
opinion’ (14.80% of the time shown in frequency and 17.16%
of the time shown in duration). In contrast, table 1 also shows
the displayed behaviors with the shortest frequency and
duration. ‘Showing disinterest’ behavior is the least displayed
leader behavior with the shortest duration (0.17% of the time
shown in frequency and 0.51% shown in duration). In general,
transactional leadership behaviors are, in comparison with
transformational and counterproductive behavior, the most
displayed behavior. Transactional behavior included task-
oriented behavior like: ‘Informing, structuring the conversation,
directing, task monitoring, agreeing and disagreeing’.
Transactional behavior is shown in 63.61% of time (frequency).
Transformational behavior included relation-oriented behavior
and is shown in 34.77% of time (frequency). Transformational
behaviors are ‘positive attention, humor, visioning, providing
positive feedback, personal informing and individualized
consideration’. The counter-productive leadership behavior,
which included ‘showing disinterest, defending owns position
and providing negative feedback’, is shown at 4.13% of time
(frequency).
After displaying the behaviors of all leaders in the meeting, we
focused on the variables studied in this research.
Table 2 provides an overview of the correlations. A
correlational analysis with Pearson is executed in order to test
which variables show a significant (1-tailed) correlation with
the dependent variables; leadership effectiveness, leaders’
positive affective state, leaders’ negative affective state,
transformational leadership behavior and transactional
leadership behavior. The correlations presented in table 2 show
that there was only one significant correlation between leaders’
negative affective state and transformational leadership
behavior (r=-.38, p<0.05). Furthermore, the zero-order
correlation between leaders’ age and leadership effectiveness
was not significant. (r=-.14, p>.05).
Table 3 shows the results of regression analyses for the
Hypotheses 1a and 1b. Hypothesis 1a, stating that older people
display more positive affect, did not find support, therefore
Hypothesis 1a was rejected. In addition, Hypothesis 1b, stating
that younger leaders display more negative affect, also found no
support, therefore Hypothesis 1b was rejected.
Table 4 and Table 5 present the results of regression analyses
for the other Hypotheses. Hypothesis 2a cannot be accepted
because there is no significant correlation found between
leaders’ positive affective state and transformational leadership
behavior. Therefore, Hypothesis 2a was rejected. Hypothesis
2b, which stated that there is a positive relationship between
leaders’ negative affect and transactional leadership behavior
was also not supported. Leaders’ negative affective state is not
significantly related to transactional leadership behavior.
Hypothesis 3a, which stated that the relationship between age
and transformational leadership behavior is positively related,
was not significant; therefore, Hypothesis 3a cannot be
supported. Also, there was found no significant relationship
between leaders’ age and transactional leadership behavior.
Therefore, Hypothesis 3b was also rejected. At least,
Hypothesis 4a: ‘Transformational leadership is positively
related to leadership effectiveness’ and Hypothesis 4b:
‘Transactional leadership is negatively related on leadership
effectiveness’ did not find support. Therefore, both Hypotheses
were also rejected.
As described, the results show that no significant relations were
found for our hypotheses. The absence of significant results
could be due to the small sample size of the observed leaders
(N=29). We have also conducted a regression analysis with
control variables ‘age, job tenure and education’. The results
with and without the control variables were the same.
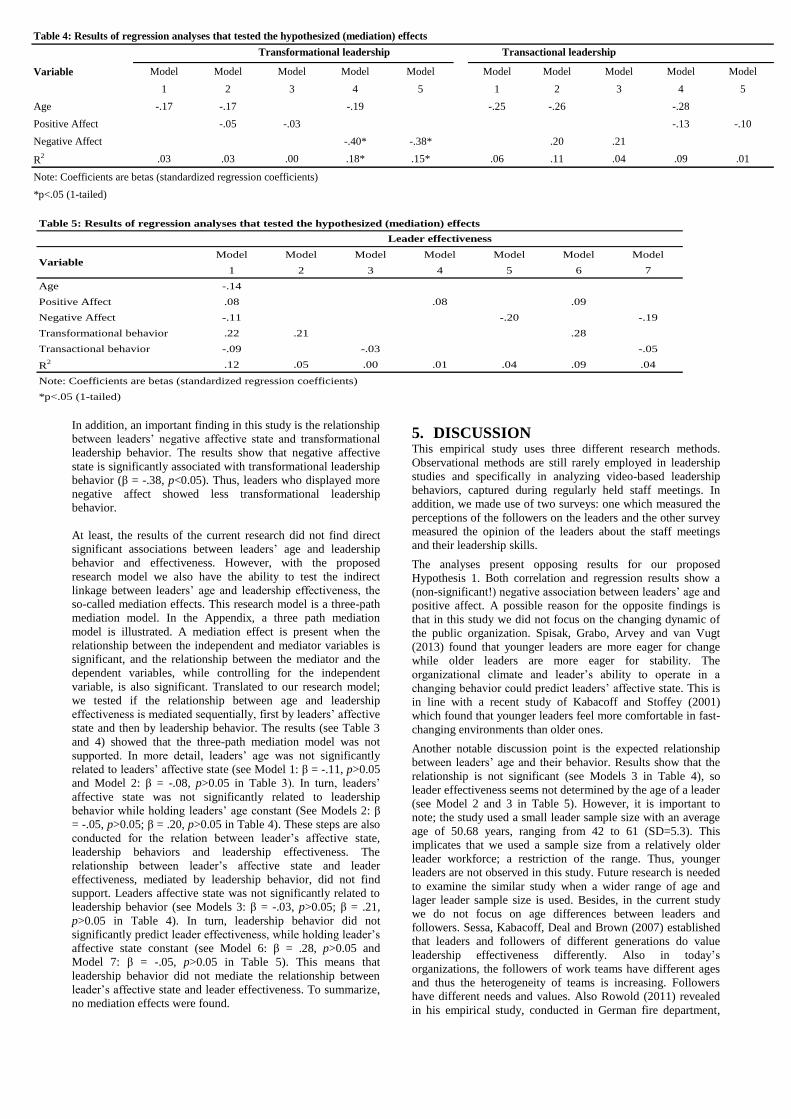
In addition, an important finding in this study is the relationship
between leaders’ negative affective state and transformational
leadership behavior. The results show that negative affective
state is significantly associated with transformational leadership
behavior (β = -.38, p<0.05). Thus, leaders who displayed more
negative affect showed less transformational leadership
behavior.
At least, the results of the current research did not find direct
significant associations between leaders’ age and leadership
behavior and effectiveness. However, with the proposed
research model we also have the ability to test the indirect
linkage between leaders’ age and leadership effectiveness, the
so-called mediation effects. This research model is a three-path
mediation model. In the Appendix, a three path mediation
model is illustrated. A mediation effect is present when the
relationship between the independent and mediator variables is
significant, and the relationship between the mediator and the
dependent variables, while controlling for the independent
variable, is also significant. Translated to our research model;
we tested if the relationship between age and leadership
effectiveness is mediated sequentially, first by leaders’ affective
state and then by leadership behavior. The results (see Table 3
and 4) showed that the three-path mediation model was not
supported. In more detail, leaders’ age was not significantly
related to leaders’ affective state (see Model 1: β = -.11, p>0.05
and Model 2: β = -.08, p>0.05 in Table 3). In turn, leaders’
affective state was not significantly related to leadership
behavior while holding leaders’ age constant (See Models 2: β
= -.05, p>0.05; β = .20, p>0.05 in Table 4). These steps are also
conducted for the relation between leader’s affective state,
leadership behaviors and leadership effectiveness. The
relationship between leader’s affective state and leader
effectiveness, mediated by leadership behavior, did not find
support. Leaders affective state was not significantly related to
leadership behavior (see Models 3: β = -.03, p>0.05; β = .21,
p>0.05 in Table 4). In turn, leadership behavior did not
significantly predict leader effectiveness, while holding leader’s
affective state constant (see Model 6: β = .28, p>0.05 and
Model 7: β = -.05, p>0.05 in Table 5). This means that
leadership behavior did not mediate the relationship between
leader’s affective state and leader effectiveness. To summarize,
no mediation effects were found.
5. DISCUSSION This empirical study uses three different research methods.
Observational methods are still rarely employed in leadership
studies and specifically in analyzing video-based leadership
behaviors, captured during regularly held staff meetings. In
addition, we made use of two surveys: one which measured the
perceptions of the followers on the leaders and the other survey
measured the opinion of the leaders about the staff meetings
and their leadership skills.
The analyses present opposing results for our proposed
Hypothesis 1. Both correlation and regression results show a
(non-significant!) negative association between leaders’ age and
positive affect. A possible reason for the opposite findings is
that in this study we did not focus on the changing dynamic of
the public organization. Spisak, Grabo, Arvey and van Vugt
(2013) found that younger leaders are more eager for change
while older leaders are more eager for stability. The
organizational climate and leader’s ability to operate in a
changing behavior could predict leaders’ affective state. This is
in line with a recent study of Kabacoff and Stoffey (2001)
which found that younger leaders feel more comfortable in fast-
changing environments than older ones.
Another notable discussion point is the expected relationship
between leaders’ age and their behavior. Results show that the
relationship is not significant (see Models 3 in Table 4), so
leader effectiveness seems not determined by the age of a leader
(see Model 2 and 3 in Table 5). However, it is important to
note; the study used a small leader sample size with an average
age of 50.68 years, ranging from 42 to 61 (SD=5.3). This
implicates that we used a sample size from a relatively older
leader workforce; a restriction of the range. Thus, younger
leaders are not observed in this study. Future research is needed
to examine the similar study when a wider range of age and
lager leader sample size is used. Besides, in the current study
we do not focus on age differences between leaders and
followers. Sessa, Kabacoff, Deal and Brown (2007) established
that leaders and followers of different generations do value
leadership effectiveness differently. Also in today’s
organizations, the followers of work teams have different ages
and thus the heterogeneity of teams is increasing. Followers
have different needs and values. Also Rowold (2011) revealed
in his empirical study, conducted in German fire department,
Table 5: Results of regression analyses that tested the hypothesized (mediation) effects
Model Model Model Model Model Model Model
1 2 3 4 5 6 7
Age -.14
Positive Affect .08 .08 .09
Negative Affect -.11 -.20 -.19
Transformational behavior .22 .21 .28
Transactional behavior -.09 -.03 -.05
R2 .12 .05 .00 .01 .04 .09 .04
Note: Coefficients are betas (standardized regression coefficients)
*p<.05 (1-tailed)
Leader effectiveness
Variable
Table 4: Results of regression analyses that tested the hypothesized (mediation) effects
Variable Model Model Model Model Model Model Model Model Model Model
1 2 3 4 5 1 2 3 4 5
Age -.17 -.17 -.19 -.25 -.26 -.28
Positive Affect -.05 -.03 -.13 -.10
Negative Affect -.40* -.38* .20 .21
R2 .03 .03 .00 .18* .15* .06 .11 .04 .09 .01
Note: Coefficients are betas (standardized regression coefficients)
*p<.05 (1-tailed)
Transformational leadership Transactional leadership

that the relationship between leadership behaviors and
performance was moderated by facets of followers’ age
heterogeneity. Therefore, future research is needed to pay
attention to the differences in leaders’ age and their followers as
well.
Moreover, from the research model of this study, in our
Hypothesis 4a, we assumed that leaders who provide more
individualized consideration and positive attention (behaviors
of a transformational style) are more often perceived as
effective by their followers. We show that behaviors like
individualized consideration and positive attention play a role in
determining leader effectiveness but do not appear to play a
significant supporting role in influencing leader effectiveness.
Nevertheless, existing studies offer results that support the
positive relationship between transformational leadership
behavior and leader effectiveness (e.g., Wilderom &
Hoogeboom, 2013). Wilderom and Hoogeboom showed that
transformational leadership style is positively related to leader
effectiveness. On the other hand, we predict in our Hypothesis
4b that leaders who frequently engage in task monitoring and
providing negative feedback, behaviors of transactional style,
(during staff meetings) are being rated lower on leader
effectiveness by their followers. This assumption is not
supported. Nevertheless, evidence for the negative relationship
between task-oriented style and leader effectiveness is
supported by Wilderom and Hoogeboom (2013). They find a
significant relationship between task monitoring and effective
leadership. In the context of a staff meeting, followers dislike
being task monitored by their leader. One reason the latter of
the two assumptions about leadership behavior and leader
effectiveness were not supported is the classical augmentation
effect. This is in line with recent literature. Hater and Bass
(1988) show that transactional leadership behavior (including
both task-directing and reward-directing behavior) adds to the
effectiveness of a leader with a transformational leadership
behavior. Especially in the context of staff meetings, more
research is needed to examine the effect of behaviors like task
monitoring, individualized consideration and positive attention
on leader effectiveness.
Beside our proposed hypotheses, we found a significant relation
between leaders’ negative affective state and transformational
leadership behavior (β = -.38, p<0.05). This means that leaders
who display more negative emotions show less positive
attention and score lower on individualized consideration. This
finding is also supported by Joseph et al. (2015) who conducted
meta-analyses that revealed a negative relationship between
negative affect and transformational leadership. Followers
perceived their leaders who express negative emotions as less
adopting a transformational leadership style. Therefore, leader’s
affective state seem to has an influence on the leader’s actual
leadership behavior repertoire
5.1 Practical implications This study is advisable for future management training
programs. Analyzing precisely video-coded behaviors of
leaders in regular staff meeting gives insights into which
leadership behaviors are more effective during staff meetings
and which are less effective. Leaders are likely to develop
themselves when they become more aware of the kind of
behaviors they display in different work settings. Therefore,
leader development programs could be enriched by such video-
based research results.
The results of this study suggest that negative affective state can
lead to less expressions of transformational and relation
oriented leadership behavior, which in turn (based on existing
research) (Bass, 1990; Bass & Bass, 2008), leads to less
effective leaders. Therefore, leaders training should include
greater attention on becoming aware of leader’s emotions and
affective state. Also leader trainings should take into account
the emotional needs of the leader. Transparency of leader’s
emotional needs should therefore be directed. Leaders’
experience of scariness, nervousness and irritableness should be
avoided. Moreover, as for instance Elfenbein (2007) noted,
affect in work environments is a critical component of attitudes
and behaviors in the workplace. More relevant for leadership
studies, affect in the workplace has also highlighted the
importance of emotions, mood and affect in leadership
processes (Ashkanasy & Tse, 2000). Thereby, affective state
should become an important part of coaching meetings between
leader and professionals. It is crucial to focus on the social
interactions between followers and leaders in daily life settings,
such as regular staff meetings. In Sociology, this method is
referred to as ‘ethnomethodology’. This perspective, founded
by Garfinkel, focuses on how people apply implicit rules in
social conversations (Harritage, 1984).
5.2 Strengths, limitation and future
research directions The strength of this research is that we used a mix of objective
and subjective methods and data sources (video based coding
and surveys). The use of different data sources and methods
reduced common method bias. Objective video-based coding
helps to observe leader behavior during regular staff meetings.
Besides that, subjective surveys help to understand follower
perceptions about the leader effectiveness. Despite the strengths
of this current study, there are also various limitations.
First, the survey and observational data were collected at one
point in time, thus the current study lacks insights to the
incremental developmental processes, and the cross-sectional
nature of the current study makes it difficult to discover the true
direction of causality between the variables used. Therefore,
future research may adopt a longitudinal study design, which
gets insights in the process of causality of variables used.
Second, the sample size is very small. In current study we focus
on 29 observed leaders. Only one organization is studied.
Future study may adopt more organizations, resulting in bigger
sample size of leaders and followers that strengthen the results.
Third, leaders, followers and coders in this study were all
Dutch, therefore the generalizability of this study limited to the
Netherlands. The observed behaviors showed in the videos can
be analyzed differently in other countries in the world, due to
cultural differences between countries. Therefore, it would be
interesting to examine whether our findings are replicable in
various other cultures.
Fourth, this study may suffer from social-desirability bias.
Video-recording of meetings could influence the behaviors of
the leaders and followers. We are aware of it. Therefore, we
asked, directly after the meeting, each of the followers to rate
the extent to which the leader behaved as he or she normally did
without the cameras. The response categories ranged from 1
(not representative) to 7 (highly representative). The results
show that the amount of leader reactivity during the video
observation was limited.
Further research should focus on larger leader and follower
samples. The video coding-observation method has the
potential of being applied in a wider context, not only during
regular staff meetings. Thus, video-based field studies can
contribute to existing leadership literature and gives a clear
view of effective leadership behavior. As previously mentioned,
future research should concentrate not only on the age of
leaders but also on followers’ age. Groups with age

heterogeneity (inclusive leader’s age) mediate between the
relationship of leader behavior and leader or group performance
(Rowold, 2011)
6. CONCLUSION Present work highlights the role of leaders’ age in leadership
processes such as leaders’ affective state, leadership behavior
and leader effectiveness. Although our work does not establish
a significant link between leaders’ age and leadership outcomes,
we can still conclude that older leaders are not better or worse
than younger leaders in achieving effective leadership.
Furthermore, the significant negative relationship in the current
study between leaders’ negative affect and transformational
leadership behavior contributes to the existing leadership
literature, because this leadership literature tend to focus more
on the relationship between positive affect and transformational
leadership behavior while ignoring the relationship between
negative affect and leadership and followers behavior (Gooty,
Connelly, Griffith & Gupta 2010). All in all, the recent study
presents a fundamental basis for further research on how, why
and when leaders’ (and followers!) age has consequences for
their emotions, behaviors and effectiveness in various
organizational situations.
7. ACKNOWLEDGMENT I am very grateful to my supervisor Drs. A.M.G.M.
Hoogeboom for all the necessary, helpful and clear feedback
she gave to me. Her guidance helped me to accomplish my
thesis. I am also grateful to my 2nd supervisor Prof. Dr. C.P.M.
Wilderom for her assistance in the writing of this paper.
8. REFERENCES 1. Ahiazu, A. I. (1989). The "Theory A" system of work
organization for the modern African workplace.
International Studies of Management and Organization, 19(1): 6-27.
2. Ashkanasy, N. M., & Tse, B. (2000). Transformational
leadership as management of emotion: A conceptual
review. In N. M. Ashkanasy, C. E. J. Härtel, & W. J. Zerbe
(Eds.), Emotions in the workplace (pp. 221–235).
3. Avolio, B. J., Bass, B. M., & Jung, D. I. (1999). Re‐examining the components of transformational and
transactional leadership using the Multifactor Leadership
Questionnaire. Journal of Occupational and
Organizational Psychology, 72: 441–462.
4. Avolio, B. J., & Bass, B.M. (2002) Manual for the
multifactor leadership questionnaire (From 5X) Redwood
City, CA: MindGarden, Inc
5. Avolio, B. J., & Bass, B. M. (2004). Multifactor leadership
questionnaire: Third edition manual and sampler set.
Redwood City, CA: Mind Garden.
6. Avolio, B. J., Howell, J. M., & Sosik, J. J. (1999). A funny
thing happened on the way to the bottom line: Humor as
moderator of leadership style effects. Academy of
Management Journal, 42(2): 219-227.
7. Bales, R. F. (1950). A set of categories for the analysis of
small group interaction. American Sociological Review,
15(2): 257-263.
8. Barbuto, J. E. J., Fritz, S. M., Matkin, G. S., & Marx, D. B.
(2007). Effects of gender, education, and age upon leaders'
use of influence tactics and full range leadership behaviors.
Sex Roles, 56(1–2): 71–83.
9. Bass, B. M. (1985). Leadership and performance beyond
expectations. New York; The Free Press.
10. Bass, B. M. (1990). From transactional to transformational
leadership: Learning to Share the Vision: Organizational
dynamics, 19-31.
11. Bass, B. M. (1990). Bass & Stogdill's handbook of
leadership: Theory, research, and managerial applications
(3rd ed.). New York: Free Press.
12. Bass, B. M. (1998). Transformational leadership: Industry,
military, and educational impact. Mahwah, NJ: Erlbaum
13. Bass, B.M., Avolio, B.J., & Goodheim, L. (1987).
Quantitative description of world-class industrial, political,
and military leaders. Journal of Management, 13: 7-19
14. Bass, B.M., & Avolio, B.J. (1994). Improving
organizational effectiveness through transformational
leadership. Thousand Oaks, CA: Sage
15. Bass, B. M., & Avolio, B. J. (1995). Full range leadership
development: Manual for the Multifactor Leadership
Questionnaire. Palo Alto, CA: Mind Garden.
16. Bass, B. M., Avolio, B. J., Jung, D. I., & Berson, Y.
(2003). Predicting unit performance by assessing
transformational and transactional leadership. Journal of
Applied Psychology, 88: 207–218.
17. Bass, B. M., & Riggio, R. E. (2006). Transformational
leadership (2nd ed.). Lawrence Erlbaum Associates,
Mahwah, NJ.
18. Bass, B., & Bass, R. (2008). The Bass handbook of
leadership: Theory, research, and managerial applications
(4th ed.). New York, NY: Free Press.
19. Blanchard-Fields, F. (2007). Everyday problem solving
and emotion — An adult developmental perspective.
Current Directions in Psychological Science, 16: 26–31.
20. Blondel, J. (1980). World leaders: Heads of government in
the postwar period. Beverly Hills: Sage.
21. Bono, J. E., & Ilies, R. (2006). Charisma, positive
emotions and mood contagion. The leadership Quarterly,
17: 317-334
22. Borgatta, E. F. (1964). A note on the consistency of
subject behavior in interaction process analysis.
Sociometry, 27(2): 222-229.
23. Bradburnn, M. (1969) The Structure of Psychological
We/l-being. Aldine, Chicago
24. Burns, J.M. (1978). Leadership. New York: Harper and
Row.
25. Cagle,S.G. (1988). Fiedler's Contingency Theory of
Leadership Effectiveness and Appointment of a
Committee Chairperson. Dissertation Abstracts
International, 50-07 (B): 2842
26. Damen, F., Van Knipenberg, D., & Van Knippenberg, B.
(2008). Leader affective displays and attributions of
charisma: The role of arousal. Journal of Applied Scoial
Psychology, 38: 2594-2614
27. DeRue, D. S., Nahrgang, J. D., Wellman, N., &
Humphrey, S. E. (2011). Trait and behavioral theories of
leadership: An integration and meta-analytic test of their
relative validity. Personnel Psychology, 64: 7–52.
28. Doherty, A. J. (1997). The effect of leader characteristics
on the perceived transformational/transactional leadership
and impact of interuniversity athletic administrators.
Journal of Sport Management, 11 (3): 275 - 286
29. Eberly, M.B. & Fong, C.T. (2013) Leading via the heart
and mind; The roles of leader and followers emotions,
attributions and interdependence. The Leadership
Quarterly. 24: 696-711
30. Elfenbein, H.A. (2007). Emotion in organizations: A
review and theoretical integration. The academy of
Management Annals. 1: 315-386
31. Erickson, F. 1992. The interface between ethnography and
microanalysis. In M. D. LeCompte, W. L. Millroy, & J.
Preissle (Eds.), The handbook of qualitative research in
education: 201-255. San Diego: Academic Press.
32. Farr, J. L., & Ringseis, E. L. (2002). The older worker in
organizational context: Beyond the individual. In C. L.
Cooper & I. T. Robertson (Eds.). International review of
industrial and organizational psychology, 17: 31–75.
New York: Wiley.
33. Feyerherm, A. E. (1994). Leadership in collaboration: A
longitudinal study of two inter-organizational rule-making
groups. The Leadership Quarterly, 5(3): 253-270.
34. Forgas, J. Bless, H. (2006). Klaus Fiedler; Joseph Forgas,
eds. Affect in social thinking and behavior (12 ed.). New
York, NY, US: Psychology Press, 65–84.
35. Gaddis, B., Connelly, S., & Mumford, M. D. (2004).
Failure feedback as an affective events: Influences of
leader affect on subordinate attitudes and performance.
Leadership Quarterly, 15: 663–686.
36. Gardner, W. L., Avolio, B. J., Luthans, F., May, D. R., &
Walumbwa, F. (2005). Can you see the real me? A self-
based model of authentic leader and follower development.
The Leadership Quarterly, 16(3): 343-372.
37. George, J.M. (2000). Emotions and leadership: The role of
emotional intelligence. Human Relations, 53: 1027-1055
38. George, J.M. & Brief, A. (1992). Feeling good-doing
good: A conceptual analysis of the mood at work-
organizational spontaneity relationship. Psychological
Bulletin, 112: 310-329
39. Gooty, J., Connelly, S., Griffith, J., & Gupta, A. (2010).
Leadership affect and emotions: A state of the science
review. The leadership Quarterly, 21: 979 – 1004
40. Gupta, K., Wilderom, C., & Van Hillegersberg, J.(2009).
Exploring the behavior of highly effective CIOs using
video analysis. AMCIS 2009 Proceedings. Paper 463.
Retrieved from http://aisel.aisnet.org/amcis2009/463.
41. Hater, J.J. & Bass, B.M. (1988). Supervisors’ evaluations
and subordinates’ perceptions of transformational and
transactional leadership. Journal of Applied Psychology,
73: 695-702
42. Hedge, J. W., & Borman, W. C. (Eds.). (2012). The
Oxford handbook of work and aging. New York: Oxford
43. Hedge, J. W., Borman, W. C., & Lammlein, S. E. (2006).
The aging workforce: Realities, myths, and implications
for organizations. Washington, DC: American
Psychological Association.
44. Heritage, John (1984). Garfinkel and Ethnomethodology.
Cambridge: Polity Press.
45. Hitt, M.A., & Tyler, B.B. (1991). Strategic decision
models: Integrating different perspectives. Strategic
Management Journal, 12: 327-351
46. Hogdgson, D.E., (2004). Project work: the legacy of
bureaucratic control in the post-bureaucratic organization.
Organization 11: 81-100

47. House, R.J. (1977). A 1976 theory of charismatic
leadership. In J.G. Hunt & L.L. Larson (Eds.). Leadership:
The cutting edge (pp. 189-207). Carbondale, IL: Southern
Illinois University Press.
48. Howell, J.M., & Avolio, B.J. (1993). Transformational
leadership, transactional leadership, locus of control, and
support for innovation. Journal of Applied Psychology,
78: 891-902
49. Johnson, S.K. (2008) I second that emotion: Effects of
emotional contagion and affect at work on leader and
follower outcomes. The leadership Quarterly, 19: 1-19
50. Johnson, S.K. (2009). Do you feel what I feel? Mood
contagion and leadership outcomes. The leadership
Quarterly, 20 : 814-827
51. Joseph, D.L., Dhanani, L.Y., Shen, W., McHugh, B.C.,
McCord, M.A. (2015). Is a happy leader a good leader? A
meta-analytic investigation of leader trait affect and
leadership. The leadership Quarterly
52. Judge, T.A., & Piccolo, R.F. (2004). Transformational and
Transactional leadership: A Meta-Analytic Test of their
relative validity. Journal of Applied Psychology, 89(5):
755-768
53. Kabacoff, R.I., & Stoffey, R.W. (2001). Age Differences
in Organisational Leadership. Paper Presented at the 16th
Annual Conference Of The Society For Industrial And
Organisational Psychology, San Diego, CA.
54. Kanfer, R & Ackerman, P. L., (2004). Aging, adult
development, and work motivation. The Academy of
Management Review, 29(3): 440-458
55. Kearney, E. (2008). Age differences between leader and
followers as a moderator of the relationship between
transformational leadership and team performance.
Journal of Occupational and Organizational Pyschology,
81 (4): 803-811
56. Kellough J. L.,, Knight B. G. (2012) Positivity effects in
older adults’ perception of facial emotion: the role of
future time perspective. The Journals of Gerontology,
Series B: Psychological Sciences and Social Sciences, 67:
150–158.
57. Kent, R. N., & Foster, S. L. (1977). Direct observational
procedures: Methodological issues in naturalistic
settings. In A. Ciminero, K. S. Calhoum & H. E. Adams
(Eds.), Handbook of behavioral assessment: 279-328.
New York: John Wiley.
58. Korunka, C., Frank, H., Lueger, M., & Mugler, J. (2003).
The entrepreneurial personality in the context of resources,
environment, and the startup process: A configurational
approach. Entrepreneurship: Theory and Practice, 28(1):
23–42
59. Lewis, K.M. (2000). When leaders display emotion: How
followers respond to negative emotional expression of
male and female leaders. Journal of Organizational
Behavior, 21: 221–234.
60. Löckenhoff, C. E., O'Donoghue, T., & Dunning, D.
(2011). Age differences in temporal discounting: The role
of dispositional affect and anticipated emotions.
Psychology and Aging, 26: 274–284
61. Lowe, K. B., Kroeck, K. G., & Sivasubramaniam, N.
(1996). ffectiveness correlates of transformational and
transactional leadership: A meta-analytic review of the
MLQ literature. Leadership Quarterly, 7: 385–425.
62. Luff, P., & Heath, C. (2012). Some “technical challenges”
of video analysis: Social actions, objects, material realities
and the problems of perspective. Qualitative Research, 12,
255–279.
63. Mead, M. (1995). Visual anthropology in a discipline of
words. In P. Hockings (Ed.), Principles of visual
anthropology: 3-10. New York: Mouton de Gruyter.
64. Nederveen Pieterse A., Van Knippenberg, D., Schippers,
M., & Stam, D.(2010). Transformational and transactional
leadership and innovative behavior: The moderating role
of psychological empowerment. Journal of
Organizational Behavior, 31: 609–623
65. Newcombe, M. J., & Ashkanasy, N. M. (2002). The role of
affect and affective congruence in perceptions of leaders:
An experimental study. The leadership Quarterly, 13:
601-614
66. Ng, E., & Sears, G. (2012). CEO leadership styles and the
implementation of organizational diversity practices:
Moderating effects of social values and age. Journal of
Business Ethics, 105: 41-52
67. Nijhuis, J. H. E., Hulsman, S., Wilderom, C. P. M., & Van
den Berg, P. T. 2009. Filming and surveying
transformational behavior of Dutch primary school
leaders. Paper presented to the OB division of the Annual
Academy of Management Meetings, Chicago, Illinois.
68. Noldus, L., Trienes, R., Hendriksen, A., Jansen, H., &
Jansen , R. (2000). The observer video-pro: New software
for the collection, management, and presentation of time-
structured data from videotapes and digital media files.
Behavior Research Methods, Instruments, and
Computers, 197-206.
69. Pearce, C. L., Sims, H. P. Jr, Cox, J. F., Ball, G., Schnell,
E., Smith, K. A., & Treviňo, L. 2003. Transactors,
transformers and beyond: A multi-method development of
a theoretical typology of leadership. Journal of
Management Development, 22(4): 273-307.
70. Podsakoff, P. M., MacKenzie, S. B., Lee, J. Y., &
Podsakoff, N. P. (2003). Common method biases in
behavioral research: A critical review of the literature and
recommended remedies. Journal of Applied Psychology,
88: 879–903.
71. Podsakoff, P. M., Bommer, W. H., Podsakoff, N. P., &
MacKenzie, S. B. (2006). Relationships between leader
reward and punishment behavior and subordinate attitudes,
perceptions, and behaviors: A meta-analytic review of

existing and new research. Organizational Behavior and
Human Decision Processes, 99: 113−142.
72. Putman, L.L., Sorenson, R.L. ( 1982). Equivocal messages
in organizations. Human Communication Research, 8:
114-132.
73. Psathas, G. (1961). Alternative methods for scoring
interaction process analysis. Journal of Social
Psychology, 53: 97-103.
74. Rackham, N., & Morgan, T. (1977). Behavior analysis in
training. Maidenhead, UK: McGraw-Hill.
75. Reed, A. E., & Carstensen, L. L. (2012). The theory
behind the age-related positivity effect. Frontiers in
Emotion Science, 3, 1-9
76. Rejai, M., & Phillips, K. (1979). Leaders of revolution.
Beverly Hills: Sage.
77. Riediger, M., Schmiedek, F., Wagner, G. G., &
Lindenberger, U. (2009). Seeking pleasure and seeking
pain: Differences in prohedonic and contra-hedonic
motivation from adolescence to old age. Psychological
Science, 20: 1529–1535.
78. Rowold, J., (2011). Relationship between leadership
behaviors and performance: The moderating role of a work
team's level of age, gender, and cultural heterogeneity.
Leadership & Organization Development Journal, 32(6):
628 - 647
79. Rubin, R. S., Munz, D. C., & Bommer, W. H. (2005).
Leading from within: The effects of emotion recognition
and personality on transformational leadership behavior.
Academy of Management Journal, 48(5): 845-858.
80. Schaie, K. W., & Willis, S. (2011). Handbook of the
psychology of aging (7th ed.)San Diego, CA: Elsevier.
81. Schalk, R., Van Veldhoven, M., De Lange, A. H., De
Witte, H., Kraus, K., Stamov-Roßnagel, C., et al. (2010).
Moving European research on work and ageing forward:
Overview and agenda. European Journal of Work and
Organizational Psychology: 19, 76–101.
82. Schriesheim, C. A., Castro, S. L., Zhou, X., & DeChurch,
L. A. (2006). An investigation of path-goal and
transformational leadership theory predictions at the
individual level of analysis. The Leadership Quarterly,
17: 21-38.
83. Shore, L. M., Cleveland, J. N., & Goldberg, C. B. (2003).
Work attitudes and decisions as a function of manager age
and employee age. Journal of Applied Psychology: 88,
529–537
84. Scheibe, S., & Zacher, H. (2013). A lifespan perspective
on emotion regulation, stress, and well-being in the
workplace. In P. L. Perrewé, J. Halbesleben, & C. C.
Rosen (Eds.), Research in occupational stress and well-
being,11: 167–197 Bingley, UK: Emerald.
85. Scheibe, S., English, T., Tsai, J. L., & Carstensen, L. L.
(2013). Striving to feel good: Ideal affect, actual affect,
and their correspondence across adulthood. Psychology
and Aging, 28: 160–171
86. Scheibe, S., Mata, R., & Carstensen, L. L. (2011). Age
differences in affective forecasting and experienced
emotion surrounding the 2008 US presidential election.
Cognition & Emotion, 25: 1029–1044.
87. Schriesheim, C. A., Wu, J. B., & Scandura, T. A. 2009. A
meso measure? Examination of the levels of analysis of the
Multifactor Leadership Questionnaire (MLQ). The
Leadership Quarterly, 20(4): 604-616.
88. Sessa, V.I., Kabacoff, R.I., Deal, J., Brown, H. 2007
Generational differences in leader values and leadership
behaviors. The Psychologist-Manager Journal, 10(1):
47-74.
89. Spisak, B. R., Grabo, A.E., Arvey, D.R., van Vugt, M.
(2013) The age of exploration and exploitation: Younger-
looking leaders endorsed for change and older-looking
leaders endorsed for stability. The leadership Quarterly,
25, 805-816
90. Stone, A. A., Schwartz, J. E., Broderick, J. E., & Deaton,
A. (2010). A snapshot of the age distribution of
psychological well-being in the United States. Proceedings
of the National Academy of Sciences of the United States
of America, 107(22): 9985–9990.
91. Stogdill, R. M. (1948). Personal factors associated with
leadership; a survey of the literature. Journal of
Psychology: Interdisciplinary and Applied, 25: 35–71.
92. Sy, T., Côté, S., & Saavedra, R. (2005). The contagious
leader: Impact of leader’s mood on the mood of group
members, group affective tone, and group processes.
Journal of Applied Psychology, 90: 295 – 305.
93. Tellegen, A. (1985). Structures of mood and personality
and their relevance to assessing anxiety, with an emphasis
on self-report. In A. H. Tuma & J. D. Maser (Eds.),
Anxiety and the anxiety disorders (681-706). Hillsdale, NJ:
Erlbaum.
94. Thompson, E.R. (2007). Development and validation of an
internationally reliable short-form of the positive and
negative affect schedule (PANAS). Journal of cross-
cultural psychology, 38(2): 227-242
95. Trottier, T., M. Van Wart, and X. Wang. (2008).
Examining the nature and significance of leadership in
government organizations. Public Administration Review
68: 319–33
96. Van der Weide, J. G., & Wilderom, C. P. M. (2004).
Deromancing leadership: What are the behaviors of highly
effective middle managers? International Journal of
Management Practice, 1(1): 3-20.
97. Van der Weide, J. G. (2007). An explorative video-study
of the behaviors of effective middle managers.
Unpublished doctoral dissertation, University of Tilburg,
the Netherlands.

98. Van Vugt. M (2006), “Evolutionary origins of leadership
and followership,” Personality& Social Psychology
Review, 10(4): 354–371.
99. Waldman, D. A., Bass, B. M., & Yammarino, F.J. (1990).
Adding to contingent-reward behavior: Theaugmenting
effect of charismatic leadership. Group & Organizational
Studies, 15: 381-394
100. Walter, F., & Scheibe, S. (2013). A literature review and
emotion-based model of age and leadership: New
directions for the trait approach. The leadership Quarterly,
24: 882-901
101. Watson, D., & Clark, L. A. (1984). Negative Affectivity:
The disposition to experience aversive emotional states.
Psychological Bulletin, 96: 465-490.
102. Watson, D., & Naragon, K. (2009). Positive affectivity:
The tendency to experience positive emotional states. In S.
J. Lopez (Ed.), Handbook of Positive Psychology, 2nd
Edition, 207-215.
103. Watson, D., & Naragon, K. (2012). Positive Affectivity:
The Disposition to Experience Positive Emotional States.
The Oxford Handbook of Positive Psychology, (2 Ed).
Oxford University Press
104. Watson, D. & Tellegen. A. (1985). Toward a consensual
structure of mood. Psychological Bulletin. 98: 219-235.
105. Watson, Clark & Tellegen (1988). Development and
Validation of Brief Measures of Positive and Negative
Affect: The PANAS scales. Journal of Personality and
Social Psychology, 54 (6), 1063-1070
106. Wofford, J. C., & Goodwin, V. L. (1994). A cognitive
interpretation of transactional and transformational
leadership theories. The Leadership Quarterly, 5(2): 161-
186.
107. Wilderom, C.P.M., & Hoogeboom, A.M.G.M. (2013).
Refining the augmentation thesis of transformational
leadership: a triangulated, video-based field study. In press
108. Yukl, G., Gordon, A., Taber, T. (2002). A Hierarchical
Taxonomy of leadership behavior: Integrating a half
century of behavior research. Journal of Leadership and
Organizational studies, 9(1): 15-32
109. Yukl, G. (2002). Leadership in organizations (5th ed.).
Upper Saddle River, NJ: Prentice Hall.
110. Yukl, G. (2006). Leadership in organizations (6th ed.)
Upper Saddle River, NJ: Prentice Hall.
111. Yukl, G. (2012). Effective leadership behavior: What we
know and what questions need more attention. Academy of
Management Perspectives, 26(4): 66-85.
112. Yukl, G. (2013). Leadership in organisations (8th ed.).
Boston: Pearson
113. Zacher, H., Rosing, K., & Frese, M. (2011). Age and
leadership: The moderating role of legacy beliefs. The
Leadership Quarterly, 22: 43–50
114. Zacher, H. & Frese, M. (2009). Remaining time and
opportunities at work: Relationships between age, work
characteristics, and occupational future time perspective.
Psychology and Aging, 24(2): 487-493
115. Zimmerman, P. H., Bolhuis, J. E., Willemsen, A., Meyer,
E. S., & Noldus, L. P. J. J. (2009). The Observer XT: A
tool for the integration and synchronization of multimodal
signals. Behavior Research Methods, 41, 731–735.

9. APPENDIX
Research model
Figure 1: Research model
Hypotheses model
Figure 2: Hypotheses model
Figure 3: Three-path mediation model
Leaders’ age
Leaders’ negative
affective state
Leader
effectiveness
Transformational
leadership behavior
Leaders’ positive
affective state
Transactional
leadership behavior

Behavior coding scheme
Behavior
category
Behavior Definition Example
Self-
defending
1 Showing
disinterest
Not showing any interest, not
taking problems seriously,
wanting to get rid problems and
conflicts
Not actively listening, talking to others
while somebody has the speaking term,
looking away
2 Defending
one’s own
position
Protecting the own opinion or
ideas,
Emphasizing the own importance
“We are going to do it in my way.”
Blaming other people
3 Providing
negative
feedback
Criticizing “I do not like that…”
“But we came to the agreement that…”
Steering 4 Disagreeing Contradicting ideas, opposing
team members
“That is not correct”
“I do not agree with you”
5 Agreeing Saying that someone is right,
liking an idea
“That is a good idea”
“You are right”
6 Directing Telling others what (not) to do,
dividing tasks
“I want that”
“Kees, I want you to”
Interrupting
7 Verifying Getting back to previously made
agreements/ visions/ norms
“We came to the agreement that…”
8 Structuring
the
conversation
Giving structure by telling the
agenda,
start/end time etc.
“The meeting will end at…”
“We are going to have a break now”
9 Informing Giving factual information “The final result is …”
10 Visioning Giving the own opinion
Giving long-term visions
Giving own opinion on
organization mission
“I think that…”
“Within the next years, we want to…”
“My opinion about this organization goal
is..”
Supporting 11 Intellectual
stimulation
Asking for ideas, inviting people
to think
along or come up with own ideas,
brainstorming
“What do you think is the best way
to…?”
“What is your opinion about…?”
12 Individualized
consideration
Rewarding, complimenting,
encouraging,
being friendly, showing empathy
“Good idea, thank you”
“You did a great job”
“Welcome”
“How are you?”
13 Humor Making people laugh, saying
something with
a funny meaning
Laughing, making jokes
14 Positive
feedback
Rewarding, complimenting “Well done”
15 Personally
informing
Giving non-factual, but private
information
“Last weekend, my wife…”