how internal tax and legal expertise affect corporate ... documents... · how internal tax and...
TRANSCRIPT

How internal tax and legal expertise affect corporate income taxes
Lisa De Simone Stanford Graduate School of Business
Bridget Stomberg University of Georgia [email protected]
November 2015 PRELIMINARY – PLEASE DO NOT QUOTE OR CITE WITHOUT PERMISSION
Acknowledgements: The authors appreciate helpful discussions with Peter Barnes, Charles Boes, and Lawrence De Simone; comments from Carlos Jimenez Angueira (discussant), workshop participants at the University of Santa Clara, and AAA reviewers; and invaluable programming advice and assistance from Jordan Nickerson. The authors also gratefully acknowledge funding from the Stanford Graduate School of Business (De Simone) and the University of Georgia (Stomberg).

How internal tax and legal expertise affect corporate income taxes
ABSTRACT:
Because corporate income taxes are governed by codified law with inherent uncertainty, we expect taxes to be an area where individuals with prior tax or legal experience influence corporate policy. We therefore examine the effect of executives with tax backgrounds, and independent directors with tax or legal backgrounds, on corporate income tax avoidance and financial reporting quality. Focusing on several measures of tax avoidance and financial reporting quality, we find that although firms with tax executives engage in higher levels of tax avoidance as measured using long-run GAAP effective tax rates (ETR), we find no difference in cash ETRs. Additionally, these firms exhibit smaller reserves for tax uncertainty that map more closely into future settlements with tax authorities. These results suggest that firms with tax executives engage in the same level of tax avoidance as other firms but exhibit different financial reporting choices. In contrast, we find limited evidence that independent directors with tax or legal backgrounds influence corporate tax avoidance or financial reporting for taxes. Our study extends our understanding of the effect of the characteristics and qualifications of internal governance on firm behavior and financial reporting quality.
Keywords: Corporate governance, tax background, legal background, financial reporting quality, uncertain tax positions, tax avoidance JEL Classifications: H25, M41, M48

1
1. Introduction
We examine how prior tax experience at the CEO or CFO level, and prior legal or
tax experience at the director level, affects corporate tax avoidance and financial
reporting for income taxes. We consider income tax avoidance to be any action a
company takes to minimize its explicit tax burden. Although an extensive literature
explores how firm-level characteristics such as size (Armstrong, Blouin, and Larcker
2012, Gupta and Newberry 1997, Manzon and Plesko 2002, Rego 2003, Zimmerman
1983) or multinationality (Collins, Kemsley, and Lang 1998, De Simone, Mills and
Stomberg 2015, Klassen, Lang, and Wolfson 1993, Mills and Newberry 2004, Rego
2003) influence the level of corporate income tax avoidance, few studies examine how
individuals inside the firm shape tax policy. Indeed, Huang and Kisgen (2013) note that
much prior finance literature “ignores the influence a specific manager has on decision
making” (p. 822). We contribute to a growing stream of research that examines how
manager-specific attributes affect corporate tax policy by investigating whether
corporations with CEOs, CFOs or independent directors who have prior professional
experience in a tax or legal role engage in different levels of tax avoidance and exhibit
different levels of quality in accounting for income taxes.
Understanding the role that individuals inside the firm play in shaping their
corporations’ tax policy is important for at least two reasons. First, prior literature
documents an apparent under-sheltering puzzle whereby not all firms appear to optimize
their level of tax avoidance given firm-level characteristics (Desai and Dharmapala 2006,
Hanlon and Heitzman 2010, Weisbach 2002). For example, anecdotal evidence suggests
many businesses, especially small and medium-sized firms, often leave tax benefits on

2
the table because they do not think they qualify for various incentives (Zerbe 2014).
Having individuals inside the firms with an awareness of tax incentives and the
knowledge to implement tax avoidance strategies can bring firms closer to an expected
level of tax avoidance based on existing (and often hard-to-change) firm-level
characteristics.
Second, individuals inside the firm with prior tax and legal experience might also
be effective in financial reporting for income taxes. Accounting for income taxes is a
particularly complex area of financial accounting and a significant component of overall
financial reporting quality. Income taxes continue to be a significant cause of
restatements and the incidence of tax-related comment letters continues to rise (PwC
2014). Financial restatements and responding to SEC comment letters are costly for
firms. Regulators, boards of directors and shareholders should therefore be interested in
identifying managerial characteristics associated with more transparent and/or accurate
income tax amounts and disclosures.
We expect firms with CEOs or CFOs who have prior tax experience to engage in
greater levels of tax avoidance, all else equal. Tax avoidance requires timely knowledge
of tax planning opportunities compatible with business operations. We propose that
CEOs and CFOs with tax backgrounds are more familiar with a broad range of tax
avoidance strategies and can work with internal or external tax service providers to
implement strategies appropriate given the nature of the firms’ structure and activities.
Although external tax consultants have an extensive knowledge of tax planning
strategies, these individuals are not as well positioned to identify matches between
strategies and firm operations. Firms relying solely on outside advice may therefore miss

3
tax avoidance opportunities because they do not become aware of important transactions
inside the firm in a timely manner. Additionally, even if a firm engages an external
consultant to implement a strategy, it is the firm’s legal obligation to the tax authority and
the firm’s name in the press associated with suspected wrongdoing. Thus, without
someone inside the firm willing to take on the risk of reputational, tax authority audit or
legal costs, strategies proposed by outside consultants may not be implemented.
Tax executives could also positively influence tax financial reporting quality by
providing more accurate assessments of tax uncertainty and thereby increasing the
correlation between tax expense and future cash flows. These individuals could have a
better understanding of the rules governing income tax accounting broadly and a greater
awareness of hot-button issues driving tax restatements or comment letters. CEOs and
CFOs with tax backgrounds could therefore potentially avoid these negative financial
reporting outcomes. However, a CEO or CFO with tax knowledge could use that
knowledge to obscure tax avoidance or use tax accounts to manage earnings. It is
therefore unclear ex ante what effect executives with prior tax experience have on
financial reporting for income taxes.
We also examine the monitoring role that independent directors with tax or legal
backgrounds play in determining the level of corporate tax avoidance. Given the
materiality of income taxes and heightened awareness of tax uncertainty following a 2006
change in financial statement disclosure regulations, we expect the board of directors to
be involved in reviewing a firm’s tax avoidance activities. These individuals could
influence the level of tax avoidance inside the firm by (a) identifying knowledge gaps
within the tax function that could lead to inappropriate levels of investment in tax

4
planning, (b) being committed to allocating a greater level of resources to the tax function
to facilitate proper support and documentation of positions undertaken, and/or (c) being a
source of additional information about tax planning opportunities through their
networking connections with other board members (Brown 2011). We also acknowledge
the possibility, however, that directors on average do not influence the level of tax
avoidance because they are not actively involved in the development or identification of
tax avoidance strategies.
Finally, we explore the effect independent directors could have on accounting for
income taxes. Directors with legal backgrounds have been shown to improve accrual
quality, likely due to their heightened awareness of litigation risks and costs that can stem
from poor financial reporting quality (Krishnan, Wen, and Zhao 2011). In a tax context,
these results suggest that firms with tax and legal directors may report more
conservatively for uncertainty in the tax accounts to adequately alert shareholders to the
magnitude of tax benefits potentially subject to repayment. Alternatively, directors with
tax and legal backgrounds may be better prepared to substantiate and more willing to
litigate their uncertain tax positions because of their greater understanding of their
fiduciary duties of due care. This latter notion suggests that these firms may report less
tax uncertainty to shareholders.1 Similarly, directors with a tax background may have a
better understanding of the audit process and be better able to estimate outcomes in tax
accruals.
We use Boardex data from 1999-2013 to identify firms with CEOs and CFOs
with tax backgrounds as well as with independent directors who have tax or legal
1 The complex reporting rules covering reserves for unrecognized tax benefits (UTBs) arising from tax uncertainty require firms to assume a 100 percent probability of tax authority audit under full disclosure of the position’s details, unless the firm is willing to litigate for the benefits claimed.

5
backgrounds. Both univariate and multivariate analyses suggest that firms with tax
executives report lower five-year forward looking GAAP effective tax rates (ETRs).
However, we find no evidence of differential cash ETRs. These results suggest that firms
with tax executives engage in the same level of tax avoidance as other firms but either
focus on strategies that are more permanent in nature and therefore reduce reported
GAAP ETRs, or record smaller tax reserves for uncertain tax avoidance. Consistent with
the latter explanation, we also find weak evidence that firms with tax executives accrue
smaller reserves for tax benefits, but that these smaller tax reserves better map into future
tax cash flows. Finally, we document that tax executives are associated with a reduced
likelihood of tax-related comment letters and restatements.
With respect to independent directors, we find little evidence that tax or legal
directors influence the level of tax avoidance or financial reporting for income taxes. Our
results concerning financial reporting quality are in stark contrast to those in Krishnan et
al. (2011), who document that firms with audit committee members with legal
backgrounds exhibit higher short-term accrual quality and fewer discretionary accruals.
This discrepancy is striking because we examine a specific legal contingency account
(the UTB) that is susceptible to managerial discretion (Cazier, Rego, Tian and Wilson
2015; De Simone, Robinson, and Stomberg 2014), and therefore an account where we
expect to see the documented positive monitoring effects of legal directors. These results
suggest that tax and legal directors may not have sufficient influence over tax reporting
decisions to provide the monitoring benefits documented in Krishnan et al. (2011).
This study contributes to the literature in several areas. First, we extend the
growing literature in accounting that examines the effect of specific individual traits on

6
corporate tax avoidance (Chyz, Gaertner, Kausar and Watson 2014, Olsen and
Steckelberg 2015) and the broader literature in finance that links managerial
characteristics to corporate decision making. We also contribute to the related literature
that examines the effect of executives on corporate tax avoidance (e.g., Dyreng, Hanlon
and Maydew 2010). Whereas much of this research focuses on the influence of executive
incentives (Armstrong et al. 2012, Gaertner 2014, Rego and Wilson 2012, Powers,
Robinson and Stomberg 2015), we exploit a new link between the qualifications
executives and the level of corporate tax planning.
Our results also contribute to the literature examining the effect of corporate
governance on tax avoidance. We find limited evidence that independent directors
influence the level of corporate tax avoidance, which could suggest they are not effective
monitors of management’s actions with respect to tax planning. Further, we provide
evidence on the effect of internal monitors on the quality of income tax accounting,
finding no evidence that tax or legal directors are associated with improved accounting
for income taxes. Shareholders wishing to maintain strong internal monitoring of tax
accounts may therefore have to use other mechanisms to achieve this goal.
2. Related Literature and Hypothesis Development The role of tax executives on tax avoidance
A majority of research exploring the determinants of corporate tax avoidance
focuses on firm-level characteristics such as size, profitability, the extent of foreign
operations, and R&D. These studies document several firm attributes that significantly
drive the level of corporate tax avoidance. Recent studies in finance and accounting have
begun to explore the very likely possibility that individuals inside the firm influence

7
outcomes based on their own personal characteristics. As noted by Graham, Harvey and
Puri (2013), although “traditional economic theory suggests companies should pursue
positive NPV projects to maximize wealth… even within the U.S., firms in the same
industry, of similar size and facing similar investment opportunities behave differently”
(p. 103).
A growing line of research examines how executives influence corporate tax
avoidance. Much of this recent research was spurred by Dyreng et al. (2010), which finds
evidence of a manager fixed effect on corporate tax avoidance. These results are
incremental to controlling for firm characteristics and suggest that given the same
opportunities for tax avoidance, different executives make different decision. However,
Dyreng et al. (2010) do not identify any single managerial characteristic that explains
these individuals’ effects on tax avoidance. Since that time, studies have linked corporate
tax avoidance with executive incentives (Armstrong et al. 2012, Gaertner 2014, Powers et
al. 2015, Rego and Wilson 2012), CEO narcissism (Olsen and Steckelberg 2015) and
CEO overconfidence (Chyz et al. 2014). We extend this literature by testing whether
prior job experience in a tax role is associated with CEO or CFO influence over corporate
tax avoidance.
The link between an executive’s prior tax knowledge and corporate tax planning
is straightforward. Implementing a tax avoidance strategy requires not only knowledge
that a particular strategy exists, but also technical know-how and/or ability to implement
the strategy. Alstadsaeter and Jacob (2015) find that incentives, access and awareness are
all important factors in explaining cross-sectional differences in the extent to which
individuals avail themselves of “legal and observable tax avoidance opportunities” (p. 1).

8
This finding is consistent with Bonner, Davis and Jackson (1992), who find that
“integrated tax and transactional knowledge may be important to high-quality tax
planning” (p. 25). CEOs and CFOs with tax backgrounds therefore likely have a greater
awareness of tax avoidance strategies as well as the ability to work with internal or
external tax service providers to implement strategies appropriate for the firm given the
nature of the firm’s structure and business operations.
The prevalence of outside tax consultants could, however, mitigate the
incremental benefit of executives with prior tax experience. For example, McGuire, Omer
and Wang (2012) provide evidence that firms purchasing tax services from their industry-
expert audit firms engage in higher levels of tax avoidance, all else equal. These results
could suggest that external consultants provide sufficient tax technical knowledge to
make internal tax awareness irrelevant. We do not believe this is the case for two reasons.
First, implementing a tax avoidance strategy to maximize cash flow benefits requires a
timely awareness of both the strategy and the opportunity to implement the strategy. For
example, an external consultant cannot provide tax planning advice about a transaction of
which he or she is unaware. Therefore, we believe that having internal tax awareness
increases the likelihood that tax planning opportunities are identified and either
implemented with internal resources or with the help of outside consultants.
Second, managers deciding whether to implement tax avoidance strategies must
be willing to tolerate potential IRS audits, legal actions and media scrutiny. Graham,
Hanlon and Shevlin (2014) provide survey evidence that 60 to 70 percent of executives
have not implemented a proposed strategy due to concerns that the IRS would detect and
challenge the position. Therefore, even if an external consultant proposes a strategy,

9
executives within the firm must be comfortable bearing any potential uncertainty
associated with the strategy before agreeing to the proposal. We believe greater
familiarity with tax authority audit procedures, audit rates, detection rates, and the
technical knowledge that come with prior tax experience translate into a higher tolerance
for tax uncertainty. We therefore predict in our first hypothesis that firms with executives
that have a tax background engage in more tax avoidance, all else equal.
H1: Executives with tax backgrounds are associated with increased corporate income tax avoidance.
The role of tax executives on accounting for income taxes
Income tax law contains sufficient ambiguity to create uncertainty about what
amount of a tax benefit claimed in given year will be ultimately sustained. Because
income tax returns are largely confidential, shareholders rely almost exclusively on
financial statement disclosures to assess tax uncertainty. Given growing attention to tax
uncertainty and limited disclosures of tax uncertainty, the Financial Accounting
Standards Board enacted Accounting Standards Codification (ASC) Topic 740-10, also
known as Financial Interpretation No. 48 (FIN 48), in 2006 to improve the transparency
and comparability of accounting for income taxes.2 Effective in 2007, FIN 48 allows
managers to recognize only those tax benefits that are more likely than not to be
sustained upon an audit by the tax authority. Further, FIN 48 requires the firm to
recognize only the “largest amount of tax benefit that is greater than 50 percent likely of
being realized upon ultimate settlement,” thereby requiring firms to establish a reserve
for the remaining portion of the benefit claimed on the tax return that does not meet the
2Tax uncertainty arises due to the possibility of losing a tax benefit whether due to tax audit, a change in facts and circumstances or business operations, or a change in regulations that reduce the support for or availability of a tax position.

10
50 percent sustainability hurdle. Firms are required to disclose a reconciliation of the
beginning and ending balance of the reserve each year.
Proper financial reporting for tax uncertainty under FIN 48 requires an
understanding of the strength of the facts and circumstances surrounding a tax position.
Tax executives could positively influence tax financial reporting quality by providing
more accurate assessments of tax uncertainty and increasing the correlation between the
reserve for uncertain tax benefits and future cash flows. Magro and Nutter (2012) find
that experiment participants with more tax experience (tax managers) have different
assessments of the relevance and strength of tax authorities than less experienced
participants (tax graduate students), suggesting accounting judgments by decision makers
could be significantly impacted by the individual’s level of tax experience. In our setting,
this finding suggests that managers with greater tax experience are better able to
accurately assess the strength of income tax positions, leading to a more accurate
mapping between future cash flows and the reserve for tax uncertainty.
Aside from the reserve for tax uncertainty, accounting for income taxes is a
particularly complex area of accounting. Tax expense related issues account for over 10
percent of all financial restatements from 2007 to 2013 (PwC 2014). Additionally, we
identify over 2,000 SEC comment letters related to taxes from Audit Analytics over the
same time period. Executives with tax backgrounds could have greater technical
knowledge of the rules generally governing accounting for income taxes and be more
aware of areas of SEC concern. These individuals might therefore improve the firm’s
overall tax reporting quality by providing more accurate and transparent disclosures.

11
However, some studies suggest that executives use tax avoidance for rent
extraction and therefore have incentives to obfuscate financial disclosures (e.g., Desai
and Dharmapala 2006). In this case, tax executives could impair tax reporting quality to
mask suboptimal levels of tax avoidance. Prior work also suggests that income taxes are
subject to earnings management, particularly through the tax reserve (Dhaliwal, Gleason
and Mills 2004). Even though FIN 48 attempted to curb this opportunism, the assessment
of a more-likely-than-not probability under FIN 48 is subject to managerial discretion
(De Simone et al. 2014), and it remains unclear how successfully FIN 48 limited earnings
management through the tax reserve (Cazier et al. 2015, Gupta, Laux and Lynch 2015).
Executives with greater knowledge of the tax accounts could use that knowledge to
respond to financial reporting incentives, like managing earnings to meet or beat analyst
forecasts, or to otherwise obfuscate the uncertainty associated with the firm’s tax
avoidance. Because it is unclear ex ante what effect executives with prior tax experience
have on financial reporting for income taxes, we state our second hypothesis in the null
form below.
H2: Executives with tax backgrounds are not associated with financial reporting for taxes.
The role of independent directors on tax avoidance
A growing area of research examines the effect of the board of directors as
internal monitors of the firm (e.g., Agrawal and Chadha 2005; Efendi, Srivastava, and
Swanson 2007; Dechow, Sloan, and Sweeney 1996; Beasley 1996; Farber 2005). This
stream of research examines a wide variety of characteristics, including independence
(Carcello, Neal, Palmrose, and Scholz 2011; Klein 2002), financial expertise and status
(Badolato, Donalson, and Ege 2014), legal expertise (Krishnan et al. 2011) and incentive

12
compensation (Larcker, Richardson, and Tuna 2007). Krishnan et al. (2011) propose that
because legal experts on the audit committee have a greater understanding of litigation
risks and associated costs, these board members play a greater monitoring role.
We believe independent directors are also likely to provide a monitoring role over
taxes. Practitioners encourage active involvement of the board in tax-related issues,
advising that the responsibility of corporate tax policy is shared by the board of directors
(Deloitte 2014). IRS Director Doug Shulman similarly encouraged boards of directors to
communicate regularly with management about taxes (Deloitte 2011). Together with
management, boards of directors must decide whether that policy entails (a) lower levels
of tax avoidance that involve only those positions unlikely to be challenged by tax
authorities, (b) higher levels of tax avoidance that exploit all possible tax savings
opportunities or (c) something in between those two extremes (Deloitte 2014).
Directors with tax and legal background could influence corporate tax avoidance
in the following ways. First, they can identify knowledge gaps within the tax function
that could lead to forgone tax planning opportunities. Second, they are likely to be more
aware of the resource requirements of the tax function and be committed to ensuring an
appropriate level of tax investment. Third, directors with tax and legal backgrounds may
also have a greater awareness of the types of tax avoidance strategies available to a firm
and of firm-specific opportunities to exploit those strategies.
We acknowledge the possibility that directors on average do not influence the
underlying level of tax avoidance at the firm. These directors may not be involved with
day-to-day tax planning decisions and given the infrequency of board meetings might not
have sufficient interaction with the tax function to influence tax avoidance. Alternatively,

13
these directors could assert their influence by ensuring appropriate managers are hired to
oversee the tax function, leaving little room for an incremental effect of their presence on
the board. Nonetheless, we expect that independent directors with a tax or legal
background positively influence a firm’s level of tax avoidance, as stated our third
hypothesis below.
H3: Independent officers with tax or legal backgrounds are associated with more corporate income tax avoidance.
The role of independent directors on accounting for income taxes
Our final hypothesis addresses how directors with tax or legal backgrounds affect
financial reporting for income taxes. Because tax accruals and related disclosures are a
large component of financial reporting quality, the tax accounts are a plausible setting for
directors to influence financial reporting. Several studies document an effect of directors
on financial reporting quality, many concluding that board members with legal or
financial expertise are associated with improved financial reporting quality (Carcello et
al. 2011, Klein 2002, Badolato et al. 2014, Larcker et al. 2007). For example, Agrawal
and Chadha (2005) find that the probability of restatement is lower in companies whose
boards have an independent director with financial expertise. Krishnan et al. (2011)
report that firms with legal experts on their audit committees exhibit improved accrual
quality. If these findings apply to accounting for income taxes as well, we would expect
directors with tax and legal backgrounds to be associated with improved financial
reporting for income taxes.
However, there are reasons to believe that tax and legal directors may not exercise
similar influence over the tax accounts. Krishnan et al. (2011) allude to the fact that legal
directors influence accrual quality because they are more aware of litigation risks and

14
“feel the urgency to correct any wrongdoings” (p. 2100) before legal problems arise.
Because the rules governing accounting for income taxes are complex, however, an acute
awareness of litigation risk may be insufficient to improve tax accruals and disclosures.
For example, a Deloitte analysis of tax restatements in 2009 revealed that, in many cases,
the restatement arose from poor integration between the tax department and other areas of
the company and not any intentional management wrongdoing. If directors with legal
expertise are focused on litigation rather than specific accounting issues or on the
integration of tax and other departments, they may not benefit tax accounting.
Additionally, legal directors may not focus on routine tax issues but instead become
involved in taxes only when the company is involved in disputes with tax authorities.
Directors with tax knowledge potentially have a deeper understanding of
accounting for income taxes and feel a greater responsibility to be involved in routine tax
matters. However, as noted in the Deloitte analysis referenced above, another leading
cause of tax restatements is carelessness often stemming from top-side adjustments or last
minute entries that can be endemic to accounting for income taxes. Because it is not the
responsibility of directors to audit financial statements, even material errors in
complicated tax calculations may go unnoticed.
Regarding accounting for income tax uncertainty, specifically, it is also unclear
what affect tax and legal directors will have. On one hand, if directors with tax and legal
experience have a heightened awareness of shareholder litigation risks and costs, they
could influence managers to report more conservatively for tax uncertainty, suggesting a
positive association between directors with tax and legal experience and the magnitude of
firms’ tax reserve accruals. On the other hand, if directors with tax and legal experience

15
are more sensitive to the potential costs of signaling uncertain tax avoidance strategies to
tax authorities and/or are better prepared to substantiate uncertain tax positions claimed,
these directors may be confident that the level of uncertainty associated with each
position is lower and therefore that smaller reserves are required. Due to competing
predictions, we present our final hypothesis in the null form below.
H4: Independent directors with tax or legal backgrounds are not associated with financial reporting for taxes.
3. Research Design Data and Sample Boardex Data We use the Boardex 2013 database containing biographical data on executives
and directors to identify prior tax and legal experience. We develop a Python script to
search the prior work experience, education, and certifications of directors and officers
for text indicating prior tax or legal experience. We then manually review a random
subset of results to verify that these searches correctly identify executives and directors
with prior tax or legal experience. We create indicator variables to summarize by year
whether a firm has a CEO or CFO with a tax background, or an independent director with
a tax or legal background. We focus on independent directors as they likely have a
greater monitoring role (Boone, Field, Karpoff and Raheja 2007; Cai, Lui and Qian 2009;
Coles, Daniel and Naveen 2007; Ferreira, Ferreira, and Raposo 2011; Klein 2002; Petra
2004).

16
Sample
We match Boardex firms to the Compustat database using tickers and CIK codes.
In untabulated analysis, we find that firms covered by Boardex are larger (both in terms
of assets and market capitalization) than other firms in Compustat. We also compare the
industry distributions of Boardex firms with the rest of Compustat and find they are
largely similar. Using Compustat annual financial statement data from 1999 to 2013, we
limit the sample to firms with data available to calculate variables required for analysis.
The nature of some variables of interest requires firms to have five years of non-missing
data. We also exclude real estate investment trusts and other flow-through entities. The
final sample yields 31,084 firm-year observations from 4,193 firms. 38 firms (114 firm-
year observations) have an executive with a tax background during at least one year in
the sample. 247 firms (1,447 firm-year observations) have an independent director with a
tax background during at least one year in the sample. 3,640 firms (16,735 firm-year
observations) have an independent director with a legal background during at least one
year in the sample.
< Table 1 here >
Panel A of Table 1 presents the number of sample firms by year. We further break
out the sample into firm-years with a CEO or CFO with a tax background (TaxExec =1),
with an independent director with a tax background (TaxIndDir =1), and with an
independent director with a legal background (LegalIndDir =1). The full sample is split
fairly evenly across all years. The instance of CEOs or CFOs with a tax background is
rare, with at most 11 firms having an executive with a tax background in any given year.
The frequency of tax background at the independent director level is also small, peaking

17
at 130 observations in 2005 and shrinking each year since. In contrast, the instance of
LegalIndDir has increased dramatically over time from less than 40 percent in 1999 to
almost 60 percent every year since the financial crisis.
Panel B provides the industry classification of sample firms. In our full sample,
roughly 36 percent of observations come from SIC code 3, Rubber, Metal and Machines,
18 percent from Food, Textile and Chemicals (SIC code 2) and 15 percent from Health
and Other Services (SIC code 7). The majority of observations with tax executives come
from firms in SIC 3. The frequency of tax and legal directors is also very high in SIC3 as
well as SIC 2. We find no tax executives or tax independent directors in finance,
insurance and real estate firms.
Table 2 provides descriptive statistics for the full sample of firms. On average (at
the median), sample firms have $3B ($0.4B) in assets. Mean (median) pre-tax return on
assets is 2.4 (6.9) percent. Mean (median) foreign sales as a share of total worldwide
sales are 24.0 (13.3) percent. R&D expenditures are 5.1 (0.4) percent of lagged total
assets on average (at the median). We calculate one- and five-year cash and GAAP ETRs.
The mean (median) cash ETR for the full sample (CETR) is 23.1 (22.7) percent, the mean
(median) GAAP ETR (ETR) is 27.2 (32.0) percent, and the average long run, five year
cash (GAAP) ETR is 27.1 (29.1) percent. These figures suggest that most firms in our
sample engage in significant tax avoidance activities. The mean (median) UTB balance
as a percent of total assets is 1.2 (0.6) percent, while the mean (median) current year
addition to the UTB scaled by assets is 0.1 (0.0) percent.
< Table 2 here >

18
Multivariate Tests
To evaluate the effect of individuals on a firm’s chosen level of tax avoidance (H1
and H3), we model one- and five-year measures of the cash and GAAP ETR as a function
of executive or director characteristics and controls as in Equation (1) below.
TaxAvoidance = β0+ β1*Individual + β2*PT_ROA + β3*Size + β4*PctForeign + β5*R&D + β6*Leverage + β7*DiscAcc + β8*SGA + β9*MTB + β10*Growth + IndustryFE + YearFE + ε (1)
For tests of H1, Individual is an indicator variable for the presence of an executive with a
tax background (TaxExec) in that firm-year. For tests of H3, Individual is one of two
indicator variables for the presence of either an independent director with a tax
background (TaxIndDir) in that firm-year, or an independent director with a legal
background (LegalIndDir) in that firm-year.
Our measures of tax avoidance are the level of a firm’s effective tax rate over a
single- or multi-year period. Cash ETR (CETR) is total taxes paid divided by pre-tax
income (TXPD/PI). GAAP ETR (ETR) is total tax expense divided by pre-tax income
(TXT/PI). We also calculate five-year forward-looking GAAP and cash ETR (ETR5 and
CETR5) from year t through year t+4 using the methodology from Dyreng, Hanlon and
Maydew (2008). Consistent with much prior literature, we truncate values outside of [0,
1] to mitigate the influence of outliers. We use forward-looking measures to better detect
the effect of a particular individual in year t on future contemporaneous and future tax
avoidance. Using lagged measures would potentially confound inferences by attributing
firm-level characteristics in prior years to the individuals we examine in year t. These
measures provide evidence of the level of a firm’s tax avoidance activities, with lower
ETRs suggesting more avoidance.

19
We obtain controls from Rego and Wilson (2012). We include pre-tax return on
assets (PI/LagAT) and the natural log of total assets (AT) because effective tax rates are
correlated with firm performance and size (Armstrong et al. 2012, Gupta and Newberry
1997, Manzon and Plesko 2002, Rego 2003, Zimmerman 1983). We control for the
foreign sales scaled by worldwide sales because foreign operations (and foreign tax rates)
can affect worldwide consolidated ETRs. For R&D, we scale research and development
expenditures by lagged total assets and set missing values of R&D to zero. Leverage is
total debt scaled by lagged total assets and is included to control for debt tax shields that
reduce the marginal tax benefits of aggressive tax avoidance. DiscAcc is performance-
adjusted discretionary accruals using the Modified Jones model. Both Lisowsky (2010)
and Wilson (2009) find a positive association between discretionary accruals and tax
shelter incidence. SGA is selling, general and administrative expenses, scaled by lagged
assets. MTB is the market to book ratio (PRCC_F*CSHO/AT). Growth is one-year
percentage sales growth. We estimate Equation (1) using OLS with two-digit SIC
industry and year fixed effects and cluster standard errors by firm.
To evaluate the effect of individuals on a firm’s financial reporting for taxes (H2
and H4), we estimate Equation (2) below.
TaxReporting = β0+ β1*Individual + β2*PT_ROA + β3*Size + β4*PctForeign + β5*R&D + β6*Leverage + β7*DiscAcc + β8*SGA + β9*MTB + β10*Growth + IndustryFE + YearFE + ε (1)
As before, Individual is TaxExec for tests of H2 and TaxIndDir or LegalIndDir for tests
of H4. TaxReporting takes one of five values. The cumulative reserve for uncertain tax
benefits (UTB_Bal) is the UTB ending balance scaled by assets (UTB/AT). This variable
captures reserves related to all uncertain positions that remained unresolved as of the end

20
of year t. As with our ETR measures, we also consider forward-looking financial
statement measures to more accurately capture the effects of Individual in year t. The
current year addition to the UTB (UTB_Add) is the increase in the reserve for uncertain
tax benefits related to positions claimed in year t. Settle%3 is the percent of the UTB that
is settled with tax authorities in t through t+2.3 Following Robinson, Stomberg, and
Towery (2015), we include additions to the reserve made in the current year but
associated with prior year positions in the denominator of these settlement measures. This
mitigates differences in timing as to when reserves are established. This measure reflects
the accuracy of the UTB, with higher percentages corresponding to more accurate
accruals relative to amounts actually paid to tax authorities.4
Finally, we define indicator variables equal to 1 if firm received a tax-related
comment letter in that year from the SEC (Letter) and, separately, if the firm had a tax-
related financial restatement in that firm-year (Restate). Information related to both of
these financial reporting variables is available from the Audit Analytics website. We
estimate Equation (2) using OLS with two-digit SIC industry and year fixed effects and
cluster standard errors by firm. Following Hanlon and Hoopes (2015), we use a linear
probability model to estimate these likelihoods to allow for easier interpretation of the
coefficients as well as the use of fixed effects in the model. As noted by Ai and Norton
(2003), fixed effects can create statistical issues for non-linear limited dependent variable
3 The statute of limitations for the IRS to assess a deficiency is three years. Statutes vary in other jurisdictions. We provide average settlements over a three-year period but acknowledge that settlements can take longer to finalize. However, requiring four or five-year ahead settlement data severely restricts our sample and reduces power. 4The FIN 48 rollforward shows how reserves change from year to year. Firms are required to report decreases in reserves due to settlements with tax authorities. It is not clear whether this “settlements” line of the rollforward represents cash payments to tax authorities or the entire amount of the reserve accrued for the settled position. However, practitioner guidance suggests that cash payments should be reported as settlements and any differences between accrued reserves and cash payments should be reported as increases or decreases in the reserve associated with positions taken in prior years (Deloitte 2008).

21
models. Greene (2004) notes that fixed effects in non-linear limited dependent variable
models can produce biased and inconsistent coefficients when group sizes are small,
which is the case here, but not when using a linear probability model. Other control
variables are defined above.
4. Results Tests of H1 and H2 – The effect of tax executives
To address H1 and H2, we examine differences in the level of tax avoidance and
financial reporting for taxes between firms with a CEO or CFO with a tax background
(TaxExec = 1) and other firms (TaxExec = 0). Table 3, Panel A reports these univariate
results. Results relating to tax avoidance are generally weak and inconsistent. Using two-
tailed confidence intervals, we find significant differences only related to Settle%3 and
Restate with tax executive firms reporting higher three-year settlement percentages and
lower probabilities of tax-related restatements. Using one-tailed confidence intervals, we
find mean and median one-year cash ETRs of tax executive firm-years are higher but
median five-year GAAP ETRs are lower. We report significant differences across many
firm characteristics, however, which highlight the importance of a multivariate analysis.
[Insert Table 3 here.]
We report multivariate results of H1 in Table 3 Panel B. Columns (1) and (2) use
the one- and five-year cash ETR, respectively, as the dependent variable and Columns (3)
and (4) use the one- and five-year GAAP ETR, respectively. Across all four measures,
we only find an association between the presence of a CEO or CFO with a tax
background and the firm’s level of tax avoidance that is significant at conventional levels
when we use the long-run GAAP ETR. We estimate a coefficient on TaxExec of -0.0417

22
(p-value = 0.0159), suggesting that firm-years with a tax executive report average ETRs
on their income statements over the following five years that are approximately 4.2
percent lower than those of other firms. Although insignificant at conventional levels, the
signs on the estimated coefficients on TaxExec are negative when using the long-run cash
ETR and the one-year GAAP ETR. Further, the negative relation between TaxExec and
the one-year GAAP ETR is significant one-tailed (p-value = 0.1394). These results
suggest that firms with tax executives engage in the same level of tax avoidance as other
firms but either focus on strategies that are more permanent in nature and therefore
reduce reported GAAP ETRs, or record smaller tax reserves for uncertain tax avoidance.
This pattern of result is similar to Powers et al. (2015) who find that CEOs compensated
on after-tax earnings measures report lower GAAP ETRs but similar cash ETRs as other
firms. It also corroborates survey evidence in Graham et al. (2014) that some executives
tend to focus on those tax planning strategies that provide a financial statement benefit.
< Table 3 here >
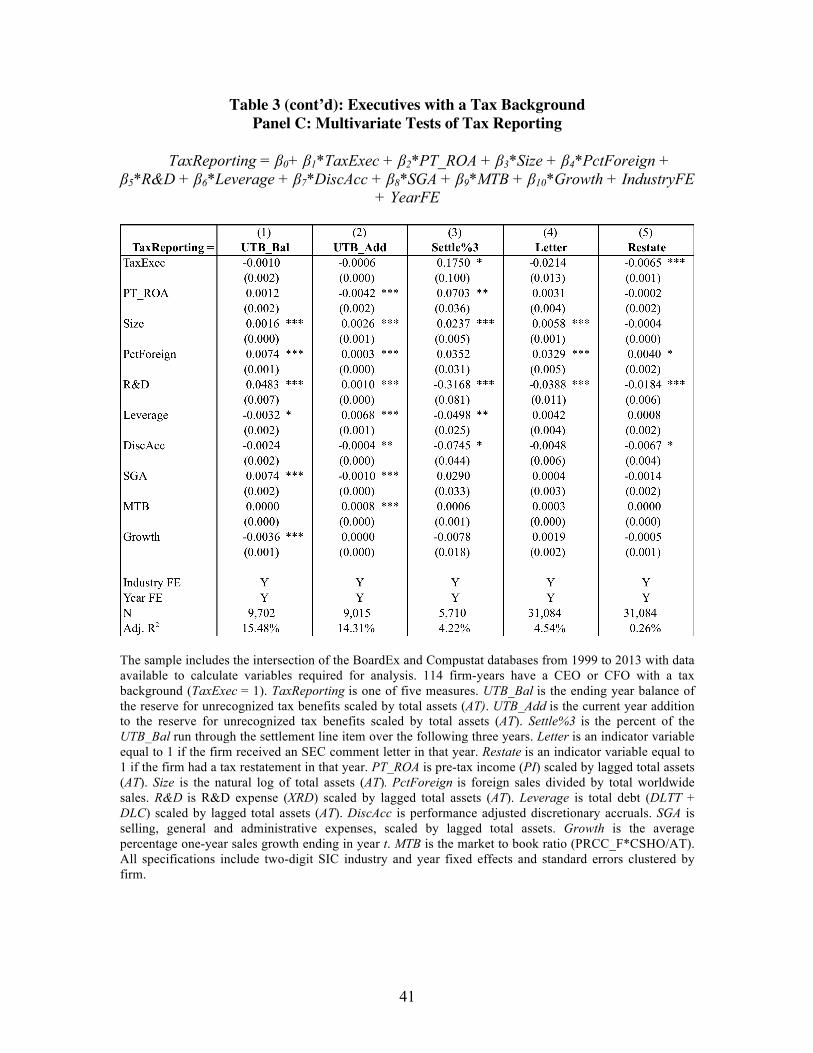
We next estimate the effect of tax CEO and CFOs on reported UTB ending
balances, current-year additions, and settlement percentages, controlling for other
determinants of tax reporting. We also test the likelihood of receiving an SEC comment
letter or having a tax restatement in this multivariate setting. We report these results in
Table 3 Panel C. Column (1) uses UTB_Bal as the measure of financial reporting for
taxes, Column (2) uses UTB_Add, and Column (3) uses Settle%3, Column (4) uses Letter
and Column (5) uses Restate. Consistent with univariate results, we estimate a positive
and significant association between the presence of an executive with a tax background
and the three-year forward-looking UTB settlement percentage. We estimate that firm-

23
years with tax executives settle 17.5 percent more of their UTB balance over the three-
year period relative to other firms. Because settlement percentages of 100 percent suggest
more accurate accruals for tax uncertainty, together with Columns (1) and (2) we take
these results as consistent with tax executive firms engaging in comparable levels of
uncertain tax avoidance as other firms but generating higher quality accruals for uncertain
tax positions. We also find in Column (5) that tax executive firm-years are less likely to
have tax restatements, suggesting higher financial reporting quality over taxes for these
firms. Similarly, the negative coefficient on TaxExec in Column (4) is weakly significant
(two-tailed p-value = 0.1093) suggesting a beneficial effect on the instances of SEC
comment letters.
Tests of H3 and H4 – The effect of tax and legal independent directors Panels A and B of Table 4 provides univariate tests of H3 and H4. We examine
differences in ETRs between firm-years with an independent director that has a tax
background (TaxIndDir = 1) and other firm-years (TaxIndDir = 0) in Panel A. We find
that firm-years with an independent director with a tax background report average one-
year cash (GAAP) ETRs that are 1.7 (3.2) percent higher than other firms, and average
five-year cash (GAAP) ETRs that are 1.2 (3.6) percent higher than other firms. All
median ETR measures are also higher for firm-years with independent directors with a
tax background. These results are statistically significant at conventional levels. Firms
with independent tax directors also report higher three-year settlement ratios but are more
likely to receive tax-related comments letters.
We also test differences in tax avoidance measures between firms with an
independent director with a legal background (LegalIndDir=1) and other firms

24
(LegalIndDir=0) in Panel B. Similarly, we find that all four ETR measures of tax
avoidance are higher in firm-years characterized by having an independent director with a
legal background. Firms with legal directors report higher reserves for uncertain tax
positions at the median, larger values of Settle%3 and are also more likely to receive SEC
comment letters. As with tax executives, however, we also report significant differences
in most firm-level characteristics across these groups, revealing the need to perform
multivariate analyses before drawing conclusions about the effect of these individuals on
firms’ taxes.
Panel C of Table 4 provides results of multivariate tests of H3. Columns (1) and
(2) report results using the one-year cash ETR, Columns (3) and (4) use the five-year
cash ETR, Columns (5) and (6) use the one-year GAAP ETR, and columns (7) and (8)
use the five-year GAAP ETR. For each pair of results, we separately test the effect of an
independent director with a tax background and the effect of an independent director with
a legal background. We find that once we control for other determinants, different
independent director backgrounds have a limited impact on the level of tax avoidance.
We only estimate a statistically significant effect of the presence of an independent
director with a tax background when using the long-run GAAP ETR measure as the
dependent variable. In this case, we estimate that in the following five years, firms with
tax directors report GAAP ETRs that are 1.8 percentage points higher than those of other
firms. Similarly, we only estimate a statistically significant effect of legal backgrounds on
the one-year cash ETR, finding that firm-years with a legal independent director report
cash ETRs that are less than 1 percentage point higher than other firms.
< Table 4 here >

25
We report multivariate results of H4 in Panel D of Table 4. Inconsistent with
predictions and prior work, we find no effect of independent director backgrounds on
financial reporting for tax uncertainty.
5. Additional Tests Matched Sample Design
Because firms with executives and independent directors who have tax or legal
backgrounds differ in key ways from other firms, we also re-estimate equations (1) and
(2) using a matched sample design. Specifically, we match each treatment firm by year to
every control firm in the same size (asset) decile and industry using the 30 industry
classification from Fama and French to produce a one-to-many match. Results are
generally consistent with our main tests.
Re-examining H1, we find that tax executives are associated with five-year
GAAP ETRs that are 3.1 percentage points lower than other firms. These results are
consistent with those reported in Table 3 Panel B, although statistical significance falls
just above the 10 percent threshold (p-value = .1004). In re-examining H2, we find that
tax executives are associated with a lower probability of financial restatement (estimated
coefficient = -0.0085, p-value =0.0881). Consistent with our results for H3, we find that
tax independent directors are associated with five-year GAAP ETRs that are 1.9
percentage points higher (p-value < 0.01) than other firms. This magnitude is marginally
higher than that reported in Panel C of Table 4. Consistent with results for H4, we find no
relation between independent director characteristics of interest and financial reporting
for taxes. Note we do not conduct a matched analysis for LegalIndDir because the

26
number of observations where LegalIndDir=1 is greater than 50 percent of our sample
and we therefore do not obtain sufficient matches.
Propensity Score Matching
Because differences in firm-level characteristics between our treatment group and
our control group remained after using the matched sample approach described above, we
use propensity scores to match each firm-year observation in our treatment sample to one
firm-year observation in the control sample. Specifically, we estimate the following
logistic regression to obtain propensity scores:
Pr(Individual=1) = F(+ β2*PT_ROA + β3*Size + β4*PctForeign + β5*R&D + β6*Leverage + β7*DiscAcc + β8*SGA + β9*MTB + β10*Growth + β11*IndustryComplexity+ β12*GeographicComplexity + β13*Segments + β14*CapEx + β15*Intangibles + IndustryFE + YearFE + ε (3)
Most control variables are as defined above. We include complexity measures
based on the sum of squared ratios of sales by industry (IndustryComplexity) or
geographic (GeographicComplexity) segment to total sales as reported in the Compustat
Segments database. We also include the total number of business segments reported
(Segments). Finally, we include CapEx (CAPEX/LagAT) and Intangibles
(INTAN/LagAT) to control for different asset mixes. In untabulated analysis, we estimate
that larger firms, less geographically complex firms and firms with higher levels of SGA
are more likely to have executives with tax backgrounds. Larger firms, less capital
intensive firms and less R&D intensive firms are more likely to have independent
directors with tax backgrounds.
This approach yields treatment groups that are statistically similar to the control
groups along the vast majority of variables reported in Table 2. However, this approach
drastically reduces our sample sizes (to at most 228 total observations for tests of

27
TaxExec and at most 2,894 total observations for tests of TaxIndDir) and, therefore,
reduces the power of our tests. We conduct univariate tests of the differences in our tax
avoidance and financial reporting variables of interest between groups. Results are
generally consistent with our main tests. For H1, we find that firm-years with a tax
executive exhibit average one-year (five-year) GAAP ETRs that are 3.6 (3.5) percent
lower than other firms. These results are significant at the 10 percent level. For H2, we
find that tax executive firms have three-year UTB settlement percentages that are 26.7
percent higher (p-value < 0.01) on average than other firms. We also find some evidence
of fewer comment letters among firms where TaxExec=1 in this propensity matched
sample (one-tailed p-value 0.097).
Re-examining H3 using propensity score matching, we find no difference in the
level of tax avoidance between firms with an independent director with tax experience
and other firms. However, in re-testing H4 we find that firms with a tax director have
three-year UTB settlement percentages that are 3.5 percent higher (p-value < 0.10) than
other firms. As above, we do not conduct propensity score matching for LegalIndDir.
Interactive Effect of Executive and Director Backgrounds
Finally, given our findings that executives and directors influence the level of tax
avoidance in opposite ways, it is natural to explore whether directors with tax or legal
experience mitigate the increased tax avoidance exhibited by executives with tax
experience. We therefore examine whether there is any interactive effect of these two
groups of individuals. We group tax and legal independent directors together into a single
indicator variable (TaxLegalIndDir) and re-estimate Equation (1) including this variable,
TaxExec, and their interaction. Table 5 presents results. In Panel A, we find that the main

28
effect of TaxLegalIndDir, after controlling for the effect of executives with tax
experience and the interaction, is associated with 0.7 percent higher one-year cash ETRs.
The main effect of tax executives, after controlling for TaxLegalIndDir and the
interaction, is associated with 4.1 (7.4) percent lower five-year cash (GAAP) ETRs. We
also estimate a positive coefficient on TaxLegalIndDir*TaxExec using the five-year
GAAP ETR as the dependent variable, suggesting that directors with tax or legal
backgrounds mitigate the effect of tax executives on reported tax expense. We find weak
evidence that firms with tax executives and TaxLegalIndDir have lower values of
Settle%3, all else equal, which could suggest directors contribute to higher GAAP ETRs
through their effect on tax reserves.
[Insert Table 5 here.]
Controlling for TaxLegalIndDir and the interaction, we find evidence that
TaxExec is negatively associated with tax-related comment letters (p-value <0.001) and
restatements (p-value < 0.05). However, we find no evidence that the presence of a
director with tax or legal expertise amplifies or mitigates these effects.
6. Conclusions and Future Work
This study extends prior literature examining the effect of the experience and
qualifications of individuals in a management or monitoring role on corporate tax
avoidance and financial reporting quality. We use Boardex data to identify CEOs and
CFOs with tax backgrounds as well as independent directors with tax or legal
backgrounds, and test whether these individuals are associated with the level of corporate
tax avoidance or accounting for income taxes at their firms. We find evidence that firms
with CEOs or CFOs with prior tax experience report lower long-run GAAP ETRs but

29
similar long-run cash ETRs as firms without these types of executives. We also find
evidence that tax executive firms accrue smaller reserves for uncertain tax positions that
map more closely into future tax cash outflows upon settlement with tax authorities.
Together, we conclude that tax executives achieve lower reported GAAP ETRs through
influence over accounting for income taxes. We also find some evidence that the
probability of a tax-related comment letter or restatement is lower for firms with tax
executives.
In contrast to these results and to prior work documenting positive financial
reporting implications of legal directors, we find little evidence that independent directors
with prior tax or legal experience affect the level of corporate tax avoidance or
accounting for income taxes. These inconsistent results suggest that tax and legal
directors are not effective internal monitors over income taxes either because they are not
sufficiently involved in the tax function or because their areas of prior experience are not
particularly relevant in enhancing the financial reporting quality of income tax accounts.
All results are robust to matching treatment and control firms to mitigate potential
endogeneity concerns.
Given that our findings on legal directors are inconsistent with prior research, we
intend to broaden our analysis to include cross-sectional and time series tests. For
example, it is possible that firms with tax and legal directors exert their influence
indirectly through other monitoring or governance mechanisms. Therefore, we plan to
test whether these individuals are associated with executive compensation policies that
incentivize appropriate levels of tax avoidance and high-quality accounting for income
taxes or with purchases of tax NAS. Following Armstrong, Blouin, Jagolinzer and

30
Larcker (2015), we also plan to test for cross-sectional differences based on the ex ante
level of tax avoidance. If tax and legal directors bring firms closer to their expected levels
of tax avoidance, then we expect to find a reduction (increase) in tax expense in situations
where firms are over (under) investing in tax planning. Finally, we plan to investigate
whether tax and legal directors are associated with more readable tax disclosures.

31
References Agrawal, A., Chadha, S., 2005. Corporate governance and accounting scandals. Journal
of Law and Economics 48: 371-406. Alstadsaeter, A. and M. Jacob., 2015. Who participates in tax avoidance? University of
Oslo and WHU working paper. Armstrong, C., J. Blouin, A. Jagolinzer and D. Larcker, 2015. Corporate governance,
incentives and tax avoidance. Journal of Accounting and Economics 1: 1-17. Armstrong, C., J. Blouin, and D. Larcker. 2012. The incentives for tax planning. Journal
of Accounting and Economics 53, 391-411. Ai, C. and Norton, E.C, 2003. Interaction terms in logit and probit models. Economic
Letters 80, 123-129. Badolato, P., Donelson, D., Ege, M., 2014. Audit committee financial expertise and
earnings management: the role of status. Journal of Accounting and Economics 58: 208-230.
Beasley, M., 1996. An empirical analysis of the relation between the board of director composition and financial statement fraud. The Accounting Review 71: 443-465.
Bonner, S.E., J.S. Davis and B.R. Jackson, 1992. Expertise in corporate tax planning: The issue identification stage. Journal of Accounting Research 30: 1-28.
Boone, A., Field, L., Karpoff, J., Raheja, C., 2007. The determinants of corporate board size and independence. Journal of Financial Economics 85, 66-101.
Brown, J., 2011. The spread of aggressive corporate tax reporting: A detailed examination of the corporate-owned life insurance shelter. The Accounting Review 86: 23-57.
Carcello, J., T. Neal, Z. Palmrose, S. Scholz. 2011. CEO involvement in selecting board members, audit committee effectiveness, and restatements. Contemporary Accounting Research 28.
Cai, J., Liu, Y., Qian, Y., 2009. Information asymmetry and corporate governance. Working Paper, Temple University.
Cazier, R., S. Rego, X. Tian, R. Wilson, 2015. The impact of increased disclosure requirements and the standardization of accounting practices on earnings management through the reserve for income taxes. Review of Accounting Studies 20: 436-469.
Coles, J., Daniel, N., Naveen, L., 2007. Co-opted boards: costs, benefits, causes and consequences. Working Paper, Temple University.
Collins, J., Kemsley, D., Lang, M., 1998. Cross-jurisdictional income shifting and earnings valuation. Journal of Accounting Research 36, 209-229.
Chyz, J., Gaertner, F., Kausar, A., Watson, L., 2014. Overconfidence and aggressive corporate tax policy. Working paper.
De Simone, L., Mills, L., Stomberg, B., 2015. Examining IRS audit outcomes of income mobile firms. Stanford Graduate School of Business, University of Texas at Austin, and University of Georgia working paper.

32
De Simone, L., Robinson, J., Stomberg, B., 2014. Distilling the reserve for uncertain tax positions: the revealing case of black liquor. Review of Accounting Studies 19: 456-472.
Dechow, P., Sloan, R., and Sweeney, A., 1996. Causes and consequences of earnings manipulation: an analysis of firms subject to enforcement actions by the SEC. Contemporary Accounting Research 13: 1-36.
Deloitte LLP, 2011. Audit Committee Brief: Tax complexities drive audit committee oversight.
Deloitte LLP, 2014. Audit Committee Brief: What’s on your agenda for 2015? Desai, M. and D. Dharmapala, 2006. Corporate tax avoidance and high-powered
incentives. Journal of Financial Economics 79: 145-179. Dhaliwal, D., Gleason, C., and Mills, M., 2004. Last chance earnings management: Using
the tax expense to meet analysts’ forecasts. Contemporary Accounting Research 21: 431-459.
Dyreng, S., M. Hanlon, and E. Maydew. 2008. Long-run corporate tax avoidance. The Accounting Review 83, 61-82.
Dyreng, S., M. Hanlon, and E. Maydew. 2010. The effects of executives on corporate tax avoidance. The Accounting Review 85, 1163-1189.
Efendi, J., Srivastava, A., Swanson, E., 2007. Why do corporate managers misstate financial statements? The role of option compensation and other factors. Journal of Financial Economics 85: 667-708.
Farber, D., 2005. Restoring trust after fraud: does corporate governance matter? The Accounting Review 80: 539-561.
Ferreira, D., Ferreira, M.A., Raposo, C.C., 2011. Board structure and price informativeness. Journal of Financial Economics 99, 523-545.
Gaertner, F. 2014. CEO after-tax compensation incentives and corporate tax avoidance. Contemporary Accounting Research 31, 1077-1102.
Graham, J., M. Hanlon and T. Shevlin, 2014. Incentives for tax planning and avoidance: Evidence from the field. The Accounting Review 3: 991-1023.
Graham, J., C. Harvey, and M. Puri, 2013. Managerial attitudes and corporate actions. Journal of Financial Economics 1: 103-121.
Greene, W., 2004. The behavior of maximum likelihood estimator of limited dependent variable models in the presence of fixed effects. Econometrics Journal 7: 98-119.
Gupta, S., R. Laux, and D. Lynch, 2015. Do firms use tax reserves to meet analysts’ forecasts? Evidence from the pre- and post-FIN 48 periods. Working paper, Michigan State University, Pennsylvania State University, and University of Wisconsin.
Gupta, S., Newberry, K., 1997. Determinants of the variability in corporate effective tax rates: Evidence from longitudinal data. Journal of Accounting and Public Policy 16, 1-34.
Hanlon, M. and S. Heitzman, 2010. A review of tax research. Journal of Accounting and Economics 50: 127-178.

33
Hanlon, M. and J. Hoopes, 2015. What do firms do when dividend tax rates change? An examination of alternative payout responses. Journal of Financial Economics, forthcoming.
Huang, J. and D. Kisgen, 2013. Gender and corporate finance. Are male executives overconfident relative to female executives? Journal of Financial Economics 3:822-839.
Klassen, K., Lang, M., Wolfson, M., 1993. Geographic income shifting by multinational corporations in response to tax rate changes. Journal of Accounting Research 31, 141-173.
Klein, A., 2002. Audit committee board of director characteristics and earnings management. Journal of Accounting and Economics 33: 375-400.
Krishnan, J., Wen, Y., Zhao, W., 2011. Legal expertise on corporate audit committees and financial reporting quality. The Accounting Review 86: 2099-2130.
Larcker, D., Richardson, S., Tuna, I., 2007. Corporate governance, accounting outcomes, and organizational performance. The Accounting Review 82: 963-1008.
Lisowksy, P., 2010. Seeking shelter: Empirically modeling tax shelters using financial statement information. The Accounting Review 85: 1693-1720.
Magro, A. M., Nutter, S. E., 2012. Evaluating the strength of evidence: How experience affects the use of analogical reasoning and configural information processing in tax. The Accounting Review 87: 291-312.
Manzon, G., Plesko, G., 2001. The relation between financial and tax reporting measures of income. Tax Law Review 55, 175-214.
McGuire, S., T. Omer and D. Wang., 2012. Tax avoidance: Does tax-specific industry expertise make a difference? The Accounting Review 87: 975-1003.
Mills, L., Newberry, K., 2004. Do foreign multinationals’ tax incentives influence their U.S. income reporting and debt policy? National Tax Journal 57, 89-107.
Olsen, K. and J. Steckelberg, 2015. CEO narcissism and corporate tax sheltering. Utah State University and University of Arizona working paper.
Petra, S., 2004. The effects of corporate governance on informativeness of earnings. Economics of Governance 8: 129-152.
Powers, K., J. Robinson and B. Stomberg, 2015. How do CEO incentives affect corporate tax planning and financial reporting of income taxes? Review of Accounting Studies, conditionally accepted.
PricewaterhouseCoopers, 2014. PwC’s quarterly tax accounting webcast – Q2 2014 – July, 8, 2014. Available at: http://www.pwc.com/us/en/cfodirect/multimedia/webcasts/pwc-quarterly-tax-accounting-webcast.jhtml
Rego, S.A., 2003. Tax avoidance activities of U.S. multinational corporations. Contemporary Accounting Research 20, 805-833.
Rego, S., Wilson, R., 2012. Equity risk incentives and corporate tax aggressiveness. Journal of Accounting Research 50: 775-810. -- develops a UTB prediction model.

34
Robinson, L., Stomberg, B., Towery, E., 2015. One size does not fit all: The effect of guidance intended to improve comparability on relevance. The Accounting Review, conditionally accepted.
Weisbach, D., 2002. Ten truths about tax shelters. Tax Law Review 55: 215-253. Wilson, R. 2009. An examination of corporate tax shelter participants. The Accounting
Review 84: 969-999. Zerbe, D., 2014. “Surprise change to R&D tax credit rules is big help for small
businesses”. Available online at http://www.forbes.com/sites/deanzerbe/2014/06/02/surprise-change-to-r-d-tax-credit-rules-is-big-help-for-small-business/
Zimmerman, J., 1983. Taxes and firm size. Journal of Accounting and Economics 5, 119-149.

35
Appendix A: Examples of Accounting for Settled Positions Scenario A Assume that in Year 1 a firm claims a position that provides $100 of tax benefits. The company intends to litigate the position if challenged by the tax authority and, therefore, establishes no reserve. The entire $100 benefit is reflected as a reduction to income tax expense. In Year 3, the tax authority audits and challenges the position, assessing $100 of additional tax. The company appeals the revenue agent’s assessments and threatens to litigate. The tax authority and company agree to settle the position for $20 of additional tax because this is less than the costs each party would incur in litigation. In Year 3, the company accrues an increase in the reserve related to a prior year position for $20 and reports a settlement with tax authorities of $20. Assuming the company had no other reserves, 3YR_SETTLE would equal 100 percent. Scenario B Assume as in Scenario A that in Year 1 a firm claims a position that provides $100 of tax benefits. The company would not litigate the position if challenged by the tax authority and, therefore, establishes a $100 reserve. None of the $100 benefit is reflected as a reduction to income tax expense. In Year 3, the tax authority audits and challenges the position, assessing $100 of additional tax. The company appeals the revenue agent’s assessment. The tax authority and company ultimately agree to settle the position for $20 of additional tax. Assuming the company had no other reserves, 3YR_SETTLE would equal 20 percent.

36
Table 1 Panel A: Sample Firms by Year
The sample includes 31,084 firm-years from the BoardEx and Compustat databases from 1999 to 2013 with data available to calculate variables required for analysis. 114 firm-years have a CEO or CFO with a tax background (TaxExec = 1). 1,447 firm-years have an independent director with a tax background (TaxIndDir = 1). 16,735 firm-years have an independent director with a legal background (LegalIndDir = 1).
YearN % N % N % N %
1999 1,948 6.27 8 0.00 55 2.82 768 39.432000 1,956 6.29 8 0.00 63 3.22 844 43.152001 2,104 6.77 11 0.01 85 4.04 980 46.582002 2,178 7.01 8 0.00 92 4.22 1,063 48.812003 2,184 7.03 6 0.00 106 4.85 1,169 53.532004 2,282 7.34 8 0.00 120 5.26 1,274 55.832005 2,328 7.49 10 0.00 130 5.58 1,301 55.882006 2,296 7.39 6 0.00 122 5.31 1,303 56.752007 2,198 7.07 8 0.00 115 5.23 1,279 58.192008 2,062 6.63 5 0.00 105 5.09 1,173 56.892009 2,067 6.65 7 0.00 104 5.03 1,157 55.972010 1,983 6.38 10 0.01 97 4.89 1,174 59.202011 1,911 6.15 8 0.00 91 4.76 1,133 59.292012 1,815 5.84 6 0.00 80 4.41 1,075 59.232013 1,772 5.70 5 0.00 82 4.63 1,042 58.80
Total 31,084 114 1,447 16,735
TaxIndDir = 1TaxExec =1 LegalIndDir =1Full Sample

37
Table 1 Panel B:
Sample Firms by Industry
The sample includes 31,084 firm-years from the BoardEx and Compustat databases from 1999 to 2013 with data available to calculate variables required for analysis. 114 firm-years have a CEO or CFO with a tax background (TaxExec = 1). 1,447 firm-years have an independent director with a tax background (TaxIndDir = 1). 16,735 firm-years have an independent director with a legal background (LegalIndDir = 1).
SIC1N % N % N % N %
0 44 0.142 1 0.880 3 0.210 28 0.170 1 2,190 7.045 13 11.40 166 11.47 1,334 7.970 2 5,692 18.31 19 16.67 373 25.78 3,350 20.02 3 11,101 35.71 59 51.75 344 23.77 5,495 32.84 4 1,783 5.736 6 5.260 122 8.430 1,064 6.360 5 3,880 12.48 8 7.020 129 8.910 2,119 12.66 6 5 0.016 0 - 0 - 5 0.030 7 4,702 15.13 7 6.140 243 16.79 2,382 14.23 8 1,652 5.315 0 - 67 4.630 925 5.530 9 35 0.113 1 0.880 0 - 33 0.200
Total 31,084 100 114 100 1,447 100 16,735 100
Full Sample TaxExec =1 TaxIndDir = 1 LegalIndDir =1

38
Table 2 Full Sample Descriptive Statistics
The sample includes 31,084 firm-years from the BoardEx and Compustat databases from 1999 to 2013 with data available to calculate variables required for analysis. TaxExec is an indicator variable set equal to 1 for firm-years with a CEO or CFO that has prior tax experience. TaxIndDir is an indicator variable set equal to 1 for firm-years with an independent director that has prior tax experience. LegalIndDir is an indicator variable set equal to 1 for firm-years with an independent director that has prior legal experience. CETR is the cash ETR (TXPD/PI). CETR5 is the cash ETR calculated over the following five years. ETR is the GAAP ETR (TXT/PI). ETR5 is the GAAP ETR calculated over the following five years. UTB_Bal is the ending year balance of the reserve for unrecognized tax benefits scaled by total assets (AT). UTB_Add is the current year addition to the reserve for unrecognized tax benefits scaled by total assets (AT). Settle%3 is the percent of the UTB_Bal run through the settlement line item over the following three years. PT_ROA is pre-tax income (PI) scaled by lagged total assets (AT). Size is the natural log of total assets (AT). PctForeign is foreign sales divided by total worldwide sales. R&D is R&D expense (XRD) scaled by lagged total assets (AT). Leverage is total debt (DLTT + DLC) scaled by lagged total assets (AT). DiscAcc is performance adjusted discretionary accruals. SGA is selling, general and administrative expenses, scaled by lagged total assets. Growth is the average percentage one-year sales growth ending in year t. MTB is the market to book ratio (PRCC_F*CSHO/AT).

39
Table 3: Executives with a Tax Background Panel A: Univariate Tests by TaxExec
The sample includes 31,084 firm-years from the BoardEx and Compustat databases from 1999 to 2013 with data available to calculate variables required for analysis. TaxExec is an indicator variable set equal to 1 for firm-years with a CEO or CFO that has prior tax experience. TaxIndDir is an indicator variable set equal to 1 for firm-years with an independent director that has prior tax experience. LegalIndDir is an indicator variable set equal to 1 for firm-years with an independent director that has prior legal experience. CETR is the cash ETR (TXPD/PI). CETR5 is the cash ETR calculated over the following five years. ETR is the GAAP ETR (TXT/PI). ETR5 is the GAAP ETR calculated over the following five years. UTB_Bal is the ending year balance of the reserve for unrecognized tax benefits scaled by total assets (AT). UTB_Add is the current year addition to the reserve for unrecognized tax benefits scaled by total assets (AT). Settle%3 is the percent of the UTB_Bal run through the settlement line item over the following three years. PT_ROA is pre-tax income (PI) scaled by lagged total assets (AT). Size is the natural log of total assets (AT). PctForeign is foreign sales divided by total worldwide sales. R&D is R&D expense (XRD) scaled by lagged total assets (AT). Leverage is total debt (DLTT + DLC) scaled by lagged total assets (AT). DiscAcc is performance adjusted discretionary accruals. SGA is selling, general and administrative expenses, scaled by lagged total assets. Growth is the average percentage one-year sales growth ending in year t. MTB is the market to book ratio (PRCC_F*CSHO/AT).

40
Table 3 (cont’d): Executives with a Tax Background Panel B: Multivariate Tests of Tax Avoidance
TaxAvoidance = β0+ β1*TaxExec + β2*PT_ROA + β3*Size + β4*PctForeign +
β5*R&D + β6*Leverage + β7*DiscAcc + β8*SGA + β9*MTB + β10*Growth + IndustryFE + YearFE + ε
The sample includes the intersection of the BoardEx and Compustat databases from 1999 to 2013 with data available to calculate variables required for analysis. 114 firm-years have a CEO or CFO with a tax background (TaxExec = 1). TaxAvoidance is one of four measures. CETR is the cash ETR (TXPD/PI). CETR5 is the cash ETR calculated over the following five years. ETR is the GAAP ETR (TXT/PI). ETR5 is the GAAP ETR calculated over the following five years. PT_ROA is pre-tax income (PI) scaled by lagged total assets (AT). Size is the natural log of total assets (AT). PctForeign is foreign sales divided by total worldwide sales. R&D is R&D expense (XRD) scaled by lagged total assets (AT). Leverage is total debt (DLTT + DLC) scaled by lagged total assets (AT). DiscAcc is performance adjusted discretionary accruals. SGA is selling, general and administrative expenses, scaled by lagged total assets. Growth is the average percentage one-year sales growth ending in year t. MTB is the market to book ratio (PRCC_F*CSHO/AT). All specifications include two-digit SIC industry and year fixed effects and standard errors clustered by firm.
41
Table 3 (cont’d): Executives with a Tax Background Panel C: Multivariate Tests of Tax Reporting
TaxReporting = β0+ β1*TaxExec + β2*PT_ROA + β3*Size + β4*PctForeign +
β5*R&D + β6*Leverage + β7*DiscAcc + β8*SGA + β9*MTB + β10*Growth + IndustryFE + YearFE
The sample includes the intersection of the BoardEx and Compustat databases from 1999 to 2013 with data available to calculate variables required for analysis. 114 firm-years have a CEO or CFO with a tax background (TaxExec = 1). TaxReporting is one of five measures. UTB_Bal is the ending year balance of the reserve for unrecognized tax benefits scaled by total assets (AT). UTB_Add is the current year addition to the reserve for unrecognized tax benefits scaled by total assets (AT). Settle%3 is the percent of the UTB_Bal run through the settlement line item over the following three years. Letter is an indicator variable equal to 1 if the firm received an SEC comment letter in that year. Restate is an indicator variable equal to 1 if the firm had a tax restatement in that year. PT_ROA is pre-tax income (PI) scaled by lagged total assets (AT). Size is the natural log of total assets (AT). PctForeign is foreign sales divided by total worldwide sales. R&D is R&D expense (XRD) scaled by lagged total assets (AT). Leverage is total debt (DLTT + DLC) scaled by lagged total assets (AT). DiscAcc is performance adjusted discretionary accruals. SGA is selling, general and administrative expenses, scaled by lagged total assets. Growth is the average percentage one-year sales growth ending in year t. MTB is the market to book ratio (PRCC_F*CSHO/AT). All specifications include two-digit SIC industry and year fixed effects and standard errors clustered by firm.

42
Table 4: Independent Directors with Tax or Legal Backgrounds Panel A: Univariate Tests by TaxIndDir
The sample includes 31,084 firm-years from the BoardEx and Compustat databases from 1999 to 2013 with data available to calculate variables required for analysis. TaxIndDir is an indicator variable set equal to 1 for firm-years with an independent director that has prior tax experience. TaxExec is an indicator variable set equal to 1 for firm-years with a CEO or CFO that has prior tax experience. LegalIndDir is an indicator variable set equal to 1 for firm-years with an independent director that has prior legal experience. CETR is the cash ETR (TXPD/PI). CETR5 is the cash ETR calculated over the following five years. ETR is the GAAP ETR (TXT/PI). ETR5 is the GAAP ETR calculated over the following five years. UTB_Bal is the ending year balance of the reserve for unrecognized tax benefits scaled by total assets (AT). UTB_Add is the current year addition to the reserve for unrecognized tax benefits scaled by total assets (AT). Settle%3 is the percent of the UTB_Bal run through the settlement line item over the following three years. PT_ROA is pre-tax income (PI) scaled by lagged total assets (AT). Size is the natural log of total assets (AT). PctForeign is foreign sales divided by total worldwide sales. R&D is R&D expense (XRD) scaled by lagged total assets (AT). Leverage is total debt (DLTT + DLC) scaled by lagged total assets (AT). DiscAcc is performance adjusted discretionary accruals. SGA is selling, general and administrative expenses, scaled by lagged total assets. Growth is the average percentage one-year sales growth ending in year t. MTB is the market to book ratio (PRCC_F*CSHO/AT).
N Mean Std Dev 50th N Mean Std Dev 50th Variables of InterestTaxExec 29,637 0.006 0.0771 0.000 1,447 0.019 *** 0.138 0.000LegalIndDir 29,637 0.523 0.4995 1.000 1,447 0.860 *** 0.347 1.000 ***
Tax VariablesCETR 22,194 0.230 0.176 0.226 1,192 0.247 *** 0.168 0.245 ***CETR5 14,032 0.270 0.162 0.271 808 0.282 * 0.158 0.273 *ETR 29,637 0.270 0.168 0.320 1,447 0.302 *** 0.140 0.333 ***ETR5 17,042 0.289 0.160 0.325 867 0.325 *** 0.133 0.335 ***UTB_Bal 9,206 0.012 0.018 0.006 496 0.011 0.015 0.006 **UTB_Add 9,001 0.001 0.003 0.000 491 0.002 0.003 0.000 ***Settle%3 5,361 0.209 0.324 0.077 349 0.265 *** 0.366 0.162 ***Letter 29,637 0.035 0.185 0.000 1,447 0.046 * 0.210 0.000 **Restate 29,637 0.007 0.081 0.000 1,447 0.008 0.087 0.000
ControlsAT 29,637 2,744 7,401 414.6 1,447 6,432 *** 11,978 1,061 ***PT_ROA 29,637 0.022 0.260 0.069 1,447 0.064 *** 0.186 0.084 ***Size 29,637 5.953 2.163 6.027 1,447 7.015 *** 2.156 6.967 ***PctForeign 29,637 0.239 0.280 0.131 1,447 0.263 *** 0.283 0.184 ***R&D 29,637 0.052 0.100 0.005 1,447 0.024 *** 0.061 0.000 ***Leverage 29,637 0.233 0.269 0.170 1,447 0.253 *** 0.236 0.217 ***DiscAcc 29,637 0.001 0.139 0.000 1,447 -0.003 0.115 -0.001SGA 29,637 0.305 0.301 0.229 1,447 0.214 *** 0.216 0.163 ***MTB 29,637 2.865 4.326 2.014 1,447 2.643 * 3.657 2.022Growth 29,637 0.140 0.401 0.078 1,447 0.120 * 0.328 0.076
TaxIndDir = 1 TaxIndDir = 0

43
Table 4 (Cont’d): Independent Directors with Tax or Legal Backgrounds Panel B: Univariate Tests by LegalIndDir
The sample includes 31,084 firm-years from the BoardEx and Compustat databases from 1999 to 2013 with data available to calculate variables required for analysis. LegalIndDir is an indicator variable set equal to 1 for firm-years with an independent director that has prior legal experience. TaxExec is an indicator variable set equal to 1 for firm-years with a CEO or CFO that has prior tax experience. TaxIndDir is an indicator variable set equal to 1 for firm-years with an independent director that has prior tax experience. CETR is the cash ETR (TXPD/PI). CETR5 is the cash ETR calculated over the following five years. ETR is the GAAP ETR (TXT/PI). ETR5 is the GAAP ETR calculated over the following five years. UTB_Bal is the ending year balance of the reserve for unrecognized tax benefits scaled by total assets (AT). UTB_Add is the current year addition to the reserve for unrecognized tax benefits scaled by total assets (AT). Settle%3 is the percent of the UTB_Bal run through the settlement line item over the following three years. PT_ROA is pre-tax income (PI) scaled by lagged total assets (AT). Size is the natural log of total assets (AT). PctForeign is foreign sales divided by total worldwide sales. R&D is R&D expense (XRD) scaled by lagged total assets (AT). Leverage is total debt (DLTT + DLC) scaled by lagged total assets (AT). DiscAcc is performance adjusted discretionary accruals. SGA is selling, general and administrative expenses, scaled by lagged total assets. Growth is the average percentage one-year sales growth ending in year t. MTB is the market to book ratio (PRCC_F*CSHO/AT).
N Mean Std Dev 50th Pctl
N Mean Std Dev 50th Pctl
Variables of InterestTaxExec 14,349 0.004 0.062 0.000 16,735 0.009 *** 0.094 0.000 ***TaxIndDir 14,349 0.014 0.118 - 16,735 0.074 *** 0.262 0.000 ***
Tax VariablesCETR 10,331 0.219 0.180 0.207 13,055 0.241 *** 0.171 0.238 ***CETR5 6,431 0.268 0.169 0.269 8,409 0.273 * 0.156 0.272 **ETR 14,349 0.255 0.176 0.312 16,735 0.286 *** 0.157 0.326 ***ETR5 8,223 0.278 0.171 0.322 9,686 0.303 *** 0.147 0.328 ***UTB_Bal 3,830 0.012 0.018 0.005 5,872 0.012 0.017 0.006 ***UTB_Add 3,731 0.001 0.003 0.000 5,761 0.001 0.003 0.000 ***Settle%3 2,065 0.194 0.317 0.046 3,645 0.223 *** 0.331 0.094 ***Letter 14,349 0.030 0.170 0.000 16,735 0.041 *** 0.198 0.000 ***Restate 14,349 0.006 0.077 0.000 16,735 0.007 0.085 0.000
ControlsAT 14,349 1,248 3,827 229.9 16,735 4,345 *** 9,672 767.1 ***PT_ROA 14,349 -0.002 0.291 0.060 16,735 0.046 *** 0.222 0.076 ***Size 14,349 5.314 2.054 5.438 16,735 6.593 *** 2.099 6.643 ***PctForeign 14,349 0.235 0.289 0.101 16,735 0.245 *** 0.273 0.156 ***R&D 14,349 0.062 0.107 0.010 16,735 0.042 *** 0.090 0.000 ***Leverage 14,349 0.226 0.287 0.139 16,735 0.241 *** 0.249 0.197 ***DiscAcc 14,349 0.005 0.153 0.003 16,735 -0.003 *** 0.124 -0.002 ***SGA 14,349 0.341 0.336 0.253 16,735 0.267 *** 0.256 0.204 ***MTB 14,349 2.799 4.492 1.929 16,735 2.902 * 4.123 2.081 ***Growth 14,349 0.156 0.443 0.083 16,735 0.125 *** 0.354 0.076 ***
LegalIndDir = 0 LegalIndDir = 1

44
Table 4 (Cont’d): Independent Directors with Tax or Legal Backgrounds Panel C: Multivariate Tests of Tax Avoidance
TaxAvoidance = β0+ β1*IndDir + β2*PT_ROA + β3*Size + β4*PctForeign + β5*R&D + β6*Leverage + β7*DiscAcc + β8*SGA +
β9*MTB + β10*Growth + IndustryFE + YearFE
The sample includes the intersection of the BoardEx and Compustat databases from 1999 to 2013 with data available to calculate variables required for analysis. 1,447 firm-years have an independent director with a tax background (TaxIndDir = 1). 16,735 firm-years have an independent director with a legal background

45
(LegalIndDir = 1). TaxAvoidance is one of four measures. CETR is the cash ETR (TXPD/PI). CETR5 is the cash ETR calculated over the following five years. ETR is the GAAP ETR (TXT/PI). ETR5 is the GAAP ETR calculated over the following five years. IndDir is either TaxIndDir or LegalIndDir. PT_ROA is pre-tax income (PI) scaled by lagged total assets (AT). Size is the natural log of total assets (AT). PctForeign is foreign sales divided by total worldwide sales. R&D is R&D expense (XRD) scaled by lagged total assets (AT). Leverage is total debt (DLTT + DLC) scaled by lagged total assets (AT). DiscAcc is performance adjusted discretionary accruals. SGA is selling, general and administrative expenses, scaled by lagged total assets. Growth is the average percentage one-year sales growth ending in year t. MTB is the market to book ratio (PRCC_F*CSHO/AT). All specifications include two-digit SIC industry and year fixed effects and standard errors clustered by firm.

46
Table 4 (Cont’d): Independent Directors with Tax or Legal Backgrounds Panel D: Multivariate Tests of Tax Reporting
TaxAvoidance = β0+ β1*IndDir + β2*PT_ROA + β3*Size + β4*PctForeign + β5*R&D + β6*Leverage + β7*DiscAcc + β8*SGA +
β9*MTB + β10*Growth + IndustryFE + YearFE
The sample includes the intersection of the BoardEx and Compustat databases from 1999 to 2013 with data available to calculate variables required for analysis. 1,447 firm-years have an independent director with a tax background (TaxIndDir = 1). 16,735 firm-years have an independent director with a legal background
TaxReporting =TaxIndDir -0.0007 0.0001 0.0254 0.0043 0.0002
(0.001) (0.000) (0.028) (0.006) (0.002)LegalIndDir 0.0006 0.0000 0.0016 -0.0020 0.0005
(0.001) (0.000) (0.014) (0.002) (0.001)PT_ROA 0.0012 0.0013 -0.0041 *** 0.0015 *** 0.0698 ** 0.0700 ** 0.0032 0.0031 -0.0002 -0.0002
(0.002) (0.002) (0.002) (0.000) (0.036) (0.036) (0.004) (0.004) (0.002) (0.002)Size 0.0016 *** 0.0016 *** 0.0026 *** 0.0003 *** 0.0239 *** 0.0240 *** 0.0057 *** 0.0059 *** -0.0004 -0.0004
(0.000) (0.000) (0.001) (0.000) (0.005) (0.005) (0.001) (0.001) (0.000) (0.000)PctForeign 0.0074 *** 0.0075 *** 0.0003 *** 0.0009 *** 0.0332 0.0343 0.0329 *** 0.0328 *** 0.0040 * 0.0041 **
(0.001) (0.001) (0.000) (0.000) (0.031) (0.031) (0.005) (0.005) (0.002) (0.002)R&D 0.0483 *** 0.0485 *** 0.0010 *** 0.0066 *** -0.3095 *** -0.3125 *** -0.0384 *** -0.0388 *** -0.0183 *** -0.0183 ***
(0.007) (0.007) (0.000) (0.001) (0.082) (0.082) (0.011) (0.011) (0.006) (0.006)Leverage -0.0033 * -0.0032 * 0.0068 *** -0.0004 * -0.0490 * -0.0492 * 0.0042 0.0040 0.0008 0.0008
(0.002) (0.002) (0.001) (0.000) (0.025) (0.025) (0.004) (0.004) (0.002) (0.002)DiscAcc -0.0023 -0.0024 -0.0004 ** -0.0009 *** -0.0747 * -0.0743 * -0.0049 -0.0048 -0.0067 * -0.0067 *
(0.002) (0.002) (0.000) (0.000) (0.044) (0.044) (0.006) (0.006) (0.004) (0.004)SGA 0.0074 *** 0.0074 *** -0.0010 *** 0.0008 *** 0.0301 0.0301 0.0003 0.0004 -0.0014 -0.0014
(0.002) (0.002) (0.000) (0.000) (0.033) (0.033) (0.003) (0.003) (0.002) (0.002)MTB 0.0000 0.0000 0.0008 *** 0.0000 0.0007 0.0006 0.0003 0.0003 0.0000 0.0000
(0.000) (0.000) (0.000) (0.000) (0.001) (0.001) (0.000) (0.000) (0.000) (0.000)Growth -0.0036 *** -0.0036 *** 0.0000 -0.0002 ** -0.0087 -0.0085 0.0019 0.0019 -0.0005 -0.0004
(0.001) (0.001) (0.000) (0.000) (0.018) (0.018) (0.002) (0.002) (0.001) (0.001)
N 9,702 9,702 9,015 9,492 5,710 5,710 31,084 31,084 31,084 31,084 Adj. R2 15.49% 15.50% 14.29% 12.99% 4.16% 4.13% 4.54% 4.54% 0.25% 0.26%
UTB_Bal UTB_Add Settle%3(1) (3) (5)(2) (4) (6)
UTB_Bal UTB_Add Settle%3(9)
Restate(8)
Letter(10)
Restate(7)
Letter

47
(LegalIndDir = 1). TaxReporting is one of five measures. UTB_Bal is the ending year balance of the reserve for unrecognized tax benefits scaled by total assets (AT). UTB_Add is the current year addition to the reserve for unrecognized tax benefits scaled by total assets (AT). Settle%3 is the percent of the UTB_Bal run through the settlement line item over the following three years. Letter is an indicator variable equal to 1 if the firm received an SEC comment letter in that year. Restate is an indicator variable equal to 1 if the firm had a tax restatement in that year. IndDir is either TaxIndDir or LegalIndDir. PT_ROA is pre-tax income (PI) scaled by lagged total assets (AT). Size is the natural log of total assets (AT). PctForeign is foreign sales divided by total worldwide sales. R&D is R&D expense (XRD) scaled by lagged total assets (AT). Leverage is total debt (DLTT + DLC) scaled by lagged total assets (AT). DiscAcc is performance adjusted discretionary accruals. SGA is selling, general and administrative expenses, scaled by lagged total assets. Growth is the average percentage one-year sales growth ending in year t. MTB is the market to book ratio (PRCC_F*CSHO/AT). All specifications include two-digit SIC industry and year fixed effects and standard errors clustered by firm.

48
Table 5: Interactive Effects of Tax Executives with Independent Directors with Tax or Legal Backgrounds
Panel A: Multivariate Tests of Tax Avoidance
The sample includes the intersection of the BoardEx and Compustat databases from 1999 to 2013 with data available to calculate variables required for analysis. 114 firm-years have a CEO or CFO with a tax background (TaxExec = 1). Of these, 80 firm-years also have an independent directors with a tax or legal backgrouns (TaxLegalIndDir=1) TaxAvoidance is one of four measures. CETR is the cash ETR (TXPD/PI). CETR5 is the cash ETR calculated over the following five years. ETR is the GAAP ETR (TXT/PI). ETR5 is the GAAP ETR calculated over the following five years. PT_ROA is pre-tax income (PI) scaled by lagged total assets (AT). Size is the natural log of total assets (AT). PctForeign is foreign sales divided by total worldwide sales. R&D is R&D expense (XRD) scaled by lagged total assets (AT). Leverage is total debt (DLTT + DLC) scaled by lagged total assets (AT). DiscAcc is performance adjusted discretionary accruals. SGA is selling, general and administrative expenses, scaled by lagged total assets. Growth is the average percentage one-year sales growth ending in year t. MTB is the market to book ratio (PRCC_F*CSHO/AT). All specifications include two-digit SIC industry and year fixed effects and standard errors clustered by firm.
TaxAvoidance =TaxExec -0.0227 -0.0413 * -0.0500 -0.0743 ***
(0.034) (0.024) (0.033) (0.024)TaxLegalIndDir 0.0068 ** -0.0017 0.0025 0.0040
(0.003) (0.004) (0.003) (0.003)TaxExec*IndDir 0.0417 0.0316 0.0311 0.0449 *
(0.037) (0.026) (0.036) (0.027)PT_ROA 0.1493 *** 0.1765 *** 0.2280 *** 0.2371 ***
(0.009) (0.013) (0.007) (0.009)Size 0.0085 *** 0.0004 0.0115 *** 0.0064 ***
(0.001) (0.001) (0.001) (0.001)PctForeign 0.0143 * 0.0169 -0.0389 *** -0.0421 ***
(0.008) (0.011) (0.006) (0.008)R&D -0.2937 *** -0.3904 *** -0.1653 *** -0.1686 ***
(0.026) (0.047) (0.019) (0.028)Leverage -0.0361 *** -0.0378 *** -0.0041 0.0103
(0.007) (0.009) (0.005) (0.007)DiscAcc -0.0100 -0.0362 ** -0.0747 *** -0.0861 ***
(0.011) (0.015) (0.008) (0.011)SGA 0.0260 *** 0.0417 *** -0.0136 ** -0.0039
(0.008) (0.012) (0.006) (0.009)MTB -0.0022 *** -0.0026 *** -0.0018 *** -0.0014 ***
(0.000) (0.000) (0.000) (0.000)Growth -0.0388 *** -0.0063 -0.0128 *** -0.0051
(0.004) (0.005) (0.002) (0.003)
Industry FEYear FEN 23,386 14,840 31,084 17,909 Adj. R2 14.65% 12.60% 29.25% 27.38%
Y Y Y YY Y Y Y
CETR CETR5 ETR ETR5(1) (2) (3) (4)

49
Table 5 (Cont’d): Interactive Effects of Tax Executives with Independent Directors with Tax or Legal Backgrounds
Panel B: Multivariate Tests of Tax Reporting
The sample includes the intersection of the BoardEx and Compustat databases from 1999 to 2013 with data available to calculate variables required for analysis. TaxReporting is one of five measures. UTB_Bal is the ending year balance of the reserve for unrecognized tax benefits scaled by total assets (AT). UTB_Add is the current year addition to the reserve for unrecognized tax benefits scaled by total assets (AT). Settle%3 is the percent of the UTB_Bal run through the settlement line item over the following three years. Letter is an indicator variable equal to 1 if the firm received an SEC comment letter in that year. Restate is an indicator variable equal to 1 if the firm had a tax restatement in that year. PT_ROA is pre-tax income (PI) scaled by lagged total assets (AT). Size is the natural log of total assets (AT). PctForeign is foreign sales divided by total worldwide sales. R&D is R&D expense (XRD) scaled by lagged total assets (AT). Leverage is total debt (DLTT + DLC) scaled by lagged total assets (AT). DiscAcc is performance adjusted discretionary accruals. SGA is selling, general and administrative expenses, scaled by lagged total assets.Growth is the average percentage one-year sales growth ending in year t. MTB is the market to book ratio (PRCC_F*CSHO/AT). All specifications include two-digit SIC industry and year fixed effects and standard errors clustered by firm.
TaxReporting =TaxExec -0.0006 0.0004 0.4283 *** -0.0303 *** -0.0046 **
(0.003) (0.000) (0.154) (0.008) (0.002)TaxLegalIndDir 0.0006 0.0000 0.0001 -0.0014 0.0005
(0.001) (0.000) (0.014) (0.002) (0.001)TaxExec*IndDir -0.0007 -0.0010 * -0.3243 ** 0.0127 -0.0027
(0.004) (0.001) (0.153) (0.020) (0.002)PT_ROA 0.0013 0.0015 *** 0.0702 ** 0.0030 -0.0002
(0.002) (0.000) (0.036) (0.004) (0.002)Size 0.0016 *** 0.0003 *** 0.0236 *** 0.0059 *** -0.0004
(0.000) (0.000) (0.005) (0.001) (0.000)PctForeign 0.0075 *** 0.0009 *** 0.0354 0.0328 *** 0.0041 **
(0.001) (0.000) (0.031) (0.005) (0.002)R&D 0.0485 *** 0.0066 *** -0.3168 *** -0.0390 *** -0.0183 ***
(0.007) (0.001) (0.082) (0.011) (0.006)Leverage -0.0032 * -0.0004 * -0.0498 ** 0.0041 0.0008
(0.002) (0.000) (0.025) (0.004) (0.002)DiscAcc -0.0024 -0.0009 *** -0.0746 * -0.0047 -0.0067 *
(0.002) (0.000) (0.044) (0.006) (0.004)SGA 0.0074 *** 0.0008 *** 0.0290 0.0005 -0.0014
(0.002) (0.000) (0.033) (0.003) (0.002)MTB 0.0000 0.0000 0.0006 0.0003 0.0000
(0.000) (0.000) (0.001) (0.000) (0.000)Growth -0.0036 *** -0.0002 ** -0.0079 0.0019 -0.0004
(0.001) (0.000) (0.018) (0.002) (0.001)
Industry FEYear FEN 9,702 9,492 5,710 31,084 31,084 Adj. R2 15.49% 12.98% 4.24% 4.54% 0.25%
YY Y Y Y Y
Letter Restate
Y Y Y Y
(3) (4) (5)UTB_Bal UTB_Add Settle%3
(1) (2)