how important is energy efficiency? coalition for green capital kenneth berlin, general counsel...
TRANSCRIPT

How Important is Energy Efficiency?
Coalition for Green CapitalKenneth Berlin, General Counsel(202) [email protected])www.coalitionforgreencapital.com
Presented at: PACE Energy Conference - Promoting Energy Efficiencyin Commercial Buildings
New York – June 1, 2011

2
Introduction• The US will have to achieve significant reductions in GHG
emissions in the foreseeable future without a cap and trade regime. Closing of coal plants, increased mileage standards, increased renewable energy and energy efficiency will all contribute to this effort.
• Energy Efficiency's contribution will depend on whether energy efficiency programs can overcome significant barriers to their achieving scale. Energy Efficiency in commercial and residential buildings is neither low hanging fruit nor inexpensive and without incentives, residential and commercial building owners far too often choose to use their funds for purposes other than energy efficiency.
• One key to Energy Efficiency programs overcoming these challenges is to develop financing mechanisms like a “green bank” that can provide the massive amounts of capital needed to bring energy efficiency programs to scale.

3
The Coalition for Green Capital• CGC has been developing mechanisms to provide low-cost finance for clean energy
projects and 100% financing for residential and small business energy efficiency programs
– National level
• American Clean Energy and Security Act: Green Bank (H.R.2454), $7.5 billion
• American Clean Energy Leadership Act: Clean Energy Deployment Administration, $10 billion
– State level
• CT close to passage
• CA, CO, MD, KY, VA and Chicago
– International level
• Global Green Banks Conference, NYC, Fall 2011, will examine rise of “green bank” entities around the world and begin a discussion on how to provide increased funding to these entities through an international financing mechanism

4
Outline of Presentation
• The Context – Reducing GHG emissions in the absence of cap and trade
– A three-part approach to reducing GHG emissions from the electric generation Sector
– Reducing GHG emissions in the transportation sector
• The Challenge – understanding the barriers to bringing energy efficiency to scale
• The Green Bank – addressing funding barriers in a time of government retrenchment
• Building political support for energy efficiency programs

5
The Context – CO2 Emissions by Sector and Source
Sector and Source 2008 2009 2010 2011 2012 2013 2014 2015 2016 2017 2018 2019 2020
Residential Total 1229 1166 1233 1154 1138 1112 1101 1092 1095 1093 1097 1103 1112
Commercial Total 1074 1018 1042 1034 1022 1016 1018 1023 1034 1044 1058 1071 1088
Industrial Total 1598 1387 1503 1538 1578 1623 1619 1643 1644 1644 1643 1644 1651
Transportation Total 1937 1854 1865 1875 1885 1909 1914 1921 1927 1927 1926 1924 1925
Electric Power Petroleum 40 34 35 34 34 34 33 33 34 34 33 34 35 Natural Gas 362 373 405 381 370 373 374 379 375 378 381 382 35 Coal 1959 1742 1851 1789 1769 1744 1722 1714 1729 1731 1747 1766 35 Other 12 12 12 12 12 12 12 12 12 12 12 12 35 Total 2374 2160 2303 2217 2185 2164 2141 2138 2149 2155 2173 2193 35
Total by Fuel Petroleum 2444 2319 2343 2360 2398 2427 2428 2434 2439 2437 2430 2425 2423 Natural Gas 1243 1218 1282 1284 1287 1315 1331 1352 1351 1357 1365 1370 1365 Coal 2139 1877 2006 1945 1925 1905 1881 1882 1898 1901 1917 1935 1977 Other 12 12 12 12 12 12 12 12 12 12 12 12 12 Total 5838 5426 5643 5601 5622 5659 5651 5680 5700 5707 5724 5742 5777

6
Step 1 - Reducing Electric Power Sector Emissions - Closing Coal Plants
• Coal fired plants account for approx 33% of all US CO2 emissions
• Even in the absence of cap and trade, a substantial percentage of the 340 GW of coal plants are likely to close between now and 2030
• Many coal-fired plants are old– 60 GW of coal plants are over 60 years old and expected to be retired by 2020
– 92 GW of coal plants are over 45 years old, inefficient, and according to Deutsch Bank should be retired for economic reasons
– Collectively, this represents approximately 45% of total coal capacity
• Many coal fired plants lack pollution control equipment:– 103 GW of coal plants have no environmental controls
– 58 GW lack scrubber units, key to mercury emission controls
– Cost of installing pollution controls range from $400 – 750 million per GW for a scrubber (needed for mercury controls). Cost is up to $1.4 billion for all pollution control equipment
Information from Deutsche Bank report: http://bit.ly/lKCMzK

7
Reducing Electric Power Sector Emissions - Impact
• Barclays Bank predicts that between 15-20% of all coal plants will close by 2015-2020
• Deutsche Bank predicts that about 60% of all coal plants will close by 2030
• Coal plants will be replaced by natural Gas plants, renewables and reduction of demand through energy efficiency

8
Step 2 – Replacing Coal Plants
• Deutsche Bank predictions translate into about a 10% reduction from 2005 levels in total US CO2 emissions by 2020 and a 15% from 2005 levels in 2030 (assumes electricity power sector generates about 33% of all CO2 emissions)
• This is a far higher prediction than EIA which assumes business as usual
• The cost of the transition is expected to be about - $858 billion from 2010 – 2030
• Deutshe Bank predicts that in 2030, 56% of all power sector emissions will be from coal and natural gas plants that produce significant amount of CO2 emissions
• In addition, power units in residential, commercial and industrial buildings also generate substantial CO2 emissions – see chart in slide 6

9
Step 3 – Increasing Energy Efficiency
• A 10-15% reduction CO2 emissions in the power sector is not enough to reach CO2 reduction goals
• Reduction in the transportation sector, which emitted 28% of all US GHG emissions in 2007, will also play an important role in reducing CO2 emissions.
– But the turnover in the automobile fleet is slow – the median life of a car is about 15 years
• Energy Efficiency in buildings is thus critical, but can substantial reductions be achieved?

10
Energy Efficiency – C02 Emissions in the Residential Sector
Key Indicators and Consumption 2008 2009 2010 2011 2012 2013 2014 2015 2016 2017 2018
Key Indicators Households (millions) Single-Family 80.95 81.48 82.56 83.8 84.81 85.9 86.9 87.91 88.91 89.89 90.84 Multifamily 25.12 25.32 25.57 25.86 26.07 26.32 26.58 26.87 27.2 27.55 27.91 Mobile Homes 6.69 6.63 6.6 6.56 6.54 6.53 6.52 6.53 6.57 6.62 6.67 Total 112.76 113.43 114.74 116.22 117.42 118.75 120 121.32 122.68 124.05 125.42
Average House Square Footage 1656 1669 1686 1704 1720 1736 1751 1765 1779 1793 1806
Energy Intensity (million Btu per household) Delivered Energy Consumption 100.8 98 99.7 95.5 94.6 93 91.9 90.8 90.2 89.1 88.3 Total Energy Consumption 191 185.8 192.1 180 177.8 173.2 171 168.8 167.7 166.1 165.1 (thousand Btu per square foot) Delivered Energy Consumption 60.9 58.7 59.1 56.1 55 53.6 52.5 51.5 50.7 49.7 48.9 Total Energy Consumption 115.3 111.3 113.9 105.7 103.4 99.8 97.7 95.6 94.3 92.6 91.4
Residential Sector Key Indicators and Consumption, EIA Reference case(quadrillion Btu, unless otherwise noted)

11
Energy Efficiency – Commercial Sector CO2 Reductions
Key Indicators and Consumption 2008 2009 2010 2011 2012 2013 2014 2015 2016 2017 2018 2019 2020
Key Indicators
Total Floorspace (billion square feet) Surviving 76.4 77.9 79.2 80.3 81.1 81.8 82.6 83.4 84.5 85.6 86.8 88 89.3 New Additions 2.4 2.3 2 1.7 1.7 1.7 1.8 2 2.1 2.2 2.3 2.2 2.2 Total 78.8 80.2 81.2 82 82.7 83.5 84.4 85.4 86.6 87.8 89.1 90.3 91.5
Energy Consumption Intensity (thousand Btu per square foot) Delivered Energy Consumption 109.1 105.9 104.8 105.5 105.4 105.4 105.6 105.6 105.3 105 104.7 104.4 103.9 Electricity Related Losses 125 120.6 121 119.7 118.1 116.7 116.5 116.3 116.4 116.5 116.7 117 117.3 Total Energy Consumption 234.1 226.4 225.8 225.2 223.5 222.1 222 221.8 221.7 221.5 221.4 221.3 221.2
Commercial Sector Key Indicators and Consumption, EIA Reference case(quadrillion Btu, unless otherwise noted)

12
Energy Efficiency Predictions• EIA in its business as usual case predicts a substantial decrease in
the residential sector of energy consumption per household and per square foot by 2020
• But EIA predicts only a minor decrease in energy consumption intensity per square foot in commercial buildings
• McKinsey in its “Unlocking Energy Efficiency in the US Economy” predicts that it is possible to reduce end use energy consumption by 23% of potential demand by 2020, if barriers to energy efficiency can be overcome
• This, McKinsey says, would reduce CO2 emissions by 1.1 Gigatons or about the same amount of reductions that would result from closing coal plants by 2030 (a total reduction of up to 30% of CO2 emissions by 2030 from the power sector alone)

13
Energy Efficiency Barriers
*Financial transaction barriers and actual quality trade-offs are factored into the initial NPV-positive potential calculation as real costs.
Source: McKinsey analysis

14
The High up Front Cost of Energy Efficiency
• McKinsey estimates that it would require investment of $520 billion to achieve the goal of reducing end-use energy consumption by 23% by 2020.
• Other estimate are much higher. Assuming, for example, that it would cost $10,000 a building to achieve a 25-30% reduction in energy use in residential building, the cost would be $1.28 trillion by 2020 (1.28 million buildings on slide 11).
• Retrofitting the 5 million commercial buildings, guessing at a cost of $100,000 per building, would add another $500 billion to the cost.
• Even though these costs would be recovered and a profit eventually made (and thus the argument that energy efficiency is the cheapest way to reduce emissions), massive upfront investments are needed to bring energy efficiency to scale.
15
Consumer and Business Choice Limits Energy Efficiency Spending
• Energy efficiency spending competes with other uses of funds by residential and commercial building owners
• Even though energy efficiency spending is repaid, even with relatively short repayment periods, many and probably most homeowners choose to spend their funds on other things (e.g. Fannie Mae experience with energy saving mortgages).
• Small business also has limited funds for energy efficiency investments
• Large businesses have to decide between spending money on energy efficiency and product development and sale

16
Other Barriers to Energy Efficiency Reaching Scale
• Difficulty securing the loan:
– One reason private banks have thus far been reluctant to finance building retrofits is the difficulty establishing appropriate security for the loan. Energy efficiency retrofits simply do not constitute good collateral, and establishing a second lien on the property superior to the mortgage is a difficult procedure requiring the proper legal framework.
• Suboptimal credit:
– Many consumers who would be desirable to reach from an energy-savings perspective have a bad credit history, may be ineligible for a standard loan, or would be subject to an interest rate so high it would nullify the savings from the efficiency retrofit and result in a transaction that is no longer cash-positive.

17
Other Barriers to Energy Efficiency Reaching Scale (continued)
• Split incentives:
– Occur when the individual who pays the utility bills and would benefit from efficiency gains is not the individual who owns the building and makes the investment decisions. This most commonly occurs in a rental arrangement where the tenant pays the monthly bill and the landlord maintains the property and makes the capital investments. Rental units currently constitute about 30% of the U.S. residential housing stock.
• The sheer scope of the challenge
– Most of the almost 120 million residential buildings and 5 million commercial buildings will have to be retrofitted.
• Rebound and loss of energy efficiency benefits
– Some of the benefit may be lost as consumers increase energy usage in response to lower prices and the effectiveness of many energy efficiency measures deteriorates over time.

18
Overcoming the Barriers – the Need for Financing
• Given consumer and business choice barriers, there is a need to provide 100% up-front capital, and where there is repayment, to limit repayment to the amount of the energy savings in order for energy efficiency programs to reach scale.
• Given federal and state budget limitations there are likely to be strong limitations on the ability of government to provide capital in the form of grants or other incentives that impact governmental budgets.
• Utilities and other electric distribution companies will provide some of the up-front financing and some of the financing can be provided by mil charges that go to the utilities to finance their programs. Since the utility will be repaid, this spending can be thought of as revolving fund spending, but there are limitations on the ability of utilities to spend the needed hundreds of billions of dollars.
• Much of the capital will need to be provided by 100% up-front financing that the borrowers would repay out of energy savings.

19
The Role of Green Banks
• Green Banks can provide much of the capital needed for clean energy and energy efficiency investments.
• Green Banks can be established on both the national and state levels.
• Green Banks can raise capital and debt from many sources.
• Green banks can leverage their funds making scarce dollars go further.
• The barriers to financing described above will have to be overcome and are discussed in other presentations at this conference.
20
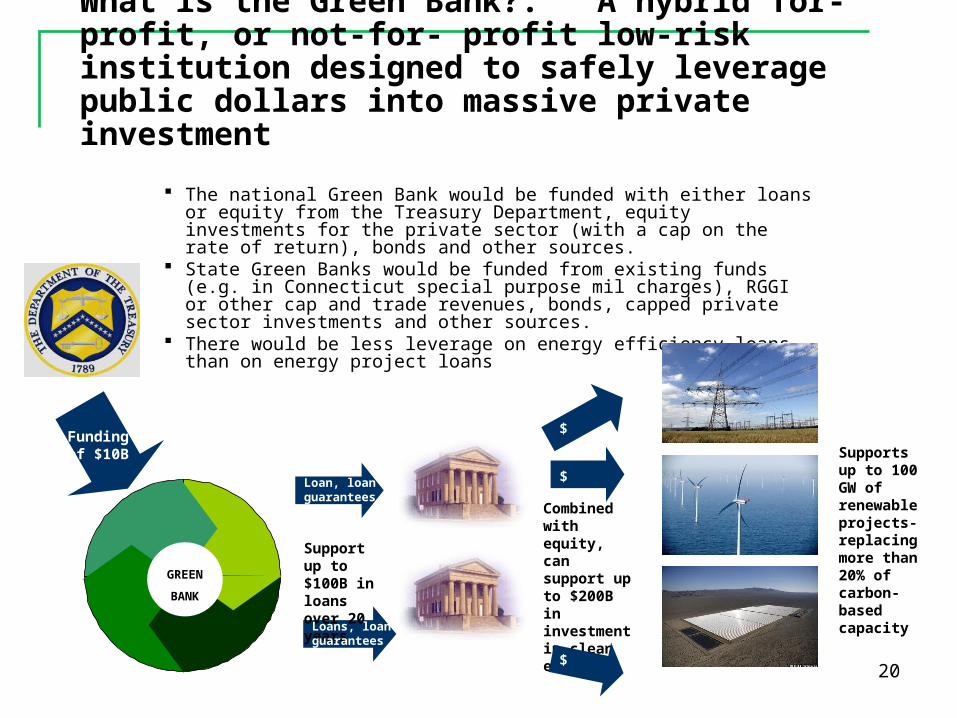
What is the Green Bank?: A hybrid for-profit, or not-for- profit low-risk institution designed to safely leverage public dollars into massive private investment
The national Green Bank would be funded with either loans or equity from the Treasury Department, equity investments for the private sector (with a cap on the rate of return), bonds and other sources.
State Green Banks would be funded from existing funds (e.g. in Connecticut special purpose mil charges), RGGI or other cap and trade revenues, bonds, capped private sector investments and other sources.
There would be less leverage on energy efficiency loans than on energy project loans
Funding
of $10B
GREEN
BANK
Support up to $100B in loans over 20 years
Combined with equity, can support up to $200B in investment in clean energy
$
$
$
Loan, loan guarantees
Loans, loan guarantees
Supports up to 100 GW of renewable projects-replacing more than 20% of carbon-based capacity

2121
The Green Bank could create incentives for willing consumers or utilities to pay for retrofits….without up-front capital from the borrower
1. The Green Bank loans 100% of the cost of an energy efficiency project to a utility or other source at a low rate.
2. The utility disperses the funds to install energy efficiency measures in homes and small businesses, creating jobs in the local community.
Residential property/ Small business
Utility/Co-op
Green Bank
Energy Bill
5. After the loan is repaid, the consumer sees the full benefit of the efficiency measures, the utility has saved money and created local jobs, and the taxpayer has been repaid in full.
4. Through on-bill financing, a portion of the savings shows up on the consumer’s bill, and the rest is transferred to the utility, which uses the money to repay the initial loan from the Green Bank over an extended tenor. (For example, if there is a savings of $100/month, the consumer receives a $25 discount on the bill and the utility charges $75 for electricity that is not being provided in order to re-pay the loan). The utility will also have the right to place a lien on the property in order to obtain payment. 3. The owner of the residence/small
business pays no up-front cost to have their building retrofitted, and sees a reduced energy bill.

22
Building Political Support
• Requires no new funding
• Receives close-to zero budget score for loans from Treasury if properly structured
• Leverages scarce public dollars
• Because the banks are independent or quasi governmental entities, they would not lead to a large new governmental bureaucracy
• Banks are not Democratic Party ideas
• Makes the US more competitive in clean energy
• Creates jobs
23
Example - Benefits from Increased Efficiency Investments in New England
• Increasing efficiency program investments in all six states to levels needed to capture all cost-effective electric efficiency over 156 years ($16.8 billion invested by program administrators) would increase economic activity by $162 billion (2008 dollars)1 as consumers spend energy bill savings in the wider economy2.
__________1 2008 is the dollar year basis for all figures unless otherwise indicated.2 Environment Northeast, (Energy Efficiency: Engine of Economic Growth, Executive
Summary October 2009)

24
Summary of New England Economic Impacts
(Environment Northeast, Energy Efficiency: Engine of Economic Growth, Exec. Summary Oct. 2009)