how gender affects patterns of social relations and …
TRANSCRIPT

HOW GENDER AFFECTS PATTERNS OF SOCIAL RELATIONS AND THEIR IMPACT ON HEALTH:
A COMPARISON OF ONE OR MULTIPLE SOURCES OF SUPPORT
FROM ‘CLOSE PERSONS’*
Rebecca FUHRER1 and S. A. STANSFELD2 1 Department of Epidemiology and Public Health, University College London, U.K.
2 Department of Psychiatry, Queen Mary and Westfield College, St Bartholomew's and the Royal London School of Medicine and Dentistry, London, U.K.
Abstract Numerous studies have reported gender differences in the effects of social rela-tions on morbidity and mortality. When studying health and associated factors, one cannot ignore that sex differences exist and methods that are not “gender-fair” may lead to erroneous conclusions. This paper presents a critical analysis of the health/ social relations association from a measurement perspective, including the definitions of people's networks and how they differ by gender. Findings from the Whitehall II Study of Civil Servants illustrate that women report more close persons in their primary networks, and are less likely to nominate their spouse as the closest person, but both men and women report the same proportion of women among their four closest persons. Women have a wider range of sources of emotional support. To date,
———— * This paper has already been published in Social Science and Medicine, special issue, vol. 54, no. 5, March 2002, p. 811-825.

R. FUHRER – S. A. STANSFELD 376
most epidemiological studies have habitually analysed support provided by the closest person or confidant(e). We compared the health effects of social support when meas-ured for the closest person only and when information from up to four close persons was incorporated into a weighted index. Information from up to four close persons offered a more accurate portrayal of support exchanged, and gender differences were attenuated, if not eliminated, when this support index was used to predict physical and psychological health. Keywords: Social support, Gender, Health, GHQ, Close persons questionnaire. Résumé De nombreux travaux ont mis en évidence des différences de genre dans l’impact des relations sociales sur la morbidité et la mortalité. En étudiant la santé et les facteurs qui lui sont associés, on ne peut ignorer l’existence des différences de genre, et des méthodologies qui ne seraient pas « équitables quant au genre » pour-raient conduire à des conclusions erronées. Cette communication présente une analyse critique de l’association entre santé et relations sociales sur le plan de la mesure du phénomène, y compris les définitions des réseaux de relations sociales des individus et leurs variations selon le genre. Les résultats de l’enquête « Whitehall II » sur les fonctionnaires britanniques montrent que les femmes déclarent un plus grand nom-bre de proches dans leurs réseaux primaires et sont moins enclines à désigner leur mari comme la personne qui leur est la plus proche ; mais hommes et femmes décla-rent la même proportion de femmes parmi leurs quatre relations les plus intimes. Les femmes ont un plus large éventail de sources de soutien affectif. Jusqu’à présent, la plupart des études épidémiologiques ont analysé l’aide apportée par la personne la plus proche ou le confident. Cette communication compare les effets du soutien des proches sur la santé selon que l’on se limite à la personne la plus proche ou que l’on inclut jusqu’à quatre relations dans un indice pondéré. Prendre en considération plusieurs relations permet une description plus précise des flux d’entraide, et les différences de genre sont atténuées, sinon éliminées, quand on utilise cet indice pondé-ré pour prédire l’état de santé physique et psychologique. Mots-clés : Entraide sociale, Mesure, Genre, Santé, GHQ, Questionnaire sur l’entourage.

HOW GENDER AFFECTS PATTERNS OF SOCIAL RELATIONS… 377
1. Introduction Men and women are different. When studying health, illnesses or risk and protective factors among men and women, one cannot ignore that sex differences exist. Misclassification due to measurement meth-ods that ignore the different behaviours, psychology and physiology could lead to erroneous conclusions for men or women, or both. This paper considers the notion of “gender-fair measures”. While we know that culture, biology and psychology interact to influence be-haviour, a key issue is whether we should define the entities we study to reflect diversity, or use the same set of factors to measure the con-struct in both men and women. Indeed, the manifestations of appendi-citis or a broken leg are inherently the same for men and women. In contrast, while a core set of signs and symptoms of depression are usu-ally observed for depressed men and women, other expressions of de-pressive states are gender-based. Social roles and relationships can be thought of as primarily cul-turally determined. It remains unclear whether social interactions fulfil the same needs or operate in the same way for women and men. The importance of the social environment to health and well-being can be traced to ancient times in the writings of Aristotle, in the biblical pre-scriptions of societal rules and legislation and recommendations, and has been observed across diverse societies up to the present time. While many of these accounts study men and women separately, the epidemiological literature has not sufficiently scrutinised whether the measures of social relations are “gender free”, or “gender fair”. The intention of this paper is to contribute to the following de-bate: should we use alternative ways of defining and measuring social relations for men and women? The question is not about social rela-tions per se; the issue is whether defining and measuring any construct should be identical for men and women, when we are already informed by other disciplines that gender differences exist. However, the con-cern remains that if different definitions and measures are used for men and women, this makes it impossible to measure the extent of gender differences in our results. We take a provocative stance and suggest that if gender differences are not incorporated in the construc-tion and evaluation of some instruments, we might be falsely attribut-ing to gender nothing more than inadequate precision and divergent validity. If, for instance, an association is found between a risk factor

R. FUHRER – S. A. STANSFELD 378
and health for men, but not for women, this may reflect a problem with the measurement of the risk factor in women, rather than the ab-sence of its effect in women. 1.1. Social relations: social networks and social support The concept of social relations is multifaceted, and includes the diverse set of interpersonal relationships and exchanges that people engage in both within and between families, friendships and “group affiliation” (Antonucci, 1994). Kahn and Antonucci (1980) deconstruct social relations into three types of support: affect, aid and affirmation. Social relations may include the degree to which an individual’s need for affection, esteem or approval, belonging, identity and security are met by significant others (Kaplan et al., 1977). This concept may also embrace whether he or she is cared for or loved, that he or she is es-teemed or valued, and that he or she feels they belong to a network of communication and mutual obligation (Cobb, 1976). When social rela-tions are examined from a life course perspective, some authors (Antonucci and Jackson, 1987; Bandura, 1986) claim that social rela-tions are effective because they help people develop a feeling of com-petency or personal efficacy. The term social relations covers multiple constructs, although the simple proposal by House and Kahn (1985) to differentiate structure and function as the two essential components is both parsimonious and adequate. The structure of social relations consists of the more objective characteristics of the “social network”, i.e. its size, relative composition in terms of gender and family/friend balance, network density, frequency of contacts, marital status, etc. The function of so-cial relations, often referred to as social support, refers to the actual or perceived type of support received, provided or exchanged. While definitions of social support and social networks vary, the ways of measuring these constructs are even more variable (Antonucci, 1985). Some studies ask about availability of support in general terms, others ask about support from specific role-defined persons, in particu-lar spouse, confidant(e), children, and parents, while others ask about support received with no identification of its source. It is assumed that the larger the network (i.e. the structure), the greater its potential for providing functional support. Seeman and Berkman (1988) examined this assumption in an urban community sample of older adults (> 65

HOW GENDER AFFECTS PATTERNS OF SOCIAL RELATIONS… 379
years old) and found that network size, number of face-to-face con-tacts, and number of proximal ties were associated with greater avail-ability of both emotional and instrumental support. They also found that the presence of a confidant was associated with both emotional and instrumental support, whereas the presence of a spouse was not. Unfortunately, their results are presented adjusted for sex, but neither the independent effect of sex nor the possible interactions of sex with certain types of social ties were shown. Hence, one does not know whether the findings are comparable for men and women. Both popular culture and empirical studies tend to share the belief that women have more extensive and better social relations than men. Women, as opposed to men, are more likely to have larger and more varied networks, as well as more likely to report having a close confi-dante and that the confidante is someone other than their spouse (Antonucci, 1994). Women also provide and receive more support and have a wider “net of concern” than men, that is to say, they spend more time involved in responding to requests and support from other people (Kessler et al., 1985). Furthermore, women can more readily mobilise support when in need (Belle, 1989) and men tend to have fewer emotionally intimate relationships than women. All this may mean that women would benefit more in health terms from social sup-port than men. 1.2. Social relations and health The relative contribution of social relations to health and mortality has been reported from numerous studies using different definitions of social relations, different health outcomes and diverse samples. The magnitude of the reported effects varies according to the methodolo-gies employed; nonetheless, there appears to be a consistent associa-tion between inadequate levels of social relations and poor physical and mental health. The apparent consistency and magnitude of these find-ings are such, that House et al. (1988) proposed that “insufficient social support” should be considered an important risk factor for ill-health and mortality. Many explanations have been proposed to describe how and why social relations impact upon health. Social support may have both di-rect effects on health or may buffer the negative effects of life events and chronic stressors (Cohen and Wills, 1985). Social support may act

R. FUHRER – S. A. STANSFELD 380
directly to increase our sense of control over the environment. In this way, it may dampen physiological arousal, strengthen immune re-sponses, and promote healthy (or occasionally unhealthy) behaviour. In addition, social support may act indirectly, to alter the appraisal of threatening events and may provide both emotional support and tangi-ble resources to deal with life crises. Supportive networks are considered to provide a health benefit, and their absence to be detrimental to health, but less is known about the health consequences of negative interactions with network mem-bers. Rook (1990) has proposed three forms of negative interactions: unwanted or aversive contacts, ineffective support and social pressure to adopt or maintain unhealthy behaviours. 1.3. Social relations, health and gender Many of the early studies of social relations and health were lim-ited to men, and some to white men only (Welin et al., 1985). When analyses are performed separately by gender, research has often found a weaker or non-existent association between social support and ill health or mortality for women. Many studies show an advantage for men that is not observed for women (House et al., 1982; Kaplan et al., 1988; Schoenbach et al., 1986), although some studies report an equiva-lent effect of social support on mortality in both men and women (Berkman and Syme, 1979; Orth-Gomer and Johnson, 1987). In a comprehensive review of social support and physical health, Shumaker and Hill (1991) examined the available evidence for gender differences and discussed the possible factors that may account for these observed gender differences. They contend that the associated factors are related not only to the definitions of support and health that are used, but also to the possible mechanisms linking social relations to health that may differ for men and women. While the majority of published reports have examined the effect of social relations on physical health and mortality, an extensive litera-ture also exists on the effects of social relations on mental health and well-being. Cross-sectional studies show a clear negative association between levels of support and psychiatric disorders in both men and women, in community and patient samples (Aneshensel and Stone, 1982; Lin et al., 1979; Williams et al., 1981). Longitudinal studies suggest that lack of support while individuals are depressed predicts poor out-

HOW GENDER AFFECTS PATTERNS OF SOCIAL RELATIONS… 381
come (Brugha et al., 1990; Fondacaro and Moos, 1987; Paykel, 1994). Individuals with better support, or with larger networks, or who are married report better mental health and less psychological distress. The positive effect for marital status on mental well-being is stronger for men than for women. Furthermore, several authors report that net-work interactions are more strongly associated with women’s mental health than with men’s. Antonucci and Akiyama (1987) note that for both men and women, quality of social support has a stronger effect than quantity, however the magnitude of the combined effects of qual-ity and quantity has a greater impact on women's mental health. Like-wise, Kessler et al. (1985) and Schuster et al. (1990) found that depression in women was correlated with both lack of emotional sup-port and negative interaction with partner, relatives and/or friends, while for men only negative interaction was associated with depression. Due to the cross sectional design of most of these studies, the direc-tion of causation cannot be inferred. In the first analyses of social support using the Close Persons Questionnaire (Stansfeld et al., 1998b; Stansfeld and Marmot, 1992) among British Civil Servants in the Whitehall II Study (Marmot et al., 1991), we found that low confiding and poor emotional support from the person identified as closest by the participant, predicted psychiatric disorder in men, though not in women. Similar gender differences were obtained for the SF-36, a measure of physical and mental functioning (Martikainen et al., 1999; Stansfeld et al., 1998a). The absence of a pro-tective factor for women was unexpected. Confiding in the closest per-son without receiving accompanying emotional support conferred greater risk of psychiatric disorder in women than men, and may partly explain the observed gender difference in the effectiveness of confid-ing/emotional support. However, this seemed unlikely to be the full explanation. 1.4. Gender and social relations A critical analysis of our earlier Whitehall II findings included the examination of the definition of respondents’ networks and, if and how, those differed by gender. Women report more close persons in their primary networks and are less likely to nominate their partner as their closest person (Fuhrer et al., 1999; O'Connor and Brown, 1984). Thus, women should have a wider range of sources of emotional sup-

R. FUHRER – S. A. STANSFELD 382
port than men. In order to examine whether measurement of support from only the closest person or up to four close persons generates dif-ferent effects on health, we conducted further analyses on the White-hall II sample. In a first analysis, we found that by incorporating support from up to the four closest persons, low confiding/emotional support was predictive of “psychiatric disorder” in women (Fuhrer et al., 1999); this result differs from the absence of an association ob-served when using only information about the first close person. In contrast, one notes the consistency of the associations observed in men using either the first close person or up to four close persons. These results are concordant with the literature from social psychology delineating different patterns of social relations in men and women (Knipscheer and Antonucci, 1990). The objective of the present paper is to examine different ap-proaches to measuring social relations to ensure “gender-fair” com-parisons when analysing the impact of social relations on health. This is accomplished by comparing gender differences in the components of the Close Persons Questionnaire when assessed for the closest per-son only vs. weighted scores that combine information on up to four close persons, including the spouse. We then contrast the two ways of scoring the Close Persons Questionnaire by modelling each compo-nent's ability to predict satisfaction with relationships, adjusted for age, marital status, grade of employment and the other components in the model. Results of the comparison are also examined to see whether the measures render different findings in their longitudinal relationship to two health outcomes. 2. Methods 2.1. Sample The Whitehall II Study was established to investigate the social gradient in morbidity and mortality (Marmot et al., 1991). It is a cohort study of 10,308 male (67%) and female (33%) civil servants who were working in 20 London Based Civil Service departments and examined between 1985 and 1988 (73% baseline response rate). All the study subjects were invited to participate in every subsequent follow-up phase, irrespective of continued Civil Service employment. The data

HOW GENDER AFFECTS PATTERNS OF SOCIAL RELATIONS… 383
presented in this paper are taken from those participants who com-pleted Versions 3 and 4 of the baseline questionnaire at Phase 1 (n = 7,697); the first 2,611 participants completed earlier versions of the questionnaire that did not include several of the social support ques-tions, and have therefore been excluded from these analyses. The sam-ple used for the analyses includes 6,007 office-based civil servants aged 35 to 55 years at study entry who also returned the postal questionnaire with the General Health Questionnaire (GHQ) (Goldberg and Black-well, 1970) duly completed at Phase 2 (1989), a follow-up response rate of 78.0%. However, due to missing values for some of the social sup-port items, analyses are restricted to 5,793 persons (31% women) for whom we had complete data for the principal variables. At the baseline screening survey (Phase 1) participants completed a detailed question-naire that included sociodemographic, psychosocial, occupational and medical history data, and a physical examination was performed (Marmot et al., 1991). Participants at Phase 2 were more often men, older and in higher employment grades than those who did not participate, although gen-der was not associated with follow-up participation after adjusting for grade. Participation rate increased with age for men, but age was not a factor in women’s participation. 2.2. Measuring support exchanged with close persons At Phase 1, participants completed questionnaires both about so-cial networks and social support. They were asked to respond to ques-tions about size of network, frequency of interactions, group membership, church attendance, social support in the workplace, as well as the Close Persons Questionnaire (Stansfeld and Marmot, 1992). The Close Persons Questionnaire assesses support received from and provided to a maximum of four nominated close persons. Subjectively defined degree of closeness is the criterion for inclusion as a close per-son, unlike some scales, where closeness is defined by the social role of the person, although this role is recorded. The respondent is first asked to record the number of persons he/she “feels very close to”, and then is asked to specify the first closest person, the role of that person, and their gender. This is repeated for up to four close persons. Fifteen questions assess “qualitative” types of support from and to each of the

R. FUHRER – S. A. STANSFELD 384
close persons and the questions start with the phrase “How much in the last 12 months did this person ...” In the validation study of the Close Persons Questionnaire, three subscales were derived from the 15 items using factor analysis (Stansfeld and Marmot, 1992). Seven items constituted the confid-ing/emotional support subscale, three items were included in the prac-tical support subscale, and four items were included in the negative aspects of close relationships subscale. (The items from the question-naire are shown in Appendix A and full details of the questionnaire can be obtained from the authors.) The Likert-scaled responses for the items of each subscale were totalled for each close person nominated. The responses for each item were: not at all, a little, quite a lot, a great deal (coded 0 to 3). Three components were derived from the above questions: (1) confiding/ emotional support, (2) practical support, and (3) negative aspects of relationships. The component scores were then divided into tertiles. In view of the different distributions and mean scores by gender, the ter-tiles were determined separately for men and women. Previous analy-ses of the Whitehall II cohort have used the subscales for the first close person only (Stansfeld et al., 1998a; Stansfeld et al., 1998b). In order to reflect a more accurate picture of social relations of both men and women, in this paper we extended our work on the assessment of support by incorporating the responses for all close persons nomi-nated. We generated a cumulative weighted total score for each sub-scale across the number of close persons nominated, with the most weight given to the first close person, and with progressively decreas-ing weights for each additional person (up to 4 persons). This ap-proach allowed us to incorporate support exchanged with several close persons, with relatively less contributed by each person once, twice or three times removed from the closest person. The total is calculated as a function of the number of persons nominated, though the weights are independent of the number of persons nominated. In an initial approach we assigned a priori weights (Fuhrer et al., 1999). The score for the first close person was assigned a weight of 1.0; the score for the second close person was assigned a weight of 0.25; similarly, the third and fourth close person’s scores were assigned weights of 0.15 and 0.10, respectively, and will be referred to as Cumu-lative Index A. The weights were chosen to reflect proportionally

HOW GENDER AFFECTS PATTERNS OF SOCIAL RELATIONS… 385
greater importance of support provided by the first close person com-pared to the other persons nominated. Nonetheless, the weights were arbitrarily chosen as a first attempt to amalgamate information about several sources of support. We then examined the stability of our results with different weighting schemes. We used response patterns from the data to inform the next choice of weights, and noted that there were significant differences in the mean score for each person as a function of the number of close persons nominated. This is illustrated in Figures 1, 2, and 3 that present the mean score for support provided by each close person according to the number of close persons nominated. In each figure the uppermost curve shows the support provided by the close person nominated first, as a function of the number of persons nominated. Similarly, the next curve is for the second closest person, and so on. For confiding/ emo-tional support (Figure 1) we observe a significant increase (p-value for linear trend <0.0001) in support provided by each close person as the number of persons nominated increases, and this finding does not dif-fer by gender. The same trend is observed for practical support, but only among men (Figure 2). For negative aspects of close relationships, mean scores do not differ according to number of persons nominated (Figure 3). Most confiding/emotional support is provided by the first
Figure 1 Confiding/emotional support from each close person according to number
of close persons nominated (age adjusted)

R. FUHRER – S. A. STANSFELD 386
Figure 2
Practical support from each close person according to number of close persons nominated (age adjusted)
Figure 3
Negative aspects of close relationships from each close person according to number of close persons nominated (age adjusted)
person (Figure 1). The second person provides approximately 60% of that reported for the first, the third and fourth person even less. We used the ratio of support provided by the second, third and fourth close persons relative to the first close person to derive the respective

HOW GENDER AFFECTS PATTERNS OF SOCIAL RELATIONS… 387
weights for compiling the total support score. This finding was then combined with an iterative procedure where we varied the weights, recalculated the best, intermediate and worst tertiles of support and compared the associations with relationship satisfaction for the closest person and each weighted index. The results of this sensitivity analysis led us to choose the weights of 1.0 (Person 1), 0.60 (Person 2), 0.45 (Person 3), 0.30 (Person 4) for the cumulative social support index, referred to as Close Persons Cumulative Index B. 2.3. Other measures Some gender differences have been reported for satisfaction in different domains, including satisfaction with personal relationships (Briscoe, 1982). Relationship satisfaction was assessed by the following question: “All things considered, how satisfied or dissatisfied are you overall with your own personal relationships? Please circle one of the numbers on the 1-7 scale below to show how satisfied or dissatisfied you feel”. Responses were on a seven-point scale from very dissatisfied (1) to very satisfied (7), and then dichotomised to dissatisfied (little, moderately or very dissatisfied) versus satisfied (neutral, little, moder-ately or very satisfied). A social network index, that we adapted from the Berkman/Syme Social Network Index (Berkman and Syme, 1979), is the sum of all the items assessing structure and contacts (i.e. number of people in net-work, frequency of contacts, group membership, church attendance); unlike Berkman's original index, this version does not however, incor-porate marital status in the index construction. This network index reflects social connectedness as measured by the network structure and network interactions, and was included to describe social network pat-terns by gender. Marital status was coded as married/cohabiting, versus not mar-ried (never married, separated, divorced, widowed). Social class was defined by civil service grade of employment, a measure reflecting both income and status. There were three categories: Administrative (high-est), Executive/Professional (intermediate) and Clerical/Support (low-est). There were clear differences in other socioeconomic indicators (highest level of education, housing tenure, access to a car and father’s occupation) by grade of employment (Marmot et al., 1991), illustrating the validity of grade of employment as a measure of social position.

R. FUHRER – S. A. STANSFELD 388
2.4. Health outcomes 2.4.1. Physical health Self-reported health at Phase 2 was selected as a measure of over-all physical health. This simple measure has been shown consistently across many cultures to predict mortality (Idler and Benyamini, 1997). Participants were asked to assess their health over the preceding 12 months. They selected among 5 response categories (very good, good, average, poor, very poor); for the present analyses, we dichotomised the responses to average or worse compared to good or very good. 2.4.2. Psychological distress Psychological distress was measured by the 30-item General Health Questionnaire (GHQ) (Goldberg, 1972), a self-report instru-ment that assesses current mental state. The questions ask about symp-toms of depression, anxiety, sleep disturbance, and social functioning that the respondent has experienced during the preceding four weeks. For each item, there are four possible responses that are coded 0 (not at all, no more than usual) or 1 (rather more than usual, much more than usual); the 30 items are totalled; the range is from 0 to 30 and the higher the total score, the higher the level of psychological distress. “Caseness” threshold, indicative of clinically significant psychiatric morbidity, is defined by a GHQ score of 5 and above which was vali-dated in a subsample interviewed with the Clinical Interview Schedule (Goldberg and Blackwell, 1970; Stansfeld and Marmot, 1992). The sen-sitivity of the GHQ was 73% and the specificity was 88% against the Clinical Interview Schedule. The present analyses use the GHQ at Phase 2 as the mental health outcome measure. 2.5. Statistical analysis Differences in means were compared using analysis of covariance with age groups and employment grade levels fitted as categorical vari-ables in the adjusted analyses. Due to the demographic differences by gender in our sample, we adjusted for marital status and grade of em-ployment at Phase 1 as potential confounders. Adjusted means were computed as the least squares means produced after fitting the analysis

HOW GENDER AFFECTS PATTERNS OF SOCIAL RELATIONS… 389
of variance models. These models were also used to calculate tests for trend across factor levels by fitting these terms as linear, rather than categorical, variables. Differences in proportions were assessed using the Cochran-Mantel-Haenzsel test of association. Logistic regression models were used to examine the association between dissatisfaction with social relationships as the dependent vari-able and the Close Persons Questionnaire cumulative index, as well as the score for the first closest person, as the predictor variables. Logistic regression models were also used to estimate the predictive effects of the social relations measures on subsequent self-reported health and psychological distress (measured by GHQ caseness), after adjusting for the confounding effects of age and marital status at baseline. In addi-tion, the independent effect of each of the three social relations com-ponents (confiding/emotional, practical, negative aspects) was examined by including all three components, as well as age and marital status in a single model. Due to the large differences in sample sizes for men and women, we have focussed on the comparability of the effects’ magnitude rather than on their levels of significance. All analyses were conducted using the statistical package SAS 6.11 for Windows 95 (SAS, 1990). 3. Results The results of this enquiry into “gender fair” measurement of so-cial relations are presented in three parts. First, comparative descriptives of the principal variables are presented. Second, the effect of the dif-ferent types of support (confiding/emotional, practical, and negative aspects of relationships) on dissatisfaction with personal relationship are shown by gender and source(s) of support. Third, the effects of different types of social support on health (self-assessed and psycho-logical distress) are reported. Findings are reported by gender for the closest person nominated, as well as for the weighted cumulative index based on up to four possible close persons. Table 1 shows gender-specific means and proportions of the vari-ables examined in this study. Women are on average older than men (53% vs. 45% above 45, p<0.001), and women are much more fre-quently in lower grades of employment (48% vs. 8%, p<0.001). Nearly 83% of the men are married or cohabiting, whereas fewer women

Table 1
Sociodemographic, physical and psychological health, and social relations variables by gender (Whitehall II Study)
N Women p-valuea
Age group (M = 4003 ; W =1790) 35-39 27.5 22.7 <0.001 40-44 27.3 24.5 45-49 20.4 22.4 50-55 24.9 30.3 100.0% 100.0% Grade of employment (Phase 1) (M = 4003; W = 1790) Administrative - Highest 38.2 9.1 <0.001 Professional/Executive - Intermediate 54.1 42.4 Clerical/Support - Lowest 7.7 47.9 100.0% 100.0% Marital statusb (Phase 1) (M = 3992; W = 1780) Married or cohabiting (%) 82.9 61.9 <0.001 Number of people feel very close to (+SD) at Phase 1 (M = 3970; W = 1801) 5.85 (±5.2) 6.12 (±4.7) =0.06 Number of close persons nominated (Mean +SD) (M = 4003; W = 1790) 3.49 (±2.5) 3.66 (±1.4) <0.01 1 Close person nominated 9.4 3.5 2 Close persons nominated 10.6 8.3 3 Close persons nominated 15.5 12.8 4 Close persons nominated 64.5 75.4 <0.001 100.0% 100.0% Spouseb nominated as closest person among married (%) (M =3377 ; W =1155 ) 92.4 79.6 <0.0001 Proportion of women nominated (%) at Phase 1 Closest person 91.6 30.0 <0.0001 Closest person (excl. spouseb) 63.9 59.2 <0.05 Among all close persons (up to 4) 59.0 57.4 n.s. Among all close persons (up to 4) (excl. spouseb) 45.8 49.2 <0.0001

Table 1 (continued)
N Men Women p-valuea
Social network index (+SD) (M = 4107; W = 1858) 10.09 (±4.1) 9.43 (±3.9) <0.0001 Satisfaction with personal relationships at Phase 1 (M = 4003; W = 1790) Mean score (+SD) (Higher score reflects greater satisfaction)
5.19 (±1.8)
5.39 (±1.8)
<0.0001
Proportion dissatisfied (%) 25.5 21.3 <0.001 Proportion dissatisfied (%) by marital statusb Married/Cohabiting (M = 3309; W = 1102) 21.3 17.5 <0.01 Never married, separated, divorced, widowed (M = 682; W = 678) 46.0 27.4 <0.001 Self reported health at Phase 2 (M = 3988; W = 1783) Average or worse (%) 22.0 36.6 <0.001 Average or worse (%) by marital statusb Married/Cohabiting (M = 3298; W = 1097) 20.7 36.1 <0.001 Never married, separated, divorced, widowed (M = 679; W = 676) 28.4 37.4 <0.001 Psychological health (General Health Questionnaire: GHQ at Phase 2)
(M = 4003; W = 1790)
Total score (+SD) 3.63 (±5.4) 4.78 (±6.4) <0.0001 Above threshold - GHQ > 5 (%) 27.1 34.2 <0.001 Above threshold (%) by marital statusb Married/Cohabiting (M = 3298; W = 1097) 26.7 33.7 <0.001 Never married, separated, divorced, widowed (M = 679; W = 676) 28.6 34.8 <0.001
a. p-values for test of difference, between men and women, in means or distributions. b. Married always refers to married/cohabiting and spouse always refers to spouse/partner.

R. FUHRER – S. A. STANSFELD 392
(62%) are married or cohabiting (p y--
more dissatisfaction with their personal relationships (25.5% vs. 21.3%, <0.001). The latter finding is e
who are not married or cohabiting are more than twice as likely to be
married men, whereas the effect is significantly less for women, 27% n married and 18% for married women.
64.5% nominated four. Women nominate more close persons than
four. The mean number of persand 3.49 for men ( <0.01). However, there were no gender differences
question of the Close Persons Questionnaire. Men report larger neworks than women; thand 9.43 for women ( <0 .0001). the closest person in contrast to 80% of the married women who
p .5% of the maried/cohabiting men do not nominate their spouse/partner as any one
is 9% ( < 0.0001). This suggests that the spouse or partner may have seen as providing less closeness, for
We then examined the gender of the closest person, as well as of
s-ally
are married), whereas women nominate a woman 30% of the time
remaining close person relationships, 64% of the men nomwoman as their closest person compared to 59% of the women. If we
women, 57.4% of the close persons nominated are women and for /partner, among
i-
by women ( <0.0001). If the nature of the support provided by
HOW GENDER AFFECTS PATTERNS OF SOCIAL RELATIONS… 393
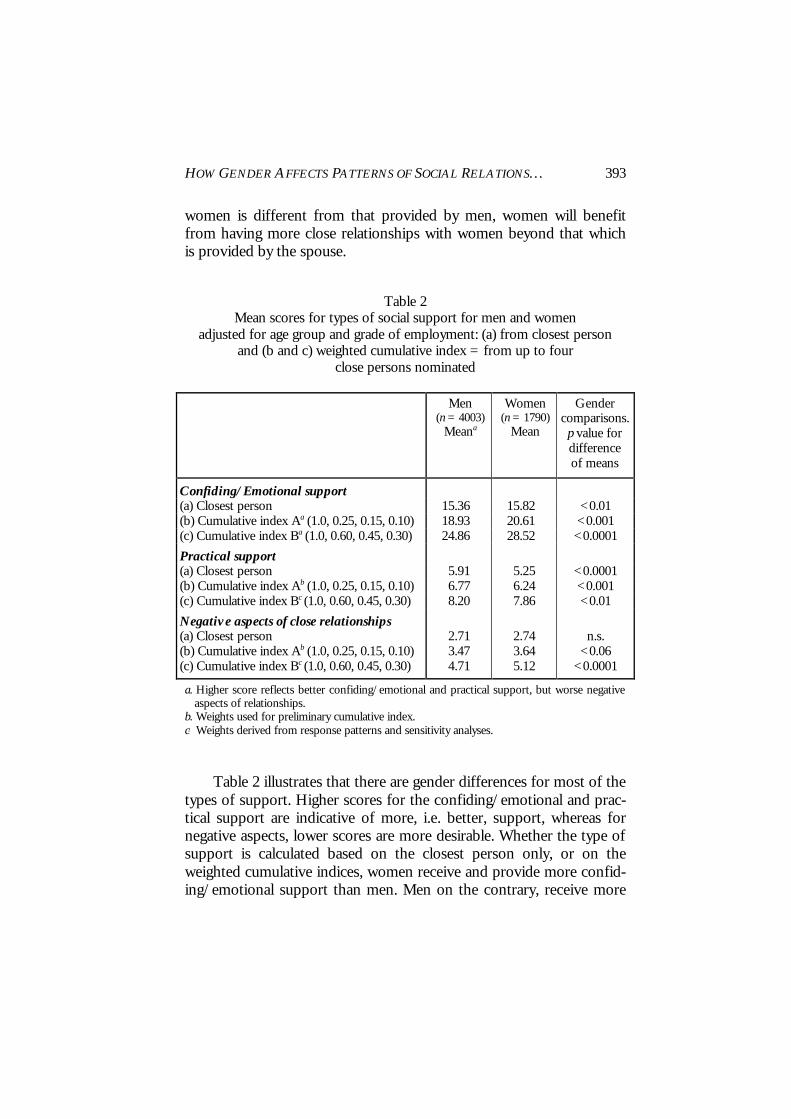
women is different from that provided by men, women will benefit from having more close relationships with women beyond that which is provided by the spouse.
Table 2 Mean scores for types of social support for men and women
adjusted for age group and grade of employment: (a) from closest person and (b and c) weighted cumulative index = from up to four
close persons nominated
Men (n = 4003)
Meana
Women (n = 1790)
Mean
Gender comparisons. p value for difference of means
Confiding/Emotional support (a) Closest person 15.36 15.82 <0.01 (b) Cumulative index Aa (1.0, 0.25, 0.15, 0.10) 18.93 20.61 <0.001 (c) Cumulative index Ba (1.0, 0.60, 0.45, 0.30) 24.86 28.52 <0.0001
Practical support (a) Closest person 5.91 5.25 <0.0001 (b) Cumulative index Ab (1.0, 0.25, 0.15, 0.10) 6.77 6.24 <0.001 (c) Cumulative index Bc (1.0, 0.60, 0.45, 0.30) 8.20 7.86 <0.01
Negative aspects of close relationships (a) Closest person 2.71 2.74 n.s. (b) Cumulative index Ab (1.0, 0.25, 0.15, 0.10) 3.47 3.64 <0.06 (c) Cumulative index Bc (1.0, 0.60, 0.45, 0.30) 4.71 5.12 <0.0001
a. Higher score reflects better confiding/emotional and practical support, but worse negative aspects of relationships.
b. Weights used for preliminary cumulative index. c. Weights derived from response patterns and sensitivity analyses. Table 2 illustrates that there are gender differences for most of the types of support. Higher scores for the confiding/emotional and prac-tical support are indicative of more, i.e. better, support, whereas for negative aspects, lower scores are more desirable. Whether the type of support is calculated based on the closest person only, or on the weighted cumulative indices, women receive and provide more confid-ing/emotional support than men. Men on the contrary, receive more

R. FUHRER – S. A. STANSFELD 394
practical support than women. There are no significant differences in the gender patterns of negative aspects of close relationships for the closest person, but there are more pronounced gender differences in mean scores when information on all nominees are included in the assessment of social relations. This was observed with the weights that minimised the support from persons other than the first person (Cu-mulative Index A: 1.0, 0.25, 0.15, 0.10) (p<0.06), but was highly signifi-cant (p<0.0001) with the weights arrived at based on the sensitivity analyses (Cumulative Index B: 1.0, 0.60, 0.45, 0.30). Our subsequent analyses compare the components for the closest person and Cumula-tive Index B. The three subscale scores are divided into gender-specific tertiles, and so the highest tertile for confiding/emotional and practical support is the “best” tertile, whereas the lowest tertile is the “best” for the negative aspects of support component. 3.1. Satisfaction with personal relationships and types of support Types of support received or exchanged are not experienced in isolation of the others; hence, we included the three types of support simultaneously in the model. We then examined how each of the types of support predicted dissatisfaction with personal relationships when adjusting for the other types, and whether we observed any gender differences by either method of measurement, i.e. first closest person or Cumulative Index B (weights 1.0, 0.60, 0.45, 0.30). Some interesting contrasts should be noted in Table 3. For men and women, dissatisfac-tion with personal relationships is strongly predicted by lack of confid-ing and emotional support, and the effect increases for both genders when the cumulative index is used. For men, the effect of practical support is not changed by the measurement method; it remains the same whether assessed from the closest or multiple nominees. This differs for women, where we observe no significant effect when the closest person is used, but an increase in dissatisfaction when the cu-mulative index is used. This could be interpreted as indicating that low practical support from several people, is worse than low practical sup-port provided by the closest nominee, as if reflecting multiple sources of disappointment. Another explanation might be that the closest per-son is usually the spouse and the amount of practical support provided by the spouse may not influence relationship dissatisfaction for women.

Table 3 Odds ratios for dissatisfaction with personal relationships by type of support exchanged,
according to measurement method of support (closest person and weighted index of up to 4 close persons) (adjusted for age, marital status, grade of employment and other close persons components a in table)
Men (n = 4,003) Women (n = 1,790)
Closest person Cumulative index B Closest person Cumulative index B (1.0, 0.6, 0.45, 0.3) b (1.0, 0.6, 0.45, 0.3) b Odds ratio (95% C.I.) Odds ratio (95% C.I.) Odds ratio (95% C.I.) Odds ratio (95% C.I.)
Dissatisfaction with personal relationship
Confiding/emotional support Best (highest) tertile (=referent) 1.00 1.00 1.00 1.00 Intermediate tertile 1.32 (1.1-1.3) 1.89 (1.5-2.3) 1.31 (0.9-1.8) 1.64 (1.2-2.3) Worst (lowest) tertile 2.86 (2.3-3.6) 3.21 (2.6-4.0) 2.40 (1.7-3.4) 2.94 (2.1-4.1)
Practical support Best (highest) tertile (=referent) 1.00 1.00 1.00 1.00 Intermediate tertile 1.03 (0.8-1.3) 1.08 (0.9-1.3) 0.80 (0.6-1.3) 1.17 (0.8-1.6) Worst (lowest) tertile 1.51 (1.2-1.9) 1.51 (1.2-1.9) 1.27 (0.9-1.8) 1.46 (1.0-2.0)
Negative aspects of relationships Best (lowest) tertile (=referent) 1.00 1.00 1.00 1.00 Intermediate tertile 1.85 (1.5-2.3) 2.34 (1.9-2.9) 1.87 (1.4-2.6) 2.22 (1.6-3.2) Worst (highest) tertile 3.33 (2.7-4.1) 5.12 (4.2-6.3) 3.56 (2.6-4.9) 5.68 (4.1-8.0)
a. Each component is adjusted for the other two in the table, i.e. confiding/emotional is adjusted for practical and negative aspects, etc. b. Figures in brackets show the weight given to each of the four closest persons, starting with the closest person.

396 R. FUHRER – S. A. STANSFELD
For both men and women, highly negative aspects of relationships remained strongly predictive of dissatisfaction, and for both genders, the risk was higher when assessed across all close persons nominated. Interestingly, it is not merely being in the worst tertile that is associated with dissatisfaction; with the exception for practical support, we note the presence of a gradient across the tertiles for both men and women. On the contrary, for practical support we observe a threshold effect, where being in the worst tertile increases the risk of dissatisfaction, irrespective of gender and method of measurement. 3.2. Health and types of support In Tables 4 and 5 we show the effect of the three different types of support on both physical health and psychological distress, after adjusting for age, marital status and the other types of support. Nega-tive aspects of close relationships are detrimental to both physical and psychological health; this finding is consistent across gender, is linear in nature, and increases in magnitude when the negativity comes from close others in addition to the closest person, as shown by the odds ratio for the cumulative index. The effect of social support is greater on psychological distress than on self-assessed health (Table 4). The results for confiding/emotional support illustrate similar pat-terns for both men and women for self-assessed health; being in the worst tertile increased the risk of ill-health, with a somewhat stronger effect for men when the cumulative index for 4 close persons was used rather than the closest person. Gender effects were virtually equivalent when the cumulative index (1.0, 0.60, 0.45, 0.30) was used to predict psychological distress, whereas confiding/emotional support from the closest person was not a significant predictor for women though it was for men. With one exception, insufficient practical support had no ef-fect on health in this study of middle aged adults. Being in the lowest tertile for practical support from the closest person confers protective effects for women, but this may reflect reverse causality. It may be that women who are ill receive more practical support as a response to their poor health. This differs for men, who probably receive practical sup-port irrespective of their health status.

Table 4
Gender specific odds ratios for average or worse self-reported health at Phase 2 by Phase 1 types of support and measurement methods (adjusted for age, marital status, grade of employment and other close persons components a in table)
Men (n = 4,003) Women (n = 1,790)
Closest person Cumulative index B Closest person Cumulative index B (1.0, 0.6, 0.45, 0.3) b (1.0, 0.6, 0.45, 0.3) b Odds ratio (95% C.I.) Odds ratio (95% C.I.) Odds ratio (95% C.I.) Odds ratio (95% C.I.)
Average to poor health Confiding/emotional support
Best (highest) tertile (=referent) 1.00 1.00 1.00 1.00 Intermediate tertile 1.10 (0.9-1.3) 1.28 (1.1-1.6) 1.09 (0.9-1.4) 1.16 (0.9-1.5) Worst (lowest) tertile 1.29 (1.0-1.6) 1.42 (1.2-1.8) 1.26 (1.0-1.7) 1.29 (1.0-1.7)
Practical support Best (highest) tertile (=referent) 1.00 1.00 1.00 1.00 Intermediate tertile 0.99 (0.8-1.2) 0.86 (0.7-1.1) 0.80 (0.6-1.0) 0.97 (0.8-1.2) Worst (lowest) tertile 0.93 (0.7-1.2) 0.96 (0.8-1.2) 0.68 (0.5-0.9) 0.87 (0.7-1.1)
Negative aspects of close relationships Best (lowest) tertile (=referent) 1.00 1.00 1.00 1.00 Intermediate tertile 1.33 (1.1-1.6) 1.51 (1.2-1.8) 1.32 (1.0-1.7) 1.35 (1.1-1.7) Worst (highest) tertile 1.64 (1.4-2.0) 2.00 (1.6-2.4) 1.42 (1.1-1.8) 1.80 (1.4-2.3)
a. Each component is adjusted for the other two in the table, i.e. confiding/emotional is adjusted for practical and negative aspects, etc. b. Figures in brackets show the weight given to each of the four closest persons, starting with the closest person.

Table 5
Gender specific odds ratios for psychological morbidity (GHQa > 5) at Phase 2 by Phase 1 types of support and measurement methods (adjusted for age, marital status, grade of employment and other close persons components b in table)
Men (n = 4,003) Women (n = 1,790)
Closest person Cumulative index B Closest person Cumulative index B (1.0, 0.6, 0.45, 0.3) c (1.0, 0.6, 0.45, 0.3) c Odds ratio (95% C.I.) Odds ratio (95% C.I.) Odds ratio (95% C.I.) Odds ratio (95% C.I.)
Psychological morbidity Confiding/emotional support
Best (highest) tertile (=referent) 1.00 1.00 1.00 1.00 Intermediate tertile 1.16 (1.0-1.4) 1.28 (1.1-1.5) 1.05 (0.8-1.4) 1.23 (1.0-1.6) Worst (lowest) tertile 1.36 (1.1-1.7) 1.50 (1.2-1.8) 1.18 (0.9-1.6) 1.49 (1.1-2.0)
Practical Best (highest) tertile (=referent) 1.00 1.00 1.00 1.00 Intermediate tertile 0.89 (0.7-1.1) 1.06 (0.9-1.3) 0.89 (0.7-1.2) 1.08 (0.8-1.4) Worst (lowest) tertile 0.99 (0.8-1.2) 1.01 (0.8-1.2) 0.87 (0.7-1.2) 0.94 (0.7-1.2)
Negative aspects of close relationships Best (lowest) tertile (=referent) 1.00 1.00 1.00 1.00 Intermediate tertile 1.46 (1.2-1.7) 1.61 (1.3-1.9) 1.60 (1.3-2.1) 1.69 (1.3-2.2) Worst (highest) tertile 2.06 (1.7-2.4) 2.64 (2.2-3.2) 2.40 (1.8-3.0) 2.84 (2.2-3.7)
a. GHQ = General Health Questionnaire. b. Each component is adjusted for the other two in the table, i.e. confiding/emotional is adjusted for practical and negative aspects, etc. c. Figures in brackets show the weight given to each of the four closest persons, starting with the closest person.

HOW GENDER AFFECTS PATTERNS OF SOCIAL RELATIONS… 399
4. Discussion This re-analysis of Whitehall II data has illustrated that “gender-fair” measures of social relations can be developed when informed by social theory and empirical evidence. When the measurement approach incorporates gender-related patterns of social functioning and behav-iour, we obtain equivalent effects on health for men and women. This is in contrast to the weaker or non-significant effects often found for women and also reported in the present paper when assessment of women’s support is limited to the closest person. We do not, however, recommend different approaches for measuring social support for men and women; we do propose the use of gender sensitive approaches so that gender biased underestimates are not due to measurement. The present findings are in agreement with other studies that de-scribe patterns of social relations which led to this re-analysis. Women nominate and report having more close persons, report greater satisfac-tion with their personal relationships, irrespective of their marital status, yet we note with interest that men report larger social networks as measured by our adaptation of the social network index. The differ-ences are not large, but they are statistically significant, and may reflect the patterns of male socialisation, i.e. moving in groups, in contrast to women who tend to have more confidant(e)s. Men report higher levels of practical support from the person they identify as closest, while women report higher levels than men from the subsequent close persons, which is likely to reflect the fact that men receive more from the closest person who is most often a woman and more often their spouse. This is in keeping with a greater benefit of marriage to men than to women found in other studies (Gore and Mangione, 1983; Hughes and Gove, 1981; Pearlin and Johnson, 1977; Wyke and Ford, 1992). In this age-cohort, women may indeed receive less practical support from their partners, a result that needs to be re-examined in younger cohorts in order to determine whether it is period or cohort specific, or indeed gender specific. There is a need to be cau-tious in interpreting the results related to practical support. Our find-ings for women, where lower levels of practical support are associated with better health, endorse the hypothesis that practical support re-ceived may, in fact, reflect a response from close persons to existing ill-health or disability.

R. FUHRER – S. A. STANSFELD 400
The finding that demonstrates that the greater the number of close persons nominated, the higher the confiding/emotional support re-ported from each close person could be interpreted in several ways. This did not support the hypothesis that reliance on a smaller number of close persons might substitute in “quality” what was lost in “quan-tity”. One could speculate that individuals who have the ability to make and sustain more social relationships, derive and exchange more sup-port from each of those relationships, thereby enjoying overall better support. Our results suggest that information about several close persons offers a more accurate portrayal of support exchanged than relying solely on information about the closest person. This may be due in part to greater measurement precision when several sources of information are used, but it could also be due to a better representation of sources of support. Better coverage of sources of support received may yield more accurate results in analyses of social relations and health. There-fore, use of questionnaires, such as the Close Person Questionnaire, which asks about several close persons, captures the varying sources of support by gender, and will lead to better specification of the associa-tion between social relations and health. The weights that we are recommending, of course, remain open to debate and refinement. Moreover, the number of close persons to con-sider needs further evaluation, as the time to complete the question-naire increases proportionally with each additional person included. It is not clear how generalisable these results are to other age groups, non-working populations and different cultural groups. Nevertheless, the overall pattern of gender differences in support is similar to other studies (Antonucci, 1994; Belle, 1989). Further investigation of how specific these patterns are to this lifestage, whether they vary if the par-ticipants have children, and whether the role of social support at work modifies the patterns, would be informative and might inform how general these gender differences are. The pattern of important social relations differs between men and women. It is indispensable that instruments measuring social relations must be “gender-fair”, that is to say, they need to take account of the gender-specific patterns of relations. Support may be perceived, con-ceived or reported differently by men and women. Satisfaction with relationships may be an indicator of different needs or of the impor-tance placed on different aspects of support for men and women, or

HOW GENDER AFFECTS PATTERNS OF SOCIAL RELATIONS… 401
satisfaction may be on the pathway between types of support and health. Understanding, and then successfully measuring, social relations in both men and women, will lead to more accurate and valid studies of the effect of social relations on health. With accurate, valid, but yet, identical “gender-fair” measures, we can expect fewer spurious gender differences or associations between social relations and morbidity and mortality. Acknowledgements We thank all civil service departments and their welfare, personnel and establishment officers; the Civil Service Occupational Health Service Agency, Dr. Elizabeth McCloy; the Council of Civil Service Unions, all participating civil servants, and all members of the Whitehall II study team. We would like to acknowledge the productive methodological discussions we have had with Martin Shipley, the computing support provided by Gwenael Cariou and Joumana Chemali-Hudry, and the advice provided by Professor Lisa Berk-man in the original development of the Close Persons Questionnaire during her sabbatical visit in our department (1985-1986). We are grateful to Profes-sor Sara Arber and the anonymous reviewers for their helpful comments and suggestions on an earlier draft of this paper. The work presented in this paper was funded by a grant from the UK Department of Health (Grant Number 121/5044) and the Economic and Social Research Council (ESRC Grant Number L 128 251 052). The White-hall II study is supported by grants from the Medical Research Council, Health and Safety Executive and the British Heart Foundation, the Agency for Health Care Policy and Research (5 RO1 HS06516), the New England Medical Centre - Division of Health Improvement, the National Heart Lung and Blood Institute (RO1 HL36310), US, NIH; National Institute on Aging (RO1-AG13196), US, NIH; the John D. and Catherine T. MacArthur Foun-dation Research Network on Successful Midlife Development, the Institute for Work and Health, Ontario, Canada, the Volvo Research Foundation, Sweden).

R. FUHRER – S. A. STANSFELD 402
Appendix A. Questions from close persons questionnaire Introduction This section concerns people in your life who you feel close to and from whom you can obtain support (either emotional or practical) including close relatives and good friends. Write in the people you are closest to.
Closest: ........................................................................................................................... Second person:.............................................................................................................. Third person:................................................................................................................. Fourth person: .............................................................................................................. If you are married now and have not put your husband/wife in already, then please include him/her in the Fifth person line: ............................................
Rate each person on the scale from 1 to 4 to show how well they have pro-vided each stated type of support: 1 = not at all, 2 = a little, 3 = quite a lot, 4 = a great deal.
Questions are presented by Type of Support (all items start with “How much in the last 12 months…”). Letter preceding question indicates order of pres-entation in questionnaire. Confiding/emotional support
a) "...give you information, suggestions and guidance that you found helpful?"
c) "...make you feel good about yourself?" d) "...share interests, hobbies and fun with this person?" f) "...did you want to confide in (talk frankly, share feelings with this per-
son)?" g) "…did you confide in this person?" h) "... trust this person with your most personal worries and problems?" k) "... did he/she talk about his/her personal problems with you ?"; Practical support
l) "...did you need practical help from this person with major things ...?" m) "... did the person give you practical help with major things ?" o) "...did this person give you practical help with small things when you
needed it ...?"

HOW GENDER AFFECTS PATTERNS OF SOCIAL RELATIONS… 403
Negative aspects of close relationships
e) "...did this person give you worries, problems and stress?" i) "...would you have liked to have confided more in this person?" j) "...did talking to this person make things worse?" n) "...would you have liked more practical help with major things from this
person?" References ANESHENSEL, C. S., and STONE, J. D. (1982), “Stress and depression: A test of the
buffering model of social support”, Archives of General Psychiatry, vol. 39, p. 1392-1396.
ANTONUCCI, T. C. (1985), “Social support: Theoretical advances, recent findings and pressing issues”, in: I. G. Sarason and B. R. Sarason, eds., Social Support: Theory, Re-search and Applications, Boston, Martinus Nijhoff, p. 21-37.
ANTONUCCI, T. C. (1994), “A life-span view of women's social relations”, in B. F. Turner and L. E. Troll, eds., Women Growing Older, Thousand Oaks CA, Sage Pub-lications, p. 239-269.
ANTONUCCI, T. C., and AKIYAMA, H. (1987), “An examination of sex differences in social support among older men and women”, Sex Roles, vol. 17, p. 737-749.
ANTONUCCI, T. C., and JACKSON, J. S. (1987), “Social support, interpersonal efficacy, and health: A life course perspective”, in: L. L. Carstensen and A. Edelstein, eds., Handbook of Clinical Gerontology, New York, Pergamon Press, p. 291-311.
BANDURA, A. (1986), Social Foundations of Thought and Action, Englewood Cliffs, NJ, Prentice Hall.
BELLE, D. (1989), “Gender differences in children's social networks and supports”, in: D. Belle, ed., Children's Social Networks and Social Supports, New York, John Wiley and Sons, p. 173-188.
BERKMAN, L. F., and SYME, S. L. (1979), “Social networks, host resistance and mor-tality: A nine-year follow-up of Alameda County residents”, American Journal of Epidemiology, vol. 109, p. 186-204.
BRISCOE, M. (1982), “Sex differences in psychological well-being”, Psychological Medi-cine, Supplement 1, p. 1-46.
BRUGHA, T. S., BEBBINGTON, P. E., MACCARTHY, B., STURT, E., WYKES, T., and POTTER, J. (1990), “Gender, social support and recovery from depressive disor-ders: A prospective clinical study”, Psychological Medicine, vol. 20, p. 147-156.
COBB, S. (1976), “Social support as a moderator of life stress”, Psychosomatic Medicine, vol. 38, p. 300-314.
COHEN, S., and WILLS, T. A. (1985), “Stress, social support, and the buffering hy-pothesis”, Psychological Bulletin, vol. 98, p. 310-357.
FONDACARO, M. R., and MOOS, R. H. (1987), “Social support and coping: A longi-tudinal analysis”, American Journal of Community Psychology, vol. 15, p. 653-673.

R. FUHRER – S. A. STANSFELD 404
FUHRER, R., STANSFELD, S. A., CHEMALI, J., and SHIPLEY, M. J. (1999), “Gender, social relations and mental health: Prospective findings from an occupational co-hort (Whitehall II Study)”, Social Science and Medicine, vol. 48, p. 77-87.
GOLDBERG, D. P. (1972), The Detection of Psychiatric Illness by Questionnaire, Oxford, Oxford University Press.
GOLDBERG, D., and BLACKWELL, B. (1970), “Psychiatric illness in general practice: A detailed study using a new method of case identification”, British Medical Journal, vol. 2, p. 439-443.
GORE, S., and MANGIONE, T. W. (1983), “Social roles and psychological distress: Additive and interactive models of sex differences”, Journal of Health and Social Be-havior, vol. 24, p. 300-312.
HOUSE, J. S., and KAHN, R. (1985), “Measures and concepts of social support”, in: S. Cohen and L. S. Syme, eds., Social Support and Health, New York, Academic Press, Inc., p. 83-108.
HOUSE, J. S., ROBBINS, C., and METZNER, H. L. (1982), “The association of social relationships and activities with mortality: Prospective evidence from the Tecum-seh Community Health study”, American Journal of Epidemiology, vol. 116, p. 123-140.
HOUSE, J. S., LANDIS, K. R., and UMBERSON, D. (1988), “Social relationships and health”, Science, vol. 241, p. 540-545.
HUGHES, M., and GOVE, W. R. (1981), “Living alone, social integration, and mental health”, American Journal of Sociology, vol. 87, p. 48-74.
IDLER, E. L., and BENYAMINI, Y. (1997), “Self-rated health and mortality: A review of twenty-seven communities”, Journal of Health and Social Behavior, vol. 38, p. 21-37.
KAHN, R. L., and ANTONUCCI, T. C. (1980), “Convoys over the life course : Attach-ment, roles, and social support”, in: P. B. Baltes and O. G. Brim Jr., eds., Life Span Development and Behavior, vol. 3, New York, Academic Press, p. 253-286.
KAPLAN, B. H., CASSEL, J. C., and GORE, S. (1977), “Social support and health”, Medical Care, vol. 15, p. 47-58.
KAPLAN, G. A., SALONEN, J. T., and COHEN, R. D. (1988), “Social connections and mortality from all causes and from cardiovascular disease: Prospective evidence from Eastern Finland”, American Journal of Epidemiology, vol. 128, p. 370-380.
KESSLER, R. C., MCLEOD, J. D., and WETHINGTON, E. (1985), “The costs of caring: A perspective on the relationship between sex and psychological distress”, in: I. G. Sarason and B. R. Sarason, eds., Social Support: Theory, Research and Applications, The Hague, Martinus Nijhoff, p. 491-506.
KNIPSCHEER, K. C. P. M., and ANTONUCCI, T. C. (1990), Social Network Research: Substantive Issues and Methodological Questions, Amsterdam, Swets and Zeitlinger.
LIN, N., SIMEONE, R. S., ENSEL, W. M., and KUO, W. (1979), “Social support, stress-ful life events, and illness: A model and an empirical test”, Journal of Health and So-cial Behavior, vol. 20, p. 108-119.
MARMOT, M. G., DAVEY SMITH, G., STANSFELD, S. A., PATEL, C., NORTH, F., HEAD, J., WHITE, I., BRUNNER, E. J., and FEENEY, A. (1991), “Health inequali-ties among British Civil Servants: the Whitehall II study”, Lancet, vol. 337, p. 1387-1393.

HOW GENDER AFFECTS PATTERNS OF SOCIAL RELATIONS… 405
MARTIKAINEN, P., STANSFELD, S., HEMINGWAY, H., and MARMOT, M. (1999), “De-terminants of socioeconomic differences in change in physical and mental func-tioning”, Social Science and Medicine, vol. 49, p. 499-507.
O'CONNOR, P., and BROWN, G. W. (1984), “Supportive relationships: fact or fancy?”, Journal of Social and Personal Relationships, vol. 1, p. 159-195.
ORTH-GOMER, K., and JOHNSON, J. V. (1987), “Social network interaction and mor-tality. A six year follow up study of a random sample of the Swedish population”, Journal of Chronic Diseases, vol. 40, p. 949-957.
PAYKEL, E. S. (1994), “Life events, social support and depression”, Acta Psychiatrica Scandinavica Supplement 377, p. 50-58.
PEARLIN, L. I., and JOHNSON, J. S. (1977), “Marital status, life strains and depres-sion”, American Sociological Review, vol. 42, p. 704-715.
ROOK, K. (1990), “Parallels in the study of social support and social strain”, Journal of Social and Clinical Psychology, vol. 9, p. 118-132.
SAS (1990), SAS/SAT User's Guide, Cary, NC, SAS Institute. SCHOENBACH, V. J., KAPLAN, B. H., FREDMAN, L., and KLEINBAUM, D. G. (1986),
“Social ties and mortality in Evans County, Georgia”, American Journal of Epidemi-ology, vol. 123, p. 577-591.
SCHUSTER, T. L., KESSLER, R. C., and ASELTINE, R. H. (1990), “Supportive interac-tions, negative interactions and depressed mood”, American Journal of Community Psychology, vol. 18, p. 423-438.
SEEMAN, T. E., and BERKMAN, L. F. (1988), “Structural characteristics of social net-works and their relationship with social support in the elderly: Who provides support”, Social Science and Medicine, vol. 26, p. 737-749.
SHUMAKER, S. A., and HILL, D. R. (1991), “Gender differences in social support and physical health”, Health Psychology, vol. 10, p. 102-111.
STANSFELD, S. A., and MARMOT, M. G. (1992), “Deriving a survey measure of social support: The reliability and validity of the Close Persons Questionnaire”, Social Science and Medicine, vol. 35, p. 1027-1035.
STANSFELD, S. A., BOSMA, H., HEMINGWAY, H., and MARMOT, M. G. (1998a), “Psy-chosocial work characteristics and social support as predictors of SF-36 function-ing: The Whitehall II study”, Psychosomatic Medicine, vol. 60, p. 247-255.
STANSFELD, S. A., FUHRER, R., and SHIPLEY, M. J. (1998b), “Types of social support as predictors of psychiatric morbidity in a cohort of British Civil Servants. (Whitehall II Study)”, Psychological Medicine, vol. 28, p. 881-892.
WELIN, L., SVARDSUDD, K., ANDER-PECIVA, S., TIBBLIN, G., TIBBLIN, B., LARSSON, B., and WILHELMSEN, L. (1985), “Prospective study of social influences on mor-tality. The study of men born in 1913 and 1923”, Lancet, no 1, p. 915-918.
WILLIAMS, A. W., WARE, J. E., and DONALD, C. A. (1981), “A model of mental health, life events and social supports applicable to general populations”, Journal of Health and Social Behavior, vol. 22, p. 324-336.
WYKE, S., and FORD, G. (1992), “Competing explanations for associations between marital status and health”, Social Science and Medicine, vol. 34, p. 523-532.