how domain experts create conceptual diagrams and...
TRANSCRIPT

How Domain Experts Create Conceptual Diagrams andImplications for Tool Design
Dor Ma’ayan* 1,2 Wode Ni* 2 Katherine Ye2 Chinmay Kulkarni2 Joshua Sunshine2
1Technion - Israel Institute of TechnologyHaifa, Israel
2Carnegie Mellon UniversityPittsburgh, PA
woden, kqy, chinmayk, [email protected]
Common secret
= =
Secret colours
+ +
(assumethat mixture separation
is expensive)
Public transport
= =
Secret colours
+ +
Common paint
Alice Bob
Figure 1. Diagrams explain concepts visually in many domains, e.g.: (a) Diffie-Hellman key exchange with colors representing prime multiplication [82].(b) Linking two views of the Klein 4-group [84]. (c) Unrolling a recurrent LSTM network [58]. (d) Natural numbers as 2D areas in a visual proof [28].
ABSTRACTConceptual diagrams are used extensively to understand ab-stract relationships, explain complex ideas, and solve difficultproblems. To illustrate concepts effectively, experts find ap-propriate visual representations and translate concepts intoconcrete shapes. This translation step is not supported explic-itly by current diagramming tools. This paper investigates howdomain experts create conceptual diagrams via semi-structuredinterviews with 18 participants from diverse backgrounds. Ourparticipants create, adapt, and reuse visual representations us-ing both sketches and digital tools. However, they had troubleusing current diagramming tools to transition from sketchesand reuse components from earlier diagrams. Our participantsalso expressed frustration with the slow feedback cycles and
*Authors contributed equally and names are in alphabetical order.
Permission to make digital or hard copies of all or part of this work for personal orclassroom use is granted without fee provided that copies are not made or distributedfor profit or commercial advantage and that copies bear this notice and the full citationon the first page. Copyrights for components of this work owned by others than ACMmust be honored. Abstracting with credit is permitted. To copy otherwise, or republish,to post on servers or to redistribute to lists, requires prior specific permission and/or afee. Request permissions from [email protected] ’20, April 25–30, 2020, Honolulu, HI, USA.© 2020 Association of Computing Machinery.ACM ISBN 978-1-4503-6708-0/20/04 ...$15.00.http://dx.doi.org/10.1145/3313831.3376253
barriers to automation of their tools. Based on these results, wesuggest four opportunities of diagramming tools—explorationsupport, representation salience, live engagement, and vocab-ulary correspondence—that together enable a natural dia-gramming experience. Finally, we discuss possibilities toleverage recent research advances to develop natural diagram-ming tools.
Author KeywordsConceptual Diagramming; Diagram Authoring; InformationVisualization
INTRODUCTIONVisual representations of knowledge allow us to under-stand and disseminate information more effectively than textalone [49]. This paper focuses on conceptual diagrams,which communicate conceptual, procedural, and metacogni-tive knowledge [41] in visual form.
Conceptual diagrams (sometimes also called explanatory di-agrams or concept visualization [1]), provide a graphicaloverview of conceptual models—the relationship between con-crete and abstract entities [29]. By giving abstract conceptsvisual representations, these diagrams help explain concepts
CHI 2020 Paper CHI 2020, April 25–30, 2020, Honolulu, HI, USA
Paper 126 Page 1

to oneself and communicate them with others. Explaining con-cepts using visuals is profoundly important for disseminationof scientific knowledge and for learning. For instance, theuse of diagrams in a scientific publication positively correlateswith higher scientific impact [45]. Further, creating diagramsimproves learning, both when diagrams are created for oth-ers [13], and when they are created for self-explanation [4].
While conceptual diagramming is clearly an important form ofknowledge work, unfortunately, tools for creating conceptualdiagrams are still limited. Current tools for diagramming ofconceptual, procedural, and metacognitive knowledge [41]stand in tension between: a) General-purpose drawing toolssuch as Illustrator and Figma that offer simple pen-and-canvasor box-and-arrow metaphors, but are viscous [24]—users mustconstantly commit to exact positions, sizes, and styling ofshapes. b) Dedicated diagramming tools such as Lucidchartand Gliffy that allow rapid changes, but rely heavily on tem-plates, limiting diagrammers to a fixed set of visual represen-tations.
This paper argues that this relatively limited support for dia-gramming in tools is in part because the process of diagram-ming is poorly understood. For instance, often diagrammersstart with informal media such as paper or whiteboards, andedit diagrams digitally before they are presented, but how dodiagrammers manage the evolution of diagrams? How do dia-grammers utilize the strengths and cope with the limitationsof their tools? Which tools are chosen for what purposes?Such a detailed understanding of the process can help designinteractive tools to support diagramming.
This paper contributes a description of the process of creatingconceptual diagrams, the difficulties people face while dia-gramming, and opportunities for tool design. These findingsare based on interviews with 18 domain experts from a widevariety of disciplines such as math, computer science, architec-ture, and education. Our interviews reveal that diagrammershave diverse interactions with visual representations in bothphysical sketches and digital tools, including finding, creating,storing, and reusing representations. When diagrammers tran-sition from sketches to digital tools, their tool selections areinfluenced by their sense of control over object placement anddiagram layout. Participants were concerned with two kindsof control: local object placement, and global diagram layout.Current tools, both those that use programming languages (PL)and those that use direct manipulation (DM) as their interac-tive metaphor trade-off one kind of control to support the othermore effectively. Consequently, we found that diagrammersinvented their own set of ad hoc and personal reuse patterns toiterate, simplify, and automate the diagramming workflow.
One implication of our results is the opportunity to designtools informed by the processes of diagramming, and practicesthat domain experts already use, making digital diagrammingmore intuitive and efficient. We identify four key opportunitiesfor natural [56] diagramming tools that allow diagrammersto express their ideas visually the same way they think aboutthem:• Exploration support: supporting exploratory behaviors such
as undo and backtracking during both abstract-level, breath-
first exploration of the design space and low-level refine-ments of visual details.
• Representation salience: allowing explicit creation and man-agement of visual representations, i.e. the mappings fromdomain constructs to shapes instead of geometric primitivesthemselves.
• Live engagement: providing diagrammers with the senseof agency by designing for liveness and directness of thediagramming experience.
• Vocabulary correspondence: enabling diagrammers to inter-act with their diagrams using vocabularies that is conven-tional in their domain.
For each of the opportunities, we survey existing techniquesfrom relevant areas to provide tool designers with technicalinsights on how it might be implemented.
BACKGROUND & RELATED WORKThis section provides background on three areas of relatedwork that informed our research: research on the theory be-hind conceptual diagrams, existing tools for visualization, andempirical research on diagramming-related activities. Relatedwork that is directly relevant to the implications of our workis described in the Implications section.
Conceptual diagrams and their benefitsConceptual diagrams differ from data visualizations, whichare visual representations of concrete and factual, rather thanconceptual, information. Data visualization techniques enablepeople to understand how quantities relate to each other andgain valuable factual knowledge about the world. Ervin [19]distinguishes between pictorial and propositional graphics:instead of directly depicting data, diagrams (propositionalgraphics in Ervin’s terms) constitute knowledge and embodymedia-independent abstractions for inference-making [44]. Inaddition to knowledge representation, conceptual diagramsare also a medium for creativity and exploration, since they donot require early commitments to design decisions and focuson the form of possible solutions [14].
Diagrams have been shown to have cognitive benefits to rea-soning and problem solving [44, 40, 48]. Compared to textualrepresentations, diagrams facilitate fast recognition and directinference by making the most relevant information explicitand easily findable [44]. As an external representation of ab-stract structures of tasks, diagrams can work together withone’s mental representation and are an indispensable part foraccomplishing distributed cognitive tasks [86]. Hegarty andKozhevnikov [30] distinguish between pictorial and schematicvisual representations and show that schematic representationsof relative spatial relationships significantly outperform picto-rial ones that encode visual appearances.
In addition to their values as an external, static representationof knowledge, diagrams are also beneficial when people learnwith, instead of from them [75]. In educational contexts, ex-plicit training of drawing, including the creation of new visualrepresentations and adoption of new ones, significantly im-prove students’ ability to work with multiple representationsand improve learning, reasoning, and communication skills [2].
CHI 2020 Paper CHI 2020, April 25–30, 2020, Honolulu, HI, USA
Paper 126 Page 2
Moreover, creating diagrams as visual explanations also im-proves learning, since they can act as a check for completenessand a medium for inference [5]. In general, people do not needformal training in visual design to create and interpret effectivediagrams and learners at all levels can benefit tremendouslyfrom creating diagrams [66].
Bill Thurston famously wrote "people have very powerfulfacilities for taking in information visually... On the other hand,they do not have a very good built-in facility for inverse vision,that is, turning an internal spatial understanding back into atwo-dimensional image [74]." In our study, we investigate howdomain experts transform high-level concepts to diagrams.
Existing designs of diagramming toolsAlthough many diagramming tools support both text-basedand graphical interfaces, we categorize current diagrammingtools by their dominant mode of interaction: programming-language based (PL) tools and direct manipulation (DM) tools.
We use PL tools to refer to text-based diagramming tools, in-cluding imperative or declarative programming languages,libraries, frameworks, and embedded domain-specific lan-guages. General-purpose tools such as Processing [61], Asym-tote [7], PGF/TikZ, and Paper.js 1 provide program constructsthat model graphical primitives and operations akin to thosein Scalable Vector Graphics (SVG) [83]. Many of their shareddisadvantages are well summarized in TikZ’s manual [73]:“steep learning curve, no WYSIWYG, small changes require along recompilation time, and the code does not really “show”how things will look like.” Domain-specific tools allow di-agram specifications that are higher-level and specialized tothe problem domain to smoothen the learning curve. They aredeveloped either from scratch (e.g. GraphViz and the DOTlanguage for graph visualization [17]) or on top of general-purpose tools (e.g. TikZ’s extensions, tkz-euclide for Eu-clidean geometry). However, many of them still inherit theother disadvantages from above.
DM tools represent interactive diagramming tools that sup-port WYSIWYG interfaces and direct interaction with shapes.Akin to PL tools, general-purpose DM tools such as AdobeIllustrator, Inkscape, and Figma also have similar sets of prim-itives, but often provide a large number of widgets or drawingtools (e.g. Illustrator CC has nearly 100 built-in tools 2). Toovercome the disadvantage of their highly manual interactionmodel, both Illustrator and Inkscape provide language bind-ings or command-line tools for automation, but they still sufferfrom the above problems of PL tools. Popular domain-specificdiagramming tools such as draw.io and Gliffy are templateeditors that provide predefined, mostly box-and-arrow styleshapes, limiting users to a narrow set of diagrams. Researchprototypes such as Sketchpad [70] and ThingLab [6] auto-mate diagram layout using constraint solving, but many editactions like selection and shape construction remain manual.Other prototypes like Apparatus 3 and Bret Victor’s dynamic
1http://paperjs.org/
2https://helpx.adobe.com/illustrator/user-guide.html
3http://aprt.us/
visualization tool [9] incorporate some limited programmaticoperations (e.g. macro recording, variable declaration, andcomputed properties) via direct interactions.
As discussed by Satyanarayan et al. in [65], data visualizationtools have transformed over the past decade. The major ad-vances are characterized by three “waves”: (1) improvementof individual charts’ quality, (2) theories and tools that enablemass-production of visualizations, and (3) the convergence oftools [15]. Whereas the benefits of conceptual diagrams areclear and theoretical foundations exist, most of the diagram-ming tools are still not easily scalable and there are large gapsin existing technologies, notably between PL and DM tools. Inother words, the 2nd wave of conceptual diagramming is stillnot here. In this paper, we aim to gain a deep understandingof people’s diagramming process to drive the design of toolsthat fill these gaps.
Empirical studies on diagramming-related activitiesAlthough conceptual diagrams are widely studied as a pow-erful visual representation in multiple domains, there has notbeen a significant amount of prior work that focuses on the au-thoring of conceptual diagrams, especially with digital tools.
However, prior work in related activities such as note-takingand whiteboarding suggests some insights for both understand-ing these activities and opportunities for tool design. Stud-ies on sketches in STEM [80] and software engineering [11]suggest a need for automating the process of sketching andpreserving transient sketches such as whiteboard drawingswith appropriate tools. In similar activities such as annotatingdocuments, personal annotations undergo dramatic changessuch as significant substantiation and clarification when theyare shared on public platforms [47]. Digitization of the analogpen-and-paper interface attempts to make the transformationprocess smoother. While digital ink tools imitate the pen-and-paper experience and provide more versatility and power, therestill exist gaps between the manual and digital experience ofsketching due to conflicting affordances of analog pen anddigital ink [64].
Given the lack on the prior work on this topic, this paper di-rectly investigates the process of creating conceptual diagramsusing digital tools.
METHOD
Participants and recruitmentWe conducted interviews with 18 participants (13 male, 5female). Participants were recruited through posts on socialmedia, and our research group website. Of these, four par-ticipants were university faculty, 10 were PhD students orpostdocs, one was a professional masters student, one was aK-12 math instructor, one is an independent software devel-oper, and one is an enterprise software engineer. Prospectiveparticipants filled out a survey which allowed us to screenparticipants for our interviews. We selected the intervieweesbased on the following criteria: the interviewee (1) createsconceptual diagrams on a frequent basis and (2) uses digitaldiagramming tools to create these diagrams.
CHI 2020 Paper CHI 2020, April 25–30, 2020, Honolulu, HI, USA
Paper 126 Page 3

Domain Participant
Abstract algebra P1, P17Category theory P4Discrete mathematics P14Computer graphics P16, P6, P10, P3Algorithms P12Topology P7Human-computer interaction P13, P18Programming language theory P11Software engineering P9, P2User interface design P5Architecture P8K-12 education P15
Table 1. Interview participants’ primary domains
Because we had more potential interviewees than we origi-nally envisioned (64 in all), we used a saturation method [3] todetermine the number of participants. We conducted severalbatches of interviews (with 2-3 interviews per batch consistingof diverse participants), and did a preliminary analysis of thetranscripts from each batch. When the analysis stopped reveal-ing new insights, we stopped interviewing more participants.
Semi-structured interviewsInterviews lasted between 30 and 80 minutes and were semi-structured. Interviews were conducted either in person (7participants) or online using Skype (11 participants.) Weencouraged participants to bring any digital and hand drawndiagrams that they had previously created that they could sharewith us. We also encouraged them to have a pen and paper (ora whiteboard) available to draw during the interview.
Four of the authors are involved in the development of PEN-ROSE [57, 84], a new diagramming tool. Our initial interviewquestions were developed to inform PENROSE’s design. Thefocus of the interview eventually broadened to participants’past experience diagramming (using the critical incident tech-nique [21]), tool preferences, and reuse practices. The fullinterview protocol is included as supplementary material. Ex-ample questions from our script are: (e.g. “What is the lastdiagram you made?” and “What is the diagram you are mostproud of?”), accompanied by appropriate follow-up questionsand requests for participants to share diagrams under discus-sion. Table 1 includes all the participants categorized by theprimary focus of their work.
AnalysisInterviews were video recorded and transcribed using eitherhuman or machine transcription. The first two authors thenmanually validated and corrected any transcription errors.
We employed thematic analysis methods [8] to analyze inter-view transcripts. The first two authors began by conductingan open coding session and discussed initial insights for ev-ery batch of interviews. Then, following all interviews, theauthors discussed the codes and created a coding guide withoperationalized definitions of codes. Using the agreed coding
Figure 2. A good visual representation (b) of forces on a truck (a) iseasily understandable, whereas (c) loses essential information and (d) isnon-standard and harder to understand.
guide, one of the authors did a second phase of coding. Whileconducting the second coding phase, the author also summa-rized the transcripts using sticky notes containing highlightsof the interview sessions. All authors then reviewed both thecodebook with the sticky notes to further refine the set ofcodes.
Finally, the authors analyzed the codes by clustering lower-level codes during multiple interactive discussion sessions.Through the higher-level clusters, a few themes with highnumbers of codes emerged, such as Reuse and Representation.We present these themes and the resulting insights next.
RESULTSIn this section, we present the results from our analysis ofthe interview data. The section is organized in terms of thehigh-level themes that emerged from our analysis.
Representation findingWhen illustrating a concept visually, a crucial step is to decidehow every abstract object will be represented graphically. Forexample, Larkin and Simon, in their classic paper “Why aDiagram is (Sometimes) Worth Ten Thousand Words,” choseto represent forces with arrows in the diagram shown in Fig-ure 2b [44]. This step, which we call representation finding,is crucial to diagram effectiveness. If Larkin and Simon hadrepresented forces using concentric circles with different radiiinstead of arrows (Figure 2c), the directionality of the forceswould be lost. If they had represented forces with chocolatebars with different lengths (Figure 2d), the diagram wouldhave been inconsistent with other physics diagrams and theextraneous detail would have distracted from the core purpose.
This process of representation finding usually preceded thecreation of any formal or informal diagrams. Participantsengaged in two representation finding activities: (1) seekingand finding existing representations from prior work and (2)creating novel representations.
Diagrammers seek existing representations from prior workIn many domains, there are well-established visual represen-tations for abstract concepts and objects. Therefore, diagram-
CHI 2020 Paper CHI 2020, April 25–30, 2020, Honolulu, HI, USA
Paper 126 Page 4

mers tended to look at existing diagrams for representationswhen starting to create their representations:
“Sometimes I look for inspiration in other papers just toknow what kinds of standard people are using. Sometimesthere are some conventions that people actually use in myfield like how to represent a camera for instance. So youkind of have to stick with these conventions.” (P3)
Diagrammers generate new representations to tell new storiesOther domains lack standardized representations and diagram-mers creatively generate their own representations:
“The whole purpose of those diagrams [in my book] is tomake something that has never been seen before visuallyobvious... Why didn’t anybody draw that picture before? Ihave been taking something that almost seems completelyconfusing or unimportant and having a picture that makesyou know what’s going on... is truly satisfying.” (P1)
When creating diagrams for explanatory purposes, diagram-mers also carefully craft visual representations to ensure thatthe diagram is intuitive and clear for their target audience. Forinstance, P8 developed new representations to reduce visualcomplexity:
“When a diagram has too many working elements, it be-comes too hard for your brain to process it. If you can boilit down to two main things interacting, that will make thediagram much more intuitive to someone. It’s very muchabout choosing the right colors, lines... putting the empha-sis in the right place.” (P8)
Diagrammers use sketches to discover appropriate represen-
tationsSketching plays an important role in generating new visualrepresentations or choosing among existing ones. For instance,P8, P12, P5, P9, and P13 reported iterative processes of refin-ing their visual representations as they sketch. For instance, P9described the evolution of diagram sketches and the changesof visual representations of the design of a complex camera-supporter-projector system, also shown in Figure 3:
“At this stage, I don’t even know how these machines wouldbe connected, so there’s lines, but at this later stage I wasactually thinking about ‘Oh, how are we going to representthese things and compute with them in practice?’ So I didarrows. There’s also certainly increased complexity in thebeginning thing, I’m just looking at the situation of a singlecamera projectors supporters system. Then here on thenext page I’m starting to look at different configurations ofmultiple cameras and projectors.” (P9)
Choosing the right toolsWhen participants eventually chose to move to a digi-tal medium, their choice of tool was systematic, if notconscious. Specifically, we found participants’ preferredeither programming-language based (PL) tools or direct-manipulation based (DM) ones. Below, we analyze the reasonsfor their preferences.
People choose DM tools for faster feedback and global controlDM tools were often described as “easier” and thus havelower barriers to entry when compared with PL tools. Oneparticularly common reason for choosing DM tools was theneed to place shapes in relations with other shapes, which isdifficult to do without immediate visual feedback.
“So I like [a DM tool] because it gives me this very fine con-trol over how things are aligned and when they’re straightup and down.” (P2)
Because of the synchronized visual preview, DM tools providebetter support for global control over diagram layout, i.e. therelationships among graphical primitives. Diagrammers usedDM tools similar to how they used pen and paper, to offloadtheir working memory [44], but with the additional benefitsprovided by interactions supported by the tools:
“I’m trying to draw things down on the papers [or DM tools]because my head is getting crowded and I need to be ableto keep track of everything on [digital] paper and be ableto interact with it the same way I would in my head.” (P7)
People choose programming languages for better abstraction
and local controlComparing to the easy global control provided by DM tools,PL tools make local control easier: they let users control localplacements of shapes by specifying exact pixel coordinates:
“I want this [a shape] to be exactly a hundred pixels... be-cause there’s definitely times where I want to get this rightto this point and it’s hard to do that with the mouse.” (P15)
Global layout of diagrams can be specified more preciselyusing PL tools, but requires more advanced programmingskills and, as discussed, more time commitment:
“If it’s something where the relationships among the thingsyou want to specify in a precise way, then it’s a lot easier,if you know how to program, to introduce a programminglanguage where you can specify exactly the relationshipsyou want, how you want them to change, and so forth.” (P1)
Programming languages provide affordances to create abstrac-tions and automate the diagramming process:
“Once you have made a visualization [using PL tools], ifyou want to tweak things about it, you can. Just put whatyou do into a script, add some parameters, and you couldrepeatedly get the same visualization with variations... Itwill generate the thing automatically, you don’t have tocreate a whole picture by hand again.” (P1)
The complexity of languages, however, incurs a higher up-front cost and steep learning curve, making more diagram-mers without programming background reluctant to commit tothem. Another downside of PL tools is that they often requirecompile-and-run cycles and hence delayed feedback:
“There’s a long learning curve on [a PL tool] and thenit’s slow. It’s a lot of typing and a lot of iterative–‘I typesomething and I see what it looks like’. So there’s a lot ofdelays in modifying [the diagram].” (P15)
CHI 2020 Paper CHI 2020, April 25–30, 2020, Honolulu, HI, USA
Paper 126 Page 5

(a) An initial sketch represents connectivity as line segments. (b) A later sketch represent connectivity as arrows.
Figure 3. P9 made sketches to explain projector and camera calibration. The complexity of these sketches increased and visual representations evolveover time.
“I’m willing to put in the effort, but it’s like 20% of the time isthat, and like 80% of the time is fighting with LATEX.” (P11)
Advanced diagrammers use PL tools to automate their dia-
gramming workflowsIn some cases, diagrammers find the need to create familiesof similar diagrams for the use of, for instance, writing a text-book or a problem set. A small number of our intervieweesautomated their diagramming workflow extensively by lever-aging the abstraction affordances of PL tools. One automationpattern is to parameterize complex diagrams and generate mul-tiple instances with variations to explore design alternativesand populate diagram collections:
“If I invest the time upfront to just write it, parameterizedby, and then I do the diagram in terms of n and k. And thenlater I realize that, ‘Aw, n = 15 and k = 4 is just a mess!’Okay, I go to the top of the file and I set n = 12 and k = 3and I re-render it and it looks like this, and I go, ‘That’swhat I want.’ If I’m not sure, okay, let’s try n = 10, try that.You can just make a new diagram in 15 seconds instead offour hours, but they also demand more time and skills upfront. If I’m just going to do one diagram, it’s not worth it.”(P1)
Another pattern is creating ad hoc, embedded domain-specificlanguages that allow specification of diagrams at a higherlevel:
“I have learned a style that is highly idiomatic and notsomething that I could teach someone else... you look at thesort of syntactic objects that you’re going to work with in acertain proof theory, and you define the macros at the toplevel.” (P11)
As commented by P1 and P11 above, the automation requiresa high upfront cost and advanced skill sets, and only advanceddiagrammers invested in the skills and time commitment to doso.
Reusing elements from earlier diagrams
Diagrammers backtrack frequently and informally track prior
versionsDiagrammers were iterative even in the formal diagrammingstage, which involves frequent backtracking behaviors. There-fore, keeping track of version history becomes an essentialtask for diagrammers.
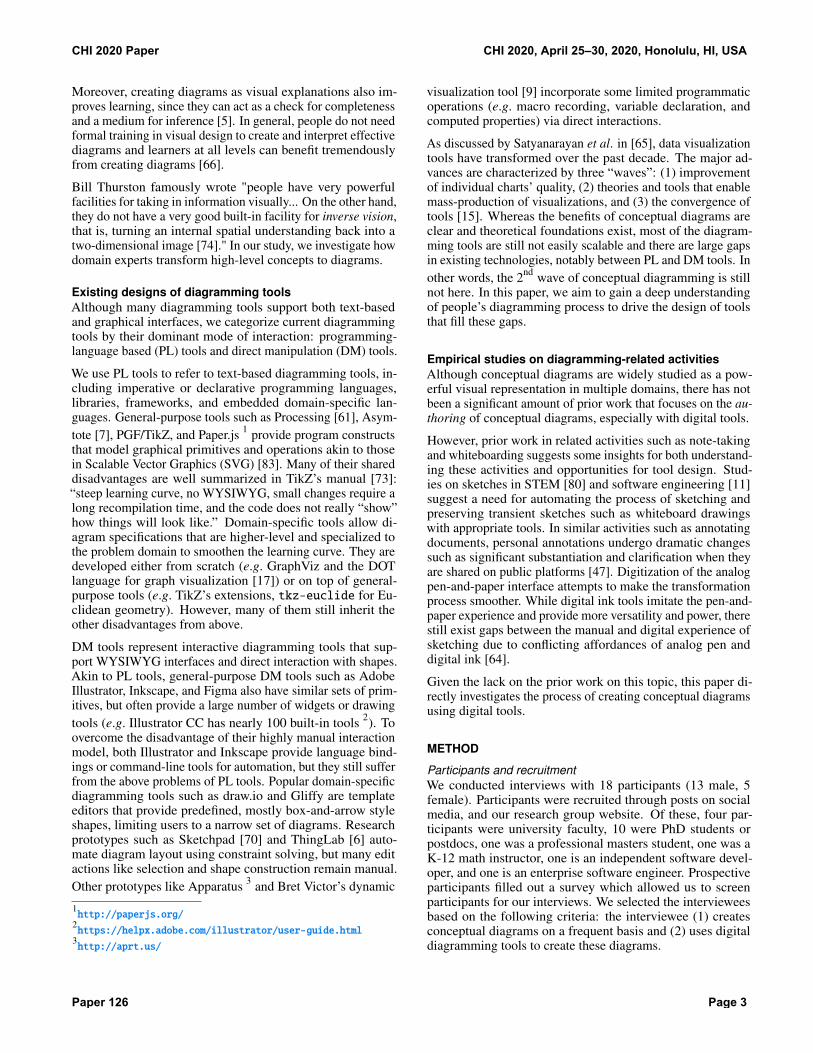
In the case of DM tools, however, versioning can be challeng-ing in many existing tools, due to the lack of textual storageformats. As a result, ad hoc solutions are again created to com-pensate for this limitation such as keeping multiple versionsof the diagram on the same canvas, as illustrated in Figure 4and described by P5:
“I ... duplicate each [art board], change something aboutthat, and take it out again. That’s really helpful not only topresent the overall trajectory of the process, but then youcan go back and reference a previous state without havingto look through the undo history and destroy all of yourredos. I [like to] branch out fractally with different areasthat are relevant to me.” (P5)
In theory, standard version control systems such as git [76]make it easy to track versions with PL tools. However, evenwith their textual file formats, versioning can still be challeng-ing for PL tools because textual representations of diagramscan be too low-level to be human readable. As a result, P6tracks prior versions without using standard version controlsystems:
“I rely either on Dropbox to store different images or I havemy own custom-made back-up system that keeps hard copiesof things... I have a separate script that every day pulls all ofmy folders and keeps copies of them if there is any change.”(P6)
Diagrammers organize reuse libraries by representationThe most common form of library we saw diagrammers main-tain was a “cheat sheet”. Cheat sheets are configuration filesthat contain low-level parameters such as line-weight settings
CHI 2020 Paper CHI 2020, April 25–30, 2020, Honolulu, HI, USA
Paper 126 Page 6
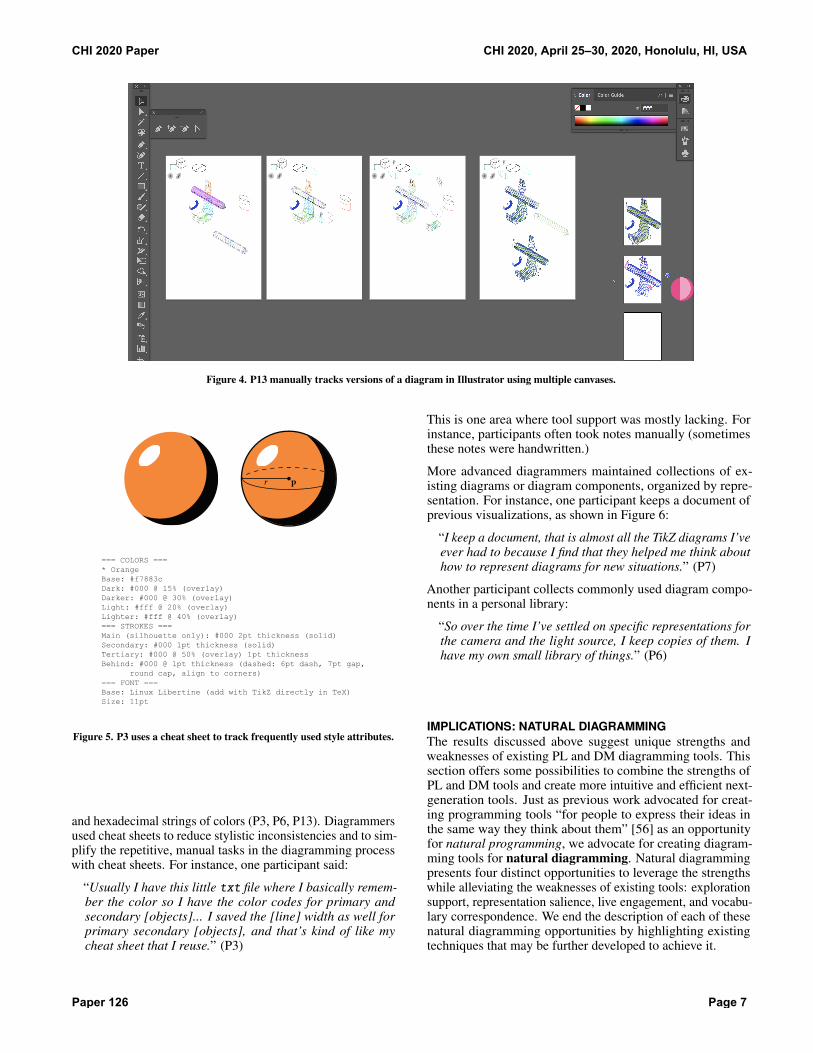
Figure 4. P13 manually tracks versions of a diagram in Illustrator using multiple canvases.
=== COLORS ===* OrangeBase: #f7883cDark: #000 @ 15% (overlay)Darker: #000 @ 30% (overlay)Light: #fff @ 20% (overlay)Lighter: #fff @ 40% (overlay)=== STROKES ===Main (silhouette only): #000 2pt thickness (solid)Secondary: #000 1pt thickness (solid)Tertiary: #000 @ 50% (overlay) 1pt thickness Behind: #000 @ 1pt thickness (dashed: 6pt dash, 7pt gap, round cap, align to corners)=== FONT ===Base: Linux Libertine (add with TikZ directly in TeX)Size: 11pt
r p
Figure 5. P3 uses a cheat sheet to track frequently used style attributes.
and hexadecimal strings of colors (P3, P6, P13). Diagrammersused cheat sheets to reduce stylistic inconsistencies and to sim-plify the repetitive, manual tasks in the diagramming processwith cheat sheets. For instance, one participant said:
“Usually I have this little txt file where I basically remem-ber the color so I have the color codes for primary andsecondary [objects]... I saved the [line] width as well forprimary secondary [objects], and that’s kind of like mycheat sheet that I reuse.” (P3)
This is one area where tool support was mostly lacking. Forinstance, participants often took notes manually (sometimesthese notes were handwritten.)
More advanced diagrammers maintained collections of ex-isting diagrams or diagram components, organized by repre-sentation. For instance, one participant keeps a document ofprevious visualizations, as shown in Figure 6:
“I keep a document, that is almost all the TikZ diagrams I’veever had to because I find that they helped me think abouthow to represent diagrams for new situations.” (P7)
Another participant collects commonly used diagram compo-nents in a personal library:
“So over the time I’ve settled on specific representations forthe camera and the light source, I keep copies of them. Ihave my own small library of things.” (P6)
IMPLICATIONS: NATURAL DIAGRAMMINGThe results discussed above suggest unique strengths andweaknesses of existing PL and DM diagramming tools. Thissection offers some possibilities to combine the strengths ofPL and DM tools and create more intuitive and efficient next-generation tools. Just as previous work advocated for creat-ing programming tools “for people to express their ideas inthe same way they think about them” [56] as an opportunityfor natural programming, we advocate for creating diagram-ming tools for natural diagramming. Natural diagrammingpresents four distinct opportunities to leverage the strengthswhile alleviating the weaknesses of existing tools: explorationsupport, representation salience, live engagement, and vocabu-lary correspondence. We end the description of each of thesenatural diagramming opportunities by highlighting existingtechniques that may be further developed to achieve it.
CHI 2020 Paper CHI 2020, April 25–30, 2020, Honolulu, HI, USA
Paper 126 Page 7

For any thrackle we can create a graph where the vertices represent theconvex sets and there is an edge between the vertices if the two convex setsintersect. For example:
Figure 1: A thrackle and its reverse graph color indicated W points
since ever convex set must intersect exactly once the ending reverse graphwill be the complete graph on m vertices, Km.
The intersection of convex sets is a symmetric relation and so any W pointwill be a sub-complete graph. Therefore the decomposition of the completegraph into sub-graphs is the number of W points which has to be larger thanthan m.
Figure 2: Examples of tight thrackles for Conjecture 0.1
x1
�6 �4 �2 0 2 4 6
A B A
A B A B
a1
23
4
56
M
F V
D
a1
a2
a3
p1 p2
5
4
7
8
3
5
a1
a2a3
p1 p2
p1
p2p3
2 2
2
q1
q2q3
1
11
1
1
2
2
3
3
4
4
5
5
1
1
2
2
3
3
4
4
5
5
6
6
n vol FG((4,3,2,1),n)(1) Graph Partition
5 107520 1 2 3 4 5 6
1
1
2
2
3
3
4
4
5
5
6 26580 1 2 3 4 5 6 7
1
1
2
2
3
3
4
4
5
5
6
6
7 15120 1 2 3 4 5 6 7 8
1
1
2
2
3
3
4
4
5
5
6
6
7
7
8 12600 1 2 3 4 5 6 7 8 9
1
1
2
2
3
3
4
4
5
5
6
6
7
7
8
8
9 12600 1 2 3 4 5 6 7 8 9 10
1
1
2
2
3
3
4
4
5
5
6
6
7
7
8
8
9
9
10 12600 1 2 3 4 5 6 7 8 9 10 11
1
1
2
2
3
3
4
4
5
5
6
6
7
7
8
8
9
9
10
10
pu
Figure 6. P7 organizes all previously made TikZ diagrams in a single document.
Exploration supportExploration pervades the diagramming process for makingconceptual diagrams, from choosing representation to deter-mining stylistic details. We characterize two types of ex-ploratory activities by adopting terms from Goel [23]: (a)Lateral transformations involve ideation and exploration atthe high-level to broaden the design space, e.g. finding theappropriate visual representation for forces in Figure 2. (b)Vertical transformations are more detailed refinements to apre-determined visual representation, such as deciding thearrowhead style in Figure 2b.
Sketching is an important, if not necessary, part of the designprocess [10]. Our participants produced physical sketches toexplore design alternatives before transitioning to digital tools,which are perceived as a medium of higher commitment. Theyperformed this type of exploration by looking at prior workand multiple alternatives laterally. Early informal sketchesnaturally affords lateral transformations [23].
Diagrammers also attempt to leverage precision, automation,and abstraction afforded by digital tools. After the visual rep-resentation stabilizes, they move to digital tools and refine thisdeterminate representation, i.e. vertically refine their design.Unfortunately, existing tools do not provide sufficient flexibil-ity to support even small vertical changes. Whereas DM toolsrequire significant manual efforts to propagate local changes,PL tools require a high upfront cost to create abstractions thatreduce future repetition. As a result, our participants describedvarious ad hoc workarounds to perform common activitiesfor exploration such as backtracking, versioning, and reuse inboth PL and DM tools.
In essence, a gap exists between drafting and crafting, a de-sign dilemma that has plagued other sketching tools (such asdigital pens) [64]. Solving this dilemma requires tools thatcontinuously support diagrammers to explore lateral and verti-cal changes, allowing more fluidity to make, track, and revertchanges.
One solution to the problem of exploration and change man-agement can be seen in tools for exploratory programming.Exploratory Programming (EP) characterizes a practice of ex-
perimenting and prototyping adopted by programmers acrossa wide range of domains [67, 39]. Data scientists reuse and it-erate on small snippets of scripts to analyze data exploratively.VARIOLITE [38] support local versioning with “variant boxes”around regions of code. Software engineers often backtrackby manually deleting or re-typing code when developing soft-ware [85]. Selective undo techniques allow complex backtrack-ing in code editing [54], which was also shown to be effectivefor painting applications [55].
Some systems also show opportunities for automatic verti-cal refinement. For instance, to support the transition fromfreehand sketches to final UI implementation, SILK recog-nizes hand-drawn shapes and translates them to real UI com-ponents [43]. DREAMSKETCH generates 3D models fromsketches [37]. Sketches for conceptual diagrams, however, canoften be intentionally ambiguous and unstructured, makingrecognition, beautification, and generation of reusable diagramcomponents challenging [71].
Finally, in addition to better support for history management,another approach may be to reduce unnecessary changesthrough improved abstractions. Program synthesis can be usedto generate reusable functions from examples of lower-level in-teractions with a potentially non-programmatic interface [27].SKETCH-N-SKETCH is a vector drawing tool with synchro-nized code and graphical views of the same drawing [31]. Itsynthesizes reusable functions from direct manipulation of ob-jects in the graphical view and thereby enables users to avoidrepetition. Ellis et al. [16] synthesize imperative programsfrom hand-drawn sketches. Currently, synthesizing high-levelabstractions and surfacing them in a non-obstructive, mean-ingful manner are still open problems for future conceptualdiagramming tools.
Representation salienceConstructing and interpreting representations are crucial skillsfor learning new concepts and developing domain expertise [2].Many of our participants track prior representations, curatereuse libraries, search for ones created by others, and inven-tively create new ones in their representation finding phase.This suggests an opportunity for natural diagramming tools
CHI 2020 Paper CHI 2020, April 25–30, 2020, Honolulu, HI, USA
Paper 126 Page 8

that support representation salience, treating visual represen-tations as first-class entities and providing operations to easilyinteract with them.
Bret Victor uses the analogy of climbing “up” (abstraction)and “down” (concretization) the ladder of abstraction to char-acterize the process of understanding complex systems usingvisual representations [78]. Abstraction and parametrizationof diagrams allows fast generation of families of similar dia-grams, which can be used in multiple places or serve as a setof design alternatives. In existing tools without easy accessto abstraction constructs, generating design alternatives canbe a time-consuming manual process. Our participants useexisting abstraction constructs such as macros and functions toencode representations, but they tend to be highly personalizedand brittle solutions. As a result, these custom abstractionsare rarely scalable or composable, as one frequent TikZ usersaid “macros are terrible, [I make macros that are] 20 or30 braces deep... it’s just hard to write and edit.” (P11) Inaddition, these poor abstractions still require significant timeinvestment and force diagrammers to concretize concepts man-ually instead. Consequently, diagrammers’ representationalencodings are scattered in manually curated personal libraries,online examples, and cheatsheets of lower-level elements.
For visual representation to be salient, both the underlyingstructures and mappings to visual elements need to be encodedin the diagramming system explicitly. Further, these encodingsmust be specified with manageable, scalable, and composableabstraction constructs that allow diagrammers to move “up”and “down” the ladder of abstraction easily.
The management of visual representations at different lev-els of abstraction can be seen in many fields. For instance,Gross [25] tackles the problem of the fixed low-level represen-tations of computer-aided design (CAD) tool by supportinggradual transition from sketches to more structured diagramsand suggesting concrete representations given early concep-tual sketches. Data visualization tools such as Dashiki [52]and Draco [53] can manage of multiple representations of theunderlying data.
The lack of representation salience often manifest in highlyviscous diagramming tools that operate on low-level prim-itives and lose deeper semantics of graphical components.To solve this problem in data visualization, the grammar ofgraphics [81] formalizes a rich set of operations to transformdata into visual components. For mathematical diagrams,PENROSE [57] includes two domain-specific languages thatdecouple visual representations from declaration of abstractobjects and encode visual representations by pattern-matchingon the objects and declaring visual elements. Apart fromthese domain-specific solutions above, however, conceptualdiagramming tools still lack a general and accessible approachto specify problem domains and the visual representationsthereof.
Live EngagementHutchins et al. introduce direct engagement, “the qualitativefeeling that one is directly engaged with control of the objects,”as an important criterion for effective interfaces [35]. Our
results show that direct engagement for diagramming can beperceived differently depending on the kinds of interfaces andthe sense of control they afford, i.e. the sense of agency overessential operations in conceptual diagramming [46]. DM tooldesign affords continuous representations of objects and imme-diate visibility of incremental changes [68]. As a result, theynaturally afford a sense of global control over the global rear-rangement of diagram layout. Yet, local control over precisespecification of visual properties and creation of high-levelabstractions is still challenging in direct-manipulation tools.On the other hand, while these same operations are directlysupported in PL tools, our participants reported frustrationwith their high latency and long compile-and-run cycles. Ourresults suggest immediate visual feedback (or liveness [72])is also essential for abstract operations. In other words, thesense of control and direct engagement is diffused among DMand PL tools.
Traditional direct manipulation interfaces can be augmentedby novel interaction and programming techniques such as pro-grammatic brushes [36], programming by example [26] andprogramming by manipulation [32]. Bidirectional program-ming [12] proposes to combine direct manipulation and textualprogramming by surfacing both direct manipulation and text-based interfaces and synchronizes and synchronizing changesin both directions: (i) from the program text to the output(liveness) and (ii) from the output to the program text (directengagement). These techniques, although currently limitedto narrower domains, provide promising directions towardsbridging the gap between PL and DM tools.
There have been also significant advances in programminglanguages to support liveness. Live programming techniquescan provide responsive and continuous feedback on programchanges. The methodology has been increasingly adoptedin computer science education, web development, and tradi-tional programming environments [50, 33, 62]. Tanimoto [72]proposes four levels of liveness with the top level featuring“stream-driven updates” and “informative, significant, respon-sive and live” visual representations of programs’ dynamicbehaviors. Techniques such as incremental compilation andtype inference [51] and typed holes [59] allow fast compi-lation and facilitate liveness of programming environments.However, many live programming systems only offer one-wayupdates from the program to its output visual representation,inhibiting the opportunities for direct interactions with thevisuals.
Vocabulary correspondenceConceptual diagrams are made of “abstract and topologi-cal” [20] shapes that are mapped from domain objects in thecontent model [63]. In Figure 2b, the concept of two counter-acting forces (domain objects) is mapped to two arrows, butthe exact styling and lengths of the arrows do not change themeaning of the diagram. As a result, users’ vocabularies forconceptual diagramming are often abstract, topological, anddomain-specific. Therefore, there is an opportunity for naturaldiagramming tools that support vocabulary correspondenceby having a grammar or an interface that directly maps tousers’ vocabulary for diagramming.
CHI 2020 Paper CHI 2020, April 25–30, 2020, Honolulu, HI, USA
Paper 126 Page 9

As shown in our results, diagrammers define new abstractionsto both automate and naturalize their diagramming process.More advanced diagrammers create abstractions to quicklygenerate new diagram instances and fit their mental models,but, even for advanced diagrammers, abstractions are brittleand often not share-able, due to the lack of tool support. Inaddition, many participants described diagrams in terms ofrelative, high-level relationships such as “smaller”/“bigger”and “overlaping”/“non-overlapping”. But the tools they usetend to operate on absolute units and do not provide supportfor specifying such relationships. One participant shared avision of an ideal tool:
“The best tool... would have fairly high level primitives. Imight say ‘Okay, I want it to be symmetric in this way. Iwant this thing always to be attached to that.’ I want to beable to define my own higher level primitives.” (P2)
In other words, large semantic and articulatory distances [35]still exist between interaction metaphors and diagrammers’vocabulary, creating an opportunity improve the closenessof mapping [24] while maintaining users’ control and theexpressiveness of diagramming tools.
One opportunity to do so is allow users to introduce their ownvocabulary to the tool, for instance, through domain-specificlanguages (DSL). DSLs provide focused expressive powerwithin specific problem domains at the cost of generality [77].For instance, domain-specific diagramming systems such asGraphViz allow succinct, high-level specification of diagramsand leverage domain knowledge to solve for diagram layoutsalgorithmically [17]. So far, DSLs have been most useful areassuch as graph visualization, but they may prove to be usefulelsewhere too. To allow end-users to introduce their ownDSLs, language workbenches may be a viable implementationroute. These workbenches allow efficient definition, reuse, andcomposition of DSLs [18], but much work remains, as existinglanguage workbenches such as MPS [79] are still complex tolearn for end-users like many of our participants.
Another way to model abstract and topological relationshipsis using high-level constraints, an idea that has existed sincethe invention of SketchPad [70]. Constraint-based systems areextensively used in Computer-Aided Design (CAD) tools [69].CAD users commonly use constraints in parametric drawing,exploring different configurations of complex shapes. Au-tomatic formatting of documents, digital drawings, and webpages are often modeled as constraints and can be optimized bysolvers [34, 60]. To further simplify the process of constraintspecification, some systems allow visual interactions with con-straints [32, 22] while others intelligently infer constraints byexamples [42]. By offloading the burden of low-level specifi-cation to constraint solvers, diagrammers often lose control ofdiagram elements, which poses usability challenges to futurediagramming tools.
CONCLUSION AND FUTURE WORKConceptual diagrams are essential for understanding concepts,communicating ideas, and improving instructions effectivelyin many fields. This paper provides the first empirical studyof how domain experts create conceptual diagrams.
Our results demonstrate representation finding as a vital step inthe diagramming process and the role that sketches play in thisstep. However, due to limitations of current tools, notably thetrade-offs between direct manipulation tools and programminglanguages, reusing representations is still challenging. As aresult, diagrammers creatively circumvent these limitationsby employing a set of ad hoc techniques to reuse diagramcomponents and to scale up diagram production.
Based on our results, we introduce the concept of natural di-agramming and four opportunities for natural diagrammingsupport: exploration support, representation salience, live en-gagement, and vocabulary correspondence. For each of them,we discussed how recent advances from various research com-munities can help improve existing tools and design futuretools.
Future work can leverage the substantial amount of conceptualdiagrams that exist in the wild and perform large-scale analysisto gain a more quantitative understanding of existing diagrams.Similarly, it is possible to leverage the large number of currentdiagramming tools, some of which support a subset of natu-ral diagramming. In particular, it may be possible to isolateand quantify the benefits of each opportunity of natural dia-gramming introduced in this paper by analysing existing tools.A deeper, more systematic analysis of the relationships andtrade-offs among the four natural diagramming opportunitiesmay further inform tool designers to make design decisionsmore critically. Further, this study does not focus on collabo-ration support for conceptual diagramming. Future work mayexplore how to support, for instance, vocabulary correspon-dence when multiple diagrammers from diverse backgroundscollaborate on a single conceptual diagram.
Natural diagramming embodies our vision for future diagram-ming tools—tools that seamlessly and naturally translate di-agrammers’ high-level ideas to beautiful and illustrative dia-grams. This paper advances this goal by articulating a concretevision for systems designers to create more effective diagram-ming tools.
ACKNOWLEDGMENTSThe questions raised in this study were inspired by manydiscussions with the Penrose team, especially with KeenanCrane and Jonathan Aldrich. We thank our participants fortheir helpful insight and for being willing to share their visu-alization work. We greatly appreciate Robert Ochshorn andReduct for transcribing our interviews. We also thank BradMyers, Michael Hilton, Mary Beth Kery, Adam Perer, SarahChasins, and Tatiana Vlahovic for their helpful feedback onour work. This material is based on work supported by the Na-tional Science Foundation under awards #1560137, #1852260,#1910264, and by the U.S. Department of Defense. Any opin-ions, findings, and conclusions or recommendations expressedin this material are those of the authors and do not necessarilyreflect the views of the funders.
REFERENCES[1] 2019. Gallary of Concept Visualization.
http://conceptviz.github.io/. (2019). Accessed:2019-09-18.
CHI 2020 Paper CHI 2020, April 25–30, 2020, Honolulu, HI, USA
Paper 126 Page 10

[2] Shaaron Ainsworth, Vaughan Prain, and Russell Tytler.2011. Drawing to learn in science. Science 333, 6046(2011), 1096–1097.
[3] H Russell Bernard and Harvey Russell Bernard. 2013.Social research methods: Qualitative and quantitativeapproaches. Sage.
[4] Eliza Bobek and Barbara Tversky. 2016a. Creatingvisual explanations improves learning. CognitiveResearch: Principles and Implications 1, 1 (2016), 27.
[5] Eliza Bobek and Barbara Tversky. 2016b. Creatingvisual explanations improves learning. CognitiveResearch: Principles and Implications 1, 1 (07 Dec2016), 27. DOI:http://dx.doi.org/10.1186/s41235-016-0031-6
[6] Alan Borning. 1981. The Programming LanguageAspects of ThingLab, a Constraint-Oriented SimulationLaboratory. ACM Trans. Program. Lang. Syst. 3, 4 (Oct.1981), 353–387. DOI:http://dx.doi.org/10.1145/357146.357147
[7] John C. Bowman and Andy Hammerlindl. 2008.Asymptote: A Vector Graphics Language. TUGboat:The Communications of the TEX Users Group 29, 2(2008), 288–294.
[8] Virginia Braun and Victoria Clarke. 2006. Usingthematic analysis in psychology. Qualitative research inpsychology 3, 2 (2006), 77–101.
[9] Bret Victor. 2013. Drawing Dynamic Visualizations.(2013). https://vimeo.com/66085662 Stanford HCISeminar.
[10] Bill Buxton. 2010. Sketching user experiences: gettingthe design right and the right design. Morgan kaufmann.
[11] Mauro Cherubini, Gina Venolia, Rob DeLine, andAndrew J. Ko. 2007. Let’s Go to the Whiteboard: Howand Why Software Developers Use Drawings. InProceedings of the SIGCHI Conference on HumanFactors in Computing Systems (CHI ’07). ACM, NewYork, NY, USA, 557–566. DOI:http://dx.doi.org/10.1145/1240624.1240714
[12] Ravi Chugh. 2016. Prodirect manipulation: bidirectionalprogramming for the masses. In Proceedings of the 38thInternational Conference on Software EngineeringCompanion. ACM, 781–784.
[13] Ruth C Clark and Richard E Mayer. 2016. E-learningand the science of instruction: Proven guidelines forconsumers and designers of multimedia learning. JohnWiley & Sons.
[14] Fehmi Dogan and Nancy J Nersessian. 2002.Conceptual diagrams: representing ideas in design. InInternational Conference on Theory and Application ofDiagrams. Springer, 353–355.
[15] Elijah Meeks. 2018. Third Wave Data Visualization.(2018). https://youtu.be/itChfcTx7ao TapestryConference keynote.
[16] Kevin Ellis, Daniel Ritchie, Armando Solar-Lezama,and Josh Tenenbaum. 2018. Learning to Infer GraphicsPrograms from Hand-Drawn Images. In Advances inNeural Information Processing Systems 31, S. Bengio,H. Wallach, H. Larochelle, K. Grauman,N. Cesa-Bianchi, and R. Garnett (Eds.). CurranAssociates, Inc., 6059–6068.
[17] John Ellson, Emden R Gansner, Eleftherios Koutsofios,Stephen C North, and Gordon Woodhull. 2004.Graphviz and dynagraph–static and dynamic graphdrawing tools. In Graph drawing software. Springer,127–148.
[18] Sebastian Erdweg, Tijs van der Storm, Markus Völter,Meinte Boersma, Remi Bosman, William R. Cook,Albert Gerritsen, Angelo Hulshout, Steven Kelly, AlexLoh, Gabriël D. P. Konat, Pedro J. Molina, MartinPalatnik, Risto Pohjonen, Eugen Schindler, KlemensSchindler, Riccardo Solmi, Vlad A. Vergu, Eelco Visser,Kevin van der Vlist, Guido H. Wachsmuth, and Jimi vander Woning. 2013. The State of the Art in LanguageWorkbenches. In Software Language Engineering,David Hutchison, Takeo Kanade, Josef Kittler, Jon M.Kleinberg, Friedemann Mattern, John C. Mitchell, MoniNaor, Oscar Nierstrasz, C. Pandu Rangan, BernhardSteffen, Madhu Sudan, Demetri Terzopoulos, DougTygar, Moshe Y. Vardi, Gerhard Weikum, Martin Erwig,Richard F. Paige, and Eric Van Wyk (Eds.). Vol. 8225.Springer International Publishing, Cham, 197–217. DOI:http://dx.doi.org/10.1007/978-3-319-02654-1_11
[19] Stephen M Ervin. 1990a. Designing with diagrams: arole for computing in design education and exploration.The Electronic Design Studio, The MIT Press,Cambridge, Massachusetts (1990), 107–122.
[20] Stephen M. Ervin. 1990b. Designing with Diagrams: ARole for Computing in Design Education andExploration. In The Electronic Design Studio, The MITPress, Cambridge, Massachusetts. The MIT Press,Cambridge, Massachusetts, 107–122.
[21] John C Flanagan. 1954. The critical incident technique.Psychological bulletin 51, 4 (1954), 327.
[22] Michael Gleicher and Andrew Witkin. 1994. Drawingwith Constraints. Vis. Comput. 11, 1 (Jan. 1994), 39–51.DOI:http://dx.doi.org/10.1007/BF01900698
[23] Vinod Goel. 1995. Sketches of thought. MIt Press.
[24] T. R. G. Green and M. Petre. 1996. Usability Analysis ofVisual Programming Environments: A ‘CognitiveDimensions’ Framework. Journal of Visual Languages& Computing 7, 2 (June 1996), 131–174. DOI:http://dx.doi.org/10.1006/jvlc.1996.0009
[25] Mark D Gross. 1996. The electronic cocktail napkin–acomputational environment for working with designdiagrams. Design studies 17, 1 (1996), 53–69.
[26] Sumit Gulwani, William R Harris, and Rishabh Singh.2012. Spreadsheet data manipulation using examples.Commun. ACM 55, 8 (2012), 97–105.
CHI 2020 Paper CHI 2020, April 25–30, 2020, Honolulu, HI, USA
Paper 126 Page 11

[27] Sumit Gulwani, Oleksandr Polozov, and Rishabh Singh.2017. Program Synthesis. Foundations and Trends® inProgramming Languages 4, 1-2 (July 2017), 1–119.DOI:http://dx.doi.org/10.1561/2500000010
[28] Pat Hanrahan. 2009. Systems of thought. EuroVis 2009keynote address (2009), 10–12.
[29] Robert L Harris. 2000. Information graphics: Acomprehensive illustrated reference. Oxford UniversityPress, Chapter Conceptual diagram, 100.
[30] Mary Hegarty and Maria Kozhevnikov. 1999. Types ofVisual–Spatial Representations and MathematicalProblem Solving. Journal of Educational Psychology 91,4 (1999), 684–689. DOI:http://dx.doi.org/10.1037/0022-0663.91.4.684
[31] Brian Hempel and Ravi Chugh. 2016. Semi-AutomatedSVG Programming via Direct Manipulation. InProceedings of the 29th Annual Symposium on UserInterface Software and Technology (UIST ’16). ACM,New York, NY, USA, 379–390. DOI:http://dx.doi.org/10.1145/2984511.2984575
[32] Thibaud Hottelier, Ras Bodik, and Kimiko Ryokai.2014. Programming by Manipulation for Layout. InProceedings of the 27th Annual ACM Symposium onUser Interface Software and Technology (UIST ’14).ACM, New York, NY, USA, 231–241. DOI:http://dx.doi.org/10.1145/2642918.2647378
[33] Christopher D Hundhausen and Jonathan L Brown.2007. What You See Is What You Code: A “live”algorithm development and visualization environmentfor novice learners. Journal of Visual Languages &Computing 18, 1 (2007), 22–47.
[34] Nathan Hurst, Wilmot Li, and Kim Marriott. 2009.Review of automatic document formatting. InProceedings of the 9th ACM symposium on Documentengineering. ACM, 99–108.
[35] Edwin L Hutchins, James D Hollan, and Donald ANorman. 1985. Direct manipulation interfaces.Human-computer interaction 1, 4 (1985), 311–338.
[36] Jennifer Jacobs, Joel Brandt, Radomír Mech, andMitchel Resnick. 2018. Extending manual drawingpractices with artist-centric programming tools. InProceedings of the 2018 CHI Conference on HumanFactors in Computing Systems. ACM, 590.
[37] Rubaiat Habib Kazi, Tovi Grossman, Hyunmin Cheong,Ali Hashemi, and George W Fitzmaurice. 2017.DreamSketch: Early Stage 3D Design Explorations withSketching and Generative Design.. In UIST. 401–414.
[38] Mary Beth Kery, Amber Horvath, and Brad Myers.2017. Variolite: Supporting Exploratory Programmingby Data Scientists. In Proceedings of the 2017 CHIConference on Human Factors in Computing Systems(CHI ’17). ACM, New York, NY, USA, 1265–1276.DOI:http://dx.doi.org/10.1145/3025453.3025626
[39] Mary Beth Kery and Brad A Myers. 2017. Exploringexploratory programming. In 2017 IEEE Symposium onVisual Languages and Human-Centric Computing(VL/HCC). IEEE, 25–29.
[40] Kenneth R. Koedinger. 1992. Emergent Properties andStructural Constraints: Advantages of DiagrammaticRepresentations for Reasoning and Learning. In Proc.AAAI Spring Symposium on Reasoning withDiagrammatic Representations. 154–169.
[41] David R Krathwohl and Lorin W Anderson. 2009. Ataxonomy for learning, teaching, and assessing: Arevision of Bloom’s taxonomy of educational objectives.Longman.
[42] David Kurlander and Steven Feiner. 1993. InferringConstraints from Multiple Snapshots. ACM Trans.Graph. 12, 4 (Oct. 1993), 277–304. DOI:http://dx.doi.org/10.1145/159730.159731
[43] James A Landay and Brad A Myers. 1994. Interactivesketching for the early stages of user interface design.Technical Report. CARNEGIE-MELLON UNIVPITTSBURGH PA DEPT OF COMPUTER SCIENCE.
[44] Jill H Larkin and Herbert A Simon. 1987. Why adiagram is (sometimes) worth ten thousand words.Cognitive science 11, 1 (1987), 65–100.
[45] P. Lee, J. D. West, and B. Howe. 2018. Viziometrics:Analyzing Visual Information in the Scientific Literature.IEEE Transactions on Big Data 4, 1 (March 2018),117–129. DOI:http://dx.doi.org/10.1109/TBDATA.2017.2689038
[46] Hannah Limerick, David Coyle, and James W. Moore.2014. The Experience of Agency in Human-ComputerInteractions: A Review. Frontiers in HumanNeuroscience 8 (2014). DOI:http://dx.doi.org/10.3389/fnhum.2014.00643
[47] Catherine C Marshall and AJ Brush. 2004. Exploring therelationship between personal and public annotations. InProceedings of the 4th ACM/IEEE-CS joint conferenceon Digital libraries. ACM, 349–357.
[48] Richard E. Mayer. 2002. Multimedia Learning. InPsychology of Learning and Motivation. Vol. 41.Academic Press, 85–139. DOI:http://dx.doi.org/10.1016/S0079-7421(02)80005-6
[49] Richard E Mayer. 2003. The promise of multimedialearning: using the same instructional design methodsacross different media. Learning and instruction 13, 2(2003), 125–139.
[50] Sean McDirmid. 2007a. Living It Up with a LiveProgramming Language. In Proceedings of the 22NdAnnual ACM SIGPLAN Conference on Object-orientedProgramming Systems and Applications (OOPSLA ’07).ACM, New York, NY, USA, 623–638. DOI:http://dx.doi.org/10.1145/1297027.1297073
CHI 2020 Paper CHI 2020, April 25–30, 2020, Honolulu, HI, USA
Paper 126 Page 12

[51] Sean McDirmid. 2007b. Living It Up with a LiveProgramming Language. In Proceedings of the 22ndAnnual ACM SIGPLAN Conference on Object-OrientedProgramming Systems and Applications (OOPSLA ’07).ACM, New York, NY, USA, 623–638. DOI:http://dx.doi.org/10.1145/1297027.1297073
[52] M. McKeon. 2009. Harnessing the InformationEcosystem with Wiki-Based Visualization Dashboards.IEEE Transactions on Visualization and ComputerGraphics 15, 6 (Nov. 2009), 1081–1088. DOI:http://dx.doi.org/10.1109/TVCG.2009.148
[53] Dominik Moritz, Chenglong Wang, Gregory Nelson,Halden Lin, Adam M. Smith, Bill Howe, and JeffreyHeer. 2019. Formalizing Visualization DesignKnowledge as Constraints: Actionable and ExtensibleModels in Draco. IEEE Trans. Visualization & Comp.Graphics (Proc. InfoVis) (2019).http://idl.cs.washington.edu/papers/draco
[54] Brad A. Myers, Ashley Lai, Tam Minh Le, YoungSeokYoon, Andrew Faulring, and Joel Brandt. 2015a.Selective Undo Support for Painting Applications. InProceedings of the 33rd Annual ACM Conference onHuman Factors in Computing Systems (CHI ’15). ACM,New York, NY, USA, 4227–4236. DOI:http://dx.doi.org/10.1145/2702123.2702543
[55] Brad A. Myers, Ashley Lai, Tam Minh Le, YoungSeokYoon, Andrew Faulring, and Joel Brandt. 2015b.Selective Undo Support for Painting Applications. InProceedings of the 33rd Annual ACM Conference onHuman Factors in Computing Systems (CHI ’15). ACM,New York, NY, USA, 4227–4236. DOI:http://dx.doi.org/10.1145/2702123.2702543
[56] Brad A Myers, John F Pane, and Amy Ko. 2004. Naturalprogramming languages and environments. Commun.ACM 47, 9 (2004), 47–52.
[57] Wode Ni, Katherine Ye, Joshua Sunshine, JonathanAldrich, and Keenan Crane. 2017. Substance and Style:domain-specific languages for mathematical diagrams.In Domain-Specific Language Design andImplementation (DSLDI’17).
[58] Christopher Olah. 2015. Understanding LSTMNetworks. (2015). http://colah.github.io/posts/2015-08-Understanding-LSTMs/
Accessed: 2019-09-18.[59] Cyrus Omar, Ian Voysey, Ravi Chugh, and Matthew A
Hammer. 2019. Live functional programming withtyped holes. Proceedings of the ACM on ProgrammingLanguages 3, POPL (2019), 14.
[60] S. Oney, B. A. Myers, and J. Brandt. 2013. Euclase: ALive Development Environment with Constraints andFSMs. In 2013 1st International Workshop on LiveProgramming (LIVE). 15–18. DOI:http://dx.doi.org/10.1109/LIVE.2013.6617342
[61] Casey Reas and Ben Fry. 2006. Processing:Programming for the Media Arts. AI & SOCIETY 20, 4(Sept. 2006), 526–538. DOI:http://dx.doi.org/10.1007/s00146-006-0050-9
[62] Steven P. Reiss, Qi Xin, and Jeff Huang. 2018. SEEDE:Simultaneous Execution and Editing in a DevelopmentEnvironment. In Proceedings of the 33rd ACM/IEEEInternational Conference on Automated SoftwareEngineering (ASE 2018). ACM, New York, NY, USA,270–281. DOI:http://dx.doi.org/10.1145/3238147.3238182
[63] Clive Richards. 2002. The Fundamental DesignVariables of Diagramming. In DiagrammaticRepresentation and Reasoning, Michael Anderson,Bernd Meyer, and Patrick Olivier (Eds.). SpringerLondon, London, 85–102. DOI:http://dx.doi.org/10.1007/978-1-4471-0109-3_5
[64] Yann Riche, Nathalie Henry Riche, Ken Hinckley, SheriPanabaker, Sarah Fuelling, and Sarah Williams. 2017.As We May Ink?: Learning from Everyday Analog PenUse to Improve Digital Ink Experiences. In Proceedingsof the 2017 CHI Conference on Human Factors inComputing Systems (CHI ’17). ACM, New York, NY,USA, 3241–3253. DOI:http://dx.doi.org/10.1145/3025453.3025716
[65] Arvind Satyanarayan, Bongshin Lee, Donghao Ren,Jeffrey Heer, John Stasko, John R. Thompson, MatthewBrehmer, and Zhicheng Liu. 2020. Critical Reflectionson Visualization Authoring Systems. IEEE Trans.Visualization & Comp. Graphics (Proc. InfoVis) (2020).http://idl.cs.washington.edu/papers/
reflections-vis-authoring
[66] Daniel L Schwartz, Jessica M Tsang, and Kristen PBlair. 2016. The ABCs of how we learn: 26 scientificallyproven approaches, how they work, and when to usethem. WW Norton & Company, Chapter V is forVisualization.
[67] Beau Sheil. 1983. Environments for exploratoryprogramming. Datamation 29, 7 (1983), 131–144.
[68] B. Shneiderman. 1983. Direct Manipulation: A StepBeyond Programming Languages. Computer 16, 8(1983), 57–69. DOI:http://dx.doi.org/10.1109/MC.1983.1654471
[69] Johannes Strömberg. 2006. Integrating Constraints witha Drawing CAD Application. Stockholm University(2006).
[70] Ivan E Sutherland. 1964. Sketchpad a man-machinegraphical communication system. Simulation 2, 5(1964), R–3.
[71] Masaki Suwa and Barbara Tversky. 1997. What doarchitects and students perceive in their design sketches?A protocol analysis. Design studies 18, 4 (1997),385–403.
[72] Steven L. Tanimoto. 1990. VIVA: A Visual Languagefor Image Processing. J. Vis. Lang. Comput. 1, 2 (June1990), 127–139. DOI:http://dx.doi.org/10.1016/S1045-926X(05)80012-6
CHI 2020 Paper CHI 2020, April 25–30, 2020, Honolulu, HI, USA
Paper 126 Page 13

[73] Till Tantau. The TikZ and PGF Packages.http://sourceforge.net/projects/pgf/
[74] William P. Thurston. 1998. On Proof and Progress inMathematics. New directions in the philosophy ofmathematics (1998), 337–355.
[75] Christine D. Tippett. 2016. What Recent Research onDiagrams Suggests about Learning with Rather thanLearning from Visual Representations in Science.International Journal of Science Education 38, 5 (March2016), 725–746. DOI:http://dx.doi.org/10.1080/09500693.2016.1158435
[76] Linus Torvalds and Junio Hamano. 2010. Git: Fastversion control system. URL http://git-scm. com (2010).
[77] Arie van Deursen, Paul Klint, and Joost Visser. 2000.Domain-Specific Languages: An AnnotatedBibliography. SIGPLAN Not. 35, 6 (June 2000), 26–36.DOI:http://dx.doi.org/10.1145/352029.352035
[78] Bret Victor. 2011. Up and Down the Ladder ofAbstraction: A systematic approach to interactivevisualization. (2011).http://worrydream.com/LadderOfAbstraction/ [Accessed:2019-09-17].
[79] M. Voelter and V. Pech. 2012. Language Modularitywith the MPS Language Workbench. In 2012 34thInternational Conference on Software Engineering(ICSE). 1449–1450. DOI:http://dx.doi.org/10.1109/ICSE.2012.6227070
[80] J. Walny, S. Carpendale, N. Henry Riche, G. Venolia,and P. Fawcett. 2011. Visual Thinking In Action:
Visualizations As Used On Whiteboards. IEEETransactions on Visualization and Computer Graphics17, 12 (Dec 2011), 2508–2517. DOI:http://dx.doi.org/10.1109/TVCG.2011.251
[81] Hadley Wickham. 2010. A layered grammar of graphics.Journal of Computational and Graphical Statistics 19, 1(2010), 3–28.
[82] Wikipedia contributors. 2019. Diffie-Hellman keyexchange — Wikipedia, The Free Encyclopedia. (2019).https:
//en.wikipedia.org/wiki/Diffie-Hellman_key_exchange
[Online; accessed 05-April-2019].
[83] Eric Willigers, Chris Lilley, Dirk Schulze, BogdanBrinza, David Storey, and Amelia Bellamy-Royds. 2018.Scalable Vector Graphics (SVG) 2. Candidaterecommendation. W3C.https://www.w3.org/TR/2018/CR-SVG2-20181004/
[84] Katherine Ye, Keenan Crane, Jonathan Aldrich, andJoshua Sunshine. Designing extensible, domain-specificlanguages for mathematical diagrams. In Off the BeatenTrack (OBT’17).
[85] Young Seok Yoon and Brad A Myers. 2014. Alongitudinal study of programmers’ backtracking. In2014 IEEE Symposium on Visual Languages andHuman-Centric Computing (VL/HCC). IEEE, 101–108.
[86] Jiaje Zhang and Donald A Norman. 1994.Representations in distributed cognitive tasks. Cognitivescience 18, 1 (1994), 87–122.
CHI 2020 Paper CHI 2020, April 25–30, 2020, Honolulu, HI, USA
Paper 126 Page 14