how does the use of extensive reading compared to the use
TRANSCRIPT

St. Cloud State UniversitytheRepository at St. Cloud State
Culminating Projects in English Department of English
8-2017
How Does the Use of Extensive ReadingCompared to the Use of Intensive Reading AffectMAP Reading Scores in a Class of ESL Students?Melissia B. YoungSt. Cloud State University
Follow this and additional works at: https://repository.stcloudstate.edu/engl_etds
This Thesis is brought to you for free and open access by the Department of English at theRepository at St. Cloud State. It has been accepted forinclusion in Culminating Projects in English by an authorized administrator of theRepository at St. Cloud State. For more information, please [email protected].
Recommended CitationYoung, Melissia B., "How Does the Use of Extensive Reading Compared to the Use of Intensive Reading Affect MAP Reading Scoresin a Class of ESL Students?" (2017). Culminating Projects in English. 102.https://repository.stcloudstate.edu/engl_etds/102

How Does the Use of Extensive Reading Compared to the Use of Intensive Reading Affect
MAP Reading Scores in a Class of ESL Students?
by
Melissia Young
A Thesis
Submitted to the Graduate Faculty of
St. Cloud State University
in Partial Fulfillment of the Requirements
for the Degree of
Master of Arts
in Teaching English as a Second Language
August, 2017
Thesis Committee:
Choonkyong Kim, Chairperson
James Robinson
Edward Sadrai

2
Abstract
This is a qualitative study comparing seven points of quantitative data in the areas of
phonological awareness, phonics, concepts of print, vocabulary and word structure,
comprehension, writing and overall score, to compare two teaching methods. The main subjects
of this study are basal readers, leveled readers and MAP reading scores. The study participants
were second grade ESL students in separate classrooms. Although this study touches on the use
of sight-words, visual images, context vocabulary, reading time and word play through word use,
the main focus of the results are a comparison between two different ways to present reading
lessons to students. It is shown in the results that leveled readers can improve reading scores.
These results can be used to improve reading instruction in any grade and at all levels.

3
Table of Contents
Chapter Page
I. Introduction ........................................................................................................................ 7
Statement of Problem ................................................................................................. 7
Background and Need for the Study .......................................................................... 7
Purpose of the Study .................................................................................................. 7
Research Question ..................................................................................................... 8
II. Literature Review .............................................................................................................. 9
First Language Advantages ........................................................................................ 9
Vocabulary ................................................................................................................. 10
Educational Misunderstandings ................................................................................. 12
Context Teaching ....................................................................................................... 13
Sight Words ............................................................................................................... 16
Rich Language ........................................................................................................... 17
Reading ...................................................................................................................... 18
The Use of Images ..................................................................................................... 24
Writing ....................................................................................................................... 25
Correlations Between Lexical Knowledge and Comprehension ............................... 26
Summary .................................................................................................................... 27
III. Method ............................................................................................................................. 28
Participants ................................................................................................................. 28
Materials .................................................................................................................... 29
Basal Reader .................................................................................................. 29
4 Chapter Page
Grammar Book............................................................................................... 29
Leveled Readers ............................................................................................. 29
Vocabulary ..................................................................................................... 29
Sight Words ................................................................................................... 30
Teacher Written Books .................................................................................. 30
Teacher Written Worksheets .......................................................................... 30
Measures of Academic Progress Assessment ................................................ 30
Procedure ................................................................................................................... 30
Control Group Procedure ............................................................................... 30
Study Group Procedure .................................................................................. 31
Assessment ..................................................................................................... 33
Analysis...................................................................................................................... 34
IV. Results.............................................................................................................................. 36
V. Discussion ........................................................................................................................ 63
Limitations of the Study............................................................................................. 68
VI. Conclusion ....................................................................................................................... 69
References .............................................................................................................................. 70

5
List of Tables
Table Page
1 Individual Gains in Phonological Awareness ............................................................ 37
2 Individual Gains in Phonics ....................................................................................... 41
3 Individual Gains in Concepts of Print ........................................................................ 45
4 Individual Gains in Vocabulary and Word Structure ................................................ 49
5 Individual Gains in Comprehension .......................................................................... 53
6 Individual Gains in Writing ....................................................................................... 57
7 Individual Gains in Combined RIT Scores ................................................................ 60

6
List of Figures
Figure Page
1 Mean and Median Growth in Phonological Awareness ............................................ 39
2 Mean and Median Growth in Phonics ....................................................................... 43
3 Mean and Median Growth in Concepts of Print ........................................................ 47
4 Mean and Median Growth in Vocabulary and Word Structure ................................. 51
5 Mean and Median Growth in Comprehension ........................................................... 55
6 Mean and Median Growth in Writing ........................................................................ 59
7 Mean and Median Growth in Overall RIT Scores ..................................................... 62

7
I: Introduction
Statement of Problem
As a beginning ESL teacher I was faced with the challenge of finding the best method to
teach multiple classrooms with students at multiple language development levels. Because many
ESL students who have started to read are mainstreamed before they are ready, classes with
multiple language levels present a common situation in many elementary schools around the
country. This is because students, for social development reasons, are placed according to their
age, and not their level of learning. The problem facing a teacher in this type of classroom is
how to educate all of the students so that they can all make gains towards yearly growth without
falling further behind. Additionally, how can students go beyond yearly growth and best catch
up with their peers?
Background and Need for the Study
Although a good deal of research has been done involving reading in the area of native
language learners, there is very little research in the area of second language learners in a
mainstreamed classroom. The need for vocabulary and phonics instruction is also a debated
topic in many schools. These two factors make reading instruction for second language learners
a subject that should be examined more closely.
Purpose of the Study
The purpose of this study was to see if the application of theories that suggested
extensive exposure to vocabulary strategies and increased reading time would improve reading
comprehension and have an effect on student Rasch Unit (RIT) reading scores as assessed by the
Measures of Academic Progress (MAP) reading assessment.

8 Research Question
How will a reading program using leveled readers, visual images, and word play affect
RIT scores in one class of second grade students compared to the use of basal readers in another
class of second grade students? When the scores are broken down, will phonological awareness,
phonics, concepts of print, vocabulary and word structure, comprehension, writing, and the
overall combined score show statistically relevant growth in the study group beyond that or the
control group? What challenges will manifest throughout the year of instruction?

9
II: Literature Review
Generally, a common belief is that if students read more they will learn faster. Students
who read more are supposed to be better learners, better participants, and better in all of their
other subjects too. These statements, however, are non-specific, and too broad to measure.
However, according to Guthrie, Wigfield, Metsala, and Cox (1999), “students who spend a large
amount of time reading will increase in fluency of using such cognitive strategies as applying
prior knowledge, finding the main idea, inferencing, and building a casual model of the text” (p.
251). Just reading, however, is not as simple as it sounds. “The socio-phycholinguistic view is
based on the belief that reading is a universal process of constructing meaning from text by using
background knowledge, linguistic cues, and psychological strategies” (Freeman & Freeman,
2012, p. 115). While there are a few studies that have been done specific to reading and how it
affects student learning, many of these studies were done using the students’ first language. The
purpose of this study was to examine what teaching methods showed the greatest results and find
a way to combine them into a curriculum that helped students learning a second language.
First Language Advantages
According to Droop and Verhoeven (2003), first language speakers come to the task of
reading with a lot of advantages. They already know how to form the words correctly with their
mouths. They also have very extensive lexical information about the words they are sounding
out. This foundation in spoken language is not available to L2 learners. Bialystock (2001)
writes that reading is the primary way students are expected to learn in most subject areas.
Because these expectations are more difficult for children who do not know the language of the
text, these students fall behind in their classes. As a result, there is a lot of push to get native
language instruction into the schools for second language learners who are struggling to

10 understand their core curriculum (Verhoeven, 2000). But, for some minorities, this is not an
option. It is too difficult to find teachers in their own language. Or, there would need to be
many different schools with many different languages. It would be expensive for the school
system to maintain. Therefore, most ESL students are forced to use what knowledge they have
of their first language and apply it the best they can manage. This can cause problems while
learning a second language if an understanding in the native language hinders how the second
language is processed (Verhoeven, 2000). This would further slow down the learning rate for
students trying to learn both languages and could affect their learning in more ways than just
vocabulary and content.
Not only words, but also cultural differences can cause misunderstandings. “Exposure to
stories in a given language determines children’s ability to use the literate register of that
language” (p. 159), and this skill does not appear to cross-over (Bialystock, 2001). For example,
if a student learns how to tell a story in one language, the same story telling method might not be
used in the other language by a different culture. This does not only apply to story telling.
Writing styles vary greatly from culture to culture (Schmitt, 2008). So, if reading is so important
for student learning, and it will in many cases need to be done in the second language, what
things need to be focused on to help second language students to follow the content of a class
and catch up to their peers?
Vocabulary
Most experts would agree that it is difficult to predict how well each student in a class
will be able to read. “Accurate early prediction of future poor readers may be doomed to failure,
as it cannot account for subsequent variance in… quality of instruction,… frequency of school
changes, school attendance, and so on” (Bowey, 2005, p. 158). But, according to Stahl and Nagy

11 (2006), vocabulary knowledge was the best predictor of how well students would do on reading
assignments. Therefore, increasing students’ vocabulary understanding should increase students’
reading ability. There are many different theories about how to approach vocabulary teaching,
however. Stahl and Nagy write that metalinguistic awareness, phonemic awareness,
morphological awareness as well as the ability to understand figurative language and multiple
meanings of words are all needed for reading comprehension. Another necessary skill listed by
Stahl and Nagy is automatic word learning (sight words), which will be discussed later. In the
study done by Verhoeven (2000), vocabulary was found to have even more influence on L2
learning than L1 learning, because vocabulary affected both reading comprehension and class
discourse. It is also believed that students need to be taught strategies to figure out words in
context that they do not understand. The real problem is, which method for vocabulary teaching
does a teacher choose? Does context reading outweigh automatic word learning or classroom
discussions, for example? Not in the least. According to Stahl and Nagy (2006), the answer is to
choose all forms of vocabulary acquisition. All of these methods need to be combined to increase
student vocabulary and reading comprehension.
Truly learning a word requires seeing it used often and in different settings. “…Virtually
anything that leads to more exposure, attention, manipulation, or time spent on lexical items adds
to their learning” (Schmitt, 2008, p. 339). Methods Schmitt suggests using to develop
vocabulary ownership include: on-line databases, chat programs, using the word in a sentence,
producing new forms of the word by adding a prefix or suffix, defining the word in their own
words, and even just recording them in a notebook. This word ownership is important. Learning
needs to focus on both meaning and form. What good comes from knowing a word, if the
student does not know the use or multiple uses of that word? Schmitt states, “…a learner must

12 also know a great deal about each item in order to use it....The quality of ‘depth’ of vocabulary
knowledge…is as important as vocabulary size” (p. 33). Schmitt warns, however, that
instructors need to be careful when teaching vocabulary because, “…single episodes of
instruction may not only be ineffective, but may actually be counter productive…” (p. 335) when
done to the extent that the full meaning of the text is forgotten. Stahl and Nagy (2006) voiced an
identical concern. Therefore, teachers have to be careful not to simply brush by topics without
reinforcing the student comprehension of what is happening and how it fits into the bigger
picture.
Educational Misunderstandings
ESL instructors are familiar with the measurement that it takes about two years for a
New-to-Country student to develop conversational English. It is also commonly known that it
takes an additional five years to develop a reliable academic English (Palmer, Zhang, Taylor, &
Leclere, 2010). During this learning time, “bilingual students probably function in an
interlingual purgatory” (Bialystock, 2001, p. 62) that combines what they know about each
individual language, until they can sort it out. The common mistake made by most teachers who
do not have an ESL background, is to assume that these students understand what is going on in
class, just because they speak normally outside of class. Another common classroom strategy
that feeds this problem is the teaching of exclusive phonics programs in lower elementary
grades. “Although their oral reading may sound good, many of these students have difficulty
retelling what they have read. They become good word callers who lack comprehension”
(Freeman & Freeman, 2012, p. 115-116). A Dutch study done with minority students who were
taught how to sound out the Dutch words in their early school years is a good example of this
problem. While all of the students could decode the words verbally with almost no problem at

13 all (because Dutch is a phonetic language that easily follows a set of rules that work in all
situations to sound out the words), the minority children scored lower at the beginning of the
study on word comprehension. The differences in reading comprehension only increased as time
progressed because the students were reading words perfectly that had no meaning to them
(Droop & Verhoeven, 2003). Many teachers will hear students reading a text with little or no
difficulty. However, the topic of a given text may be a word that has absolutely no meaning to
the student. They have no mental picture or feeling of the word or anything with which they can
associate its meaning. Although, “a minimal level of phonological awareness is required to learn
to read and spell,” (Verhoeven, 2000, p. 314) vocabulary is an equally if not more important part
of learning for these students.
Another false belief held by the general public is that younger children are better at
learning a new language. However, what many people do not take into consideration is that
older students need to come into a language at a higher level of learning. This means that
conversations will be more complex, vocabulary will be more extensive, and it will appear to
teachers that these older students are having a much harder time (Palmer et al.,
2010). Additionally, very few vocabulary studies have shown that additional vocabulary focus
helps after a certain point in learning (Fukkink, Hulstijn, & Simis, 2005). But, what these studies
do not take into account is the word difficulty after a certain point (Pichette, Serres, &
Lafontaine, 2012). Concrete words such as ‘cat’, ‘dog’, and ‘newspaper’ are much easier for
students to grasp than ‘accent’, ‘conversation’, and ‘idea’.
Context Teaching
One way some teachers approach the subject of vocabulary is by teaching to topics,
rather than individual words. Background knowledge and pictures are important to beginning

14 readers. If they know about a word, they will understand it in context. If they do not know the
word or only know it in another language, they will not comprehend meaning (Palmer et al.,
2010). According to Guthrie et al. (1999), students need to have a good understanding of a
variety of topics to improve their reading abilities and comprehension. When studying a topic,
“instruction should also be aimed at a deeper level of processing. Numerous encounters with a
word in many different contexts should be provided” (Droop & Verhoeven, 2003, p. 101).
Context teaching is helpful for second language learners, because they, “not only have less
extensive vocabularies than first-language learners but also fewer associative links between
words” (Droop & Verhoeven, 2003, p. 812). Knowledge of a topic makes new words easier to
learn and increases read-ability (Stahl & Nagy, 2006). According to Schmitt (2008), teaching
both use and meaning increases learning. And, “prior knowledge, often conceptualized as a
schema, also predicts subsequent text comprehension” (Guthrie et al., 1999, p. 232). Why is this
the case? According to Akamatsu (2008), “the reader needs to reach such a stage [of topic
comprehension] that the moment he or she fixes on a word, all the corresponding mental
representations are automatically retrieved” (p. 176). Topic teaching needs to be individualized
to specific classes, however, because different groups will have different gaps in their learning.
Stahl and Nagy (2006) suggest the use of mind mapping on the board to test for prior knowledge.
This method has also been tested for results, and it was found that, “training that involves
students engaged in repeated reading of texts, under a variety of conditions and specific
activities, almost uniformly led to improved comprehension outcomes” (Grabe, 2010, p. 75). In
addition, learning by topic not only helped students fill in the gaps, but also motivated them to
learn and read more about the topic (Hammond & Danaher, 2011).

15 While the teaching of so many different topics with multiple words for each can become
difficult, it is important to not only show students how these words are used in the classroom, but
also out in the world around them and whenever possible in their own cultures. They need to see
the value in both learning and remembering so that the new vocabulary is not as quickly
forgotten as it was learned. This may mean that certain words are not covered as intensively as
others, but ANY word that a student is having difficulty understanding should not be ignored.
Teachers need to take advantage of both planned and opportunistic times to teach what students
show the need to understand. The new words need to be owned, so that they can access them
easily in connections to new words and contexts as they continue to learn (Stahl & Nagy, 2006).
Those words also need to be recalled as quickly as possible so that comprehension does not fail
in the fast moving environment of a classroom (Levy, Abello, & Lysynchuk, 1997).
As previously mentioned, individual vocabulary does play its part in context teaching.
According to Bialystock (2001), “it may be that the acquisition of syntax and phonology is
adequately triggered by exposure to the language, but vocabulary needs to be learned” (p. 66).
Not even L1 learners can instantly discover the meaning of a word they have never seen before,
even in context. Applying false concepts to a word can result in even further confusion for
young readers. Stahl and Nagy (2006) write that there are 3 principles of teaching words. First,
both the definition and context information need to be presented to the learner. Second, there
needs to be word play. Children need to be involved in actively processing and using the new
vocabulary. Third, multiple methods of exposure to the word in context need to be applied.
Stahl and Nagy are not the only authors who share this theory. Schmitt (2008) also suggests that
repeated exposure to specific words in context helps students to create a kind of ownership in the
understanding of that word so that it will not be easily forgotten.

16 Sight Words
Another approach is teaching individual words as a quickly recalled picture with a name.
The first way many students (both first and second language learners) experience this approach is
through the use of sight-words. This is not a phonetic approach to word learning, but a whole
word approach. Automatic word learning increases comprehension because it decreases
processing-time. After repeated exposure to a word, the brain starts to recognize the word as a
picture rather than a set of sounds (Akamatsu, 2008; Droop & Verhoeven, 2003). In a study
done by Levy et al. (1997), all of the readers showed improvement in the speed of their reading
through the repeated exposure to single words.
It can be argued that this study focused more on speed than comprehension, which is a
valid point. In fact, according to research done previously by Levy et al. (1997), many studies
have shown that vocabulary training does not increase comprehension, but that leads to the
following questions: How was the vocabulary taught? Were pictures used along with the
vocabulary? Was meaning given to the words? Were the words just letters on a page, or were
they made personally relevant to the student?
However, opinions on this subject vary. In the study done by Levy et al. (1997), they
found that reading comprehension did improved because of word repetition. Fukkink et al.
(2005) found that many researchers do believe teaching vocabulary through word automatic
recognition will help with comprehension and L2 learners should spend a large amount of time
on this activity. Similarly, a study done by Fukkink et al. showed that repeated exposure to the
same words (learning for automatic word recognition) increased the reading skills of the L2
learners in the study. And, specific to L2 learners, Akamatsu (2008) found that word recognition
training improved both their speed and their accuracy when reading.

17 Unfortunately, many teachers beyond the first grade level stop focusing on sight words
because they usually believe all of their students are already familiar with them (Stahl & Nagy,
2006). These teachers need to keep in mind that the human mind can only do so many things at
one time. There is a reason that these words need to first be learned automatically. “When
learners’ language proficiency is limited, they may exhaust their attention finishing decoding. As
a result, they have little attention for comprehending the text” (Iwahori, 2008, p. 73). These
words are additionally confusing for students because “the most frequent words in the [English]
language have a pretty broad range of utility” (Stahl & Nagy, 2006, p. 101). Anyone who doubts
this claim needs only to look up words like “read” and “bow” in a dictionary. Not only do both
of these words have two different meanings, but they also have two different pronunciations.
Therefore, although it is important to teach these words as sight words for recognition, it is
equally important to teach them in context so that the learner will experience the multiple uses
and meanings of these words.
Children pick-up information about what words mean and how words are used as they
repeatedly hear the words or see them in print. Even for those words that are explicitly
taught, much of students’ knowledge of them ultimately comes from further encounters
with those words in text. (Stahl & Nagy, 2006, p. 173)
Rich Language
No matter how good a vocabulary program is, however, it would be impossible for any
program to cover the multiple topics and meanings of every word to which a student is exposed.
Stahl and Nagy (2006) write that, “exposure to rich language, whether written or oral, is a
necessary condition for vocabulary growth” (p. 50). The first place that all learners (both L1 and
L2) are exposed to language and vocabulary is in their homes. Because of this, the majority of

18 vocabulary that is learned at these young ages is through context (Stahl & Nagy, 2006), and most
of that learning occurs outside of school. Bialystock (2001) performed a study on L1 learners
who were read to at home compared to L1 learners who were not read to at home. Bialystock
found that children who were read to often showed a better ability to invent a story and find
words to go along with a picture book that had no story attached. These read-to L1 learners also
used more adjectives to describe stories than the students who did not have stories read to them.
Stahl and Nagy (2006) believe that interactions with adults are some the best vocabulary
experiences for young children. Anderson, Wilson, and Fielding (1988) also found that students
who spent time sitting and eating with their families showed more growth because of the adult
interactions. Whereas speaking to children does increase their vocabulary, reading to children
has proven to be even more effective. According to Stahl and Nagy (2006), “children’s books
are almost twice as rich in rare words as adult conversations; [and] comic books are about three
times as rich…” (p. 126). However, because many L1 learners are not read to at home and many
L2 learners have parents who are also learning a new language and cannot always read to them
in the new language, it becomes important for the teacher to create exposure to reading and rich
language in the classroom. In addition to the rich language in reading, teacher explanations for
school content are also considered rich language for learning (Stahl & Nagy, 2006). Therefore, it
is important to catch the reading interest of the student and present the subjects in a way that will
hold their continued interest.
Reading
Reading, reading, and more reading are also recommended for vocabulary acquisition. It
is a never-ending circle: reading improves vocabulary while vocabulary improves reading.

19 Grabe (2010) found many studies show greater amounts of reading equal more vocabulary
growth.
It then becomes the role of the teacher to provide opportunities for students to read. They
need to provide access to books, incentives to motivate students, read-aloud options for students
to listen, and time for reading (Anderson et al., 1988).
Pichette et al. (2012), however, warns that reading alone for incidental acquisition only
produces limited results. Schmitt (2008) echoes this concern with studies that showed reading
alone produced little improvement in students without explicit vocabulary instruction. There are
a number of reasons why having students only read, without the help of vocabulary instruction,
can change the results of a study. The first of these problems was obvious to almost any teacher
who has been in a classroom, but was recorded in research by Stahl and Nagy (2006). Some of
the students were only pretending to read. The lack of gain in these particular students needs no
explanation. Another reason is the range of vocabulary that students already possess when they
enter school. While this number can vary greatly for even L1 students, there are also estimates
that the difference in L2 learners can range from 2,000 to 7,000 words (Droop & Verhoeven,
2003). That is a substantial difference.
This difference in vocabulary knowledge translates almost immediately to a difference in
reading ability that separates students soon after they begin reading in school (Bowey, 2005).
Those students with more advanced vocabularies pull ahead quickly, while those with smaller
vocabularies pull forward at a much slower rate (Bialystock, 2001). Guthrie et al. (1999) found
that, “In first grade, good readers encounter 80% more words in their reading instruction than did
poor readers” (p. 233).

20
Additionally, reasons for differences in second language proficiency among bilingual
students include the lack of automaticity in recognizing words and slower orthographic
processing skills (Bialystock, 2001). Also, “it can be assumed that any differences in the
children’s reading comprehension will increase when children are confronted with more complex
and abstract language.... these differences manifest themselves around the fourth grade…when
education gets more complicated” (Droop & Verhoeven, 2003, p. 97). If all of these students
are supposed to be held up to the same standard for measurement, it is not only unfair to those
learning at a slower rate, but it is expecting something unrealistic and ultimately setting them up
for failure.
As educators, we cannot expect to see immediate results. Nation (1997) found, “the
benefits of extensive reading do not come in the short term” (p. 16). There are far too many
different skills being learned at the same time to expect students to show instant results. Reading
fluency at any level involves a combination of word recognition, reading rate, extensive
exposure to print, and accuracy in comprehension. In addition, “many reading skills…only
emerge as an outcome of implicit learning. And implicit learning can only come about through
extended periods of exposure and meaningful time on task” (Grabe, 2010, p. 73). This clearly
places the effectiveness of a reading program in the hands of the teacher. The program needs to
be both meaningful and extensive with an implicit learning goal.
How can this task be accomplished with so many students in one class? The answer is
the use of graded or leveled readers. A study done by Iwahori (2008) showed that extensive
reading of leveled, enjoyable materials with a focus on meaning improved both comprehension
and vocabulary knowledge of the students involved. Schmitt (2008) writes that there is
substantial research showing the effectiveness of leveled readers. The rich language of authentic

21 texts is valuable as readers grow, but it can also hinder the learning ability if the reader has not
reached a 90 percent level of vocabulary comprehension (Droop & Verhoeven, 2003). (This
measurement of 90 percent is discussed in more detail in the section on lexical knowledge and
comprehension.) Not only do leveled readers simplify the vocabulary load for learners, but they
also recycle many of the same words to help develop quick recall and recognition. Freeman and
Freeman (2012) wrote that the strategy of using leveled readers during reading instruction and
then using more difficult texts for re-reading the vocabulary helps with comprehension. This
may not expand the vocabulary as quickly, but it is, “…very useful in developing and enriching
partially known vocabulary” (Schmitt, 2008, p. 348), an essential skill for beginners. In a study
done by Levy et al. (1997), it was discovered that poor readers in grades three through six who
were given leveled readers showed “…benefits at the single – word level and at the content
level…” (p. 174).
Once a basic level vocabulary is established, however, students still need to learn a
variety of strategies to decode the remaining words on the page. The advice of Iwahori (2008) is
to avoid dictionaries as much as possible. Dictionaries take a large amount of time and call on
other skills that break down the comprehension of the text. Additionally, Stahl and Nagy (2006)
point out that dictionary definitions often have long descriptions of the words that only confuse
the learner further. Instead, the first strategy a teacher should try to show students is how to
guess the meaning of the word from the context. This, again, revisits the value of teaching
vocabulary in the context of a topic that is being read about in class. Schmitt (2008) also
emphasizes that the focus must be kept on constructing meaning for the topic. Focus on the
meaning of a text can also be helpful as a strategy. Inference is a skill used more commonly by
beginning learners than advanced learners, but it remains a skill that is not inherent to most

22 learners at all and must be taught. Droop and Verhoeven (2003) suggest using pre-reading tasks
because the context will be more difficult for some readers than others. Schmitt (2008) suggests
using post–reading tasks that focus on the USE of new vocabulary rather than forcing students to
know the MEANING of new vocabulary. Done in small groups for discussion, this gets the
students using the target words rather than guessing at them. Freeman and Freeman (2012),
whose book focuses specifically on teaching L2 learners, suggest multiple strategies for
engaging learners. These include using culturally relevant books to keep student interest, pairing
native speakers with non-native speakers, planning curriculum around student backgrounds, and
engaging students in both reading and writing workshops in the classroom. Even teaching the
meanings of affixes can aid students in deciphering vocabulary and contextual meaning (Stahl &
Nagy, 2006). These strategies help focus vocabulary growth in the core areas so that students do
not fall behind in a variety of learning subjects just because of a language barrier.
There are several teaching methods that have produced measurable increases in reading
ability. One of these is called “echo reading” (Stahl & Nagy, 2006, p. 106). Basically, the
teacher reads first and then the student repeats and follows what they have just heard. This might
sound like cheating, but it has actually helped students to understand challenging material. This
is because, “…listening comprehension exceeds…reading comprehension” (Stahl & Nagy, 2006,
p. 52) in most learners. This is not surprising when compared to another study that found
“…reading while-listening is generally superior to reading-only in promoting vocabulary
learning” (Schmitt, 2008, p. 349). Stahl and Nagy (2006) wrote that having an effective reading
program in a classroom involves both volume of reading and level of comprehension. Each
student must first be matched to the correct level of text, the entire class must be given time to
read, and comprehension skills should be taught to all students in the classroom. Matching

23 students to their level of comprehension is where this becomes difficult, but not impossible. No
large group class is going to have an entire group of students who will all understand the same
level of text. While it is impossible to assign a teacher to every reading level in the room (in
some rooms, there might be a dozen different levels), the task of monitoring becomes even more
difficult when the teacher realizes that they need to monitor each individual student. Although
un-monitored reading has proved less effective then directly monitored reading (Stahl & Nagy,
2006), a classroom teacher is left with no other choice than to allow students to read while they
circulate the room and check-in with individual students. This divided reading time is just as
necessary for L2 readers as L1 readers. Verhoeven (2000) recommends that reading be used at
all levels of the L2 learning process, from New-to-Country students all the way up to advanced
learners. While Stahl and Nagy (2006) found that it was very problematic for most beginning L2
learners to learn words from context, it was programs that focused mostly on reading that
showed the most benefit for these learners. They wrote, “…Getting students to read as much and
as widely as possible is essential to their continued vocabulary growth” (Stahl & Nagy, 2006, p.
53). Talking about the words in a story and discussing their meanings with students also
“…enables the child to make connections to past experiences to analyze information or draw
inferences…” (Stahl & Nagy, 2006, p. 116). Stahl and Nagy did warn, however, that teachers
who have beginning level learners need to be careful to stay as close to the main topic as possible
when introducing new material, and Bowey (2005) urges teachers to monitor students who are
falling behind as closely as possible to correct instruction as soon as difficulties appear. Veering
too far onto side topics can make comprehension too difficult for the lowest level learners in a
group.

24 Once learners discover that reading can be fun and not just an assignment, they usually
begin to advance more quickly. In a study done by Anderson et al. (1988), it was found that out-
of-school reading proved to have the largest link to reading proficiency. Unfortunately, the same
study also showed that almost none of the children took the time to read in their free time at all.
Guthrie et al. (1999) found similar results when some students had increased reading time, while
other students did not increase their reading time. The students who read more also showed
improvement in text comprehension. Additionally, Guthrie et al. discovered that the amount of
reading time outside of class affected scores as well. Students who read for pleasure for at least
20 minutes out-of-school were in the top third of the class. So, how do teachers encourage
students to read more for enjoyment? According to Hammond and Danaher (2011), students who
claimed they had no time to read found time when they were given the opportunity to read for
pleasure and the text of their choosing. They also reported that students were more interested in
reading when they knew the words in the text. So, teachers need to provide students with time to
read topics of their choosing at a level they can easily understand.
The Use of Images
Astorga (1999) found that images were extremely important for beginning learners.
These images can be divided into two categories. The first is a conceptual image, which
represents a physical or tangible meaning to the learner. The second is a presentational image,
which gives the learner a sense of the events and actions happening in a story.
Written stories that are used in second language learning have the undeniable value of
providing the context through which children can acquire the new language by being
exposed to the sentence patterns, collocations, and rhythms of the target language. But at

25
the same time, the second language can be a barrier that prevents the young second
language learners from getting into the world of a story. (Astorga, 1999, p. 213)
The study done by Astorga also found that children’s books using images to show the actions of
the characters were better for learning word comprehension. “When text and image are
simultaneous input, the image will surely first engage their attention. The challenge lies in
finding a pedagogic approach that encourages children to attend to the written text as well”
(Astorga, 1999, p. 214). Astorga recommended reading comprehension questions that contained
images in the questions, but unfortunately found that only three out of twenty picture books for
L2 learners that were reviewed used pictures in the post reading tasks. Akamatsu (2008)
additionally found that images helped because it was more difficult for learners to decipher text
when the visuals images they were given did not match what they were reading.
The use of sound recording to accompany illustrations was also found to make reading
more enjoyable and easier for readers to understand (Hammond & Danaher, 2011). Another
method that was used is called a “picture walk” (Stahl & Nagy, 2006, p. 112). This walks the
student through the pictures to understand what the story might be about before they begin to
read.
Writing
Pichette et al. (2012) found that written activities combined with reading showed more
growth than reading alone. This study was based on the hypothesis that production tasks ensure
the learner is using all of the skills at their disposal and building by experience. While it can be
said that you can read without writing, it is not possible to write without reading. Unfortunately,
there is not much research done on “phrasal vocabulary” learning (or teaching vocabulary as a

26 group of words rather than individually), but Schmitt (2008) feels that it is another area worth
focus when teaching vocabulary to students.
Correlations Between Lexical Knowledge and Comprehension
The challenge then becomes reading comprehension for longer texts and not just short
phrases. Additionally, while multiple studies agree that lexical knowledge affects reading
comprehension (Stahl & Nagy, 2006), it must also be questioned if the skill hindering the
production is the question itself or formulating the answer (Verhoeven, 2000). “There is…ample
evidence showing children’s word recognition ability to be strongly related to their reading
comprehension during the initial stages of learning to read…” (Droop & Verhoeven, 2003, p.
81). Schmitt (2008) warns that poor readers are those who understand less than 80 percent of the
text. This puts them into the poor reading category, and simply reading a text over and over will
not help them learn what the text means without specific vocabulary help. However, according to
Droop and Verhoeven (2003), that percentage only needs to be raised to 90 percent to make them
average readers. In other words, if 90 percent of the words are familiar to the learner, they can
usually figure out the remaining text. Also according to Droop and Verhoeven (2003), these
findings agree with a previous study done on L1 and L2 learns in the Netherlands. So, if 90
percent of the words cannot be easily recalled by the student, then learning the unknown words
becomes a much more difficult task. “If sub tasks, such as word meaning retrieval, do not take
place ‘automatically,’ they may therefore call for attentional capacity to the detriment of the
higher – order comprehension task” (Fukkink et al., 2005, p. 54). This again means that teachers
really need to match each student to the reading tasks they are given for the sake of
comprehension, and not assume that the classes can be easily divided into larger groups. Some
students may not fit into any of the assigned groups and either feel as if they are being pulled

27 back or forced to excel faster than they can produce results. This is again why monitoring
comprehension and talking to students becomes increasingly important.
Summary
All of this research combined can seem a lot to take in at one time, but it is not
impossible to create an effective teaching plan using almost all of these techniques. Increasing
vocabulary and reading exposure so that students can build the ability to speak, read and write
more clearly should help them in all parts of their education. Most of these areas such as sight
words, vocabulary growth and exposure to rich language do require a very hands-on approach to
classroom teaching that will probably be shaped differently depending on the strengths of each
teacher. There are multiple sources that teachers can also find to organize these areas of study.
Therefore, there are numerous ways in which this research could be applied to both L1 and L2
learners. And, according to the research, the increased exposure to extensive learning should
improve student performance.

28
III: Method
This study focused on how a reading instruction program using leveled readers, visual
images, and word play compared to the use of basal readers will affect reading scores.
Participants
The participants in this study were 41 second grade students divided into two separate
groups. All but two of the student participants were considered to be English language learners
and qualified for ESL services from the level of New-to-Country all the way to Advanced. The
economic backgrounds of these students varied greatly in both groups. All of the students lived
in a large city or the surrounding suburbs.
During the 2010 – 2011 school year, 16 of the participants were taught by an ESL
teacher, the second grade teacher, and a Title 1 reading teacher (This is a federally funded
reading program for students who have been identified as needing extra help in reading at
schools that qualify for this particular program.) who pulled five students out for the second half
of the period for extra reading help. The ESL teacher for the first year of the study changed in
January because a new teacher was hired.
During the 2011 – 2012 school year, 25 participants were taught by an ESL teacher, the
second grade reading teacher, a teaching assistant who was there for the first half of the class
daily, and a Title 1 reading teacher who pulled out a small group of five students for the second
half of the class period.
For the purpose of simplifying the information being presented in this study, the 16
students who participated in the 2010-2011 school year will be referred to as the control group.
This is because they were taught using a method that is very common in many classrooms. The
25 students who participated in the 2011-2012 school year will be referred to as the study group.

29 Materials
Basal Reader. The basal reader used by the control group in this study was a book
published by Houghton Mifflin Harcourt in Geneva, IL titled Trophies: just for you. The specific
book was the grade 2, 2005 edition. It was published as two halves labeled 2-1 and 2-2. The
first half of the basal reader, 2-1, was completed by the control group. The second half of the
basal reader, 2-2, was started by the control group, but not completed.
Grammar Book. The more advanced students in the study group and all but five of the
students in the control group (those 5 students were removed for Title 1 reading at the time when
the grammar lesson was given) were taught from the same second grade grammar workbook
with exercises and worksheets. Unfortunately, the specific detailed information of which series
was used as a grammar workbook was not retained.
Leveled Readers. Leveled readers from Scholastic were used in the study group. These
books covered a large variety of topics and were available for reading levels kindergarten
through sixth grade. The books used in this study did not exceed the fourth grade reading level.
Vocabulary. Students in the study group were presented with new vocabulary on a
weekly or bi-weekly basis. This vocabulary was theme based and presented in multiple formats
simultaneously. These groups of vocabulary word units each followed a theme that could either
be found in the leveled readers or a theme that could expand their understanding of topics in the
world around them. Because students’ needs varied, these word lists were determined as the class
progressed. Topics that were covered included the circus, street signs, and farms.

30
Sight Words. A list of sight words taken from the Internet for kindergarten through
grade three was used in the study group to help with fluency. These words were used often on
flashcards, in books and in word play.
Teacher Written Books. ESL Teacher-written books were used in the study group to
focus on and use vocabulary at levels lower than the beginning readers for New-to-Country
students. These books included the sight words, which had been previously learned, and the
vocabulary that was being used by the rest of the class.
Teacher Written Worksheets. In the study group, mind maps and reading questions
were written by the teachers and used to get students to think about what they read. Worksheets
also encouraged students to go back and re-read parts of the text.
Measures of Academic Progress Assessment. At the beginning and end of each school
year, all of the student participants were given the Northwest Evaluation Association (NWEA)
Measures of Academic Progress Interim Assessment (MAP assessment). This test is scored using
Rasch Units, also known as a RIT score.
Procedure
Because this study compared the improvement in RIT reading scores between two
different groups, the teaching methods used on each group were very different.
Control Group Procedure. The control group was taught from the grade 2 basal
reading textbook with little variation from the prescribed teaching plans and texts. They were
occasionally given craft projects to do, which were non-related to the reading text, just because
both teacher and students found the textbook to be uninteresting at times. All spelling and
vocabulary words were taken from the textbook. The teacher attempted to modify the grammar
workbook to the best of his ability so that most of the students could follow along during class.

31 This was a required action because of the range of reading abilities in the classroom. The only
ESL support offered during this reading program was a 60-minute pullout for new-to-country
students at a time that did not even match with the reading instruction period. Homework was
occasionally assigned, but the students often lost or did not complete the assignments. This class
was used as the control group, because it was an example of most reading and vocabulary
programs in public schools. This is not a reflection in any way on the ability of the teacher who
was doing the best he could with both the materials and available assistance he had been given
that year.
Study Group Procedure. The study group had a much more structured schedule.
During a 95-minute block class, the first 45-minutes of instruction on Monday, Wednesday, and
Friday were spent by dividing the students into reading levels and allowing them time to read
individually. This is when the leveled readers were used. More advanced readers were given the
freedom to find a comfortable spot to read, while struggling students were kept inside the
classroom. The classroom teacher and the teaching assistant circulated the room and asked
different students to read aloud to them. They also asked students comprehension questions
about each of the different texts. The lowest level ESL new-to-country students were pulled
aside in the classroom for the first part of the year, but later integrated into the reading program
with the other students once they reached a kindergarten reading level. At that point, the ESL
teacher also circulated the classroom to help with reading and comprehension.
In the study group, the second 45-minutes of Monday, Wednesday, and Friday were spent
dividing the class into 3 groups. The new-to-country students had a pull-out class that involved
word-play for work on sight words, phonics and vocabulary comprehension. Five other students

32 from the study group went to Title 1 reading instruction, and the remaining students worked on
grammar with the second grade teacher.
Tuesdays for the study group were spelling, vocabulary, and library days. The class
always began with the weekly spelling pre-test. There were four different pre-tests to give,
because the class was divided according to their reading levels into different spelling groups.
Lower level groups would get words more easily spelled by using phonics and sight words, while
higher level groups would get words from the vocabulary list for that week. The final test was
given every Friday before reading began. The spelling pre-test on Tuesdays was followed by
either the introduction of new vocabulary or the review of last week’s vocabulary. Reviews were
done in an interactive activity, such as a game, that varied from week to week. All of the
vocabulary words were given an image that was shown on the projector as the word was
introduced. These images were accompanied by discussions about how all of the words were
related to each other. Then, the words were written on the board and the students were asked to
copy it into their notebooks. The length of time spent on each topic was determined by the
difficulty of the words, required school breaks, and how much processing time was needed for
students to show comprehension. Additionally, some words were added to the vocabulary to
match the words students were showing the most difficulty understanding in their readers. The
second 45-minutes of the Tuesday class were spent divided into the three different reading
groups until students were called to the library.
Thursday was an instruction day in the study group. Students would be challenged with
problem solving, taught how to correctly answer questions on a worksheet, and shown how to do
whatever had shown a need for improvement over the course of the previous week. The first 45-
minutes of Thursdays were never the same as any other day because they were based on student

33 needs and task completion. For the second 45-minutes of Thursday, the class was divided into
the three different groups for specialized vocabulary or grammar instruction just as they did on
Monday, Wednesday and Friday.
Although the days when written activities occurred in the study group varied from week
to week, all of the students in this group were expected to participate in any written activities
done in the classroom. This included all levels of learners, even if that meant drawing a picture
rather than writing words.
Homework was never assigned to the study group. This was done partly because of the
varied nature of the class periods. It was also done because of the variety of home environments
in which some of the students were living. Parents were not always available to help at home and
in some families, basic needs were understandably a higher priority than school.
Assessment. Both the control group and the study group were assessed using the MAP
Reading assessment in the fall and spring of the corresponding school years. According to
NWEA - Measures of Academic Progress Interim Assessments for Grades K-12 (2015), the
MAP assessment uses a process called Item Response Theory. Item Response Theory means that
students are tested to see at what level of learning they are able to answer questions correctly
about 50 percent of the time. This way of testing is independent of any grade level markers and
is intended to identify the strengths and weaknesses of the students individually. NWEA (2016)
also states that the MAP assessment is adaptive to each student, so that the test changes based on
the individual student answers. This means that each student answers their own set of unique
questions while taking the test. NWEA (2016) also maintains that this is an interim assessment
that is given at more than one time each year to chart student growth over time. A series of units
called Rasch Units (also called a RIT score), are used to record and measure progress. RIT can

34 be thought of as a scale of measurement that is similar to an inch or a foot. The growth of each
student is based on the RIT progress between assessments. NWEA (2013) breaks the RIT score
up into seven parts: Overall RIT score, Phonological Awareness, Phonics, Concepts of Print,
Vocabulary and Word Structure, Comprehension, and Writing. This breakdown is examined in
more detail in the results.
The RIT reading scores and charted improvement from the control group were compared
to the RIT reading scores and charted improvement from the study group. The results of these
tests showed the difference in growth between the two classes.
Analysis
This study would be considered action research. This is because the research is
addressing a problem in the classroom by attempting to improve teaching methods. Because it
took a total of two years to collect the data used for this study, it would be difficult to gather
another round of data for a result comparison. Because of this, the study may not give solid
quantitative data, but it will give some insight into student learning. This is, therefore, a
qualitative study that shows how theory can be put into practice. It would, however, be
educational to see a similar study done at a later time to compare and contrast the results.
Before the scores could be used for comparison, students who had only been in the class
for part of the year, and therefore only had one set of scores, had to be removed. In doing this,
the data became a better reflection of the growth shown by students who had been present in the
classroom for the entire school year. A total of four students were removed from the original 20
students in the control group. This resulted in 16 students remaining in the study for the control
group results. Five of those remaining students in the control group were new-to-country English
language learners. In the study group, a total of three students were removed from the original

35 28. Two students were removed because they only attended the second half of the school year.
The other student was later removed because for unknown reasons he had attained two scores of
zero in the fall. This caused false readings in the overall mean and median measurements for the
entire class. These two measurements of zero also affected the individual measurements of
student growth in the spring, because it appeared that the student had grown from a score of zero
to a very high score in the spring. These removals resulted in 25 students remaining in the study
group results. Four of those students in the study group were also new-to-country English
language learners.
Individual, mean and median scores for both Fall (pre-study) and Spring (post-study) are
given for both groups in the results. In addition, each student’s change in score over the study
period was calculated (measured score at the end of the study (spring) minus measured score at
the beginning of the study(fall)). Statistical tests take into consideration that the number of
students in the control group are different than the study group. The changes in growth of the
control group versus the study group were compared statistically using a two tailed, two-sample
t-test assuming unequal variances to determine if the observed changes were statistically
relevant.
Finally, because NWEA presents all their normative data using the mean results from
their testing scores, those reported numbers were used to compare the students in the groups to
other students around the United States who take the same test.

36
IV:Results
In order to discuss what these results actually represent, it is important to first understand
how NWEA breaks down their average growth measurements. This explanation and number
reference was taken from the 2015 NWEA Measures of Academic Progress Normative Data
(2015) document that can be found on their website. Because this study focused on second grade
students, the information presented here will be about that age group. All of the data is presented
in a range with an expected amount of growth per year at the national level, so the results will
also be compared to that range. The expected score for second graders taking the MAP
assessment nation-wide in the fall ranges from 159.18 – 190.22 RIT. The expected score for
second graders taking the MAP assessment nation-wide in the spring ranges from 173.49 –
203.91 RIT. The average growth expected for each student at the national level is 14 RIT, but the
range of that expected growth can be between 5.8 – 22.2 RIT. The 2015 NWEA Measures of
Academic Progress Normative Data (2015) states that this mean measurement is based on the
total number of assessments that are given to all of their testing groups. To show where the
students in this study fall, compared to other students around the United States, colors have been
used in the tables. Pink indicates students who fall below the standard national second grade
level. Yellow indicates students who fall above the standard national second grade level.
The first recorded results are in the area of phonological awareness. NWEA (2013) states
that this part of the test covers blending, phoneme identification, phonemic manipulation of
sounds and syllabication, and rhyming.

37 Table 1: Individual Gains in Phonological Awareness
pink = below national average
yellow = above national average
Stu. Fall Spring Dif. Stu. Fall Spring Dif
C1* 122 125.5 3.5 S1 161 199 38
C2* 128 137 9 S2 155 192 37
C3* 134 150 16 S3 184 207 23
C4* 160.5 150.5 -10 S4 150 172 22
C5 145 148.5 3.5 S5* 141 152 11
C6 148.5 158.5 10 S6 191 205 14
C7* 166 171 5 S7* 149 152 3
C8 150 173.5 23.5 S9 147 187 40
C9 157 155 -2 S10* 150 171 21
C10 168.5 197.5 29 S11 158 178 20
C11 176.5 177.5 1 S12* 140 148 8
C12 177.5 189 11.5 S13 156 178 22
C13 176.5 185 8.5 S14 159 183 24
C14 176 193 17 S15 163 188 25
C15 221.5 193 -28.5 S16 168 170 2
C16 210.5 215.5 5 S17 150 161 11
Mean 6.375 S18 177 158 -19
Variance 166.578125 S19 155 174 19
SD 12.90651483 S20 159 185 26
S21 140 179 39
(*denotes New-to-Country) S22 175 181 6
S23 162 193 31
S24 151 172 21
S25 155 197 42
S26 147 161 14
Mean 20
Variance 191.36
SD 13.83329317

38 Table 1 presents the individual student test scores in the area of phonological awareness
for both the fall and the spring. It can be seen in Table 1 that in the control group, 43.8% of
students started the year with a score below the national average (NA) for fall of 159.18 – 190.22
RIT (pink scores) and 12.5% of students started the year with a score above the NA (yellow
scores). In the study group, 64% of students started the year with a score below the NA (pink
scores) and 4% of students started the year with a score above the NA (yellow scores). When the
year finished, the number of students below the NA for spring of 173.49 – 203.91 RIT in the
control group had risen to 50% (pink scores) and the number of students above the NA had fallen
to 6.3% (yellow scores). However, in the study group, the number of students below the NA had
fallen to 40% (pink scores) and the number of students above the NA had risen to 8% (yellow
scores). The table shows that one student in the control group and eight students in the study
group caught up to the average score of other second graders at the national level.
An independent sample t-test done on the individual gains of each group showed a
statistically significant difference (df=33, t=3.12, p<0.01) in the direction of the study group
(M=20, SD=13.83) outperforming the control group (M=6.38, SD=12.91) in phonological
awareness.

39
Fall Spring Growth
Control Mean 163.6 170 6.4
Control Median 163.3 172.3 9
Study Mean 157.7 177.7 20
Study Median 155 178 23
Figure 1: Mean and Median Growth in Phonological Awareness
Figure 1 presents the mean and median growth in the area of phonological awareness for
both groups. Mean growth in the control group showed an increase of 6.4 RIT, and mean growth
in the study group showed an increase of 20 RIT. Although both of these results are within the
NA range of 5.8 – 22.2 RIT for second grade growth, there is a 13.6 RIT increase in the study
group scores. Median growth in the control group showed an increase of 9 RIT, and median
growth in the study group showed an increase of 23 RIT. The results for the control group are
again within the NA for second grade growth, but the results for the study group surpass the NA.
There is a 14 RIT increase in the study group scores beyond those of the control group. Based on
140
145
150
155
160
165
170
175
180
Control Mean Control Median Study Mean Study Median
Fall Spring

40 these results and the NWEA average annual growth of 14 RIT, the overall growth in
phonological awareness in the study group was a full year higher than the control group.
The second recorded results are in the area of phonics. NWEA (2013) states that this part
of the test covers consonants, sound manipulation and syllabication, spelling patterns and
rhyming, and vowel patterns.

41 Table 2: Individual Gains in Phonics
pink = below national average
yellow = above national average
Stu. Fall Spring Dif. Stu. Fall Spring Dif
C1* 123 102.5 -20.5 S1 186 193 7
C2* 117.5 156 38.5 S2 163 197 34
C3* 132 151 19 S3 193 201 8
C4* 143.5 147 3.5 S4 161 166 5
C5 156.5 169.5 13 S5* 141 161 20
C6 147 172 25 S6 182 206 24
C7* 161 175 14 S7* 129 152 23
C8 168 178 10 S9 150 195 45
C9 142.5 152 9.5 S10* 130 176 46
C10 175.5 174 -1.5 S11 158 178 20
C11 176.5 189.5 13 S12* 132 150 18
C12 164 192.5 28.5 S13 160 189 29
C13 173.5 189.5 16 S14 170 168 -2
C14 189.5 198 8.5 S15 153 181 28
C15 204 209 5 S16 147 187 40
C16 206.5 211 4.5 S17 153 191 38
Mean 11.625 S18 161 187 26
Variance 165.671875 S19 161 171 10
SD 12.87135871 S20 162 175 13
S21 163 193 30
(*denotes New-to-Country) S22 154 180 26
S23 176 199 23
S24 163 174 11
S25 170 211 41
S26 111 148 37
Mean 24
Variance 166.32
SD 12.89651116

42 Table 2 presents the individual student test scores in the area of phonics for both the fall
and the spring. In the control group, 43.8% started the year with a score below the NA and
12.5% started the year with a score above the NA. In the study group, 44% started the year with
a score below the NA and 4% started the year with a score above the NA. When the year
finished, the number of students below the NA in the control group had remained unchanged at
43.8% and the number of students above the NA had also remained 12.5%. However, in the
study group the number of students below the NA had fallen to 28% while the number of
students above the NA had increased to 8%. The table shows that none of the control group
students caught up to the average score of other second graders at the national level. However,
seven students in the study group caught up to the average scores of other second graders at the
national level.
An independent sample t-test comparing the gains in both groups showed a statistically
significant difference (df=31, t=2.92, p<0.01) in the direction of the study group (M=24,
SD=12.90) outperforming the control group (M=11.63, SD=12.87) in phonics.

43
Fall Spring Growth
Control Mean 161.3 172.9 11.6
Control Median 162.5 174.5 12
Study Mean 157.2 181.2 24
Study Median 161 181 20
Figure 2: Mean and Median Growth in Phonics
Figure 2 presents mean and median growth in the area of phonics for both groups. Mean
growth in the control group showed an increase of 11.6 RIT, and mean growth in the study group
showed an increase of 24 RIT. The control group results are once again within the NA for
second grade growth, and the study group results once again surpass the NA. This is an 12.4
RIT increase in the study group scores beyond those of the control group. Median growth in the
control group showed an increase of 12 RIT, and median growth in the study group showed an
increase of 20 RIT. This is an 8 RIT increase in the study group scores beyond those of the
control group.
145
150
155
160
165
170
175
180
185
Control Mean Control Median Study Mean Study Median
Fall Spring

44 The third recorded results are in the area of concepts of print. NWEA (2013) states that
this part of the test covers developmental reading skills, developmental writing skills, and
environmental print.

45 Table 3: Individual Gains in Concepts of Print
pink = below national average
yellow = above national average
Stu. Fall Spring Dif. Stu. Fall Spring Dif
C1* 118 104.5 -13.5 S1 146 192 46
C2* 125 142.5 17.5 S2 161 179 18
C3* 126.5 149.5 23 S3 153 191 38
C4* 141.5 153 11.5 S4 153 151 -2
C5 134.5 142.5 8 S5* 136 146 10
C6 139 185 46 S6 209 174 -35
C7* 168 163.5 -4.5 S7* 123 164 41
C8 167 184.5 17.5 S9 156 182 26
C9 165 168 3 S10* 146 189 43
C10 176 189.5 13.5 S11 159 184 25
C11 179 176.5 -2.5 S12* 124 155 31
C12 168.5 185 16.5 S13 153 194 41
C13 183.5 166 -17.5 S14 149 191 42
C14 200.5 172 -28.5 S15 156 177 21
C15 181 199.5 18.5 S16 170 190 20
C16 192 175.5 -16.5 S17 151 183 32
Mean 5.75 S18 139 154 15
Variance 333.125 S19 156 174 18
SD 18.25171225 S20 158 178 20
S21 158 175 17
(*denotes New-to-Country) S22 160 184 24
S23 161 182 21
S24 170 182 12
S25 166 193 27
S26 125 154 29
Mean 23.2
Variance 273.12
SD 16.52634261

46 Table 3 presents the individual test score results in the area of concepts of print. In the
control group, 37.5% started the year with a score below the NA and 12.5% started the year with
a score above the NA. In the study group, 72% started the year with a score below the NA and
4% started the year with a score above the NA. When the year finished, the number of students
below the NA in the control group had increased to 56.3% and the number of students above the
NA had fallen to 0%. In the study group, the number of students below the NA had fallen to
24%, but the number of students above the NA had also fallen to 0%. The table shows that 1
student in the control group and 12 students in the study group caught up to the average score of
other second graders at the national level.
An independent sample t test comparing the gains in both groups showed a statistically
significant difference (df=29, t=3.01, p<0.01) in the direction of the study group (M=23.2,
SD=16.53) outperforming the control group (M=5.75, SD=18.25) in concepts of print.
47
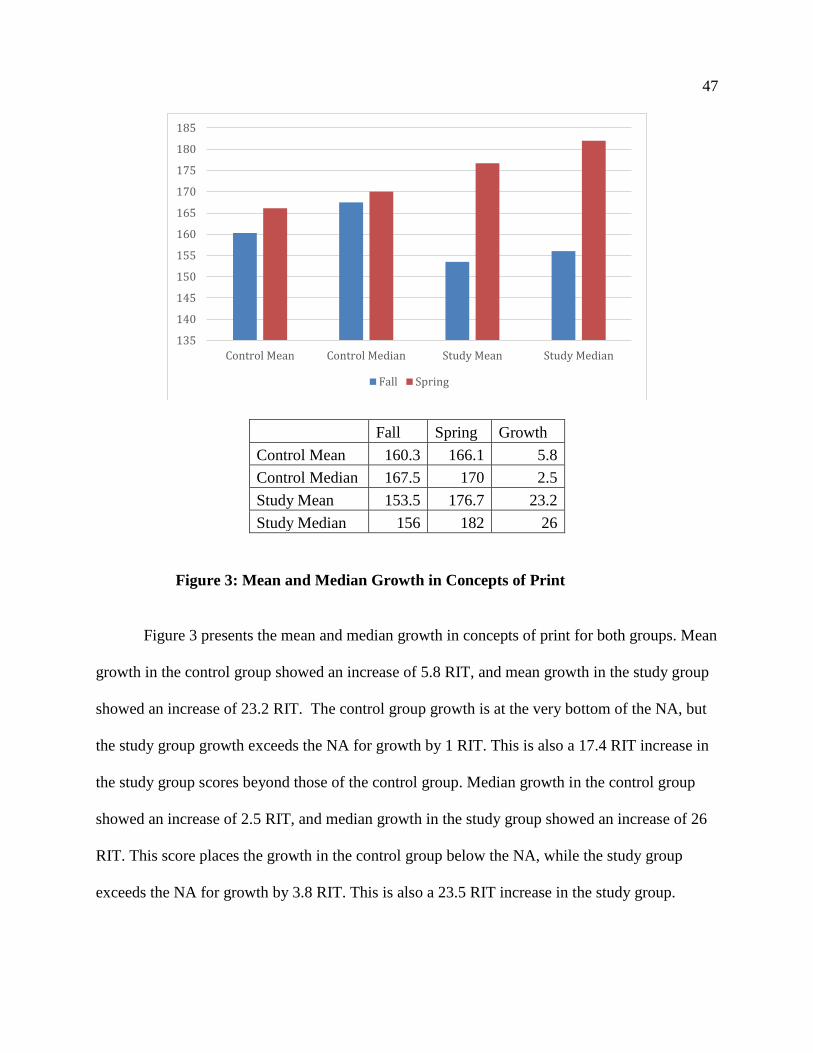
Fall Spring Growth
Control Mean 160.3 166.1 5.8
Control Median 167.5 170 2.5
Study Mean 153.5 176.7 23.2
Study Median 156 182 26
Figure 3: Mean and Median Growth in Concepts of Print
Figure 3 presents the mean and median growth in concepts of print for both groups. Mean
growth in the control group showed an increase of 5.8 RIT, and mean growth in the study group
showed an increase of 23.2 RIT. The control group growth is at the very bottom of the NA, but
the study group growth exceeds the NA for growth by 1 RIT. This is also a 17.4 RIT increase in
the study group scores beyond those of the control group. Median growth in the control group
showed an increase of 2.5 RIT, and median growth in the study group showed an increase of 26
RIT. This score places the growth in the control group below the NA, while the study group
exceeds the NA for growth by 3.8 RIT. This is also a 23.5 RIT increase in the study group.
135
140
145
150
155
160
165
170
175
180
185
Control Mean Control Median Study Mean Study Median
Fall Spring

48 Based on these results, the study group showed over a full year of growth beyond the control
group in the area of concepts of print.
The fourth recorded results are in the area of vocabulary and word structure. NWEA
(2013) states that this part of the test covers content vocabulary and context clues, base words,
prefixes, suffixes, sight words, synonyms, antonyms, homonyms, homographs, homophones,
compound words, and contractions.

49 Table 4: Individual Gains in Vocabulary and Word Structure
pink = below national average
yellow = above national average
Stu. Fall Spring Dif. Stu. Fall Spring Dif
C1* 108 116 8 S1 185 162 -23
C2* 120 155 35 S2 178 164 -14
C3* 130 159.5 29.5 S3 176 181 5
C4* 115.5 153 37.5 S4 153 162 9
C5 147.5 160.5 13 S5* 145 150 5
C6 164 149.5 -14.5 S6 159 185 26
C7* 159.5 161 1.5 S7* 136 161 25
C8 162 169 7 S9 175 166 -9
C9 170 160 -10 S10* 142 163 21
C10 167 172.5 5.5 S11 163 168 5
C11 169.5 180.5 11 S12* 136 150 14
C12 154.5 184.5 30 S13 175 181 6
C13 169.5 187 17.5 S14 161 194 33
C14 186.5 196 9.5 S15 152 169 17
C15 180 192.5 12.5 S16 167 178 11
C16 195 198.5 3.5 S17 162 183 21
Mean 12.28125 S18 153 178 25
Variance 206.1865234 S19 164 174 10
SD 14.35919648 S20 177 184 7
S21 166 175 9
(*denotes New-to-Country) S22 161 180 19
S23 178 185 7
S24 166 170 4
S25 172 165 -7
S26 137 156 19
Mean 9.8
Variance 166.64
SD 12.90891165

50 Table 4 presents the individual test scores in the area of vocabulary and word structure. In
the control group, 37.5% started the year with a score below the NA and 6.3% started the year
with a score above the NA. In the study group, 36% started the year with a score below the NA
and 0% started the year with a score above the NA. When the year finished, the number of
students below the NA in the control group had increased to 62.5% and the number of students
above the NA had fallen to 0%. In the study group, the number of students below the NA had
increased to 52% while the number of students above the NA had remained 0%. This was not a
good area of growth for either group. Both groups showed an increase in the number of students
falling below the NA for vocabulary and word structure. However, the table does show that one
student in the control group and two students in the study group caught up to the average score of
other second graders at the national level.
An independent sample t test comparing the gains in each group showed no statistically
significant difference (df=29, t=-0.55, p>0.01) between the study group (M=9.8, SD=12.91) and
the control group (M=12.28, SD=14.36) in vocabulary and word structure.

51
Fall Spring Growth
Control Mean 156.2 168.4 12.2
Control Median 163 165 2
Study Mean 161.6 171.4 9.8
Study Median 163 170 7
Figure 4: Mean and Median Growth in Vocabulary and Word Structure
Figure 4 presents the mean and median growth in vocabulary and word structure for both
groups. Mean growth in the control group showed an increase of 12.2 RIT, and mean growth in
the study group showed an increase of 9.8 RIT. This is a 2.4 RIT decrease in the study group.
Although both of these results are within the NA, they are both on the low end of growth.
Median growth in the control group showed an increase of 2 RIT, and median growth the study
group showed an increase of 7 RIT. Again, these are low numbers for both groups. The control
group fell below the NA by 3.8 RIT, while the study group also stayed on the low end of the NA.
This is only a 5 RIT increase in the study group scores over the control group.
145
150
155
160
165
170
175
Control Mean Control Median Study Mean Study Median
Fall Spring

52 The fifth recorded results are in the area of comprehension. NWEA (2013) states that
this part of the test covers literal comprehension, interpretive comprehension, and evaluative
comprehension.

53 Table 5: Individual Gains in Comprehension
pink = below national average
yellow = above national average
Stu. Fall Spring Dif. Stu. Fall Spring Dif
C1* 124.5 120.5 -4 S1 181 183 2
C2* 130 132 2 S2 153 156 3
C3* 129.5 170.5 41 S3 161 178 17
C4* 128 153.5 25.5 S4 144 165 21
C5 133 149 16 S5* 116 159 43
C6 147.5 159 11.5 S6 175 199 24
C7* 153 162 9 S7* 129 155 26
C8 162 186.5 24.5 S9 136 177 41
C9 174.5 180 5.5 S10* 145 178 33
C10 168 186.5 18.5 S11 167 160 -7
C11 168 178.5 10.5 S12* 136 142 6
C12 183 177.5 -5.5 S13 175 176 1
C13 174.5 189.5 15 S14 172 180 8
C14 186.5 204.5 18 S15 146 165 19
C15 187 189.5 2.5 S16 162 174 12
C16 181.5 203 21.5 S17 127 163 36
Mean 13.21875 S18 166 173 7
Variance 134.717773 S19 155 176 21
SD 11.6067985 S20 163 178 15
S21 170 179 9
(*denotes New-to-Country) S22 158 168 10
S23 165 174 9
S24 151 154 3
S25 157 173 16
S26 147 154 7
Mean 15.28
Variance 160.7616
SD 12.6791797

54 Table 5 presents the individual scores for both groups in comprehension. In the control
group, 43.8% started the year with a score below the NA and 0% started the year with a score
above the NA. In the study group, 56% started the year with a score below the NA and 0%
started the year with a score above the NA. When the year finished, the number of students
below the NA in the control group had remained unchanged at 43.8% and the number of students
above the NA had increased to 6.3%. In the study group, the number of students below the NA
had fallen to 52% while the number of students above the NA had remained 0%. The table shows
that no students in the control group and three students in the study group caught up to the
average score of other second graders at the national level.
An independent sample t test comparing the growth in both groups showed no
statistically significant difference (df=33, t=0.52, p>0.01) between the study group (M=15.28,
SD=12.68) and the control group (M=13.22, SD=11.61) in comprehension.

55
Fall Spring Growth
Control Mean 158.2 171.4 13.2
Control Median 165 178 13
Study Mean 154.3 169.6 15.3
Study Median 157 173 16
Figure 5: Mean and Median Growth in Comprehension
Figure 5 presents the mean and median growth in the area of comprehension. Mean
growth in the control group showed an increase of 13.2 RIT, and mean growth in the study group
showed an increase of 15.3 RIT. Both of these scores fall within the average to high NA range.
This is only a 2.1 RIT increase in the study group scores over the control group. Median growth
in the control group showed an increase of 13 RIT, and median growth in the study group
showed an increase of 16 RIT. These scores again fall into the average growth rate for the NA.
This is also a 3 RIT increase in the study group beyond the control group. These results show the
overall growth of both groups in comprehension were very similar.
140
145
150
155
160
165
170
175
180
Control Mean Control Median Study Mean Study Median
Fall Spring

56 The sixth recorded results are in the area of writing. NWEA (2013) states that this part
of the test covers writing process, language structure (phrase, sentence, and paragraph),
conventions of language, and grammatical patterns.

57 Table 6: Individual Gains in Writing
pink = below national average
yellow = above national average
Stu. Fall Spring Dif. Stu. Fall Spring Dif
C1* 119 128 9 S1 194 177 -17
C2* 139 161.5 22.5 S2 174 185 11
C3* 138 151 13 S3 158 185 27
C4* 136 152.5 16.5 S4 155 178 23
C5 138.5 139 0.5 S5* 159 167 8
C6 160.5 161 0.5 S6 189 197 8
C7* 155 168 13 S7* 158 145 -13
C8 158.5 185.5 27 S9 145 174 29
C9 157.5 207.5 50 S10* 151 163 12
C10 159.5 178 18.5 S11 179 164 -15
C11 170 172.5 2.5 S12* 144 141 -3
C12 191.5 183 -8.5 S13 184 182 -2
C13 182.5 193 10.5 S14 167 175 8
C14 189.5 196.5 7 S15 141 162 21
C15 192.5 187 -5.5 S16 156 169 13
C16 183 200 17 S17 148 167 19
Mean 12.09375 S18 159 160 1
Variance 186.631835 S19 174 180 6
SD 13.6613262 S20 176 179 3
S21 167 187 20
(*denotes New-to-Country) S22 172 186 14
S23 153 183 30
S24 152 147 -5
S25 161 181 20
S26 146 155 9
Mean 9.08
Variance 168.3936
SD 12.97665596

58 Table 6 presents the individual scores for both groups in writing. In the control group,
50% started the year with a score below the NA and 12.5% started the year with a score above
the NA. In the study group, 53.8% started the year with a score below the NA and 4% started
the year with a score above the NA. When the year finished, the number of students below the
NA in the control group had remained unchanged at 50% and the number of students above the
NA had fallen to 6.3%. In the study group, the number of students below the NA had fallen to
44% while the number of students above the NA had fallen to 0%. The table shows that one
student in the control group and four students in the study group caught up to the average score
of other second graders at the national level.
An independent sample t test comparing the gains in both groups showed no statistically
significant difference (df=30, t=-0.68, p>0.01) between the study group (M=9.08, SD=12.98)
and the control group (M=12.09, SD=13.66) in writing.

59
Fall Spring Growth
Control Mean 160.7 172.8 12.1
Control Median 159 175.3 16.3
Study Mean 162.5 171.6 9.1
Study Median 159 175 16
Figure 6: Mean and Median Growth in Writing
Figure 6 presents the mean and median growth for both groups in the area of writing.
Mean growth in the control group showed an increase of 12.1 RIT, and mean growth in the study
group showed an increase of 9.1 RIT. Again, both of these scores fall within the average range
of the NA. This is a 3 RIT decrease in the study group below the control group. Although this is
some growth, it is close enough that there is not a large difference in scores. Median growth in
the control group showed an increase of 16.3 RIT, and median growth in the study group showed
an increase of 16 RIT. This is also within the average growth rate for the NA. This is a 0.3 RIT
decrease in the study group below the control group. When all of these scores are put together,
the combined RIT reading scores show more growth in the study group.
150
155
160
165
170
175
180
Control Mean Control Median Study Mean Study Median
Fall Spring

60 Table 7: Individual Gains in Combined RIT Scores
pink = below national average
yellow = above national average
Stu. Fall Spring Dif. Stu. Fall Spring Dif
C1* 118 115 -3 S1 175 183 8
C2* 127 147 20 S2 165 179 14
C3* 131 155 24 S3 170 190 20
C4* 134.5 152 17.5 S4 152 166 14
C5 142 152 10 S5* 137 156 19
C6 151 165 14 S6 182 196 14
C7* 160 167 7 S7* 134 155 21
C8 161 179 18 S9 151 179 28
C9 162 169 7 S10* 144 174 30
C10 169 183 14 S11 164 172 8
C11 173 179 6 S12* 135 148 13
C12 174 184 10 S13 167 183 16
C13 177 186 9 S14 164 181 17
C14 188 195 7 S15 153 174 21
C15 195 193 -2 S16 161 177 16
C16 195 203 8 S17 149 174 25
Mean 10.41 S18 158 168 10
Variance 50.41308594 S19 161 175 14
SD 7.100217316 S20 166 180 14
S21 161 181 20
(*denotes New-to-Country) S22 164 180 16
S23 165 186 21
S24 158 166 8
S25 163 183 20
S26 137 155 18
Mean 17
Variance 31.6
SD 5.621387729

61 Table 7 presents the individual RIT scores of both groups in the combined MAP reading
assessment. In the control group, 37.5% started the year with a score below the NA and 12.5%
started the year with a score above the NA. In the study group, 44% started the year with a score
below the NA and 0% started the year with a score above the NA. When the year finished, the
number of students below the NA in the control group had increased to 50% and the number of
students above the NA had fallen to 0%. In the study group, the number of students below the
NA had fallen to 32% while the number of students above the NA had remained 0%. The table
shows that no students in the control group and four students in the study group caught up to the
average score of other second graders at the national level.
An independent t test comparing the individual gains of both groups showed a
statistically significant difference (df=26, t=3.05, p<0.01) in the direction of the study group
(M=17, SD=5.62) outperforming the control group (M=10.41, SD=7.10) in overall RIT scores.

62
Fall Spring Growth
Control Mean 159.8 170.3 10.5
Control Median 161.5 174 12.5
Study Mean 157.4 174.4 17
Study Median 161 177 16
Figure 7: Mean and Median Growth in Overall RIT Scores
Figure 7 presents the mean and median growth for both groups in the combined RIT
reading assessment scores. Mean growth in the control group showed an increase of 10.5 RIT,
and mean growth in the study group showed an increase of 17 RIT. This is a 6.5 RIT increase in
the study group beyond the control group. This is not a large difference based on the NA.
Median growth in the control group showed an increase of 12.5 RIT, and median growth in the
study group showed an increase of 16 RIT. This is a 3.5 RIT increase in the study group beyond
the control group. This difference is within the NA.
145
150
155
160
165
170
175
180
Control Mean Control Median Study Mean Study Median
Fall Spring

63
V. Discussion
The overall results of changing the teaching method from intensive reading in a basal
reader to extensive reading in leveled readers and context vocabulary in the classroom were
mixed. The study group did show equal or better scores on most parts of the MAP assessment.
Additionally, on those parts of the assessment where the study group did not surpass the control
group, the scores were very close. It is interesting to examine why some parts of the assessment
showed higher gains than other parts.
To understand the results, it is important to look back at what parts of the assessment
were specifically addressed in the teaching methods used by both groups. To begin with,
phonological awareness was the first area of growth comparison. The study group surpassed the
control group scores in this area of the test by a full year of growth. Because the methods used to
teach the control group did not involve any kind of phonological work, higher scores in the study
group make perfect sense. Basal readers at the second-grade level do not usually teach phonics.
It is assumed by most educators that L1 students have already learned the basic phonics at this
level of their education. The study group, however, did receive some phonological work.
Training was specifically given to those students who were pulled out for the smaller groups
while the more advanced groups were working on grammar. These smaller groups within the
study group made up almost half of the class. Additionally, large group activities covered topics
such as syllables and rhyming. The amount of time given to sounds and sound manipulation in
general would explain the statistically significant growth in the area of phonological awareness.
The second area of comparison was phonics. This area of the test also showed the study
group gaining a half year of growth beyond the scores of the control group. This growth can
equally be attributed to the amount of time the study group spent on learning phonics. Also, the

64 phonological focus of the spelling tests for the lower levels in the study group would explain the
statistically significant growth in this area.
The next area of the test is concepts of print. As noted previously, this area covers
developmental reading skills, developmental writing skills, and environmental print. This area
also showed the study group shooting ahead of the control group with over a full year of growth
in the results. This is also the area of the study where the study group showed the highest number
of students returning to the national average of other second grade students who take the same
test. This gain also makes sense. Students in the study group were each assigned books they
could understand and read at their own developmental level. Therefore, they were developing
their reading skills at the appropriate level and not being forced to attempt comprehension of a
text that was more advanced. The control group students were all forced to read the same book
and try to make sense of it. The growth in developmental writing skills can also be explained by
the teaching method. In the study group, all the students at every level were part of any writing
activity, even if it meant they were just going to draw a picture to show their understanding.
Later, those students who had been drawing pictures began to use words, and eventually
sentences, in their writing assignments. In the control group, only the more advanced students
were expected to participate in the writing activities. Students who could not understand the
writing assignments in the control group were given a different activity to complete that was not
related to the story at all. The growth shown for the study group in environmental print makes
sense too. Many of the pictures used for the study group were taken off the Internet to show
things in the real world around them, things they would recognize. A unit on traffic signs and
signs that could be seen on the street or in parks is a perfect example of this. The context
vocabulary presented in the study group was aimed at addressing things they would understand

65 in the world around them. The control group, in contrast, was only exposed to the pictures
selected by the company who assembled the reader. The students in the control group might have
had a connection to some of the pictures and stories they read, but the lessons were not as
tailored to the control group’s needs.
The growth in the remaining three areas did not show a statistical difference, however.
Growth for both groups in the area of vocabulary and word structure was actually quite
surprising. This was mostly a surprise because the study group was exposed to huge amounts of
vocabulary, and the control group was only exposed to vocabulary presented in the basal reader.
Additionally, the study group was presented with sight words on a regular basis and practiced the
use of affixes. In the control group, there was no sight word instruction and the introduction of
affixes was reserved only for those children who were doing the grammar work. These
differences in method but not in gains were actually the most unexpected results of this study.
There was also very little difference between the groups in the testing area of
comprehension. The lack of gains in this area for both groups can possibly be explained. Because
this part of the test focused on interpreting and evaluating, there are a couple of reasons this
could have happened. The first reason is that most of the story questions that were used for
reading comprehension in both groups did not ask for an interpretation of the story, but rather a
literal example of what took place in the story. This means that the students in both classes were
being tested in a way that made them more like a recording devise for their memory than actually
making them think about the implications those literal facts might hold and interpreting them. In
retrospect, this should be changed for any future classes using this method if students are
expected to make better gains in this area. The second reason the study group possibly has
similar scores to the control group could be the reading level of the stories being used in the

66 study group. Many of the books were still at a phonetic level and, as any teacher can tell you,
there is not a lot to interpret from a phonetically written story.
In the testing area of writing, there also seemed to be little difference in growth if the
numbers are compared. The similarity of growth in this area could also be attributed to the way
the method was taught. Even though all the students in the study group were participating in the
written activities, those activities did not take up a large part of the class time. Also, half of the
study group students were in the groups that were pulled out and did not experience any of the
grammar lessons. The main focus of those pull-out groups was on building reading ability and
phonics.
The similar results in these last three areas call a few questions to mind. The first
question: Did the study group move to quickly to pick up all the information that was taught? In
other words, did we give them so much information on this topic without the proper scaffolding
that they did not retain the information? The second question: Were the students ready for that
part of the test developmentally? Most readers at the second-grade level are reading to learn how
to read. They are not reading to learn the content of the text. These last three testing areas might
have been an unfair measurement for both groups. This may especially be true for the groups
used in this study, because the majority of the classrooms were L2 students in both groups. Last:
What external factors could have been unaccounted? The amount of difference between the
groups is so small that it could have been caused by factors beyond the teaching method. It
would be interesting to see if the results would vary if this method were to be done again on a
different group of students.
Overall, however, according to the results in the combined RIT score, the method used in
the study group was statistically successful. By presenting the vocabulary in context, increasing

67 the reading time of the students, selecting topics that corresponded with many of the stories they
were reading in class, and setting up a structured schedule that the students could follow, the
overall scores did improve. Although the amount of improvement in some areas was not as great
as in other areas, the difference was large enough in the first three areas to cause the overall
scores to be statistically noticeable.
If this method were to be replicated, it would be recommended that a few things could be
changed to check for improvement. First, it might help to add additional time for written
activities. This might help improve the writing scores. Second, the questions for the stories that
are used in the classroom should include content that will make the students infer meaning if
possible. This could help increase their comprehension skills. In addition, activities aimed at
provoking independent thought and interpretation of the characters or stories would benefit
students for future use, especially in more advanced reading classes. Third, the context
vocabulary presented for each unit should be narrowed down so that not as much is being
presented at once. If the students are given a smaller number of words to memorize and keep
track of, they might remember the meanings more easily. This is not to say that the other words
should not be introduced, it is only a suggestion that the group of words that are focused upon for
that unit should be more specific and only include some of the extensive vocabulary in each of
the topics.
Not all of the method needs improvement, however. The results show very clearly that
focusing on phonics and phonological awareness is very important for L2 learners at this level.
The use of basal readers in a traditional setting did not help these students excel in those areas at
all. Similarly, the extensive reading helped the students become more comfortable with concepts
of print. These things have proven to be beneficial to the L2 students in the study group.

68 Limitations of the Study
It is important to keep in mind while reviewing these results that because this is action
research based on the application of methodology, there are far too many variables to consider all
of them. Real life is never the same twice, especially when talking about a class of second
graders. Many of these variables happen outside the classroom and are completely out of the
teacher’s control. Differences in previous instruction, home environment, illnesses contracted
throughout the year, and texts chosen in part by the students both in and out of the classroom are
only some of the variables that could alter the outcome of some of these results.
Things that happened in the classroom could also not always be accounted for. How well
a student performs on tests can vary from one student to another. One student in the study group
scored a 0 for both comprehension and writing in the fall assessment, but had otherwise scored
above the national average on all other parts of the test. While it can be assumed the student was
absent for that part of the assessment or had to leave for some unknown reason, it could be
equally possible that the student simply stopped answering the assessment questions for those
parts. Additional factors, such as discussions that happened in the classroom and outside of the
reading lessons, could have played a part in these differences as well. There were simply too
many variables to isolate.
However, the fact that the study group results show overall growth beyond that of the
control group, there might be reasonable grounds to use the methodology that was used in the
study group once again. The significant differences in phonological awareness, phonics and
concepts of print could also guide teachers to improve their own methods and lessons. This is
especially true for teachers with L2 students.

69
VI. Conclusion
This study does show that increased reading time with extensive reading and context
vocabulary instruction does improve reading scores. This change is especially significant in the
areas of phonological awareness, phonics and concepts of print. When the scores were broken
down, they also showed that in the areas of Vocabulary and Word Structure, Comprehension,
and Writing, where the study group did not do significantly better than the control group, the
study group did at least stay at about the same level of growth as the control group. Because this
was a qualitative study looking for overall results, the data included in this study cannot
sufficiently explain why these differences occurred within the assessment. As hypothesized when
this study was started, the methods that were used in the study group showed better results than
the traditional teaching method used in the control group. It will be interesting to see where and
if these results see further implementation and testing. It will also be educational to see what
changes are made to the methods to improve on those areas that did not show as much growth,
and how they might affect the results in future studies. Future studies might also determine if the
areas of similar growth were due to method or developmental level, and help to answer some of
the questions brought to light by this study.

70
References
Akamatsu, N. (2008). The effects of training on automatization of word recognition in English as
a foreign language. Applied Psycholinguistics, 29, 175-193.
Anderson, R. Wilson, P., & Fielding, L. (1988). Growth in reading and how children spend their
time outside of school. Reading Research Quarterly, 23, 285-303.
Astorga, M. C. (1999). The text-image interaction and second language learning. The Australian
Journal of Language and Literacy, 22(3), 212-274.
Bialystock, E. (2001). Bilingualism in development: language, literacy, & cognition. New York,
NY: Cambridge Univeristy Press.
Bowey, J. (2005). Predicting individual differences in learning to read. In M. Snowling& C.
Hulme (Eds.), The science of reading (p. 155-172). Malden, MA: Blackwell.
Droop, M., & Verhoeven, L. (2003). Language proficiency and reading ability in first- and
second-language learners. Reading Research Quarterly, 38, 78-103.
Freeman, D., & Freeman, Y. (2012). Effective reading instruction for English language learners.
In Z. Han, & N. J. Anderson (Eds.), Second language reading research and instruction:
crossing the boundaries (pp. 102-116). Ann Arbor, MI: The University of Michigan
Press.
Fukkink, R., Hulstijn, J., & Simis, A. (2005). Does training in second-language word recognition
skills affect reading comprehension? An experimental study. The Modern Language
Journal, 89, 54-75.
Gass, S., & Mackey, A. (2008). Data elicitation for second and foreign language research. New
York, NY: Routledge Taylor & Francis Group.

71 Grabe, W. (2010). Fluency in reading – Thirty-five years later. Reading in a Foreign Language,
22(1), 71-83.
Guthrie, J., Wigfield, A., Metsala, J., & Cox, K. (1999). Motivational and cognitive predictors of
text comprehension and reading amount. Scientific Studies of Reading, 3, 231-256.
Hammond, K., & Danaher, K. (2011). The value of targeted comic book readers. ELT Journal,
66(2), 193-204.
Iwahori, Y. (2008). Developing reading fluency: A study of extensive reading in EFL. Reading
in a Foreign Language, 20, 70-91.
Levy, B., Abello, B., and Lysynchuk, L. (1997). Transfer from word training the reading in
context: Gains in reading fluency and comprehension. Learning Disabilities Quarterly,
20, 173-188.
Nation, I. S. P. (1997). The language learning benefits of extensive reading. The Language
Teacher, 21(5), 13-16.
Northwest Evaluation Association (2013). Measures of academic progress (MAP) for primary
grades crosswalk. Retrieved from
https://www.nwea.org/content/uploads/2013/07/MAPforPrimaryGradesCrosswalk_0.pdf
Northwest Evaluation Association (2015). NWEA – measures of academic progress interim
assessment for grades K-12. Retrieved from
https://in.lcms.org/wpcontent/uploads/2016/09/NWEA-Overview-of-Services.pdf
Northwest Evaluation Association (2015). 2015 NWEA measures of academic progress
normative data. Retrieved from https://www.nwea.org/content/uploads/2015-MAP-
Normative-Data-AUG15.pdf

72 Northwest Evaluation Association (2016). NWEA – a parent’s guide to MAP. Retrieved from
https://www.nwea.org/content/uploads/2011/07/A-Parents-Guide-to-Map-.pdf
Palmer, B. C., Zhang, N., Taylor, S. H., & Leclere, J. T. (2010). Language proficiency, reading,
and the Chinese-speaking English language learner: facilitating the L1-L2 connection.
Multicultural Education, 17(2), 44-51.
Pichette, F., Serres, L., & Lafontaine, M. (2012). Sentence reading and writing for second
language vocabulary acquisition. Applied Linguistics, 33 (1), 66-
82.doi:10.1093/applin/amr037
Schmitt, N. (2008). Instructed second language vocabulary learning. Language Teaching
Research, 12, 329-363.
Stahl, S., and Nagy, W. (2006). Teaching Word Meanings. Mahwah, NJ: L. Erlbaum.
Verhoeven, L. (2000). Components of early second language reading and spelling.Scientific
Studies of Reading, 4, 295-311.