how do students’ mathematics self-efficacy, mathematics
TRANSCRIPT

How Do Students’ Mathematics Self-Efficacy, Mathematics Self-Concept and Mathematics Anxiety
Influence Mathematical Literacy?
— A Comparison between Shanghai-China and Sweden
in PISA 2012
Yi Ding
Thesis: 30 credits Department: The Department of Education and Special Education Level: Second cycle (advanced) Term/year: Spring 2016 Supervisor: Kajsa Yang Hansen Examiner: Rolf Lander Rapport nr: VT16 IPS PDA184:11

Abstract Thesis: 30 credits Program and/or course: International Master’s Program in Educational Research Level: Second cycle (advanced) Term/year: Spring 2016 Supervisor: Kajsa Yang Hansen Examiner: Rolf Lander Keywords: Mathematical literacy, Mathematics self-efficacy, Mathematics self- concept, Mathematics anxiety, ESCS, Shanghai-China, Sweden, Structural Equation Modelling, Parcelling, PISA Aim: The aim of this thesis is to examine the differences in the influence of student’s Mathematics self-efficacy, Mathematics self-concept and Mathematics anxiety on their mathematical literacy between Shanghai-China and Sweden, while taking students’ economic, social and cultural status (ESCS) into consideration. Theory: Social cognitive theory proposed by Bandura (2011) indicates self-efficacy is regarded as individuals’ conviction of their capability of solving issues and pursuing desirable achievement. Self-concept and anxiety are closely related to self-efficacy according to recent research. In PISA 2012, the related constructs in Mathematics are Mathematics self-efficacy, Mathematics self-concept and Mathematics anxiety. Method: Structural Equation Modelling (SEM) is applied to the data analysis with the help of Statistic Software Program SPSS and Mplus. Applying data from the Programme For International Student Assessment (PISA) 2012, measurement properties of students’ Mathematics self-efficacy, Mathematics self-concept, and Mathematics anxiety are explored in the two education systems. The underlying dimensions in these aforementioned constructs are captured in terms of latent variables. These identified latent variables are in a later step related to mathematical literacy achievement. Results: Mathematics self-efficacy is found to be the strongest factor of students’ mathematical literacy in both Shanghai-China and Sweden. Mathematics anxiety has a negative effect contribution to mathematical literacy in these two countries. Compared with Sweden, students from Shanghai-China have a higher level of Mathematics self-efficacy, but lower levels of Mathematics self-concept contributing to higher mathematical literacy. Students’ economic, social and cultural status plays a more important role in influencing Mathematics literacy in Sweden.

Acknowledgements Writing this thesis has been both joy and pain for me, enjoying digging new findings and being tortured by data analysis. I am grateful to enroll in the IMER program, which gives me opportunities to step into a brand new field of Educational Research. I would like to thank Ms. Kajsa Yang-Hansen. As my supervisor, she is always there for me, being so patient and supportive whenever I have come across problems. I would like to thank Mr. Rolf Lander. I appreciate his comments and suggestions during the examination seminar, which help me to improve the final version of my thesis. I would like to thank all the lecturers of the IMER program, especially Ms. Ilse Hakvoort and Mr. Ernst Thoutenhoofd for the extra lecture helping me through the first assignment. I would like to thank my IMER friends, for their care and concern. I would like thank my dear boyfriend Zhizheng Wang for his inspiration and encouragement, for standing by my side and for sweet company. I am grateful for my parents Junying Ma and Chunhong Ding, for their love, their financial support and for everything they devoted to my growth. Yi Ding Gothenburg, Sweden May 2016
致我亲爱的爸爸妈妈!

Content
1. Introduction 1
2. Literature Study 2
2.1 Mathematical literacy 3
2.2 Mathematics self-efficacy 4
2.3 Mathematics self-concept 5
2.4 Mathematics anxiety 6
2.5 Economic, social and cultural status (ESCS) 7 3. Education systems 7
4. Research Questions and Hypotheses 8
5. Methodology 9
5.1 Samples and data 9
5.1.1 Data source 9
5.1.2 Reliability and validity of data source 10
5.1.3 Sample and sampling strategy in PISA 2012 11
5.1.4 Variables and variable parcels 11
5.1.5 Reliability and validity of data analysis 16
5.2 An introduction to SEM with application in educational research 16
5.3 SEM modelling 18
5.3.1 Model specification 18
5.3.2 Model identification 20
5.3.3 Model estimation 20
5.3.4 Model evaluation and model fit 22
5.3.5 Model modification 23
6. Results 23
6.1 Comparison 24
6.1.1 General results in Shanghai-China 26
6.1.2 General results in Sweden 27
6.1.3 Cross-country differences in the results 28
6.1.4 High correlation of MSC and MA and causal effects 29

7. Discussion 33
7.1 Discussions on results in terms of educational system and culture 33
7.2 Limitation and further research 35
7.2.1 Limitation of PISA resource 35
7.2.2 Limitation of analysis 35
7.2.3 For further research 36
8. Ethical Considerations 36
9. References 37
10. Appendices 41

1
1. Introduction Have you ever stood in front of the timetable in the railway station and checked which platform you should go while you were travelling? Have you experienced Black Friday and counted how much money you could save after discounts? Are you a car-driver and do you pay attention to the petrol consumption while driving so that you can plan when to go to the gas station? Do you calculate how long it takes you to go to work from home by bus or by bike? Have you come across graphs about national financial report or stock price in the newspapers? These situations in daily life are all related to Mathematics. It becomes important for everyone to learn Mathematics (Huckstep, 2007). “An understanding of Mathematics is central to a young person’s preparedness for life in modern society” (OECD 2012, p.24). Mathematics can equip young people with a powerful tool which can be useful while they face issues and challenges in life and work. The Programme for International Student Assessment (PISA) as a large-scale international assessment, organised by the Organisation for Economic Co-operation and Development (OECD), is to investigate whether students are prepared, not only for academic process, but also for future challenges in their life and career field. Furthermore, the importance of Mathematics is stated in PISA 2012. Learning and having a good understanding of Mathematics is helpful to prepare young people with various situations. It is an essential skill for young people, when facing issues in the future challenges (OECD, 2012). In PISA 2012, the key test domain was on mathematical literacy, and Shanghai-China ranked the first place with a Mathematics average score of 613, which was much higher than the OECD average 494. Sweden achieved below OECD average (478), and was the lowest among all the Nordic countries (OECD, 2014). The huge gap in mathematical literacy between Shanghai-China and Sweden offers an opportunity to researchers to explore the achievement difference between the two countries as well as what factors determine the achievement levels of students in each country. According to social–cognitive theory proposed by Bandura (2011), individuals’ beliefs in their capability have an effect on their reflections or actions to different situations. Among personal beliefs, efficacy beliefs play a relatively more important role in guiding people through challenging circumstances. Self-efficacy is regarded as individuals’ conviction of their capability of solving issues and pursuing desirable achievement (Bandura, 2011). Thoughts and feelings about oneself are related to how they act. Over the decades, psychological-social and cognitive elements, along with education are of researchers’ interest. As stated by Lee (2009), self-efficacy, self-concept and anxiety are all self-related constructs, which worth investigating in educational achievements research. As stated in the PISA framework (OECD, 2012), students who have a higher level of confidence and more positive emotions are more likely than others to learn and use Mathematics in real life situations they come across. The constructs from the PISA survey which are relevant to social-cognitive theory and recent research on self-related beliefs include Mathematics self-efficacy, Mathematics self-concept and Mathematics anxiety. Using these pieces of evidence, this master thesis begins to have a more specific domain.

2
It has been found in previous research that students’ family, socioeconomic, and other personal factors such as Mathematics self-efficacy, self-concept and anxiety may affect their academic achievement (Liu, Guo & Wang, 1991; Yang, Wang & Luo, 2008; Pajares & Schunk, 2001; Marsh & Martin, 2011; Bradley & Corwyn, 2002). The purpose of this study is to examine the influences of these self-beliefs of students on mathematical literacy, with respect to students’ family background which is measured by economic, social and cultural status (ESCS) in the PISA dataset. In order to answer the research questions, previous research evidence helps to build up the hypothetical model and a set of structural equation models are tested to tackle the mechanisms between students’ self-efficacy, self-concept and anxiety in Mathematics and Mathematics achievement. Comparisons are also made in the model structure and parameter estimates between Shanghai-China and Sweden. These differences are further discussed with respect to the differences in school systems as well as in the cultural mentality. There is a point which needs clarifying. The choice of Shanghai-China and Sweden for inclusion is motivated by the researcher’s familiarity of these two countries (area). Shanghai is specially chosen in China because it is the only city in mainland China which took part in PISA 2012. The researcher grew up in mainland China and has experienced the compulsory education and higher education there. She used to teach English in a secondary school during the internships under the university curriculum. She moved to Sweden to pursue a master degree, where she is involved in the Swedish educational system as a role of student and assistant teacher in a local primary school.
2. Literature Study From the aspect of China, research related to Mathematics achievement focuses very much on the teachers’ perspective on teaching methods (Ma, 1999; An, Kulm& Wu, 2004; Wang& Lin, 2005; Ference, 2004), the design of curriculum and the choice of textbooks (Fan& Zhu, 2007) and how students learn Mathematics (Fan, 2004; Miura, Okamoto, Kim, Chang, Steere& Fayol, 1994, Häggström, 2008 and Miller, Kelly& Zhou, 2005). A comparative study between China and the United States (Stevenson, Lee, Chen, Lummis, Stigler, Fan& Ge, 1990) indicates that students’ Mathematics achievement can be influenced by their attitudes and motivation, as well as the evaluation from their parents and teachers. Another comparative study between China and Germany (Frenzel, Thrash, Pekrun& Goetz, 2007) finds that Chinese students experience higher level of Mathematics anxiety but more enjoyment, without comparing Mathematics achievement between the two countries. During recent decades, researcher in China began to focus on self-belief perspectives. There is some research related on PISA topics discussing about Mathematics self-efficacy, Mathematics self-concept and Mathematics anxiety. There is an investigation operated by Luo, Wang and Luo (2009) which shows that Mathematics performance and Mathematics anxiety are significantly related and Mathematics anxiety has a negative effect on Mathematics self-efficacy. Another research finds that self-concept might be an important cause which account for different achievement between students (Liu, Guo & Wang, 1991). There is similar research which indicates that there is a negative
3
correlation between Mathematics anxiety and Mathematics achievement and a positive correlation between Mathematics self-efficacy and Mathematics achievement (Yang, Wang & Luo, 2008). While from the aspect of Sweden, a large number of research has been done on Mathematics education, with different domains on either teaching or learning (Seaberg, 2015; Peng& Nyroos, 2012; Lindblad, 2006). There is other research on gender differences, national curriculum change and education system which are all related to Mathematics education. But since they are not the focus of this study, literatures are not cited. After searching for previous research, and taking the PISA 2012 into consideration, the gap of research on comparison between China and Sweden Mathematics locates the lack of researching about the students’ perceptional perspectives. As described by Bandura (1977), how people think and feel about themselves are of importance because it relates to how they act and decide, especially when they face challenging tasks and situations. Various perceptional terms have paid attention to when investigating the people themselves and their educational achievements (Only the Mathematics achievement, which refers to mathematical literacy is discussed here), which include three closely related constructs: Mathematics self-efficacy, Mathematics self-concept and Mathematics anxiety (Lee, 2009).
2.1 Mathematical literacy Instead of testing only knowledge taught by teachers or books, the items in the PISA Mathematics questions test mathematical literacy which “involve the creation, use or interpretation of a mathematical model for a real-world problem as well as intra-mathematical thinking” (Stacey&Turner 2015, p.9). As identified in the framework (OECD, 2012), the assessment at age 15 may predict or can have an early indication of how individuals take action to various situations involving Mathematics in later life. It is considered as a brilliant idea to evaluate teachers’ teaching and students’ learning or even more outcomes through mathematical literacy (Stacey & Turner, 2015). As written in the Evolution and Key Concepts of the PISA Mathematics Framework (Stacey&Turner, 2015), the name “mathematical literacy” was suggested by Ray Adam-the International Project Director, who is contracted by OECD to lead the first five PISA-surveys. However, the content of mathematical literacy has been explored for a long history which can be traced back to 1989 in National Council of Teachers of Mathematics (NCTM):
an individual’s ability to explore, to conjecture, and to reason logically, as well as to use a variety of mathematical methods effectively to solve problems. By becoming literate, their mathematical power should develop. (NCTM 1989, p.6)
The PISA 2012 framework (OECD 2012, p.25) gave the definition of mathematical literacy as followed: Mathematical literacy is an individual’s capacity to formulate, employ, and interpret Mathematics in a variety of contexts. It includes reasoning mathematically and using

4
mathematical concepts, procedures, facts and tools to describe, explain and predict phenomena. It assists individuals to recognise the role that Mathematics plays in the world and to make the well-founded judgments and decisions needed by constructive, engaged and reflective citizens. The definition in PISA 2012 identifies that mathematical literacy is a type of capacity of “formulating situations mathematically;employing mathematical concepts, facts, procedures, and reasoning; and interpreting, applying and evaluating mathematical outcomes” (OECD 2012, p.28). It also explains that mathematical literacy would be supportive for dealing with based-on-life situation with a better understanding and handling. Mathematical literacy is defined specifically in PISA as “the capacity to identify, understand and engage in Mathematics as well as to make well-founded judgements about the role that Mathematics plays in an individual’s current and future life as a constructive, concerned and reflective citizen” (OECD 2003, p.20). The idea of “Mathematical literacy” does not simply mean master mathematical skills or solve mathematical problems within a school curriculum, but to put mathematical knowledge and skills to use in daily life. At the same time, mathematical literacy also indicates individuals’ inclination to deal with mathematical problems, which relate to their personal traits such as self-confidence and curiosity (OECD, 2003). In PISA, on the basis of the definition and description of a number of levels of literacy, the approach to reporting students’ mathematical literacy is to use the PISA scale, in which students’ performance is ranked into different levels. There are seven levels (Below level 1 and from 1 to 6) in total which are divided according to the score points (from “Below 357.8” to “Above 669.3”) on the PISA scale (OECD, 2012). In order to assess students’ mathematical literacy according to the theoretical definition, PISA 2000 started to use three broad dimensions, which include the content of Mathematics, the process of Mathematics and the situation in which Mathematics is used. Since mathematical literacy is only a minor domain in PISA 2000, the content of Mathematics did not cover all the clusters of relevance such as quantity, space and shape, change and relationships, and uncertainty, but only focused on change and relationships and space and shape. The process of Mathematics consists of reproduction - connection - reflection, which means that students are expected to use their mathematical thinking, generalisation and insight to solve straightforward mathematical questions and search for solutions for mathematical situations. In order to involve students in mathematical situations, PISA classified it into “private life/personal, school life, work and sports, local community and society, and scientific” (OECD 2003, p.20). In PISA 2012, the survey had a domain in mathematical literacy and the structure of assessing Mathematics was developed. PISA 2012 contains all the four content categories as well as four context categories, with 25 percent of score points in each. Content categories include change and relationships, space and shape, quantity and uncertainty and data. Context categories is composed of aspects of personal, occupational, societal and scientific (OECD, 2012).
2.2 Mathematics self-efficacy

5
Self-efficacy is defined as one’s belief in the capability to realise their expectant achievements. It reflects one’s persistence and confidence in successfully achieving a specific goal (Bandura, 1997). Self-efficacy is narrowly defined as one’s conviction or belief about his or her ability or literacy of pursuing achievements successfully (Lee, 2009). It measures or evaluates individual’s capability in succeeding in specific tasks (Seaton, Marsh & Craven, 2010) and it is concerned with judgments about capabilities (Pajares & Schunk, 2001; Pajares & Miller, 1997). Mathematics self-efficacy is regarded as students’ conviction of their capability to solve Mathematics problems or to be successful in Mathematics tests (OECD, 2012). In PISA 2012, students are given various Mathematics problems, then they are asked to evaluate how confident they are to solve them successfully. This rating is on the basis of social cognitive theories (Bandura, 1997), in which confidence is regarded to help determine what individuals can achieve in academic tasks. “When students take a Mathematics exam, the self-confidence that they experience as they read and analyse specific problems in part determines the amount of time and effort they put into solving those problems” (Pajares & Miller 1997, p.214). In the questionnaire, students are asked “How confident do you feel about having to do the following Mathematics tasks”. There are eight Mathematics tasks in total but students are not required to solve them but just rate their feeling of confidence with four levels “Very confident”, “Confident”, “Not very confident” and “Not at all confident”. The tasks are like “Calculating how much cheaper a TV would be after a 30% discount” or “Solving an equation like 3x+5=17”. See Appendix 1. Self-efficacy has an effect on academic learning and achievement. Students who feel more efficacious will perform better in tasks and achieve at a higher level than those who do not feel confident of their Mathematics capability (Pajares & Schunk, 2001). As found and stated by Thien and Ong (2015), students with a higher level of self-efficacy tend to have higher academic achievement and be more accurate in mathematical computations. Self-efficacy can predict not only a related outcome, but also common mechanisms such as anxiety and self-concept (Pajares & Miller, 1994). Previous Mathematics education research indicates that self-efficacy predicts Mathematics grades, mathematical problem solving and interests (OECD, 2012). Mathematics self-efficacy is considered as a strong predictor of mathematical problem-solving capability (Pajares & Miller, 1997). How confident students feel when they are learning Mathematics, which is considered as the conceptual forerunner to Mathematics efficacy, has been found to correspond with Mathematics performance (Pajares & Miller, 1994). 2.3 Mathematics self-concept Self-concept is defined as a person’s perception of him- or herself (Marsh& Shavelson, 1985). It is “one’s perception of the self that is continually evaluated and reinforced by personal inferences about oneself” (Lee 2009, p.355). These perceptions of oneself are established through one’s experience as well as interpretations of social atmosphere (Marsh& Shavelson, 1985). Self-concept describes “the feelings of self-worth that accompany competence beliefs” (Pajares& Schunk, 2001). It is regarded as “a highly important and influential factor in that it is closely associated with people’s behaviours and various emotional and cognitive outcomes such as anxiety, academic

6
achievement, happiness, suicide, deficient self-esteem, etc” (Marsh & Martin 2011, p.60). Self-concept used to be considered as generalised academic self-efficacy. However, it differs from self-efficacy, as is not measured at the level of specificity of individual’s assessment of capabilities, but “includes beliefs of self-worth associated with one's perceived competence” (Pajares & Miller 1994, p.194). Self-concept is unlike self-efficacy which is more based on specific statement of situation, but more context dependent. It can be related with subjects or courses such as English, History or Mathematics. Mathematics self-concept is the learner’s self-perceptions that how they perceive personal mathematical skills, ability, enjoyment and interest in Mathematics (Githua & Mwangi, 2003). In PISA 2012, students are asked to evaluate their thinking about studying Mathematics into four levels - “Strongly agree”, “Agree”, “Disagree” and “Strongly disagree”. For example, “I am just not good at math”, “I learn Mathematics quickly” and “I always believed that Mathematics is one of my best subjects”. See Appendix 1. Academic self-concept plays an important role in increasing students’ academic achievement (Marsh & Martin, 2011). It has been found that there is a positive relationship between Mathematics self-concept and mathematical achievement (Thien & Ong, 2015; Bong & Skaalvik, 2003). As stated by Pajares and Miller (1994), it has been found that Mathematics self-concept performs significantly with Mathematics performance. One study in the Swedish setting (Eklöf, 2007) shows that Mathematics self-concept is positively related to Mathematics achievement. 2.4 Mathematics anxiety Researchers define anxiety as a state of arousal in which people feel unsafe through physical, emotional and cognitive changes. There are different types of anxiety, such as examination anxiety, test anxiety, teaching anxiety and Mathematics anxiety. Mathematics anxiety is among the types specified in educational studies (Perker& Ertekin, 2001). Mathematics anxiety is commonly defined as a feeling of tension, anxiety and fear towards Mathematics problems in both academic situations and ordinary life. As defined by Ashcraft and Moore (2009), Mathematics anxiety is one’s negative reactions while coming across manipulation of numbers, Mathematics calculations and any other situations related to Mathematics. Mathematics anxiety indicates the student’s negative response to mathematical circumstance, including numbers, Mathematics and Mathematics calculations (Ashcraft& Moore, 2009). It is defined that Mathematics anxiety is “a feeling of tension and anxiety that interferes with the manipulation of numbers and the solving of mathematical problems in a wide variety of ordinary life and academic situations” (Richardson& Suinn 1972, p.551). In PISA 2012, students are asked to evaluate their thinking about studying Mathematics into four levels - “Strongly agree”, “Agree”, “Disagree” and “Strongly disagree”. For example, “I often worry that it will be difficult for me in Mathematics classes”, “I get very tense when I have to do Mathematics homework” and “I get very nervous doing Mathematics problems”. See Appendix 1.

7
According to previous research, it is indicated that Mathematics anxiety is one of the problems in Mathematics education and it prevents students from pursuing advanced courses in Mathematics or other science subjects. Mathematics anxiety has negative influence on students’ Mathematics achievement regardless of their true level of mastering Mathematics (Ashcraft& Moore, 2009). It is related to bad performance on Mathematics achievements (Hembree, 1990). Students who feel more of anxiety towards Mathematics achieve worse results in Mathematics (OECD 2012). The one who has a high level of Mathematics anxiety, achieves a lower score in Mathematics tests and has poorer attitudes towards Mathematics (Abu-Hilal, 2000; Ashcraft, 2002; Luo, Wang&Luo, 2009). In China, “We’ve found that Mathematics performance is statistically significant correlated to Mathematics anxiety” (Luo, Wang&Luo, 2009). 2.5 Economic, social and cultural status (ESCS) Socioeconomic status (SES) is a ranking scale for an individual or family which reflects people’s ability to access resources (Mueller & Parcel, 1981). Research shows that SES is closely related to health, cognitive and socio-emotional outcomes in children (Bradley & Corwyn, 2002). Instead of using traditional socioeconomic status (SES), PISA has another measurement variable ESCS to generate SES, which is the index of economic, social and cultural status. The PISA index of economic, social and cultural status (ESCS) is composed of highest occupational status of parents, highest educational level of parents, family wealth, cultural possessions and home educational resources, which are all based on the students’ report in the questionnaire. In PISA 2012, students are asked to response to the items in the questionnaire, which related to ESCS. The ESCS index is standardised in the international level of all the participant countries to have a mean of zero and a standard deviation of one. A higher value represents a more advantaged student’s family background. It is reported by Bradley and Corwyn (2002), that research has found that SES correlates with individual’s academic achievement and there is evidence showing that there is a connection between children’s cognitive development and SES. As mentioned in previous research, higher SES is associated with better academic performance and the effect of individual SES on academic self-concept is positive (Seaton, Marsh & Craven, 2010; Thien & Ong, 2015). Students with a lower level of SES are less likely to have access to reading and learning materials, which results in their failure in school (Bradley & Corwyn, 2002). In summary, previous research shows that individual’s mathematical literacy is influenced by their Mathematics self-efficacy, Mathematics self-concept, Mathematics anxiety and economic, social, cultural status. Students who have a higher level of Mathematics self-efficacy, Mathematics self-concept and better conditions of family economic, social and cultural status and a lower level of Mathematics anxiety tend to achieve better mathematical literacy. Individual’s economic, social and cultural status has a positive effect on their self-related belief, whereas their Mathematics anxiety has a negative effect on Mathematics self-efficacy, Mathematics self-concept.
3. Education systems

8
Students from Shanghai-China and Sweden are involved in different education systems in terms of different cultural backgrounds. Education systems and cultural background might be the biggest differences while comparing these two countries. In this section, there is a brief comparison between education systems in these two countries. In China, Shanghai is at the forefront of educational reforms and teachers are diligent in teaching and responsible for students’ academic achievements (Tan, 2012). In the late of the 1980s, Shanghai became the first region in China to implement the 9-year-compulsory education policy, and it tended to be relatively flexible in reforming curriculum and education policy (Marton, 2006; Tan, 2012). The 9-year-compulsory education consists of a 5-year primary school and a 4-year junior secondary school, followed by a 3-year senior secondary school and 2 to 4 years’ higher education. The majority of the other regions in China usually have 6 years in primary school and 3 years in junior secondary school. In order to enter higher education, going to colleges or universities, students have to take the national higher education entrance exam (Chinese name “Gaokao”), facing fierce competition (Daveya, Lian & Higgins, 2007). Good grades might be the guarantee of being admitted to better higher education. According to the statistics from Ministry of Education of the People’s Republic of China, there were 3,750,000 students participating Gaokao in 2000, but only 2,210,000 (59%) of them were finally admitted. Therefore, large numbers of schools are all examination-oriented and students are required to spend much time studying (Andersson & Nordström, 2014). Students are encouraged to “learn painstakingly” (Tan 2012, p.15) and teachers commonly spend extra time even during weekends coaching and helping students. It is commonly found that teaching style in China is rather traditional and procedural (Biggs, 1996; Leung, 2006). Teachers give the orientation of Mathematics classes in China, students learn most of their Mathematics from their teachers in the classroom. As pointed to in Leung’s article (2006), teaching is content-oriented and examination-driven. There are fewer opportunities for students to have group work or activities in Mathematics lectures due to the large size of class and stressing national curriculum, students do not even have time to think and understand Mathematics problems thoroughly in the class (Leung, 2001; Leung, 2006). According to the Swedish National Agency for Education (Skolverket), the Swedish education system ranges from preschool to adult education. Attending primary school education (Swedish “grundskola”), which lasts nine years is obligatory for students and they have to finish it before they are 18 years old. The following three years is students’ own choice whether to go to upper secondary (Swedish “gymnasieskola”) or not without any obligation. There are national tests (Swedish “nationella prov”) but they are not treated as the evaluation to higher education, unlike the status of university entrance examination in China. These national tests can be treated as an evaluation of students achievements and qualities of knowledge after they finish one course or one year study. Students can either choose to go to adult education or universities according to their aspiration and academic achievements. Students feel quite enjoyable in schools (Skolverket, 2007).
4. Research Questions and Hypotheses On account of the summary above, the purpose of this study is to examine the relationship among students’ Mathematics self-efficacy, Mathematics self-concept, Mathematics anxiety and their
9
mathematical literacy, as well as taking consideration of individuals’ economic, social and cultural status both in Shanghai-China and Sweden. To fulfill the aim, the following research questions have to be answered:
1) How do students’ Mathematics self-efficacy, Mathematics self-concept and Mathematics anxiety affect their mathematical literacy in Shanghai-China and Sweden?
2) With respect to students’ economic, social and cultural status (ESCS), do Shanghai-China and Sweden differ dramatically in PISA Mathematics tests (mathematical literacy) as a result of students’ different level of Mathematics self-efficacy, self-concept and anxiety or to some extent?
In accordance with the previous research and literatures, the following hypotheses related to the research questions mentioned above are formed.
1) Students’ Mathematics self-efficacy and Mathematics self-concept have a positive effect on mathematical literacy, while Mathematics anxiety has a negative effect in both Shanghai-China and Sweden.
2) With respect to students’ economic, social and cultural status (ESCS), students in Shanghai-China have a higher level of Mathematics self-efficacy and Mathematics self-concept and a lower level of Mathematics anxiety which results in their higher grade in mathematical literacy test. Students in Sweden have a lower level of Mathematics self-efficacy and Mathematics self-concept and a higher level of Mathematics anxiety.
5. Methodology To test the hypotheses and answer the research questions, Statistic Software Program are applied for scrutinising and analysis. SPSS version 22 is used for data management and Mplus version 7 (Muthén, & Muthén, 2010) is used for modelling.
5.1 Samples and data 5.1.1 Data source This thesis uses data from the Programme for International Student Assessment (PISA). PISA is an international survey which aims to evaluate education systems worldwide by testing the skills and knowledge of 15-year-old students. PISA measures the knowledge and skills in Mathematics, science and reading literacy that 15-year-old students in different countries learned at their compulsory education and needed for their future life challenges. It tests individuals’ reading, Mathematics and science literacy since 2000 and the study runs in a three-year recurrence. Along with tests, students are asked to answer a background questionnaire, providing information about themselves and their homes. School principals are also asked to complete a questionnaire about the characteristics of their schools. According to OECD, the main benefit of using PISA 2012 data is that it provides an opportunity to compare students’ Mathematics, reading and science knowledge in the same age, not directly linked to the school curriculum. Another benefit is its large scale accessibility, which provides adequate thousands of individual student data to estimate and evaluate models. The latest set of results from the 2012 data collection (PISA 2012) focuses on Mathematics

10
and compares the competencies of students in 65 countries and economies. Around 510, 000 students between the ages of 15 years 3 months and 16 years 2 months participated in PISA 2012, representing about 28 million 15-year-olds globally. Student Questionnaire and Scored Cognitive Item Dataset for PISA 2012 consists of data from all the participating countries and economies. After reading the student questionnaire and their performance assessment data through SPSS, observations in Shanghai-China and Sweden are selected for analysis. There are 5177 students from Shanghai-China and 4736 students from Sweden. After comparing students sample in the two areas, it has been found that in Shanghai-China, 15-year-olds are distributed in different grades, ranging from grade 7 to 12, while in Sweden, students are between grade 7 to 10. Since 94% of Swedish sample is in grade 9, in order to make all the individuals more comparable, only the 9th graders in Shanghai-China are chosen to compare with. Therefore, sample sizes of students for Shanghai-China and Sweden are 2061 and 4496 respectively in the analysis. See Table 1.
Table 1 Sample’s demographic characteristics
Country Number of Schools Number of Students
Shanghai-China 85 2061
Sweden 184 4496
5.1.2 Reliability and validity of data source As stated by Field (2009), reliability is “the ability of the measure to produce the same results under the same conditions” and validity “refers to whether an instrument measures what is was designed to measure”. According to the PISA Data Analysis Manual (OECD, 2009), the data have a high degree of reliability and validity and “can significantly improve understanding of the outcomes of education in the world’s most economically developed countries, as well as in a growing number of countries at earlier stages of economic development” (OECD 2009, p.21). On the one hand, in the participating countries, leading experts as well as governments sometimes are the ones who made decisions about the scope and nature of the assessments and the background information to be collected. Taking cultural and linguistics breadth and balance in the assessment materials into account, substantial effort and resources are devoted by the organisers. On the other hand, translation, sampling and data collection are all performed according to high-quality mechanisms. Nevertheless, there are still some issues regarding sampling and data collection. The cluster sampling draw a simple, random sample of schools among the participating countries first, where all schools have the same selection probability and the sum of school weights is equal to the number of schools in the population. Then, individuals are randomly selected within the selected schools. But the sum of the final student weights is not necessarily equal to the number of students in the population. Furthermore, the final student weights differ among schools depending on the size of each selected school. This variability reduces the reliability of all population parameter estimates (OECD, 2009).

11
5.1.3 Sample and sampling strategy in PISA 2012 PISA applies two-stage sampling instead of simple random sampling. In other words, PISA samples students in two stages: schools are first sampled and then students are sampled in the participating schools sampled from the first stage. Regarding to this study, the schools are firstly randomly selected from Shanghai-China and Sweden. Then, a simple random sample of students or classes is drawn from within the selected schools. As a general rule, usually 35 students from the population of 15-year-olds are randomly selected within each selected schools. If less than 35 15-year-olds attend a selected school, then all of the students will be invited to participate (OECD, 2009). This two-stage sampling method is referred to as cluster sampling in statistics. Cluster defined by spatial or social linkages – may not have anything to do with the study (e.g. here in PISA what school they’re in). One of the differences between simple random sampling and two-stage sampling is, that for the latter, selected students attending the same school cannot be considered as independent observations (OECD, 2009). This is because students within a school usually have more common characteristics than students from different schools. At the same time, they share the same schooling, teaching and learning related factors. However, this sampling method takes an unequal probability of selection. The interdependency of individuals in such a clustered sample implies that students in the same classrooms or schools are much similar than students from different classrooms or schools. This violates the assumption made in the simple random sample of independency of observations. Such a violation will underestimate the standard errors and make the parameter estimates unreasonably significant, and thus lead to false positive type II errors in statistical inferences. Therefore, multilevel modelling technique or single-level complex modelling technique is used to capture the non-independence of observations due to clustering and to correct the biased standard error (for detailed description of this problem, see Hox, Moerbeek & Van de Schoot, 2010).
5.1.4 Variables and variable parcels Mathematical literacy (PV1MATH) In PISA 2012, the imputation methodology referred to as plausible values are used. Plausible values are “a selection of likely proficiencies for students that attained each score” (OECD 2014, p.146). For each student, five plausible values are included for scales and sub-scales in the international database, which is used in this thesis. In other words, the dependent variable mathematical literacy (ML) is represented by five variables of plausible values, PV1MATH to PV5MATH (OECD, 2014). However, plausible values cannot be recognised as students’ testing scores. They are random numbers drawn from multiple imputations of the students’ mathematical achievements, which cannot be observed directly whereas tested by several mathematical items designed by experts. Plausible values are confirmed to be a set which are “better suited to describing the performance of the population” (OECD 2014, p.147). Plausible values can be described as a representative of “the range of abilities that an individual might reasonably have according to their responses to test items” (Wu 2005, p.115). They contain information about an individual’s ability estimate as well as the uncertainty associated with the estimate. As stated by Wu (2005), plausible values cannot be
12
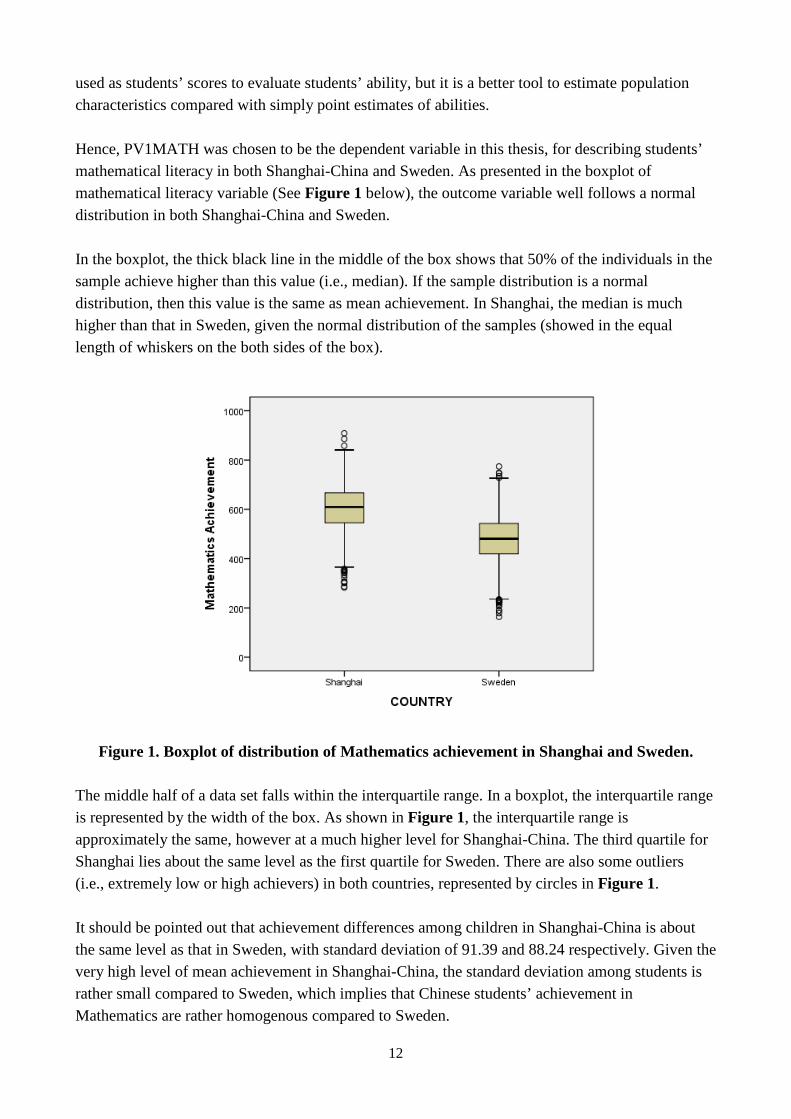
used as students’ scores to evaluate students’ ability, but it is a better tool to estimate population characteristics compared with simply point estimates of abilities. Hence, PV1MATH was chosen to be the dependent variable in this thesis, for describing students’ mathematical literacy in both Shanghai-China and Sweden. As presented in the boxplot of mathematical literacy variable (See Figure 1 below), the outcome variable well follows a normal distribution in both Shanghai-China and Sweden. In the boxplot, the thick black line in the middle of the box shows that 50% of the individuals in the sample achieve higher than this value (i.e., median). If the sample distribution is a normal distribution, then this value is the same as mean achievement. In Shanghai, the median is much higher than that in Sweden, given the normal distribution of the samples (showed in the equal length of whiskers on the both sides of the box).
Figure 1. Boxplot of distribution of Mathematics achievement in Shanghai and Sweden.
The middle half of a data set falls within the interquartile range. In a boxplot, the interquartile range is represented by the width of the box. As shown in Figure 1, the interquartile range is approximately the same, however at a much higher level for Shanghai-China. The third quartile for Shanghai lies about the same level as the first quartile for Sweden. There are also some outliers (i.e., extremely low or high achievers) in both countries, represented by circles in Figure 1. It should be pointed out that achievement differences among children in Shanghai-China is about the same level as that in Sweden, with standard deviation of 91.39 and 88.24 respectively. Given the very high level of mean achievement in Shanghai-China, the standard deviation among students is rather small compared to Sweden, which implies that Chinese students’ achievement in Mathematics are rather homogenous compared to Sweden.

13
Students from Shanghai-China achieve the mean score of Mathematics of 602.66, with standard deviation of 91.39, whereas Swedish students have a lower mean score of 481.41 as well as a lower standard deviation of 88.24. In Shanghai-China, the lowest value of mathematical literacy is 282.92 and the highest value is 908.64, while in Sweden, students have a lower minimum value of 163.66 as well as a lower maximum value of 773.97 (See Table 2 below).
Table 2 Descriptive statistics of dependent variable “PV1MATH”
Country QCN SWE
N 2061 4496
Mean 602.66 481.41
Std. Deviation 91.39 88.24
Minimum 282.92 163.66
Maximum 908.64 773.97
Previous research shows that when parcelling is applied in the multivariate modelling, it improves not only reliability but also the overall fit of structural models. Parcelling is a measurement practice which is commonly used with latent variable analysis, e.g. SEM. A parcelled variable can be defined as an aggregate-level indicator, which is composed of the sum or the average of two or more items or responses, which means that there will be fewer parameters needed to estimate to define a construct. Compared with aggregated-level data, item-level data contain disadvantages, such as “lower reliability, lower communality, a smaller ratio of common-to-unique factor variance, and a greater likelihood of distributional violations” (Little, Cunningham, Shahar, & Widaman 2002, p.154). Aiming to build parcelling in this case, the technique of item-to-construct balance (Little, Cunningham, Shahar, & Widaman, 2002) is applied. The PISA data used here have a large sample size as well as many indicators of latent variables, which becomes the reason why they have to be equally balanced in terms of intercept and slope. In order to solve the problem, the factor loadings can be used as a guide and the item having the highest factor loading is used to anchor the three-items parcelling. The second highest factor loaded item would firstly be matched with the lowest loaded item, the other left items obey the same rule. The parcelling process is performed with the help of software SPSS, computing the mean value of variables to be parcelled. The Cronbach’s alpha coefficient is commonly used as the indicator of internal consistency to evaluate reliability of scales. The Cronbach alpha coefficient of a scale should ideally be above 0.7 (Pallant, 2013). When the Cronbach’s Alpha is above 0.80, reliability of the scale is good. As shown in Table 3, indicators of Mathematics Self-Efficacy (MSE), Mathematics Self-Concept

14
(MSC) and Mathematics Anxiety (MA) are all of good reliability for after-parcelling factors (Cronbach’s Alpha are all above 0.8).
Table 3 Reliability Statistics_parcelling
Valid cases N of Items Cronbach’s Alpha
QCN SWE QCN SWE
MSE_After Parceling 1380 2980 3 0.862 0.844
MSC_After Parceling 1373 2868 3 0.854 0.865
MA_After Parceling 1373 2876 3 0.846 0.831
The following three latent variables have been handled with parcelling practice. As mentioned in the methodology part, there are several techniques of doing parcelling. In this thesis, item-to-construct balance is chosen to do the parcel with the help of software programs SPSS and Mplus. For example, a measurement model was conducted in Mplus for MSE to check factor loadings of each indicator. Then to handle data in SPSS (the table of original variables before parcelling is presented in Appendix 2), values of variable NEW3701 and NEW3708 were summed up and a mean value was calculated for the two variables, deriving a new variable called NEW3781, respectively for both Shanghai-China and Sweden. The same rule was applied for all the other variables of MSE, MSC, MA. These parcelled variables are presented in Table 4 below, the constructs are the three latent variables, following by new variables names and labels.
Table 4 Descriptive statistics of independent parcelled variables
Constructs Parcelled variable
name
Variables in each parcel N Mean Std. Deviation
QCN SWE QCN SWE QCN SWE
Mathematics Self-Efficacy
(MSE)
NEW37234 Calculating TV Discount Calculating Square Metres of Tiles Understanding Graphs in Newspapers
1380 2933 3.56 3.15 0.542
0.660
NEW3781 Using a Train Timetable Calculate Petrol Consumption Rate
1380 2931 3.34 3.01 0.646
0.653
NEW37567 Solving Equation 1 Distance to Scale Solving Equation 2
1380 2932 3.71 2.97 0.510
0.706
Mathematics Self-Concept
(MSC)
NEW4279 One of Best Subjects Understand Difficult Work
1374 2882 2.40 2.29 0.775
0.877
NEW4202 Not Good at Maths 1373 2879 2.62 2.79 0.873
0.951
NEW4246 Get Good Grades Learn Quickly
1374 2888 2.48 2.71 0.651
0.758
Mathematics Anxiety
NEW4201 Worry That It Will Be Difficult 1373 2883 2.47 2.35 0.891
0.881
15
(MA) NEW4235 Get Very Tense Get Very Nervous
1374 2890 2.15 1.98 0.712
0.708
NEW42810 Feel helpless Worry about getting poor grades
1374 2884 2.46 2.18 0.695
0.784
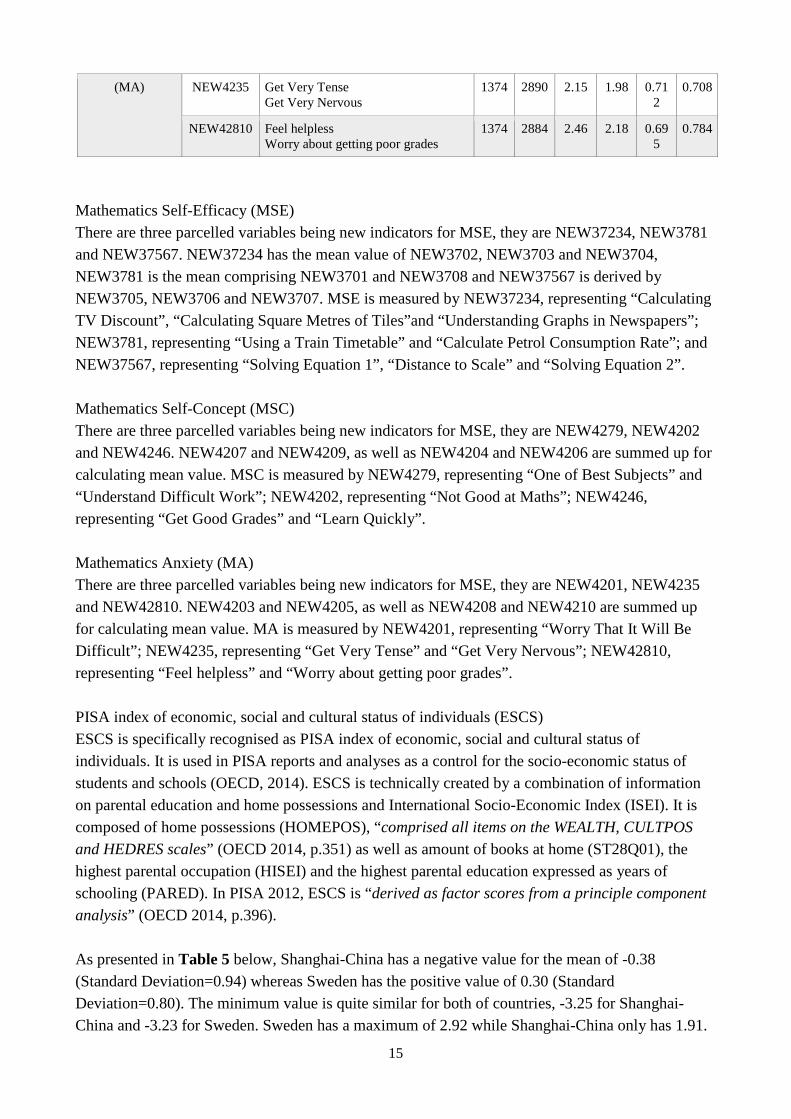
Mathematics Self-Efficacy (MSE) There are three parcelled variables being new indicators for MSE, they are NEW37234, NEW3781 and NEW37567. NEW37234 has the mean value of NEW3702, NEW3703 and NEW3704, NEW3781 is the mean comprising NEW3701 and NEW3708 and NEW37567 is derived by NEW3705, NEW3706 and NEW3707. MSE is measured by NEW37234, representing “Calculating TV Discount”, “Calculating Square Metres of Tiles”and “Understanding Graphs in Newspapers”; NEW3781, representing “Using a Train Timetable” and “Calculate Petrol Consumption Rate”; and NEW37567, representing “Solving Equation 1”, “Distance to Scale” and “Solving Equation 2”. Mathematics Self-Concept (MSC) There are three parcelled variables being new indicators for MSE, they are NEW4279, NEW4202 and NEW4246. NEW4207 and NEW4209, as well as NEW4204 and NEW4206 are summed up for calculating mean value. MSC is measured by NEW4279, representing “One of Best Subjects” and “Understand Difficult Work”; NEW4202, representing “Not Good at Maths”; NEW4246, representing “Get Good Grades” and “Learn Quickly”. Mathematics Anxiety (MA) There are three parcelled variables being new indicators for MSE, they are NEW4201, NEW4235 and NEW42810. NEW4203 and NEW4205, as well as NEW4208 and NEW4210 are summed up for calculating mean value. MA is measured by NEW4201, representing “Worry That It Will Be Difficult”; NEW4235, representing “Get Very Tense” and “Get Very Nervous”; NEW42810, representing “Feel helpless” and “Worry about getting poor grades”. PISA index of economic, social and cultural status of individuals (ESCS) ESCS is specifically recognised as PISA index of economic, social and cultural status of individuals. It is used in PISA reports and analyses as a control for the socio-economic status of students and schools (OECD, 2014). ESCS is technically created by a combination of information on parental education and home possessions and International Socio-Economic Index (ISEI). It is composed of home possessions (HOMEPOS), “comprised all items on the WEALTH, CULTPOS and HEDRES scales” (OECD 2014, p.351) as well as amount of books at home (ST28Q01), the highest parental occupation (HISEI) and the highest parental education expressed as years of schooling (PARED). In PISA 2012, ESCS is “derived as factor scores from a principle component analysis” (OECD 2014, p.396). As presented in Table 5 below, Shanghai-China has a negative value for the mean of -0.38 (Standard Deviation=0.94) whereas Sweden has the positive value of 0.30 (Standard Deviation=0.80). The minimum value is quite similar for both of countries, -3.25 for Shanghai-China and -3.23 for Sweden. Sweden has a maximum of 2.92 while Shanghai-China only has 1.91.

16
Table 5 Descriptive statistics of independent variable “ESCS”
Country QCN SWE
N 2057 4392
Mean -0.38 0.30
Std. Deviation 0.94 0.80
Minimum -3.25 -3.23
Maximum 1.91 2.92
5.1.5 Reliability and validity of data analysis Reliability is the consistency of measurement. Validity is concerned with whether a variable measures what it is supposed to measure, or how well the measure measures what it is supposed to measure. There are only eight questions in PISA questionnaire which are designed to measure students’ Mathematics self-efficacy on the basis of their responses, five questions for both Mathematics self-concept and Mathematics anxiety. They can never be answered with absolute certainty if the question is “Do these responses of questions measure students’ MSE, MSC or MA?”. Nevertheless, the method of parcelling items of the observed variables is applied to the model in order to improve the reliability of measurement of the indicators of latent variables, see Table 3 in section 5.1.4.2 above.
5.2 An introduction to SEM with application in educational research The use of Structural equation modelling (SEM) spread to sociology, psychology and education in the late 1970s (Khine, 2013). Structural equation modelling (SEM), also known as latent variable modelling, latent variable path analysis, is a general statistical modelling technique, widely used in behavioural sciences. It can be viewed as a combination of regression analysis and factor analysis, investigating relationships between latent variables (unobserved) and manifest (observed) indicators. The SEM, which incorporates simultaneous equation models, is a multivariate regression model. However, it differs from the common multivariate regression model in that both the response and explanatory variables in a SEM can be latent. Examples of latent variables in education can be, for example, reading ability and intelligence, depression and self-confidence in psychology. In this master thesis, Mathematics self-efficacy (MSE), Mathematics self-concept (MSC) and Mathematics anxiety (MA) are the three latent variables, which cannot be measured directly. In PISA questionnaire, these three latent variables are defined in terms of observed variables to represent them. For example, students are asked to evaluate their Mathematics self-efficacy (MSE) by ranking their confidence in reposing to the question “Calculating the petrol consumption rate of a car” or “Calculating how much cheaper a TV would be after a 30% discount”. These question are namely indicators, which can be observed directly. The rules are the same for defining Mathematics self-concept (MSC) and Mathematics anxiety (MA).

17
In a common two-step approach of SEM, a confirmatory measurement model and a structural model are usually specified and estimated. A measurement model defines latent variables using several observed variables while a structural model tries to capture the (causal) relationship between latent variables.
In a statistical representation, the full SEM is
where and are vectors of indicators, and are vectors of latent variables, and are
disturbances. Matrices and are factor loadings. Matrices and are coefficient matrices
indicating relations among the latent factors. Latent vector and the disturbances are mutually uncorrelated of each other. The SEM reduces to a factor model if and are zero. The first equation is the structural model for latent variables and the second and the third equations are the measurement model that links the latent variables with indicators. Maximum likelihood (ML) estimation is often used to estimate unknown parameters in a full SEM under the assumption of normally distributed indicators. Here presenting tedious formula for the ML is skipped for readers who do not have much interest in going into details. Rather, one of the adaptation that was made to this estimation process is discussed. The Robust Maximum Likelihood estimation (MLR) is used to deal with the non-normality of the indicators. In PISA questionnaire data, many of the responses are categorical, which could only be approximate with normal. But MLR is picked to be used here to allow more or less kurtosis in the multivariate normal distribution, which could also bring us adjusted standard error, as well as adjusted test statistic for model evaluation. The MLR routine in Mplus uses Huber/Pseudo ML/sandwich corrections. Structural equation models are composed of measurement models and a structure model. The measurement model is conducted to explore the relationships between observed variables or indicators and latent variables or constructs. The structural model focuses on relations among latent variables and regressions of latent variables on observed variables. For the former, it is a multivariate regression model which describes the relationship between the observed dependent variables and latent variables. The observed dependent variables are factor indicators and the latent variables are the factors (Muthén, & Muthén, 2010). Anderson and Gerbing (1988) presented a comprehensive, two-step approach for SEM modelling, which becomes the golden rule in applying SEM method. The first step is to model a measurement (CFA) model, which focuses on answering questions on: 1. Are the items grouped according to the theory? 2. Assessment of convergent and discriminant validity of measurement?

18
The second step is to construct a structural model, which focuses on answering questions on: 1. What are the relationships among the latent factors? 2.Assessment of predictive validity? This outline will be used to formulate SEM models in details in the next section.
5.3 SEM modelling This paper is originally designed to use structural equation modelling (SEM) in confirmatory factor analysis. As clarified by Muthén & Muthén (2010) confirmatory factor analysis (CFA) is used to study the relationships between a set of variables and a set of continuous latent variables. CFA is used to test potential relationship between observed variables and latent variables, usually based on the established theory or hypothesis of interest. On the contrary, exploratory factor analysis (EFA) is conducted when researchers do not have a substantive theory. A structural equation model is proposed with a generalised measurement part, allowing for dichotomous and ordered categorical variables (indicators) in addition to continuous ones (Muthén, 1984). As mentioned in section 5.1.4, in the case of PISA 2012, the latent variables are Mathematics self-efficacy (MSE), Mathematics self-concept (MSC) and Mathematics anxiety (MA), which cannot be observed directly but have several indicators (e.g. “get very tense”, “get very nervous”, and “feel hopeless” are used to describe Mathematics anxiety) to measure. As mentioned above, SEM has a measurement model and a structural model. In this case, Mathematics self-efficacy (MSE) has eight indicators in total and Mathematics self-concept (MSC), Mathematics anxiety (MA) both have five indicators. A measurement model is performed to deal with the relationships among these indicators and latent variables. In this study, Mathematics self-efficacy, Mathematics self-concept and Mathematics anxiety are latent variables while mathematical literacy is the observed dependent variable. For the latter, relationships among factors are described (Muthén & Muthén, 2010). So the relationships among Mathematics self-efficacy, Mathematics self-concept and Mathematics anxiety will be tested. On the basis of the two-stage sampling, namely cluster sampling in PISA, a two-level analysis model is firstly taken into consideration, which can model non-independence of observations. It is specified for both the within and between level parts of the model. Within level represents individual-level observed variables while between level represents cluster-level observed variables, which here in this case means school-level observed variables. The other way is to apply single-level complex SEM model (Muthén & Muthén, 2010). There are five steps involving in testing SEM models, which are model specification, identification, estimation, evaluation and modification (Khine, 2013), but they might differ from researchers to researchers. 5.3.1 Model specification Model specification is to formulate a model based on previous studies or a theory in the field that the researcher is interested in (Khine, 2013). At this stage, the relationships among the observed and

19
latent variables are hypothesised and these relationships are represented by parameters or paths, which can be set to be fixed, free or constrained. The relationships between the observed indicators and latent variables are called factor loadings, which have to be specified as directional effects. Figure 2 shows a hypothesised model of the relationship between an individual’s Mathematics self-efficacy (MSE), Mathematics self-concept (MSC), Mathematics anxiety (MA), ESCS and Mathematics achievement. In reality, MSE, MSC and MA are all latent variables which are unobserved but used to model the psychological concepts related to Mathematics. Additionally, in SEM different shapes in the diagram have different meanings. Circles indicate measurement errors or residuals. Squares indicate observed variables and ellipses indicate unobserved variables or dependent variables. A one-headed arrow indicates a hypothesised one-way direction, while a two-headed arrow indicates a correlation between two different variables. Independent variables (In this case, ESCS is the independent variable) release one-way arrow, while dependent variables (In this case, ML, MSE, MSC and MA are the dependent variables) receive the arrows. Observed and latent variables are usually modelled with a measurement error, receiving a one-headed arrow. As mentioned in the previous part, SEM is composed of a measurement model as well as a structural model. In Figure 2, the three latent variables or factors — Mathematics self-efficacy (MSE), Mathematics self-concept (MSC) and Mathematics anxiety (MA) — are measurement models, each latent variable has to be well measured by its related observed variables; the hypothesised relationship between all the variables is a structural model. The hypothesised model is formulated for both the individual and school level as well as for both Shanghai-China and Sweden. Due to technical problems the models in Figure 2, however, show bidirectional arrows between the endogenous factors MSE, MSC, and MA, while in fact they shall go between the residuals of the factors. This is also pertains to Figure 3. The right technical solution is shown in Figures 4 and 5, where the empirical relations are accounted for.
Between Within

20
Figure 2 Hypothesised two-level SEM model diagram 5.3.2 Model identification Model identification is concerned with a comparison of the “knowns” and the “unknowns” in the model. The “unknowns” can be factor loadings, factor correlations, measurement errors, while the “knowns” indicates the variance/covariance matrix or the correlation matrix and standard deviations of the measured variables. It is indicated that three identification types are possible. The first type comes to that the model is “just-identified”, which means that all the parameters are determined with just enough information. The second type of model is “over-identified”, in which known information is more than the parameters. The last type of model is called “under-identified”, in which one or more parameters cannot be determined due to lack of information. It has to be confirmed that all the elements in the correlation matrix are more than the number of parameters to be estimated so that the model can be identified. In SEM, both of the measurement and structural models must be identified for the overall SEM to be identified. Even if the models are theoretically sound, it is still likely to have identification problems. If there are a large number of parameters to be estimated relative to the number of variances and covariances in the matrix, it would be more difficult to have a good identification as well. First of all, the rule which was developed by Bollen (2014) is applied to test the identification of the structural parts of latent variable models. In Figure 2, for the hypothesised model, there are 30 estimated parameters — “unknowns”: 6 factor loadings (originally, there should be 9 factor loadings but three of them are fixed to be 1, which do not need to be estimated), 11 measurement error variances, 3 covariances, 10 factor error variances. The number of “knowns” is equal to the number of unique elements in the variance-covariance matrix of the structural variables (observed variables). The number of data points is p(p+1)/2, where p refers to the number of observed variables. Therefore, with 9 observed variables, the number of data points is 45, which is much larger than the number of estimated parameters in the model. Thus, the model is “over-identified”. The degrees of freedom (df) are the difference between the number of data points and the number of parameters to be estimated, which means df=the number of data points-the number of parameters to be estimated. When df are positive, the model can be identified. If df equals to zero, the model can be just-identified. But if df are negative, models cannot be identified then. In this case, thus df equals to 15, which means the model can be identified. 5.3.3 Model estimation Once the model is identified, then it is time to estimate parameters in the model. The purpose of parameter estimation is to estimate population parameters by minimising the difference between the observed variance/covariance matrix and the model-predicted variance/covariance matrix. The MLR estimator is now default in Mplus for modelling and is becoming the preferred approach to these analyses. The most widely used method is maximum likelihood, regardless of sample size, or factors or any other considerations. “Maximum likelihood estimation is an iterative technique, which means that an initially posited value is subsequently updated through calculation. The iteration continues until the best values are attained. When this occurs, the model is said to have converged” (Khine 2013, p.27). The three latent variables MSE, MSC and MA have three indicators

21
each. MSE explains NEW3781, NEW37234 and NEW37567, MSC explains NEW4202, NEW4246 and NEW4279, whereas MA explains NEW4201, NEW4235 and NEW42810. As mentioned in the previous part, the PISA data used in this thesis is clustered data-students nested within schools, which is commonly known as hierarchically structured data. That is the reason why two-level analysis is considered to be applied because of the hierarchical structures (Byrne, 2013). Interclass correlation coefficients can be interpreted as the proportion of variance that is attributed to the differences between schools. If an ICC is very low, say close to zero, it implies that the great majority of the total variance in the variable is from individual level. This makes a two-level modelling unnecessary. It has been found that if ICC value is of 0.1 or larger, a multilevel structure analysis has to be applied, because large ICC will cause a great design effect (i.e., the ratio of total variance based on a simple random design to the total variance based on cluster sampling design). The greater the design effect is the greater the biased standard error estimates will be. However, when a trail two-level model is applied for both Shanghai-China and Sweden, the intraclass correlation values of the majority of variables are much lower than 0.1 (see Table 6 below).
Table 6 Intraclass correlation coefficients of the item-level latent variable indicators
Indicators QCN SWE
NEW3703 Maths Self-Efficacy - Calculating Square Metres of Tiles 0.12 0.04
NEW3706 Maths Self-Efficacy - Distance to Scale 0.14 0.09
NEW4202 Maths Self-Concept - Not Good at Maths 0.05 0.02
NEW4207 Maths Self-Concept - One of Best Subjects 0.03 0.01
NEW4203 Maths Anxiety - Get Very Tense 0.05 0.01
NEW4210 Maths Anxiety - Worry About Getting Poor <Grades> 0.02 0.02
NEW3701 Maths Self-Efficacy - Using a <Train Timetable> 0.12 0.04
NEW3704 Maths Self-Efficacy - Understanding Graphs in Newspapers 0.10 0.05
NEW3707 Maths Self-Efficacy - Solving Equation 2 0.12 0.05
NEW4204 Maths Self-Concept - Get Good <Grades> 0.03 0.04
NEW4209 Maths Self-Concept - Understand Difficult Work 0.03 0.02
NEW4205 Maths Anxiety - Get Very Nervous 0.04 0.01
NEW3702 Maths Self-Efficacy - Calculating TV Discount 0.10 0.05
NEW3705 Maths Self-Efficacy - Solving Equation 1 0.12 0.06
NEW3708 Maths Self-Efficacy - Calculate Petrol Consumption Rate 0.13 0.02
NEW4206 Maths Self-Concept - Learn Quickly 0.02 0.01
NEW4201 Maths Anxiety - Worry That It Will Be Difficult 0.05 0.02
NEW4208 Maths Anxiety - Feel Helpless 0.05 0.02

22
In conclusion, only a single level model will be applied for both Shanghai-China and Sweden though, with TYPE=COMPLEX command to adjust errors due to cluster sampling. The hypothesised model is presented in Figure 3. Here the same problems with arrows show up, that
has been mentioned in connection to Figure 2. Figure 3 Hypothesised single-level complex SEM model diagram 5.3.4 Model evaluation and model fit When the parameters in the model are estimated, how well the model fits the data must be examined. A statistically nonsignificant chi-square (χ2) value is traditionally used as a measurement to indicate a good model fit. Statistical non-significance indicates the difference between the sample covariance matrix and the model-implied variance matrix is statistically nonsignificant, which implies that the two matrices are not statistically different. Thus, a nonsignificant difference expresses that the hypothesised model cannot be rejected and cannot be considered correct. But this logical rule is the opposite to testing statistical significance for the analysis of variance where statistical significance is always preferable. Whereas chi-square tests are limited in dealing with small samples, they are suggested to be practically meaningless for large samples (Kline, 2011; Kline 2013 & Ullman, 2007). In consideration of this problem, researchers developed other model-fit indices on the basis of chi-square tests to determine whether to accept or reject the model. There are different types of model-fit indices with the development of statistical software program and research. Nevertheless, given Mplus as the analytical software, there are only the standardised root mean square residual (RMSEA), the comparative fit index (CFI), the Tucker-Lewis index (TLI), the standardised root mean square residual (SRMR) and weighted root mean square residual (WRMR) being presented. The RMSEA is recently regarded as “one of the most informative fit indices” (Diamantopoulos & Siguaw 2000, p.85) due to its sensitivity to the number of estimated parameters in the model (Hooper, Coughlan & Mullen, 2008). It tells how well the model parameter estimates would fit the populations covariance matrix. An RMSEA of between 0.08 to 0.10 provides a mediocre fit and

23
below 0.08 provides a good model fit. Further in recent years, it has been said that if an RMSEA value is below 0.07, then it can be regarded as a good model fit. The SRMR is the square root of the difference between the residuals of the sample covariance matrix and the hypothesised covariance model. CFI assumes that all latent variables are uncorrelated and compares the sample covariance matrix with the independent model. Values for CFI range between 0.0 and 1.0 with values greater than 0.95 recognised as indicative of good model fit. Nowadays, this statistic index is included in all SEM programs and getting its popularity because of its least being affected by sample size. The TLI is also called the Bentler-Bonnet NNFI (non-normed fit index), which is firstly used by Bentler and Bonnet (1980) to compare a proposed model to the null model. Since the TLI values are not normed, it may fall below 0 or above 1, but a good-fit model have values approaching to 1.0, usually more over 0.95. The SRMR values range from 0 to 1.0 with good-fit models obtaining values smaller than 0.05 and it is reasonable if values are as high as 0.08, which can be deemed acceptable (Hooper, Coughlan & Mullen, 2008). The WRMR values have been found to have better description of categorical data compared with SRMR. It measures the weighted average differences between the sample and estimated population variance and covariance. When WRMR values are closer to 1.0, it can be used to identify a good model (Yu, 2002). 5.3.5 Model modification After comparing the differences of the hypothesised models above, only a single level complex SEM model with parcels is determined to be conducted in Mplus for the final analysis, with COMPLEX function to adjust standard errors due to cluster sampling design. COMPLEX option, with a combination of CLUSTER, WEIGHT and VARIABLE in the ANALYSIS command takes into account stratification, non-independence of observations and unequal probability of selection, as well as correlations to the standard errors and chi-square test of model fit. By specifying ESTIMATOR=MLR, a maximum likelihood estimator with robust standard errors using a numerical integration algorithm will be used. Furthermore, numerical integration becomes increasingly more computationally demanding as the number of growth factors and the sample size increase (Muthén & Muthén, 2010).
6. Results In this section, the analysis of data proceeds in two steps. In the first step, there is a presentation of evidence for applying parcelling practice and single-level complex SEM modelling in this thesis, compared with non-parceling model with categorical variables and two-level SEM modelling with parcelling. Secondly, the results of a final model are presented with statistics, diagrams as well as analysis. The analysis of the results will be used to answer the research questions and to test hypotheses proposed in section 3. It is a comparison of the impact of individual’s Mathematics self-efficacy, Mathematics self-concept and Mathematics anxiety on students’ mathematical literacy between Shanghai-China and Sweden, when economic, social and cultural status is taken into account. In the last part of this section, there is discussion and further statement in terms of modelling and analysis. As mentioned in section 4, there are overall three models being estimated. They are MODEL1. Two-level Structural Equation Modelling with Parceling; MODEL2. One-level Structural Equation

24
Modelling with Categorical Indicators and MODEL3. One-level Structural Equation Modelling with parceling. For each of the models, Shanghai-China and Sweden are estimated independently, without using a pooled variance. The comparison of model fit for the three models is presented in Table 7.
Table 7 Comparison of model fit from three different models
MODEL1 MODEL2 MODEL3
Acceptable threshold
QCN SWE QCN SWE QCN SWE
Number of Free
Parameters
55 55 84 84 40 40
RMSEA <.07 0.037 0.031 0.051 0.055 0.036 0.037
CFI >.95 0.972 0.978 0.977 0.966 0.985 0.984
TLI >.95 0.964 0.971 0.973 0.960 0.977 0.974
SRMR <.08 0.039 (within)
0.039 (within)
N/A N/A 0.034 0.035
0.652 (between)
0.486 (between)
WRMR ≤ 1.0 N/A N/A 2.259 2.946 N/A N/A
*RMSEA=Root Mean Square Error Of Approximation *CFI=Comparative fit index *TLI=Tucker-Lewis Index *SRMR=Standardized Root Mean Square Residual *WRMR=Weighted Root Mean Square Residual *N/A=Not Applicable
Generally all these three models fit data well, Chi-square is 126.125 with 35 degree of freedom (df) in MODEL3 Shanghai-China and 241.051 with 35 df for Sweden and both has p-value of Chi-square test statistic<0.01. According to Table 7 above, MODEL3 has the best model fit compared with the other two based on CFI, TLI, SRMR statistics and in RMSEA it roughly stays on top with MODEL1 while MODEL1 suggests a big between-school SRMR (0.642 for Shanghai-China and 0.486 for Sweden). This reconfirms the unnecessary conduction of including two-level modelling. Meanwhile, large WRMR suggests a poor model fit for MODEL2. By using parcelling, it turns categorical variables into continuous ones in the measurement level, which proves to be better-suited for data. Therefore, MODEL3 is the final model to represent the individual impact of MSE, MSC, MA on ML with overall satisfying model fit. 6.1 Comparison After all the discussions and traits above, only MODEL 3 survived because of better model fit and higher reliability. The model with variable parcels as latent variable indicators has good model parsimony; the model structure becomes simple and efficient. Moreover, the model fit indices were the best. Each measurement model has higher factor loadings and correlations among factors

25
become more strong and stable. Table 8 presents the parameter estimates of the final model, namely single-level complex model with variable parcels as latent variable indicators.
Table 8 Standardised Model Estimates for MODEL3
Parameter Estimate Standardized
QCN SWE
Measurement Model Estimates Factor loading (T-VALUE) Factor loading (T-VALUE)
MSE NEW37234 0.924 (73.072) 0.890 (108.251)
NEW3781 0.840 (66.252) 0.764 (61.161)
NEW37567 0.735 (35.242) 0.758 (58.254)
MSC NEW4279 0.723 (37.832) 0.718 (46.512)
NEW4202 0.918 (70.356) 0.886 (115.112)
NEW4246 0.682 (27.909) 0.774 (49.941)
MA NEW4201 0.848 (62.332) 0.832 (92.214)
NEW4235 0.787 (51.047) 0.744 (61.696)
NEW42810 0.787 (48.395) 0.805 (67.706)
Structural Model
ESCS effect on MSE 0.288 (8.252) 0.294 (13.594)
ESCS effect on MSC 0.145 (4.534) 0.196 (9.185)
ESCS effect on MA -0.150 (-4.574) -0.162 (-8.154)
ESCS effect on PV1MATH 0.123 (4.198) 0.150 (8.763)
MSE effect on PV1MATH 0.450 (14.370) 0.302 (7.317)
MSC effect on PV1MATH 0.221 (2.178) 0.282 (3.041)
MA effect on PV1MATH -0.012 (-0.113) -0.035 (-0.485)
Correlations of Residuals
MSE correlates with MSC 0.498 (14.294) 0.734 (29.380)
MSE correlates with MA -0.469 (-12.778) -0.569 (-19.876)
MSC correlates with MA -0.912 (-60.746) -0.885 (-84.430)
*For QCN, RMSEA=0.036, CFI=0.985, TLI=0.977, SRMR=0.034; *For SWE, RMSEA=0.037, CFI=0.984, TLI=0.974, SRMR=0.035;
*Italic style represents non-significance.

26
6.1.1 General results in Shanghai-China In the measurement model of Mathematics self-efficacy, Mathematics self-concept and Mathematics anxiety, the relationships of latent factors Mathematics self-efficacy, Mathematics self-concept and Mathematics anxiety and parcelled observable indicators are explained by factor loadings. As presented in Table 8 above and Figure 4 below, all the factor loadings are high, almost all of them are above 0.7 (except NEW4246 of 0.682), NEW37234 and NEW4202 are with extremely large factor loadings of 0.924 and 0.918. It is implied that these parcelled observable indicators have an appropriate measurement of latent factors for Shanghai-China. In the structural model, ESCS has positive effect on Mathematics self-efficacy, Mathematics self-concept and Mathematical literacy and a negative value for Mathematics anxiety, which indicates that if an individual has better condition of ESCS, he or she tends to have a higher level of Mathematics self-efficacy, Mathematics self-concept and Mathematical literacy and a lower level of Mathematics anxiety. Mathematics self-efficacy and Mathematics self-concept both have positive effect on Mathematical literacy, Mathematics self-efficacy has relatively higher influence on Mathematical literacy with 0.450, while Mathematics anxiety has a non-statistically significant effect on Mathematical literacy (P=0.910, >0.5). In the correlation part, Mathematics anxiety has negative correlation with Mathematics self-efficacy and Mathematics self-concept, with an extremely high negative correlation with Mathematics self-concept (-0.912). Mathematics self-efficacy and Mathematics self-concept are correlated with each other (0.498). To answer the first research question, in Shanghai-China, students’ Mathematics self-efficacy and Mathematics self-concept both have positive impact on their mathematical literacy, whereas Mathematics anxiety does not significantly influence mathematical literacy.

27
Figure 4 One-level Complex SEM for Shanghai-China 6.1.2 General results in Sweden As presented in Table 8 above and Figure 5 below, in the measurement model of Mathematics self-efficacy, Mathematics self-concept and Mathematics anxiety, all the factor loadings are above 0.7, which shows that parcelled observable indicators have an appropriate measurement of latent factors for Sweden. In the structural model, ESCS has positive effect on Mathematics self-efficacy, Mathematics self-concept and Mathematical literacy and a negative value for Mathematics anxiety, which indicates that if an individual has better condition of ESCS, he or she tends to have a higher level of Mathematics self-efficacy, Mathematics self-concept and Mathematical literacy and a lower level of Mathematics anxiety. Mathematics self-efficacy and Mathematics self-concept both have positive impact on Mathematical literacy, and Mathematics self-efficacy has a relatively high

28
influence (0.302). However, Mathematics anxiety does not have statistically significant effect on Mathematical literacy (P=0.628, >0.5). In the correlation part, Mathematics anxiety has negative correlation with Mathematics self-efficacy and Mathematics self-concept, relatively high negative correlation with Mathematics self-concept (-0.885). Meanwhile, Mathematics self-efficacy and Mathematics self-concept are highly correlated (0.734). To answer the first research question, in Sweden, students’ Mathematics self-efficacy and Mathematics self-concept both have positive impact on their mathematical literacy, whereas
Mathematics anxiety does not significantly influence mathematical literacy. Figure 5 One-level Complex SEM for Sweden 6.1.3 Cross-country differences in the results Compared with students from Shanghai-China, Swedish students have a lower level of Mathematics self-efficacy, whereas a higher level of Mathematics self-concept contributing to Mathematical

29
literacy. Respectively, ESCS affects more Mathematical literacy in Sweden. Mathematics anxiety does not have statistically significant influence on Mathematical literacy in both of the countries. A very similar pattern of factor loadings of Mathematics self-efficacy, Mathematics self-concept and Mathematics anxiety are found in Shanghai and Sweden at individual level. Parcel variable NEW37234 dominates the Mathematics self-efficacy factor, with standardised factor loading of 0.924 for Shanghai and 0.890 for Sweden. Variable NEW4202 has the highest factor loading of Mathematics self-concept factor, 0.918 for Shanghai and 0.886 for Sweden. Another non-parcelled variable NEW4201 contributes most to Mathematics anxiety factor, 0.848 for Shanghai and 0.832 for Sweden. In the structural model part, compared with students from Shanghai-China, Swedish students have a lower level of Mathematics self-efficacy (0.302 vs 0.450), whereas a higher level of Mathematics self-concept (0.282 vs 0.221) and Mathematics anxiety (-0.035 vs -0.012, in absolute value, while not statistically significant) contributing to Mathematical literacy. At the same time, ESCS affects Mathematical literacy slightly more in Sweden than in Shanghai (0.150 vs 0.123). So given the analysis, the research questions proposed in Section 3 can be further answered. First of all, students’ Mathematics self-efficacy and Mathematics self-concept do have a positive effect on mathematical literacy, both being observed in Shanghai and Sweden, while Mathematics anxiety has a negative effect. This confirms the hypothesis that students who did well in PISA Mathematics test do tend to think that they can do well in real life, measured by Mathematics self-efficacy, and that students tend to believe they can do well and have more confidence, measured by Mathematics self-concept. Besides, it may also indicate that there is a tendency that when students have more fear in Mathematics, they are less likely to do well in test. Secondly, the effect of ESCS on student’s mathematical literacy does exist, but not as high as expected that it might dominate the Mathematical literacy. When ESCS is taken into concern, the reality that students in Shanghai-China who have a higher Mathematics self-efficacy and Mathematics self-concept and a lower Mathematics anxiety which results in their higher grade in mathematical literacy test than those students in Sweden who have a lower Mathematics self-efficacy and Mathematics self-concept, with a higher Mathematics anxiety is revealed. This corresponds to our answer to the first research question. 6.1.4 High correlation of MSC and MA and causal effects One interesting finding in the difference of SEM estimate is that both China and Sweden observe a high correlation in Mathematics self-concept and Mathematics anxiety, in opposite direction, with -0.912 in China and -0.885 in Sweden. This could explain why Mathematics anxiety are not significant in the structural model. Big numbers in correlation of explanatory variables could lead to risk of multicollinearity, which further result in failed estimation of both effects of Mathematics self-concept and Mathematics anxiety on Mathematical literacy. So non-significant result of Mathematics anxiety on Mathematical literacy in MODEL3 could not be correct when leaving out Mathematics self-concept, or using weighted least square estimates. In order to test the high correlation which might be a problem of multicollinearity, MODEL4 (one level modelling with parcelling with only MSE and MA) and MODEL5 (one level modelling with parcelling with only MSE and MSC) are taken into consideration. At the same time, MODEL6 and MODEL7 are

30
conducted to examine the causal effects, see both Table 9 and Table 10 below. Table 9 shows the model fit of the four models are all well acceptable.
Table 9 Comparison of model fit from four different models
MODEL4 MODEL5 MODEL6 MODEL7
Acceptable threshold
QCN SWE QCN SWE QCN SWE QCN SWE
Number of Free
Parameters
26 26 27 27 26 26 26 26
RMSEA <.07 0.037 0.017 0.037 0.029 0.037 0.017 0.037 0.017
CFI >.95 0.989 0.997 0.990 0.993 0.989 0.997 0.989 0.997
TLI >.95 0.981 0.995 0.981 0.988 0.981 0.995 0.981 0.995
SRMR <.08 0.028 0.017 0.030 0.017 0.028 0.017 0.028 0.017
*RMSEA=Root Mean Square Error Of Approximation *CFI=Comparative fit index *TLI=Tucker-Lewis Index *SRMR=Standardized Root Mean Square Residual *WRMR=Weighted Root Mean Square Residual *N/A=Not Applicable
As shown in Table 10 below, in MODEL4, after taking away Mathematics self-concept, it shows that Mathematics anxiety does have a negative effect on mathematical literacy in both of the countries. In MODEL5, after taking away Mathematics anxiety, it shows that Mathematics self-concept does have a positive effect on mathematical literacy in both countries.
Table 10 Standardised Model Estimates for MODEL4, MODEL5, MODEL6, MODEL7
Parameter Estimate MODEL4 Standardized
MODEL5 Standardized
MODEL6 Standardized
MODEL7 Standardized
QCN SWE QCN SWE QCN SWE QCN SWE
Measurement Model Estimates
Factor loading (T-VALUE)
Factor loading
(T-VALUE)
Factor loading
(T-VALUE)
Factor loading
(T-VALUE)
Factor loading
(T-VALUE)
Factor loading
(T-VALUE)
Factor loading
(T-VALUE)
Factor loading
(T-VALUE)
MSE NEW37234 0.925 (73.641)
0.890 (103.163)
0.925 (72.982)
0.887 (108.479)
0.925 (73.640)
0.896 (103.162)
0.925 (73.640)
0.896 (103.160)
NEW3781 0.840 (66.628)
0.762 (60.166)
0.839 (66.548)
0.766 (61.917)
0.840 (66.627)
0.762 (60.164)
0.840 (66.627)
0.762 (60.169)
NEW37567 0.736 (35.299)
0.753 (57.056)
0.735 (34.998)
0.760 (58.391)
0.736 (35.299)
0.753 (57.055)
0.736 (35.299)
0.753 (57.058)
MSC NEW4279 N/A N/A 0.744 (35.516)
0.800 (59.471)
N/A N/A N/A N/A
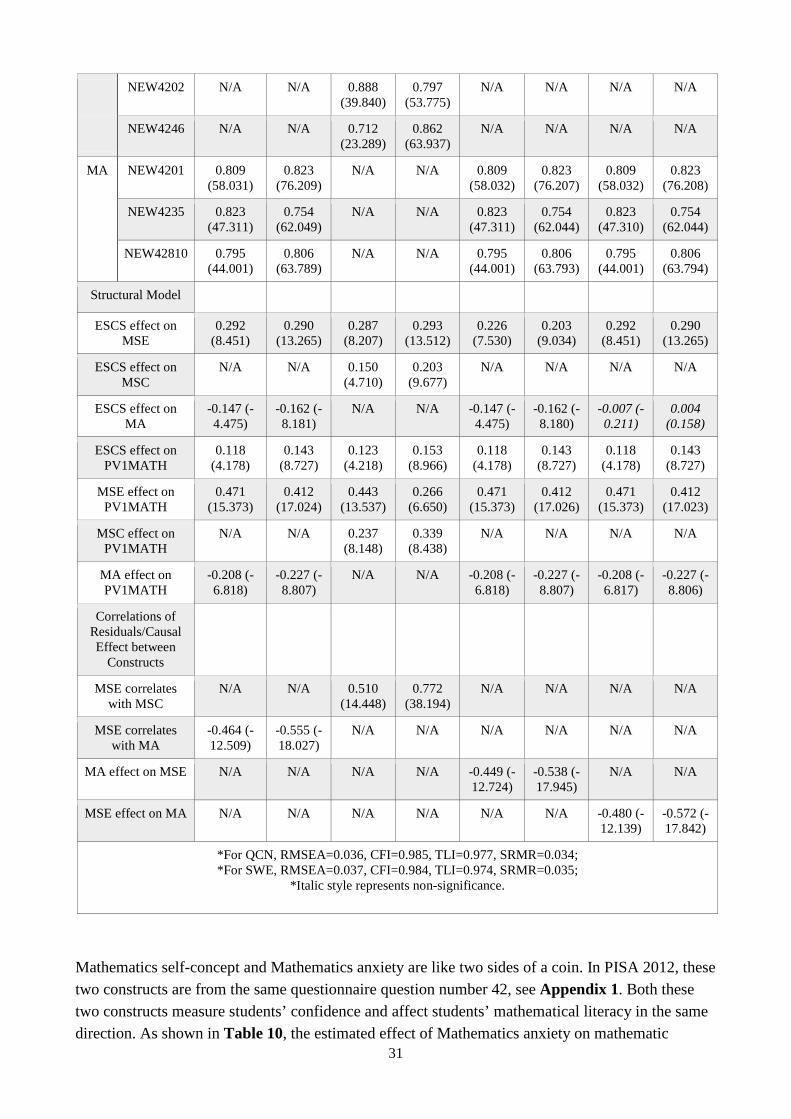
31
NEW4202 N/A N/A 0.888 (39.840)
0.797 (53.775)
N/A N/A N/A N/A
NEW4246 N/A N/A 0.712 (23.289)
0.862 (63.937)
N/A N/A N/A N/A
MA NEW4201 0.809 (58.031)
0.823 (76.209)
N/A N/A 0.809 (58.032)
0.823 (76.207)
0.809 (58.032)
0.823 (76.208)
NEW4235 0.823 (47.311)
0.754 (62.049)
N/A N/A 0.823 (47.311)
0.754 (62.044)
0.823 (47.310)
0.754 (62.044)
NEW42810 0.795 (44.001)
0.806 (63.789)
N/A N/A 0.795 (44.001)
0.806 (63.793)
0.795 (44.001)
0.806 (63.794)
Structural Model
ESCS effect on MSE
0.292 (8.451)
0.290 (13.265)
0.287 (8.207)
0.293 (13.512)
0.226 (7.530)
0.203 (9.034)
0.292 (8.451)
0.290 (13.265)
ESCS effect on MSC
N/A N/A 0.150 (4.710)
0.203 (9.677)
N/A N/A N/A N/A
ESCS effect on MA
-0.147 (-4.475)
-0.162 (-8.181)
N/A N/A -0.147 (-4.475)
-0.162 (-8.180)
-0.007 (-0.211)
0.004 (0.158)
ESCS effect on PV1MATH
0.118 (4.178)
0.143 (8.727)
0.123 (4.218)
0.153 (8.966)
0.118 (4.178)
0.143 (8.727)
0.118 (4.178)
0.143 (8.727)
MSE effect on PV1MATH
0.471 (15.373)
0.412 (17.024)
0.443 (13.537)
0.266 (6.650)
0.471 (15.373)
0.412 (17.026)
0.471 (15.373)
0.412 (17.023)
MSC effect on PV1MATH
N/A N/A 0.237 (8.148)
0.339 (8.438)
N/A N/A N/A N/A
MA effect on PV1MATH
-0.208 (-6.818)
-0.227 (-8.807)
N/A N/A -0.208 (-6.818)
-0.227 (-8.807)
-0.208 (-6.817)
-0.227 (-8.806)
Correlations of Residuals/Causal Effect between
Constructs
MSE correlates with MSC
N/A N/A 0.510 (14.448)
0.772 (38.194)
N/A N/A N/A N/A
MSE correlates with MA
-0.464 (-12.509)
-0.555 (-18.027)
N/A N/A N/A N/A N/A N/A
MA effect on MSE N/A N/A N/A N/A -0.449 (-12.724)
-0.538 (-17.945)
N/A N/A
MSE effect on MA N/A N/A N/A N/A N/A N/A -0.480 (-12.139)
-0.572 (-17.842)
*For QCN, RMSEA=0.036, CFI=0.985, TLI=0.977, SRMR=0.034; *For SWE, RMSEA=0.037, CFI=0.984, TLI=0.974, SRMR=0.035;
*Italic style represents non-significance.
Mathematics self-concept and Mathematics anxiety are like two sides of a coin. In PISA 2012, these two constructs are from the same questionnaire question number 42, see Appendix 1. Both these two constructs measure students’ confidence and affect students’ mathematical literacy in the same direction. As shown in Table 10, the estimated effect of Mathematics anxiety on mathematic
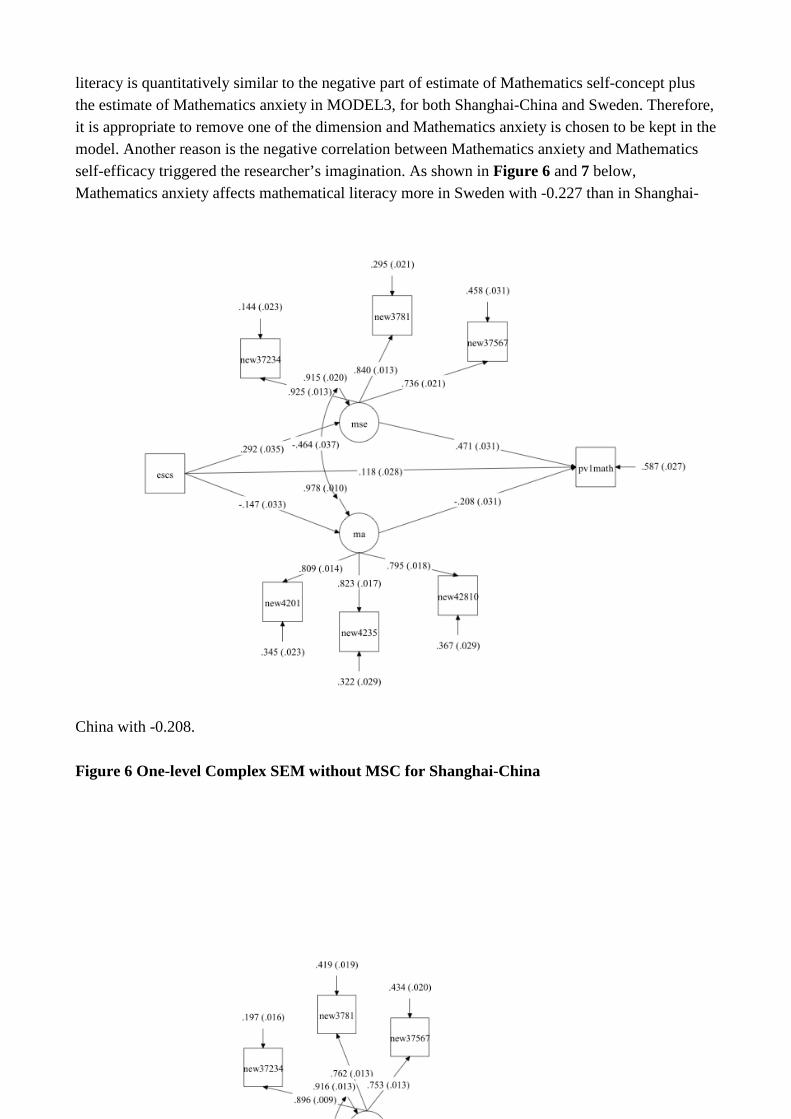
32
literacy is quantitatively similar to the negative part of estimate of Mathematics self-concept plus the estimate of Mathematics anxiety in MODEL3, for both Shanghai-China and Sweden. Therefore, it is appropriate to remove one of the dimension and Mathematics anxiety is chosen to be kept in the model. Another reason is the negative correlation between Mathematics anxiety and Mathematics self-efficacy triggered the researcher’s imagination. As shown in Figure 6 and 7 below, Mathematics anxiety affects mathematical literacy more in Sweden with -0.227 than in Shanghai-
China with -0.208. Figure 6 One-level Complex SEM without MSC for Shanghai-China

33
Figure 7 One-level Complex SEM without MSC for Sweden Furthermore, to examine a causal relationship instead of correlation of residuals between the latent constructs, two models are tested with two different directions. The first model (MODEL6) assumes the effect of Mathematics anxiety on Mathematics self-efficacy while the second model (MODEL7) assumes the effect of Mathematics self-efficacy on Mathematics anxiety. The two models give exactly the same model fit statistics as in MODEL4 which focuses on correlation between residuals of the two latent constructs, as shown in Table 9. Estimates in the measurement model also give almost same result as in MODEL4 as well as the effect of latent construct on Mathematics literary. However, the total effect of Mathematics anxiety on mathematical literacy changes. In MODEL 6 of Shanghai-China, the direct effect of Mathematics anxiety on mathematical literacy is -0.208, while the indirect effect through Mathematics self-efficacy is -0.211 (-0.449*0.471), which means the total effect of Mathematics anxiety on mathematical literacy is -0.419. In MODEL 7 of Shanghai-China, however, the total effect of Mathematics anxiety on mathematical literacy is only direct -0.208, which is two times lower then that in MODEL 6. It is the similar situation in Sweden. Meanwhile, there is tiny difference when modelling effect of Mathematics self-efficacy on Mathematics anxiety. That is the effect of economic, social and cultural status on Mathematics anxiety becomes insignificant for both Shanghai-China and Sweden. Since there is no clear explanation on this so far, it could leave for further research. In summary, Mathematics self-efficacy and Mathematics self-concept have positive effects on mathematical literacy, while Mathematics anxiety has an negative effect in both Shanghai-China and Sweden. Compared with Sweden, Mathematics self-efficacy has a stronger effect on Mathematical literacy in Shanghai-China, while Mathematics self-concept and Mathematics anxiety have lower levels of effect on Mathematical literacy. According to the section above, to some extent, these findings are in correspondence with previous research which shows students who have a higher level of Mathematics self-efficacy and a lower level of anxiety tend to have better Mathematics achievement. But it also goes somewhat against because even though the Swedish students have a higher level of Mathematics self-concept, they did not achieve better results in Mathematics. Meanwhile, students’ economic, social and cultural status plays a more important role in influencing Mathematics literacy in Sweden. Swedish students have much better economic, social and cultural status than students from Shanghai-China (see Table 5), but they achieved lower results in Mathematics, which is contrary to previous research.
7. Discussion In this section, results are discussed in terms of differences of education systems and cultural mentality in the two countries. Then, limitations of this study will be discussed, not only from the aspect of data, but also from the aspect of analysis. Last but not least, there is a guidance or some suggestions for further research in the future.
7.1 Discussions on results in terms of educational system and culture

34
Students from Shanghai-China achieved stunning success, being top of the participant countries with extremely high average score in the outcomes of PISA 2012 Mathematics tests. For Sweden, students had not even achieved the OECD average of Mathematics achievement. It might be reasonable because students from Shanghai-China have a higher level of Mathematics self-efficacy and a lower level of Mathematics anxiety contributing to Mathematics achievement, whereas Swedish students are the opposite. As was put forward at the end of section 6, the Swedish students have a higher level of Mathematics self-concept, why is it not helpful with their Mathematics achievement? There is an interesting point (See Appendix 3 highlight parts), over half of the students from Shanghai-China do not think they get good results in Mathematics, while over 60% of Swedish students hold the opinion that they have good grades in Mathematics. In reality, the average Mathematics score of Swedish students are much lower than those of Chinese students. Furthermore, nearly 70% Chinese students worry about getting poor grades, whereas over half of the Swedish students have the opposite opinion. Why can Chinese students still have high grades even though they are so worried about it? Swedish students do not worry about getting poor grades which indicates a lower level of anxiety, but why do they still have lower achievements? One reason for this finding is likely to be because of the virtue of humility or modesty in Asian countries. The philosophy of Confucianism is widely spread not only in China, but also in other east Asian countries like Japan and Korea (Ho, 1991). Confucianism praises highly the values of education as well as the significance of teachers in China (Leung, 2001). Students are taught to be modest and rate themselves low (Leung, 2006) whenever they get good grades or compliments. In Shanghai-China, students may have deep cultural roots for this due to the edification of Confucianism. The majority of the students are modest but not boastful since they were young, and they are encouraged to rate themselves low, which might be the reason that they tend to have lower confidence when answering questionnaires (Leung, 2006). As mentioned in section 2, Shanghai-China and Sweden have different education system and evaluating standard. “Good grades” are more important to Chinese students because they are the ranking standard of entering better schools and pursuing for higher education, which might be tightly related to their future career. At the same time, in Shanghai-China, the teaching and learning materials are relatively more difficult than what the same age students have in other PISA participant countries (Tan, 2012), students who are above the average grades are regarded to have good academic achievements. On the contrary, national tests in Sweden is carried out as reflections or assessments to what students have learned. This might be the reason that even though Chinese students have achieved good results, they still hold the opinion that they are more anxious and worried about getting “Good grades”. Furthermore, the grading system for students is rather strict, students begin to be graded as soon as they enter primary school. In some provinces, Mathematics worths overall 150 points in the national higher education entrance examination. To get the points, the higher the better and achieving 60% of 150 points, in other words, 90 points is regarded as a pass. However, Sweden used to have Failed (IG), Pass (G), Pass with distinction (VG) and Pass with special distinction (MVG) for grading students not until they are in the 6th grade. From the autumn of 2011, a new grading system is performed in the Swedish school system. There are six

35
scales from A to F, only F is regarded as failing. Even though they do not pass in Mathematics in the national test, they still have opportunities to attend the individual program in upper secondary schools. This might be the possible reason that students in Shanghai-China worry more about getting good grades in Mathematics.
7.2 Limitation and further research 7.2.1 Limitation of PISA resource On one side, all the analyses in this thesis are based on the public dataset from OECD-PISA website. The process of data collection is a huge project, but it is not transparent and we have not access to each individual. The honesty and cautiousness of individuals while reporting their feelings cannot be guaranteed. One the other side, there are 2061 grade 9 students from Shanghai-China and 4496 from Sweden, overall 6557 students. However, only around 4200 students gave valid responses to the questionnaire which are settled in the dataset, regardless of system missing or other missing types. There is quite an amount of missing which might lead to the lack of information and even reverse the overall results. Since the indicators used in this thesis are all from PISA 2012 dataset directly. It has not been examined how well the operationalisation is carried out. Therefore, the issue of discriminant validity is not raised and exploratory factor analysis is beyond the scope of this thesis. 7.2.2 Limitation of analysis As documented in the PISA technical report (OECD 2014, p.147), the plausible values “are not test scores and should be treated as such…If an analysis with plausible values were to be carried out, then it would ideally be undertaken five times, once with each relevant plausible values variable. The results would be averaged, and then significance tests adjusting for variation between the five sets of results computed”. In this case, only PV1MATH is used to indicate students’ mathematical literacy. However, PV1MATH is one of a set of plausible variables. It would be better to run it five times in Mplus and compare the difference. The proper way to use all five plausible value might be to use data TYPE imputation in Mplus. Given the part using parcelling, there are discussions on parcelling practice among researchers who focus on advantages and disadvantages of parcelling (Little, Cunningham, Shahar, & Widaman, 2002). For example, the parcelled variables are more parsimonious than the item-level variables, they have fewer estimated parameters and fewer indicators, which reduces chances for residuals to be correlated. It would also be very difficult to interpret the structural relations among latent variables because of the dimensional composition of the parcels and the resulting construct. Meanwhile, latent variables will share systematic error if they are modelled with parcels. From this aspect, it might be inappropriate to choose parcelling because it might bring misspecification. However, the purpose of this thesis is to examine the effects from self-related questions to Mathematics achievement, instead of focusing on measurement properties of all the indicators. It is not necessary to examine the multidimensionality of indicators that underly the latent constructs. Then parcelling becomes benefit for this thesis, which makes the model parsimonious, as well as it improves the reliability and overall model fit.

36
It is a pity that the chosen variables do not have significant meaning in the cluster level, which makes it not possible to compare differences at the school level. For example, the question “Students have ranging levels of Mathematics self-efficacy, Mathematics self-concept and Mathematics anxiety, is it due to they are in different schools” cannot be explained. 7.2.3 For further research This thesis relies on the analysis of PISA data without taking account of qualitative research methods. It might be helpful to combine quantitative and qualitative methods and to verify whether the results are corresponding or not. One point of interest is the different correlation between Mathematics self-efficacy and Mathematics self-concept between the two countries. In fact these two factor talk about similar things. There is not a big difference for Mathematics self-efficacy observables because people tend to tell the true feeling facing a real Mathematics problem. But for Mathematics self-concept observables, Chinese students tend to be reserved and modest sometimes, stating not confident or not good at Mathematics while in fact they are really good at Mathematics. This is not the case for Swedish students. Therefore, correlation of Mathematics self-efficacy, Mathematics self-concept is bigger in Sweden than in Shanghai-China. It can be further explored that how does students’ Mathematics self-efficacy and Mathematics self-concept predict their mathematical literacy. Since as pointed to by Ferla et al (2006), Mathematics self-efficacy is better in predicting Mathematics achievements, while Mathematics self-concept is better in predicting interest and feelings about Mathematics. This thesis does not mean to focus on students’ interests on Mathematics, but only to examine the effect of the three self-related constructs on mathematical literacy. Therefore, exploring the relationships between Mathematics self-efficacy and Mathematics self-concept in different fields can be further taken into consideration. Given the results in Table 8, ESCS contributes more to Mathematics literacy in Sweden and has less effect on Shanghai-China. It seems that in these two countries, Swedish students are more influenced by ESCS, compared with students from Shanghai-China. It is interesting to see in Table 5 that Chinese students have much lower average of ESCS than Swedish students. However, it is the Chinese parents who are known for their emphasis on devoting money and other resources that they can manage to their children’s education. How on earth does ESCS influence these two countries?
8. Ethical Considerations The ethical problem of the PISA data has already been thoroughly dealt with by the National Research Coordinator in each participating country. Since the present study is a secondary analysis, no individuals can possibly be identified. The PISA data is publicised at PISA homepage, which makes the variables and samples in the survey available to the researcher, for which ethical consent is not required.

37
9. References Abu-Hilal, M. M. (2000). A structural model for predicting Mathematics achievement: Its relation with anxiety and self-concept in Mathematics. Psychological Reports, 86(3), 835-847. Anderson, J. C., & Gerbing, D. W. (1988). Structural equation modeling in practice: A review and recommended two-step approach. Psychological Bulletin, 103(3), 411. Andersson, F., & Nordström, E. (2014). How the education system in China is designed. Malmö University. Teacher education in Mathematics and learning examination seminar. An, S., Kulm, G., & Wu, Z. (2004). The pedagogical content knowledge of middle school, Mathematics teachers in China and the US. Journal of Mathematics Teacher Education, 7(2), 145-172. Ashcraft, M. H. (2002). Math anxiety: Personal, educational, and cognitive consequences. Current directions in psychological science, 11(5), 181-185. Ashcraft, M. H., & Moore, A. M. (2009). Mathematics anxiety and the affective drop in performance. Journal of Psychoeducational Assessment, 27(3), 197-205. Bandura, A. (1977). Social learning theory. New York: General Learning Press. Bandura, A. (1997). Self-efficacy: The exercise of control. New York: Freeman. Bandura, A. (2011). Social cognitive theory. Handbook of social psychological theories, 349-373. Bentler, P. M., & Bonnet, D. G. (1980). Significance tests and goodness of fit in the analysis of covariance structures. Psychological Bulletin, 88, 588-606. Biggs, J.B. 1996, Western Misconceptions of the Confucian-Heritage Learning Culture, in: The Chinese Learner: Cultural, Psychological and Contextual Influences, Watkins D.A. and Biggs, J.B, eds., Comparative Education Research Centre, Hong Kong, pp.45-68 Bollen, K. A. (2014). Structural equations with latent variables. John Wiley & Sons. Bong, M., & Skaalvik, E. M. (2003). Academic self-concept and self-efficacy: How different are they really?. Educational psychology review, 15(1), 1-40. Bradley, R. H., & Corwyn, R. F. (2002). Socioeconomic status and child development. Annual review of psychology, 53(1), 371-399. Byrne, B. M. (2013). Structural equation modeling with Mplus: Basic concepts, applications, and programming. Routledge. Daveya, G., Lian, C. D., & Higgins, L. (2007). The university entrance examination system in China. Journal of Further and Higher Education, 31(4). Diamantopoulos, A., & Siguaw, J. A. (2000). Introducing LISREL: A guide for the uninitiated. Sage.
Eklöf, H. (2007). Self‐Concept and Valuing of Mathematics in TIMSS 2003: Scale structure and relation to
performance in a Swedish setting. Scandinavian Journal of Educational Research, 51(3), 297-313. Fan, L. (2004). How Chinese learn Mathematics: Perspectives from insiders (Vol. 1). World Scientific. Fan, L., & Zhu, Y. (2007). Representation of problem-solving procedures: A comparative look at China, Singapore, and US Mathematics textbooks. Educational Studies in Mathematics, 66(1), 61-75. Ference, G. L. H. R. M. (2004). Teaching with variation: A Chinese way of promoting effective Mathematics learning. How Chinese learn Mathematics: Perspectives from insiders, 1, 309. Ferla, J., Valcke, M., & Cai, Y. (2009). Academic self-efficacy and academic self-concept: Reconsidering structural relationships. Learning and Individual Differences, 19(4), 499-505. Field, A. (2009). Discovering statistics using IBM SPSS statistics. Sage.

38
Frenzel, A. C., Thrash, T. M., Pekrun, R., & Goetz, T. (2007). Achievement Emotions in Germany and China. A Cross-Cultural Validation of the Academic Emotions Questionnaire—Mathematics. Journal of Cross-Cultural Psychology, 38(3), 302-309. Githua, B. N., & Mwangi, J. G. (2003). Students’ Mathematics self-concept and motivation to learn Mathematics: relationship and gender differences among Kenya’s secondary-school students in Nairobi and Rift Valley provinces. International Journal of Educational Development, 23(5), 487-499. Hembree, R. (1990). The nature, effects, and relief of Mathematics anxiety. Journal for research in Mathematics education, 33-46. Ho, D.Y.F. (1991). Cognitive Socialization in Confucian Heritage Cultures, paper presented at the Workshop on Continuities and Discontinuities in the Cognitive Socialization of Minority Children, US Department of Health and Human Services, Washington D.C., June 29-July 2. Hooper, D., Coughlan, J., & Mullen, M. (2008). Structural equation modelling: Guidelines for determining model fit. Articles, 2. Hox, J. J., Moerbeek, M., & van de Schoot, R. (2010). Multilevel analysis: Techniques and applications. Routledge. Huckstep, P. (2007). Elevate or relegate? The relative importance of Mathematics. Cambridge Journal of Education, 37(3), 427-439. Häggström, J. (2008). Teaching systems of linear equations in Sweden and China: What is made possible to learn?. Khine, M. S. (Ed.). (2013). Application of structural equation modeling in educational research and practice. Sense Publishers. Kline, R. B. (2011). Principles and practice of structural equation modeling (3rd ed.). New York: Guilford Press. Lee, J. (2009). Universals and specifics of math self-concept, math self-efficacy, and math anxiety across 41 PISA 2003 participating countries. Learning and Individual Differences, 19(3), 355-365. Leung, F. K. (2001). In search of an East Asian identity in Mathematics education. Educational Studies in Mathematics, 47(1), 35-51. Leung, F. K. (2002). Behind the high achievement of East Asian students. Educational Research and Evaluation, 8(1), 87-108. Leung, K. S. F. (2006). Mathematics education in East Asia and the West: Does culture matter?. In Mathematics education in different cultural traditions-A comparative study of East Asia and the West (pp. 21-46). Springer US. Lindblad, S. (2006). The education system and Mathematics education in Sweden. Mathematics Classrooms in 12 countries: The Insider's Perspective. Little, T. D., Cunningham, W. A., Shahar, G., & Widaman, K. F. (2002). To parcel or not to parcel: Exploring the question, weighing the merits. Structural equation modeling, 9(2), 151-173. Liu, X., Guo, Zh. & Wang, L. (1991). A study of the relations among achievement motivation, self- concept and students’ academic achievement [J]. Psychological Science; 1991-02. Loehlin, J. C. (1998). Latent variable models: An introduction to factor, path and structural analysis. Lawrence Erlbaum Associates Publishers. Luo, X,, Wang, F. & Luo, Z. (2006). Investigations and Analysis on Mathematics Anxiety of Middle School Students[J]; Journal of Mathematics Education; 2008-05. Ma, L. (1999). Knowing and teaching elementary Mathematics: Teachers' understanding of fundamental Mathematics in China and the United States. Mahwah, NJ: Lawrence Erlbaum Associates. Marsh, H. W., & Shavelson, R. (1985). Self-concept: Its multifaceted, hierarchical structure. Educational psychologist, 20(3), 107-123.

39
Marsh, H. W., & Martin, A. J. (2011). Academic self‐concept and academic achievement: Relations and
causal ordering. British Journal of Educational Psychology, 81(1), 59-77. Marton, M. A. (2006). The cultural politics of curricular reform in China: A case study of geographical education in Shanghai. Journal of Contemporary China, 15(47), 233–254. Miller, K. F., Kelly, M., & Zhou, X. (2005). Learning Mathematics in China and the United States. Handbook of mathematical cognition, 163-178. Miura, I. T., Okamoto, Y., Kim, C. C., Chang, C. M., Steere, M., & Fayol, M. (1994). Comparisons of children's cognitive representation of number: China, France, Japan, Korea, Sweden, and the United States. International Journal of Behavioral Development, 17(3), 401-411. Mueller, C. W., & Parcel, T. L. (1981). Measures of socioeconomic status: Alternatives and recommendations. Child Development, 13-30. Muthén, B. (1984). A general structural equation model with dichotomous, ordered categorical, and continuous latent variable indicators. Psychometrika, 49(1), 115-132. Muthén, L. K., & Muthén, B. O. (2010). Mplus User's Guide: Statistical Analysis with Latent Variables: User's Guide. Muthén & Muthén. OECD. (2003). PISA literacy skills for the world of tomorrow – further results from PISA 2000. Paris: OECD and UNESCO. OECD, P. (2009). Data Analysis Manual: SPSS® Second Edition. 2009, 478. OECD (2012). PISA 2012 Assessment and Analytical Framework. Mathematics, Reading, Science, Problem Solving and Financial Literacy. Paris: OECD Publishing. http://www.oecd.org/pisa/pisaproducts/PISA%202012%20framework%20e-book_final.pdf OECD (2014). PISA 2012 Results in Focus: What 15-year-olds Know and What They Can Do With What They Know. Paris: OECD Publishing. http://www.oecd.org/pisa/keyfindings/pisa-2012-results-overview.pdf OECD (2014). PISA 2012 Technical Report. OECD Publishing. Pajares, F., & Miller, M. D. (1994). Role of self-efficacy and self-concept beliefs in mathematical problem solving: A path analysis. Journal of educational psychology, 86(2), 193. Pajares, F., & Miller, M. D. (1997). Mathematics self-efficacy and mathematical problem solving: Implications of using different forms of assessment. The Journal of Experimental Education, 65(3), 213-228. Pajares, F., & Schunk, D. (2001). The development of academic self-efficacy. Development of achievement motivation. United States, 7. Pallant, J. (2013). SPSS survival manual. McGraw-Hill Education (UK). Peker, M., & Ertekin, E. (2011). The relationship between Mathematics teaching anxiety and Mathematics anxiety. The New Educational Review, 23(1), 213-226. Peng, A., & Nyroos, M. (2012). Values in effective Mathematics lessons in Sweden: what do they tell us?. The Mathematics Enthusiast, 9(3), 409-430. Richardson, F. C., & Suinn, R. M. (1972). The Mathematics Anxiety Rating Scale. Journal of CounselingPsychology, 19, 551-554. Seaberg, R. L. (2015). Mathematics Lessons from Finland and Sweden. Mathematics Teacher, 108(8), 593-598. Seaton, M., Marsh, H. W., & Craven, R. G. (2010). Big-Fish-Little-Pond Effect Generalizability and Moderation—Two Sides of the Same Coin. American Educational Research Journal, 47(2), 390-433. Skolverket (2007). Attityder till skolan 2006: Elevernas och lärarnas attityder till skolan. Skolverket rapport 299. Stockholm Skolverket. Stacey, K. & Turner, R. (2015). Assessing Mathematical Literacy-The PISA Experience. Springer Cham Heidelberg New York Dordrecht London.

40
http://link.springer.com.ezproxy.ub.gu.se/book/10.1007%2F978-3-319-10121-7 Stevenson, H. W., Lee, S. Y., Chen, C., Lummis, M., Stigler, J., Fan, L., & Ge, F. (1990). Mathematics achievement of children in China and the United States. Child development, 1053-1066. Tan, C. (2012). Learning from Shanghai: Lessons on achieving educational success (Vol. 21). Springer Science & Business Media. Tan, C. (2012). The culture of education policy making: Curriculum reform in Shanghai. Critical Studies in Education, 53(2), 153–167. Thien, L. M., & Ong, M. Y. (2015). Malaysian and Singaporean students’ affective characteristics and Mathematics performance: evidence from PISA 2012. SpringerPlus, 4(1), 1-14. Ullman, J. B. (2007). Structural equation modeling. In B. G. Tabachnick & L. S. Fidell, Using multivariate statistics (5th ed., pp. 676-780). Needham Heights, MA: Allyn & Bacon. Wang, J., & Lin, E. (2005). Comparative studies on US and Chinese Mathematics learning and the implications for standards-based Mathematics teaching reform. Educational researcher, 34(5), 3-13. Wu, M. (2005). The role of plausible values in large-scale surveys. Studies in Educational Evaluation, 31(2), 114-128. Yang, Y., Wang, L. & Luo, R. (2008). Relationship between mathematic anxiety and sense of mathematic self-efficacy, mathematic learning strategies and achievement [J]. Journal of Mathematics Education; 2008-06. Yu, C. Y. (2002). Evaluating cutoff criteria of model fit indices for latent variable models with binary and continuous outcomes (Doctoral dissertation, University of California Los Angeles). Other resources http://www.skolverket.se http://skolnet.skolverket.se/polopoly/utbsys-eng/ https://www.oecd.org/pisa/aboutpisa/ https://data.oecd.org/pisa/mathematics-performance-pisa.htm#indicator-chart http://pisa2012.acer.edu.au/downloads.php

41
10. Appendices Appendix 1
Student’s questionnaire about Mathematics self-efficacy (MSE), Mathematics self-concept (MSC) and Mathematics anxiety (MA)
ST37 How confident do you feel about having to do the following Mathematics tasks? (Please tick only one box in each row.) a) Using a <train timetable> to work out how long it would take to get from one place to another. b) Calculating how much cheaper a TV would be after a 30% discount. c) Calculating how many square metres of tiles you need to cover a floor. d) Understanding graphs presented in newspapers. e) Solving an equation like 3x+5= 17. f) Finding the actual distance between two places on a map with a 1:10,000 scale. g) Solving an equation like 2(x+3) = (x + 3) (x - 3). h) Calculating the petrol consumption rate of a car. ST42 Thinking about studying Mathematics: to what extent do you agree with the following statements? (Please tick only one box in each row.) a) I often worry that it will be difficult for me in Mathematics classes. b) I get very tense when I have to do Mathematics homework. c) I get very nervous doing Mathematics problems. d) I feel helpless when doing a Mathematics problem. e) I worry that I will get poor <grades> in Mathematics.

42
a) I am just not good at Mathematics. b) I get good <grades> in Mathematics. c) I learn Mathematics quickly. d) I have always believed that Mathematics is one of my best subjects. e) In my Mathematics class, I understand even the most difficult work.
*The original questionnaire blended Mathematics self-concept and Mathematics anxiety together in ST42, here the statements are respectively separated to make it clear to read and analyse.
Appendix 2 Several steps of handling data before analysis Step 1: Recode the questionnaire variables with value 7 = “N/A”, 8 = “Invalid”, 9 = “Missing” all into Missing value -99. Step 2: Reverse the scale for each variable and recode them into new variables naming starts with “NEW” (ST37Q01 into NEW3701), so that the positive response gets a higher value and the negative response gets a lower value. For example, reverse 1= “Very confident” or 1= “Strongly agree” to 4= “Very confident” or 4= “Strongly agree”. * A special case is variable ST42Q02, “Mathematics Self-Concept - Not good at Mathematics”,
which has a negative value itself. So in this case, when students response with 1= “Strongly agree”, means he or she thinks that themselves are not good at Mathematics, which shows a positive response with a negative value then. Therefore, there is no need to reverse the value.
Step 3: Recode the country code variable “CNT” with values of “QCN” and “SWE”, to a new variable “NEWCNT” with values of 0 and 1, for Shanghai-China and Sweden respectively.
Table 2 Name Label and Value of used Variables Name Label Value Latent Mathematics Self Efficacy
NEW3701
Mathematics Self Efficacy Using a <Train Timetable> 1 = “Not at all confident” 2 = “Not very confident” 3 = “Confident” 4 = “Very confident” -99 = “Missing”
NEW3702 Mathematics Self Efficacy Calculating TV Discount NEW3703
Mathematics Self Efficacy Calculating Square Metres of Tiles NEW3704 Mathematics Self Efficacy Understanding Graphs in Newspapers NEW3705 Mathematics Self Efficacy Solving Equation 1 NEW3706 Mathematics Self Efficacy Distance to Scale NEW3707 Mathematics Self Efficacy Solving Equation 2 NEW3708 Mathematics Self Efficacy Calculate Petrol Consumption Rate Latent Mathematics Self Concept
1 = “Strongly disagree”
NEW4202 Mathematics Self Concept Not Good at Mathematics NEW4204 Mathematics Self Concept Get Good <Grades> NEW4206 Mathematics Self Concept Learn Quickly
43
NEW4207 Mathematics Self Concept One of Best Subjects 2 = “Disagree” 3 = “Agree” 4 = “Strongly Agree” -99 = “Missing” * FOR NEW4202 1 = “Strongly Agree” 2 = “Agree” 3 = “Disagree”
NEW4209 Mathematics Self Concept Understand Difficult Work Latent Mathematics Anxiety NEW4201 Mathematics Anxiety Worry That It Will Be Difficult NEW4203 Mathematics Anxiety Get Very Tense NEW4205 Mathematics Anxiety Get Very Nervous NEW4208 Mathematics Anxiety Feel Helpless NEW4210 Mathematics Anxiety Worry About Getting Poor <Grades> NEWCNT Country code 0=“QCN” 1=“SWE” ESCS Index of economic social and cultural status PV1MATH Plausible value 1 in Mathematics PV2MATH Plausible value 2 in Mathematics PV3MATH Plausible value 3 in Mathematics PV4MATH Plausible value 4 in Mathematics PV5MATH Plausible value 5 in Mathematics

44
Appendix 3
This part is to discuss all the observed variables which are used in the modelling part and try to find some insights to put into the model. The analysis is mainly run in IBM SPSS 22. As mentioned in part 3.2, there are 2061 grade 9 students from Shanghai-China and 4496 students from Sweden who have been engaged in PISA 2012. But in reality, not all the students answer or have valid response to the questionnaire. Number of responses to each question within the questionnaire varies. There are eighteen observed indicators in questionnaire, which are categorical data in range of 1, 2, 3 and 4, with all the missing of value “-99”. Among those, eight variables make up latent variable Mathematics self-efficacy (MSE), five make up latent variable Mathematics self-concept (MSC) and the other five make up latent variable Mathematics anxiety (MA). The distributions of responses to all these questions are listed in Table 3 Freq_Indictor.
Table 3 Freq_Indictor
NEWCNT
N Not at all confident
Not very Confident
Confident Very Confident
Mathematics Self-Efficacy - Using a <Train Timetable>
QCN 1380 1.1% 7.6% 37.0% 54.3%
SWE 2924 1.7% 8.7% 41.1% 48.5%
Mathematics Self-Efficacy - Calculating TV Discount
QCN 1380 .6% 3.9% 29.1% 66.4%
SWE 2925 2.2% 15.1% 37.6% 45.0%
Mathematics Self-Efficacy - Calculating Square Metres of Tiles
QCN 1380 .9% 5.7% 29.9% 63.6%
SWE 2923 5.1% 28.4% 36.6% 30.0%
Mathematics Self-Efficacy - Understanding Graphs in Newspapers
QCN 1373 .8% 6.5% 35.3% 57.4%
SWE 2920 1.8% 10.9% 43.2% 44.1%
Mathematics Self-Efficacy - Solving Equation 1 QCN 1380 .6% 2.0% 18.3% 79.1%
SWE 2926 2.9% 13.1% 29.9% 54.1%
Mathematics Self-Efficacy - Distance to Scale QCN 1379 .8% 4.2% 23.5% 71.5%
SWE 2919 7.6% 29.5% 37.6% 25.3%
Mathematics Self-Efficacy - Solving Equation 2 QCN 1380 .9% 3.7% 19.3% 76.2%
SWE 2909 8.9% 31.4% 35.9% 23.8%
Mathematics Self-Efficacy - Calculate Petrol Consumption Rate
QCN 1379 2.2% 16.2% 38.7% 43.0%
SWE 2915 9.3% 32.3% 40.9% 17.4%

45
N Strongly disagree
Disagree Agree Strongly Agree
Mathematics Self-Concept - Not Good at Mathematics
QCN 1373 15.1% 43.0% 30.7% 11.1%
SWE 2879 25.0% 40.5% 22.6% 11.8%
Mathematics Self-Concept - Get Good <Grades> QCN 1371 7.0% 54.4% 31.5% 7.1%
SWE 2857 7.2% 27.5% 46.5% 18.8%
Mathematics Self-Concept - Learn Quickly QCN 1373 6.0% 43.0% 39.9% 11.1%
SWE 2863 9.7% 30.8% 44.1% 15.4%
Mathematics Self-Concept - One of Best Subjects QCN 1373 13.2% 43.7% 27.5% 15.6%
SWE 2862 30.3% 34.8% 21.7% 13.2%
Mathematics Self-Concept - Understand Difficult Work
QCN 1374 11.7% 51.4% 27.9% 9.0%
SWE 2842 18.3% 34.5% 35.0% 12.1%
N Strongly disagree
Disagree Agree Strongly Agree
Mathematics Anxiety - Worry That It Will Be Difficult
QCN 1373 13.2% 40.5% 32.3% 14.1%
SWE 2883 16.9% 41.2% 31.5% 10.4%
Mathematics Anxiety - Get Very Tense QCN 1368 16.7% 55.6% 21.1% 6.7%
SWE 2880 27.7% 48.0% 18.2% 6.1%
Mathematics Anxiety - Get Very Nervous QCN 1372 17.2% 57.9% 19.6% 5.3%
SWE 2873 28.3% 53.8% 14.5% 3.3%
Mathematics Anxiety - Feel Helpless QCN 1373 21.4% 54.5% 18.7% 5.4%
SWE 2863 27.9% 51.6% 15.9% 4.6%
Mathematics Anxiety - Worry About Getting Poor <Grades>
QCN 1374 8.4% 22.3% 45.8% 23.6%
SWE 2872 23.2% 32.0% 27.5% 17.3%

46
Appendix 4
TITLE: ONE-LEVEL COMPLEX MODEL FOR SHANGHAI & SWEDEN DATA: FILE IS GRADE9_Shanghai-Sweden_For Parceling.dat; VARIABLE: NAMES ARE SCHOOLID StIDStd ST04Q01 CULTDIST CULTPOS ESCS fisced HEDRES HERITCUL hisced hisei HOMEPOS HOMSCH OUTHOURS PARED WEALTH PV1MATH PV2MATH PV3MATH PV4MATH PV5MATH PV1READ PV2READ PV3READ PV4READ PV5READ PV1SCIE PV2SCIE PV3SCIE PV4SCIE PV5SCIE W_FSTUWT senwgt_STU NEW3701 NEW3702 NEW3703 NEW3704 NEW3705 NEW3706 NEW3707 NEW3708 NEW4202 NEW4204 NEW4206 NEW4207 NEW4209 NEW4201 NEW4203 NEW4205 NEW4208 NEW4210 NEWCNT NEW3712 NEW3781 NEW37234 NEW37567 NEW4235 NEW42810 NEW4246 NEW4279; USEVARIABLES ARE ESCS PV1MATH NEW3781 NEW37234 NEW37567 NEW4202 NEW4246 NEW4279 NEW4201 NEW4235 NEW42810; MISSING ARE all (-99); USEOBSERVATION (NEWCNT EQ 0); ! OR (NEWCNT EQ 1) CLUSTER=SCHOOLID; WEIGHT=W_FSTUWT; DEFINE: PV1MATH=PV1MATH/100; ANALYSIS: TYPE=COMPLEX; ESTIMATOR=MLR; MODEL: MSE BY NEW37234 NEW3781 NEW37567 ; MSC BY NEW4279 NEW4202 NEW4246 ; MA BY NEW4201 NEW4235 NEW42810 ; PV1MATH ON ESCS MSE MSC MA; MSE MSC MA ON ESCS; MSE MSC MA WITH MSE MSC MA; NEW4279 WITH NEW4246; OUTPUT:STDYX SAMPSTAT MODINDICES;