how did the upa spend our money? - cbga india
TRANSCRIPT


EDITORIAL TEAM
Praveen Jha, Yamini Mishra, Subrat Das and Pooja Parvati
CBGA TEAM
Bhumika Jhamb, Deepak L Xavier, Divya Singh, Gyana Ranjan Panda, Harsh SinghRawat, Indranil, Jawed Alam Khan, Kaushik Ganguly, Khwaja Mobeen Ur-Rehman,Nilachala Acharya, Pooja Parvati, Ranjeet Singh, Rupashree Mohapatra, Sakti Golder,Subrat Das, Sumita Gupta, Trisha Agarwala, Yamini Mishra
Cover Design and Layout: Cogent Reach, Email: [email protected]
Printed By: Bhavya Offset, Email: [email protected]
Centre for Budget and Governance Accountability (CBGA)
A-11, Second Floor, Neeti Bagh, New Delhi-110049Tel: 91-11-4174 1285/ 86/ 87, Fax: 91-11-26537603Email: [email protected], Website: www.cbgaindia.org


Foreword 5
Summary of Key Observations 7
Education 9
Health 17
Water Supply & Sanitation 25
Rural Development & Employment 31
Agriculture 39
Food & Nutrition Security 51
Women 57
Children 71
Dalits and Adivasis 79
Minorities 87
Resource Mobilisation & Fiscal Federalism 95
Acronyms 105
CONTENTS

The UPA Government has completed its five year term at the Centre and the country is in the process of electing thenext Government. One of the major challenges for the next Government would be to tackle the impact of the globaleconomic recession on India. Progressive thinkers, policy analysts and activists have been raising a concern withregard to the willingness of our policymakers to address the needs of the disadvantaged sections of our population,who have been hit hard with the economic downturn. In this regard, the policy interventions by the next Governmentwould be very important. The year 2009-10 should also witness a mid-term evaluation of the Eleventh Five Year Plan(2007-08 to 2011-12) and adoption of the required course correction in the Plan for the remaining three years.Moreover, the Thirteenth Finance Commission would submit its recommendations for the next five years(i.e. 2010-11 to 2014-15) by the end of 2009. These policy recommendations would play a significant role in shapingup the fiscal policy space of the State Governments as well as the strength of fiscal decentralisation in the countryover the next five years.
In this backdrop, we have made an attempt to assess the expenditure priorities and resource mobilisation efforts ofthe UPA Government over its five year term, from the perspective of the disadvantaged sections who constitute amajority of our population. We have analysed the six Union Budgets (including the Interim Budget of 2009) of theUPA Government with the objective of demystifying their policy priorities and implications for the disadvantagedsections of our population.
We have also tried to assess the performance of the UPA Government as against its avowed commitments set downin the National Common Minimum Programme (NCMP), which was certainly much more than a mere document ofpolicy intent. It embodied the promises made by the UPA following the electoral verdict of General Elections 2004which was clearly a mandate against the market driven policy regime of the previous Government. In this context, wehave also tried to take stock of the actual performance of UPA vis-à-vis its promises in some of the important socialand economic sectors.
This publication would be circulated widely among the Members of Parliament, including all Members of the FifteenthLok Sabha, policymakers, academicians, civil society organizations, grassroots activists and the media. We hope thiseffort by CBGA would be useful towards informing people about the deficiencies in budgetary policies of the outgoingGovernment which need to be rectified by the next Government as well as the positive developments over the lastfive years which have to be further consolidated. Your feedback on this document would be most welcome.
Foreword

Summary of Key ObservationsThe electoral verdict of 2004 General Elections was widely seen as a mandate against the pro-market policy regime ofthe National Democratic Alliance Government. In such a backdrop, in 2004, the United Progressive Alliance (UPA)Government had started its tenure at the Centre with numerous promises for the social and economic sectors and thedisadvantaged sections of the country's population, which were presented in the form of a National Common Mini-mum Programme (NCMP). Most of these promises implied significant commitments in terms of public resources,which are allocated through Union Budget and State Budgets. During its five year tenure, the UPA Government didintroduce a number of progressive policy measures; however, many of its pro-poor and pro-marginalised promiseshave remained unfulfilled until now when the country is going to have the next General Elections.
Let us first take note of some of the progressive policy measures and budgetary trends observed during the regime ofthe UPA Government from 2004 to 2009, which are as given below:
• The notification of the Right to Information Act, which has tremendous potential for improving governance inthe country, has been one of the most significant developments during the UPA regime at the Centre.
• A landmark achievement of the UPA regime has been the enactment of National Rural Employment GuaranteeAct in 2005 and the subsequent implementation of National Rural Employment Guarantee Scheme (NREGS),making 100 days of wage employment for unskilled work a right for people in the rural areas.
• Bharat Nirman, a programme for augmenting key infrastructure sectors across the rural India, has also been asignificant policy measure taken by this Government.
• The National Rural Health Mission (NRHM), introduced in 2005-06, has added the important component of a'Flexible Resource Pool for States' to the various schemes being implemented by the erstwhile Department ofFamily Welfare (which has been merged with Department of Health under the Ministry of Health & FamilyWelfare at the Centre). There are several serious concerns pertaining to the long term implications of the NRHMframework for public sector healthcare in our country; nonetheless, there is evidence from a number of backwardStates that it has helped in reviving the public sector healthcare infrastructure in the rural areas. Also, the UPAGovernment launched a National Urban Health Mission (NUHM) in 2009.
• Likewise, Sarva Shiksha Abhiyan (SSA), which was accorded a lot of importance as one of the flagship schemesof the UPA, has indeed led to a revival of school infrastructure at the elementary level in the backward States;although, educationists and child rights activists have raised serious concerns with regard to the long termimplications of some of the ad hoc measures (such as large scale recruitment of contract or para teachers) whichhave been institutionalised through SSA.
• Starting from 2007-08, i.e. the first year of the Eleventh Five Year Plan, the Union Budget allocations for second-ary education and higher education were stepped up significantly. This Government also needs to be com-mended for paying attention to the acute need for expansion of technical education and skill development acrossthe country.
• The UPA Government stepped up the Union Budget allocations for a number of schemes in the social sector, suchas, SSA, Mid Day Meal, NRHM, Integrated Child Development Services, Total Sanitation Campaign and Acceler-ated Rural Water Supply Programme. As a result, the total Union Budget allocation for social sector registered asharp increase starting from 2005-06.
• In the last two years of its tenure, the Government introduced the Debt Waiver Scheme for farmers and enacteda Social Security Legislation for Unorganised Workers, both of which were commendable steps.
• The Union Budget documents reflected a willingness on the part of this Government to improve the policypriorities for women, children, dalits and adivasis, as separate Statements on Gender Budgeting, Budgeting forChildren, and Budgeting for Dalits and Adivasis were introduced (in the Union Budget) during the UPA regime.Although the mere introduction of a Statement in Budget documents does not ensure any improvement in thepublic investments for a particular section of population, it is certainly a step towards increasing the government'saccountability for development of the disadvantaged sections. Likewise, the UPA Government also introducedthe practice of Outcome Budgeting, which aims to measure the development outcomes of budgetary invest-ments and hence puts emphasis on effective implementation of the hundreds of programmes and schemesbeing run by the Union and State Governments.
• Also, following the recommendations of the Twelfth Finance Commission (for 2005-06 to 2009-10), the Govern-ment increased substantially the magnitude of Non-Plan Grants to States, which in turn is believed to havehelped the States in increasing the development spending from their budgets during 2005-06 to 2007-08.

These are some of the important policy measures/ developments pertaining to the UPA regime, which need to beconsolidated further in the regime of the next Union Government.
However, there are many concerns pertaining to policy priorities and budgetary provisions for critical sectors whichhave remained unaddressed at the end of UPA's five-year tenure. Moreover, this regime has also given rise to anumber of new concerns with regard to the development of the poor and marginalised sections of our population.The deficiencies in budgetary policies of the outgoing Government which need to be rectified by the next Governmentinclude the following:
• Fiscal conservatism of the UPA Government resulted in the magnitude of Total Public Expenditure in India beingstagnant at around 27 per cent of the GDP during the years from 2004-05 to 2007-08. In order to expand theoverall fiscal policy space available to government for making public investments towards socio-economic devel-opment, the magnitude of Total Public Expenditure from the Union Budget and State Budgets needed to bestepped up significantly, which would have required the policymakers to adopt a liberal fiscal policy much beforethe onset of the economic recession in 2008-09.
• The UPA Government did not take any concrete measure towards providing greater fiscal policy space to theState Governments. Despite strong demands from the States, the Eleventh Five Year Plan has not shifted anysignificant number of Central Schemes to the States. On the other hand, the imposition of Fiscal Responsibilityand Budget Management (FRBM) legislation on the States through recommendations of the Twelfth FinanceCommission (relating to the Debt Relief Scheme for States) has constrained significantly the fiscal policy spaceavailable to the State Governments for public investments. Thus, the UPA Government continued the trend ofgrowing centralisation of the federal fiscal architecture in the country which has been witnessed over the last oneand half decades.
• The magnitude of Total Tax Revenue in India had increased from 15 percent of the GDP in 2003-04 to 18.1percent of the GDP in 2007-08 (BE). However, even at the present level, the magnitude of Total Tax Revenue inIndia falls far short of the levels of tax revenue collected in several other countries, and it is inadequate from thepoint of view of the magnitude of public investment needed in the country. In this context, we must note that theUPA Government should have stepped up significantly the revenue collections from direct taxes through imposi-tion of Capital Gains Tax, higher rates of Wealth Tax, and higher rates of taxes on speculative gains made in thestock markets, which were largely ignored by the Government.
• This Government should also have taken strong measures to curb the magnitude of tax revenue foregone due totax exemptions, thereby, increasing the volume of tax collections significantly. Retaining only the progressiveelements in such tax exemptions, the Government should have done away with many of the exemptions given tothe affluent sections of the population, such as the exemptions given to the private corporate sector and thosein the indirect taxes on commodities that are consumed mainly by the richer sections of the population.
• During the first four years, i.e. from 2004-05 to 2007-08, the budgetary provisions made by this Government didnot shown any visible improvement in the priority for economic services, which include crucial sectors like agricul-ture, irrigation and rural development. The Union Budget allocations for economic services registered a notewor-thy increase only in 2008-09 when the country started witnessing the adverse impact of the global economicrecession.
• Food insecurity and widespread nutritional deprivation continue to be one of the most challenging problemsconfronting our country. But, the Union Budget allocations for Public Distribution System of foodgrains remainedstagnant during the UPA regime even when the country had witnessed a steep rise in the prices of food articles.Thus, the NCMP promise of providing universal food security has remained an empty rhetoric!
• In its NCMP, the UPA had promised to raise the total public spending on health in our country to the level of 2 to3 percent of the GDP; however, there is absolutely no change in the overall public spending on health (as aproportion of the country's GDP) at the end of its tenure. India's total public spending on health continues to beabysmally low, at about 1% of the GDP, which is one of the lowest in the world; while its private (out of pocket)spending on health, nearing 5 percent of the GDP, continues to be one of the highest in the world.
• Likewise, the UPA had promised to raise the total public spending on education in the country to the level of 6percent of the GDP; but, there was absolutely no progress in that direction during its tenure. India's total publicspending on education continues to be as low as less than 3.5 percent of the GDP.
• On the contrary, several of the policy initiatives taken by the UPA Government have paved the way for a greaterrole for the private sector in the provisioning of basic social services like health and education. The policymakers

at the Centre have now opined frequently in favour of shifting the approach of public investments from 'usersubsidy' to 'access subsidy' in crucial sectors like, education, health and food security, by providing coupons/vouchers to the targeted beneficiaries for accessing these basic services from the market instead of expanding theinfrastructure for public sector provisioning of these services. The assumptions underlying this kind of policyadvocacy are highly questionable; and the next government needs to recognize the grave concerns pertaining tothe same.
• One of the most disappointing aspects of the policy regime of the UPA Government was its strong adherence tofiscal conservatism, which manifested explicitly in the form of the Fiscal Responsibility and Budget Management(FRBM) Act for the Centre and the imposition of fiscal conservatism upon the States through the recommenda-tions of the Twelfth Finance Commission. As a result of its adherence to fiscal conservatism until 2008-09, theUPA Government was unable to significantly step up its investments on development sectors even during aperiod of increased buoyancy of taxes and collection of higher amounts of tax revenues. Moreover, the Statesalso were tied down to targets for deficit reduction, which in turn restricted their ability to step up developmentspending any significantly. As a result, crucial promises made in the NCMP, such as, increasing total publicspending on education to 6 percent of GDP or raising total public spending on health to 2 to 3 percent of GDPremained far from being fulfilled.
• As regards the flagship schemes in the social sector, which were provided higher Union Budget allocations duringthe UPA tenure, the problems pertaining to their implementation and their limited impact on developmentoutcomes have persisted. This is because of a number of reasons, such as the following- (a) Centrally SponsoredSchemes have numerous limitations as compared to States' own Plan Schemes; (b) despite its emphasis onintroducing Outcome Budgeting, the UPA Government did not carry out any reforms in the budgetary processesin the country (many of which are archaic and unsuitable for increasing public expenditure substantially); (c) mostStates have checked their Non-plan spending on social sector and focused only on increasing the Plan spendingon social sector, which has led to a gradual weakening of their programme implementation apparatus in thesocial sector; (d) most of the flagship schemes rely on grossly underpaid contract staff as frontline service provid-ers, with the conditionalities associated with such schemes preventing the State Governments from hiring regularstaff or paying them decent remunerations; and (e) adequate measures for fiscal decentralisation, with appropri-ate devolution of funds, functionaries and functions to institutions of local self governance, have not been carriedout in any of the States. Hence, despite its avowed focus on the flagship social sector schemes, the UPA Govern-ment cannot be expected to have brought about any significant improvement in the development outcomes inthe social sector.
• As has already been observed, the mere introduction of a Statement in Budget documents (such as the one onGender Budgeting or Budgeting for Children or Budgeting for Dalits and Adivasis) does not ensure any improve-ment in the public investments for any of the disadvantaged sections of our population. We must note here that,despite the introduction of the Gender Budgeting Statement in Union Budget documents, the overall magnitudeof resources committed to development of women has remained very low (at about 5 percent of the UnionBudget). Also, there is an urgent need for deepening of the Gender Budgeting exercises being carried out by theUnion Government Ministries. Likewise, the magnitude of Union Budget allocations earmarked for child survivaland health related interventions and interventions for protection of children in difficult circumstances have re-mained grossly inadequate during the UPA's tenure. Similarly, despite the introduction of a Statement on schemesbenefiting dalits and adivasis, the UPA Government did not take any strong measure for the adherence ofimportant planning strategies like Special Component Plan for SCs and Tribal-area Sub Plan. With regard to theminorities, the creation of a separate Ministry of Minority Affairs could not lead to any perceptible improvementin the priority for Union Government's investments on development of minorities.
These are some of the serious concerns pertaining to the implications of Union Budget for the poor and disadvan-taged sections of our population, which would need to be addressed by the next Union Government.


10
We all would have heard the oft-repeated adage that, ‘the more things change, the more they remain the same’.This, we find, is true in the case of the United Progressive Alliance (UPA) government’s tenure and more specifically,the attention paid to a critical sector such as Education. When the UPA in 2004-05 promised to bring about sweepingchanges in education attainments and outcomes through their many flagship programmes and schemes, there wasmuch to hope for. With the tabling of the Union Budget (Interim) 2009-10, signaling an end of the UPA term, we findnot much has changed. A brief review of the promises made, the money spent and the outcomes achieved is in order.
A. Promises and Policy Pronouncements
A.i. Promises made by the UPA
Broadly, the UPA, through its National Common Minimum Programme (NCMP) committed to attainment of specificgoals, key among them being: (a) bringing the level of public spending on education to 6% of GDP, (b) introducing aCess to finance universal and quality education, (c) tabling a Bill ensuring education as a fundamental right to allchildren, (d) increasing access and enrolment through spending on the flagship schemes of the UPA, and (e) establishinga National Commission on Education (the previous one was constituted in 1964).
A.ii. Key Policies on Education during the UPA Tenure
Looking at the five years of the UPA, the following policy initiatives merit mention:
• ‘The Right of Children to Free and Compulsory Education Bill, 2008’ introduced in Parliament.
• Launching of Centrally Sponsored Schemes at the secondary stage such as Rashtriya Madhyamik Shiksha Abhiyan(RMSA), Model School Scheme (2500 model schools being established in Educationally Backward Blocks), InclusiveEducation of the Disabled at the Secondary Stage (IEDSS), Girls’ Hostel Scheme, Information and CommunicationTechnology in Schools Scheme, Access and Equity (Strengthening of Boarding and Hostel Facilities for Girl Students)Scheme.
• Schemes such as Infrastructure Development Private Aided/Unaided Minority Institutes and Scheme providingQuality Education in Madrasas (SPQEM) focus on the Minority section of population.
• Six new Indian Institutes of Technology (IITs) functioning: one each in Bihar, Andhra Pradesh, Rajasthan, Orissa,Gujarat and Punjab. Two more IITs in Madhya Pradesh and Himachal Pradesh to commence in 2009-10.
Education
• Public spending on Education as a proportion of GDP has been stagnant between 3% (in 2004-05) to 3.2% (in2006-07) since the beginning of the UPA regime, belying the commitment made by UPA to spend 6% of GDPon Education.
• The Union Government introduced a 2% Cess to finance universal and quality education at the elementarystage in 2004-05, with an additional 1% Cess towards secondary and higher education in 2007-08. While therationale had been to supplement the spending by the Government, the budgetary trend reveals that the Cesshas, to a great extent, come to substitute the Government's own spending (i.e. Gross Budgetary Support) andtransferred the burden on to the people (through the Cess contributions that account for about a third of thetotal spending on education).
• The 'Right of Children to Free and Compulsory Education' Bill drafted first during the UPA tenure in June2005 (there was a draft Bill during the NDA tenure as well) was approved by the Union Cabinet in November2008 to be tabled in Parliament in the last session of the 14th Lok Sabha. Although this is a significantsteptowards ensuring universal elementary education, the status of the Bill remains unclear as with theelection of a new government in 2009, in all likelihood, the entire procedure could be repeated all over again,thereby bringing to naught the progress made so far.
• With regard to increasing access and enrolment through spending on flagship schemes, data reveals thatthere has been substantial stepping up in the expenditure on specific schemes in the last five years although ithas stagnated in the past two years for schemes such as Sarva Shiksha Abhiyan and Mid Day Meal Scheme. Aconsiderable growth in spending has been recorded in the secondary education sector in the last year of itstenure to indicate the UPA's focus, if they are able to form a government at the Centre in 2009-10.
• The commitment to form a National Commission on Education to review the sector as a whole has not beenrealized. Nevertheless, the National Knowledge Commission and the National Advisory Council did presentseveral policy alternatives and useful recommendations relating to education sector to the Union Government.

www.cbgaindia.org
HOW DID THE UPA SPEND OUR MONEY?
• One new Indian Institute of Management (IIM) established at Shillong. Six more IIMs to come up during theEleventh Plan.
• 15 new Central Universities approved with every state having at least one Central University.
• Five new Indian Institutes of Science Education & Research (IISERs) have started functioning at Kolkata, Pune,Mohali, Bhopal and Thiruvananthapuram.
• Two new Schools of Planning and Architecture (SPAs) set up in Bhopal and Vijayawada.
• 1500 Industrial Training Institutes (ITIs) to come up at block level to enhance employment-oriented vocationaleducation.
B. Major Proposals in the Eleventh Five Year Plan
In this context, it is also worthwhile to scan the monitorable socio-economic targets in education that have beenoutlined in the Plan:
• Reduction in the drop out rates of children from elementary school from 52.2% in 2003-04 to 20% by 2011-12,i.e. by the end of the Eleventh Plan period.
• Developing minimum standards of educational attainment in elementary schools, to ensure quality education.
• Increasing the literacy rate for persons of age 7 years or more to 85% by 2011-12.
• Lowering the gender gap in literacy to 10 percentage points by 2011-12.
• Increasing the percentage of each cohort going to higher education from the present 10% to 15% by 2011-12.
With all these goals, it is useful to understand how much and to what extent the government has spent on education.The following section highlights the same.
C. Public Spending on Education during 2004-05 to 2008-09
C.i. Public Spending on Education by the Union Government
We find that public spending at the level of Union Government has increased but only in a small measure and notenough to make a difference to the overall level of spending by the country on education. Spending as a proportionof the GDP increased from 0.42% (2004-05) to 0.7% (2009-10 BE).
Table-1.1.: Union Government’s Expenditure on Education* as a proportion of GDP
Year Union Government’s Expenditure Union Govt. Expenditure onon Education* (in Rs. Crore) Education as a Proportion of GDP (in %)
2002-03 9069.36 0.37
2003-04 10144 0.37
2004-05 13098 0.42
2005-06 17808 0.50
2006-07 23809.6 0.57
2007-08 27184.9 0.58
2008-09 RE 37366.5 0.69
2009-10 BE 41978.2 0.70
Note: *This does not include spending on education by Ministries in Government of India other than MHRD. GDP figures used for 2008-09 REand 2009-10 BE are as cited in the Union Budget 2009-10, Government of India; that for 2007-08 is from Indian Public Finance Statistics 2007-08; and those for prior years are from Economic Survey 2007-08.Source: 1. Expenditure Budget Volume-I for several years; 2. Economic Survey2006-07 and 2007-08, GOI; Indian Public Finance Statistics 2007-08 & Budget at a Glance, Union Budget 2009-10
C.ii. Public Spending on Education by the States
The States too have a dismal story to recount with their budgetary spending hovering around 2.25% to 2.39% as aproportion of GDP in the last five years.

12
Table-1.2.: Budget Expenditure on Education by the States (Education Departments)
Year Revenue Account Capital Outlay Loans & Advances Total States’ Total Ependiture(in Rs. Crore) on Education as % of GDP
2003-04 64280 648 49 64977 2.35
2004-05 69371 984 128 70483 2.25
2005-06 78147 1716 53 79916 2.23
2006-07 89578 2379 16 91973 2.22
2007-08 RE 106474 3756 21 110251 2.35
2008-09 BE 122072 4635 11 126718 2.39
Source: State Finances: A Study of Budgets 2008-09, RBI
C.iii. Public Spending on Education by the Centre and States (Combined)
The promised 6% of GDP as public spending on education remains as elusive today (at 3.24% in 2006-07) as it waswhen the UPA came to power in 2004-05 (3.09% of GDP). Although the budgeted spending has marginally increasedfor the country with the Education Departments spending more as compared to the Other Departments (Figure 1.3),looking at Figure 1.1, we find that the budgeted expenditure on education by Education and Other Departments(Centre and States) as a share of GDP is on the decline. Spending on education as a share of the total budget for allsectors also has remained at about the same level for both the Centre and the States, reflecting low priority for thiscritical sector (Figure 1.4).
Table-1.3.: Budget Expenditure on Education by Education Department and Other Departments (Centre and all States)
Education Other Total Total GDP Total PublicDepartment Departments (Rs. in crore) Expenditure (in Rs. Expenditure on(in Rs. crore) (in Rs. crore) on Education crore) Education as %
of GDP
2000-01 Centre 7925.4 2270.7 10196.1 3.1 2102314 3.94
States 54965.4 17717.7 72683.1 20.7
Centre+States 62890.8 19988.4 82879.2 12.3
2001-02 Centre 8053.2 6082.5 14135.7 3.9 2278952 3.53
States 57434.8 8935.5 66370.2 17.4
Centre + States 65488 15018 80506 10.8
2002-03 Centre 9089.2 7067.4 16156.6 3.9 2454561 3.50
States 59854.4 9878.4 69732.8 16.4
Centre + States 68943.6 16945.8 85889.4 10.2
2003-04 Centre 10177.5 6923.5 17101 3.6 2754621 3.26
States 63519.8 9110.8 72630.7 16.9
Centre + States 73697.3 16034.3 89731.6 11.8
2004-05 Centre 13111.2 4914.7 18026 3.6 3149412 3.09
States 68850.3 10498.5 79348.8 17.1
Centre + States 81961.5 15413.3 97374.8 11.8
2005-06 Centre 17824.5 5386.6 23211.1 4.6 3580344 3.19
States 77819.3 13358.4 91177.7 4.2
Centre + States 95643.8 18745.0 114388.8 4.3
2006-07RE Centre 242505.5 6387.7 30638.2 5.3 4145810 3.37
States 93121.1 15962.9 109084.1 5.5
Centre + States 117371.7 22350.7 139722.4 5.5
2007-08 BE Centre 32354.2 6990.9 39345.0 5.8 4713148 3.37
States 101225.2 18667.0 119892.3 5.7
Centre + States 133579.4 25657.9 159237.3 5.7
Source: Compiled from “Analysis of Budgeted Expenditure on Education”, Ministry of HRD, Govt. of India - various issues; Indian Public FinanceStatistics, 2007-08, Ministry of Finance, June 2008
Education

www.cbgaindia.org
HOW DID THE UPA SPEND OUR MONEY?
Figure-1.1.: Budget Expenditure on Education by Education Department and Other Departments (Centre and all States)
Source: Compiled from “Analysis of Budgeted Expenditure on Education”, Ministry of HRD, Govt. of India - various issues
Figure-1.2.: Budget Expenditure on Education by Education Departments (Centre and all States)
Source: Compiled from “Analysis of Budgeted Expenditure on Education”, Ministry of HRD, Govt. of India - various issues
Figure-1.3.: Total Budgeted Expenditure on Education (Centre and States)
Source: Compiled from “Analysis of Budgeted Expenditure on Education”, Ministry of HRD, Govt. of India - various issues
Figure-1.4.: Expenditure on Education by Centre and States as a proportion of their Total Budget for all Sectors
Source: Compiled from “Analysis of Budgeted Expenditure on Education”, Ministry of HRD, Govt. of India - various issues

14
C.iv. Public Spending on Major Schemes in Education Sector in the Country
While the government has been blowing its own trumpet about increasing allocations, even at the level of schemes,we find that allocations for the flagship schemes have actually stagnated since 2007-08. For instance, in SarvaShiksha Abhiyan (SSA), the Union Government started shifting an increasing share of the fund responsibility on to theStates since 2007-08 and the overall spending on the scheme has never matched the overall budget for all Statesapproved under SSA.
At the secondary stage, Scheme for Universal Access & Quality at the Secondary Stage (SUCCESS) that was introducedin 2007-08 has been re-designed into a Mission similar to SSA: the Rashtriya Madhyamik Shiksha Abhiyan (RMSA) toensure quality affordable secondary education for all. Allocations to University Grants Commission and for TechnicalEducation have registered a marginal increase.
Table-1.5.: Union Budget Outlays on Select Programmes and Schemes under Ministry of Human ResourceDevelopment (in Rs. Crore)
Programme/ 2003-04 RE 2004-05 RE 2005-06 RE 2006-07 RE 2007-08 RE 2008-09 RE 2009-10 BEScheme
Sarva Shiksha 2732.3 4753.6 7166.3 10145.7 12020.2 11940 11933.9Abhiyan (SSA)
Mid Day Meal 1375.0 1507.5 3010.8 4813.2 6004 9513.6 9518.2
Strengthening of 150.0 186.3 180.0 162.0 266.6 285.2 450Teachers TrainingInstitutions
Rashtriya Madhyamik … … … … 0.15 224 1143.4Shiksha Abhiyan(RMSA) / Scheme forUniversal Access &Quality at the SecondaryStage (SUCCESS)
Navodaya Vidyalaya 569.56 524.86 624.85 753.25 968.80 1420.8 1511.3Samiti
University Grants 1629.1 1808.1 2099.3 2700.2 3581.9 5482.3 6545.1Commission*
Technical Education 1465.5 1441.4 1414.9 1736.3 2001.8 4189.3 4749.5(Total)*
Note: 1. Allocations for all programmes/schemes given above (unless specifically shown with an asterisk *) do not include the Lump sumProvision for North Eastern Areas and Sikkim. Starting from the year 2000-01, most of the Line Ministries/ Departments in the Union Governmentare reporting their expenditure on North Eastern Areas, under different schemes, separately under a head called “Lumpsum provision forprojects/ schemes for the benefit of the North Eastern Areas and Sikkim”. The amounts booked under this specific head for different schemes arenot shown separately for most of the Ministries/ Departments in the Union Budget documents. 2. * Allocations for these programmes/ schemesinclude the Lump sum provision for North Eastern Areas and Sikkim (if any).Source: Compiled from Demand Nos. 57 & 58, Expenditure BudgetVol. II (Notes on Demands for Grants), Union Budget, various years.
Education
Table 1.4: Public Expenditure on Education as a proportion of GDP in India
1981-82 1990-91 1999-2000 2001-02 2003-04 2004-05 2005-06 2006-07RE 2007-08BE
Elementary 1.09 1.58 1.58 1.66 1.31 1.40 1.61 1.73 1.69
Secondary 0.81 1.10 0.94 0.98 0.84 0.82 0.89 0.92 0.93
Higher 0.38 0.36 0.47 0.43 0.32 0.31 0.67 0.70 0.70
Adult - - - - 0.01 0.01 0.01 0.01 0.01
Technical - - - - - - 0.28 0.27 0.33
Source: Compiled from "Analysis of Budgeted Expenditure on Education", Ministry of Human Resource Development, Govt. of India - variousyears

www.cbgaindia.org
HOW DID THE UPA SPEND OUR MONEY?
D. Outputs/ Services delivered by Government Intervention and Development Outcomes
Having looked at the key goals in education as well as the extent of financing the same by the government, it is onlymeaningful that we examine the progress made, if any, in terms of development outcomes and outputs / servicesdelivered through the initiatives adopted by the government. Table 1.6 highlights some of these outcomes. Withregard to enrolment, there has been an increase in numbers but when seen in the light of girls’ participation, thereis nothing much to flaunt. In 2002-03, the share of girls’ enrolment at the primary level was 47% which in 2007-08is 48%! Similarly, the share of SC / ST enrolment has also been stagnant since 2002-03.
Table-1.6: Selected Outcomes Indicators in Education (2002-03 to 2007-08)
Outcomes 2002-03 2005-06 2007-08
Enrolment (Class I-V) 101155152 124615546 134132183
Enrolment (Class VI-VIII) 27662763 43667786 50911110
% Girls’ Enrolment (I-V) 47.18 47.79 48.22
% Girls’ Enrolment (VI-VIII) 44.2 45.8 46.99
Gender Parity Index (I-V) 0.89 0.92 0.93
Gender Parity Index (VI-VIII) 0.79 0.84 0.89
% SC Enrolment 19.9 18.64 19.83
% ST Enrolment 7.8 9.02 10.95
Source: Arun C Mehta, Analytical Report – Elementary Education in India; 2003, 2006 & Flash Statistics 2007-08, National University of EducationPlanning and Administration, New Delhi
Table-1.7.: Selected Outputs/Services Delivered through Government Intervention (2002-03 to 2007-08)
Key Indicators 2002-03 2005-06 2007-08
% Distribution of Schools without Pucca Building 29.81 29.44 27.02
Average Number of Classrooms (All Schools) 3 3.8 4.3
% Schools without Drinking Water Facility (All Schools) 20.5 16.93 13.25
% Schools having Common Toilet (All Schools) 34.34 52.39 62.67
% Schools without Girl’s Toilet (All Schools) 77.78 62.58 49.45
% Schools without Boundary Wall (All Schools) 40.01 49.33 49.78
% Schools without Computer (All Schools) 92.98 89.27 85.75
% Schools without Ramp (All Schools) 95.37 82.86 65.57
Average Student-Classroom Ratio (All Schools) 43 39 35
% Schools with Student-Classroom Ratio > 60 (All Schools) 10.7 18.37 13.21
% Single-Teacher Schools (All Schools) 2 12.17 10.13
% Schools having Pupil-Teacher Ratio > 60 (All Schools) 17.97 13.76
% Schools having Pupil Teacher Ratio > 100 (All Schools) 4.5 5.3 3.86
Source: Arun C Mehta, Analytical Report – Elementary Education in India; 2003, 2006 & Flash Statistics 2007-08, National University of EducationPlanning and Administration, New Delhi
Further, when we examine the progress made in terms of outputs/ services delivered, it is again quite a revelation.Table 1.7 finds that since 2002-03, despite increased provisioning and a bevy of schemes announced almost everyyear, not much has changed. Provision of basic amenities (such as a pucca building) continues to be a challenge.Interestingly, the share of single teacher schools has risen substantially in the past five years, which even if we discountfor the increase in the number of schools, is substantial.
Another trend observed has been the growth of private service providers in education at almost all levels; a case inpoint is Figure 1.5 where a resurgence of private schools is found. In this regard, the Eleventh Plan also ‘suggests’

16
public private partnership as an alternative for not just higher and secondary levels, but also at the elementary stageand institutes of scientific research and training. Given the pitiable state of affairs with regard to infrastructure andoutcomes, the private players might not be as keen as the government could have been to change the status quo.
Figure-1.5.: Growth of Private Schools Providing Elementary Education (in %)
26.5
18.816.8
15.213.7
15.713.8
7.99.7
5
10
15
20
25
30
1903 1973 1979 1986 2002 2003 2005 2006 2007
Source: 1903 figure taken from “Statistical Abstract Relating to British India 1903-1912, Digital South Asia Library; 1973 figure taken fromThird All India Education Survey; 1979 figure taken from Fourth All India Education Survey; 1986 figure taken from Fifth All India EducationSurvey; 2002 figure taken from Seventh All India Education Survey; 2003, 2005, 2006 and 2007 figures taken from Elementary Education inIndia: An Analytical Report.
E. NCMP – UPA Commitment on Education: Where Do We Stand Today?
Having made a summary scan of the sector and the financial provision to the same by the UPA government, we cansafely conclude that much needs to be done. While the NCMP had a lot of promise, it has not delivered on many ofthese. Creation of a fund to supplement the financial resources of the Central government, initiating several programmesand schemes with specific time-bound deliverables, establishing new institutes for higher education, scientific andtechnical training, although well-meaning, have not been adequate to bring about concrete change in any smallmeasure. The outcome indicators say it all.
It might be relevant at this stage to note that while the government has begun to look beyond focusing on justelementary level of education, as is evident from a slew of schemes for the secondary and higher secondary level, itis also true that a concerted, holistic approach towards education would go a long way rather than diverting attentionto one sector within education and changing track to focus on another level even before any significant progress hasbeen made. The SSA targets were to have been accomplished by 2010 apart from having made education a right forevery child – both of which remain unaccomplished.
In this regard too, the UPA is lauding itself for having tabled the Bill to ensure that education be a right for all children.It, however, is astounding that the government, about to complete its five years, has just about managed to table theBill in Parliament and that too with objectionable and much-criticized provisions, far short of ensuring that it becomesa legal entitlement.
Some of the positive steps taken by the government have been introduction of schemes to make quality secondaryeducation affordable through several Centrally Sponsored Schemes (CSS) although the reliance on CSS is, in itself, acause for concern. This, when seen in juxtaposition with the Eleventh Plan that proposes heavy reliance on the PublicPrivate Partnership (PPP) model, reveals the course steered by this government in its tenure, i.e. reinforcing theneoliberal policy framework. There was much to be hoped from the government in terms of the stimulus it wouldprovide to critical sectors. However, it found the easy way out with the economic recession validating its inaction and‘urging’ it to focus more on PPP-driven infrastructure projects than on education.
Education
16

www.cbgaindia.org
HOW DID THE UPA SPEND OUR MONEY?

18
The United Progressive Alliance's (UPA) tenure is over. It came to power amidst lot of fanfare and popular aspirations.The mandate was to reinvigorate the development of rural India and the social sector, which were utterly neglectedin the erstwhile National Democratic Alliance regime. The UPA made several crucial promises: to step up publicinvestment in rural development, agriculture and the social sector. In fact it initiated some measures, which couldreally have made a difference had they been properly implemented. The National Rural Employment Guarantee Act,Right To Information Act, the National Rural Health Mission, the Bharat Nirman had the potential to change thingswhere it mattered most. Now that the Fifteenth Loksabha Elections are in the offing, the UPA has started patting itsback on a self-congratulatory note, through eye-catching ads, claiming that they have lived up to their promises. (Asif they have not learned from the mistakes of the ill-famous 'India Shining Campaign'!). As a civil society organizationit is our duty to demystify these claims and unravel the reality. In the health sector, things have mostly remained at thelevel of rhetoric; meanwhile, ground realities have gone from bad to worse. Time has passed by the UPA..
A. Promises Made by the UPA and Its Policy Initiatives
A.i. NCMP Promises on Health
The National Common Minimum Programme (NCMP) of the UPA, which sets out the broad policy direction of thegovernment, recognized the urgency of health crisis and committed to increase public expenditure to 2-3% of GDPfrom the current level which is less than 1%. This is the minimum that the government needs to spend in order toprovide basic minimum health care to the entire population but in actual terms this means huge increases in expen-diture. Given that the government health system so far, was characterized by abysmally low levels of spending, it wascrucial that the UPA fulfills its commitment and also spends on areas which cater to the largest section of thepopulation.
A.ii. Major Policies Announced During the UPA Regime
The UPA Government had come up with several new policies and measures, which generated huge enthusiasm-National Rural Health Mission (NRHM) has been launched, National Urban Health Mission is in the anvil, SwasthyaBima Yojana (Health Insurance Scheme) has been launched, a new National Drug Policy is being formulated. But, theground reality has hardly changed.
The flagship Programme of the UPA, the NRHM, launched in 2005, aimed at improving the availability of and accessto quality health care by people, especially those residing in rural areas, the poor, women and children. Though it talksabout comprehensive care, in reality, NRHM is an umbrella Programme of existing schemes and Programmes like RCH(Reproductive Child Health), Family Welfare, and National Disease Control Programme. Apart from Accredited SocialHealth Activist (ASHA) and Janani Suraksha Yojana (JSY), there is hardly any new initiative. The central motive ofNRHM, disguised in the rhetoric of 'dramatic improvement in the health system' is family planning- which is regressiveand coercive in any form and needs to be exposed and opposed.
It is also very important to note that the lack of absorptive capacity of the States is an outcome of the chronic lack ofinvestment on fundamental issues of infrastructure, availability of drugs, skilled manpower, training etc. Improvingabsorptive capacity is a long term process and will require sustained efforts towards strengthening management andinstitutional capacities, filling up vacant posts, higher salaries, much greater expenditure on drugs and other consumablesetc. Knee-jerk responses like Public-Private Partnership (PPP) may not be the solution. It might aggravate the problem.NRHM should aim towards provision of universal public health system with greater funding from domestic budget
Health
• Public spending on health continues to be abysmally low, at about 1% of the GDP, despite the UPA'scommitment in its NCMP to raise the same to the level of 2-3% of the GDP.
• With regard to the composition of spending on health, some vital concerns persist. Communicable diseasescontinue to be accorded lesser priority as opposed to spending on HIV-AIDS control and the influence ofCentrally Sponsored Schemes in public spending on health is on the rise.
• Several programmes and schemes launched by the UPA have generated some positive impact although a lotmore was needed with regard to operationalizing the programmes. National Rural Health Mission (NRHM),National Urban Health Mission (NUHM), Rashtriya Swasthya Bima Yojana (National Health Insurance Scheme),formulation of a new National Drug Policy are some of the initiatives. A proposed Sarva Swasthya Abhiyanmerging both NRHM and NUHM has also been envisaged in the Eleventh Plan.
• Lack of absorptive capacity of the States continues to be a matter of concern, which is mainly an outcome ofchronic lack of investment on fundamental aspects like infrastructure, availability of drugs, skilled manpower,training, etc. Improving absorptive capacity will require sustained efforts towards strengthening managementand institutional capacities such as filling up vacant posts, higher salaries, much greater expenditure on drugsand other consumables.

www.cbgaindia.org
HOW DID THE UPA SPEND OUR MONEY?
instead of a targeted approach based on donor funded priorities.
Another very significant policy announcement that has come up the Swasthya Bima Yojana (Health Insurance Scheme)for BPL families in the unorganised sector in all districts of the country. The Scheme intends to issue health cards toBPL families which act as insurance coverage to them and the premium is paid by the state and central governmentsjointly. Though the scheme is at a nascent stage and deserves deeper study to comment upon, it can be seen as a steptowards social security in the unorganised sector in India. At the same time, restricting the scheme to BPL familiesleaves out a significant section of the unorganised workers, who may be marginally above the poverty line butdefinitely require social support. Further, there are apprehensions that this can act as a source of profit for theinsurance companies, with little benefit for the rural people in the absence of any health facility.
B. Major Proposals in the Eleventh Five Year Plan
The Eleventh Five Year Plan aims to introduce National Urban Health Mission (NUHM), which along with NRHM, willform Sarva Swasthya Abhiyan. NRHM has been launched for meeting health needs of all age groups and to reducedisease burden across rural India. NUHM will be launched to meet the unmet needs of the urban population. Insteadof providing access to public health services to the urban population, NUHM is based on health insurance and PPPwhich is supposed to provide integrated health service delivery to the urban poor with the initial focus on urbanslums. NUHM would cover all cities with a population of more than 100,000. NUHM will be aligned with NRHM andexisting urban schemes.
During the Eleventh Five Year Plan, the Ministry of Health and Family Welfare (MoHFW) will take up a Programme forPrevention and Control of Water Borne Diseases as a part of Sarva Swasthya Abhiyan, which will establish a mecha-nism of collaboration with other departments (for supplying safe water to the community and carry out water qualitymonitoring), with specific responsibilities. The targets are: (i) to reduce the burden of waterborne diseases to 75% ofthe present level by 2010; and (ii) to reduce the burden of waterborne diseases to 50% of the present level by 2015.
C. Public Spending during 2004-05 to 2008-09
C.i. Spending on the Sector from the Union Budget: 2004-05 to 2008-09
Unfortunately in the five years of the UPA, the commitment to spend 2-3% of GDP on health remained as elusive asever. Though in absolute terms there is some increase in expenditure of the Central Government, when adjusted withgrowth rate of GDP and inflation the increase is meagre. The Total Expenditure of the Union Government on Healthand Family Welfare went up from Rs. 9,649.24 crore in 2005-06 to Rs. 18,476 crores in 2008-09 RE. But for the year2009-10 there is a marginal increase of Rs. 324 crore. The fact of the matter is there is no increase in Plan expenditurefor the year 2009-10 compared to the previous year.
The Union government had accorded marginally higher priority to Health and Family Welfare in the Union Budgetduring 2004-05 to 2007-08. In 2003-04, only 1.58% of the Union Budget was spent on health. The share of healthgradually increased to 2.11% in 2007-08 (Fig 2.1). But in 2008-09 and 2009-10, it subsequently went down. Thisclearly reflects the declining priority of UPA government on health compared to what it spends on other sectors likeDefence. In a situation of recession when the entire population is facing the brunt of job cuts, and low growth rates,such an important aspect of social security is being neglected by the UPA.
Figure-2.1.: Expenditure on Health as % of Total Union Budget
Source: Expenditure Budget, Vol I, Union Budget, various years
2.112.021.97
1.721.581.65
2.051.97
0
0.5
1
1.5
2
2.5
2002-03 2003-04 2004-05 2005-06 2006-07 2007-08 2008-09 BE 2009-10 RE

20
C.ii. Spending on Health and Family Welfare in the Budgets of all States
Public Health being a State subject, major spending responsibility lies with the State. Unfortunately, there was agradual decline in spending on health and family welfare by all States as proportion to GDP, since 2002-03. Over theperiod 2001-02 to 2008-09, health gradually received lesser priority within social sector and in budgets of all States.Expenditure on health as a proportion of social sector expenditure decreased from 13.06% in 2002-03 to 11.12% in2008-09. As a proportion to total budgets of all States also, health sector has received gradually lesser priority duringthis phase. As a proportion of GDP, the share of health expenditure of all States declined between 2001-02 and2004-05, but increased in subsequent years. In fact during the UPA regime, at the centre, there is almost a secularincrease. A constant decline in health expenditure as a proportion of total budget of all States or spending in socialsector and at the same time a gradual increase of health expenditure as a proportion of GDP means that thoughstates spend more overall, but the increase is not commensurate with the increase in total budget of all States. AsStates have spent more over time, priority on health decreased.
Table-2.1.: Expenditure of all States on Health and Family Welfare (in Rs. crore)
2001-02 2002-03 2003-04 2004-05 2005-06 2006-07 2007-08 (RE)2008-09 (BE)
GDP (at Current Prices) 2278952 2454561 2754621 3149412 3580344 4145810 4713148 5426277
Total Expenditure 368680 410249 514302 553428 561682 657280 787489 892783
Expenditure on 129253 133648 146164 164077 189430 222988 285512 332532Social Sector
Health and Family 16048 16451 17529 18771 22031 25375 31567 36961Welfare
H& FW as % of 12.42 12.31 11.99 11.44 11.63 11.38 11.06 11.12Social SectorExpenditure
H&FW as % of 4.35 4.01 3.41 3.39 3.92 3.86 3.53 3.61Total Budget
H&FW % of GDP 0.70 0.67 0.64 0.60 0.62 0.61 0.67 0.68
Source: Expenditure figures are from RBI: State Finances - A Study of Budgets for various years. GDP figures from 2001-02 to 2006-07 are fromCSO, Consolidated Accounts of India; www.mospi.nic.in, for 2007-08 the figures are from IPF Statistics 2007-08, Ministry of Finance; while2008-09 figure from Budget at a Glance, Union Budget 2009-10.
C.iii. Total Public Spending in the Country
Total public spending on health includes spending by several agencies- the states incur major proportion of expendi-ture; along with central and local governments. Apart from Ministry of Health and Family Welfare, other centralministries also spend on health. It is difficult to calculate the total amount of spending as availability of data of centraldepartments and local bodies is not easily available. We have tried to calculate the spending by departments of Healthand Family Welfare of the Centre and States, considering that these two agencies incur as much as 90% of the totalspending (according to estimates of Commission on Macroeconomics and Health).
Table-2.2.: Combined Expenditure of Centre and States on Health and Family Welfare (in Rs. crore)
Centre’s States Centre+ State as a % GDP (at Centre as % Total as %
Expenditure Expenditure State Total current GDP of GDPExpenditure prices)
1 2 3 4=2+3 5=3 as % of 4 6 7=2 as % of 6 8=4 as % 6
2001-02 5936.89 16048 21984.89 73.0 2278952 0.26 0.96
2002-03 6503.81 16451 22954.81 71.7 2454561 0.26 0.94
2003-04 7249.14 17529 24778.14 70.7 2754621 0.26 0.90
2004-05 8085.95 18771 26856.95 69.9 3149412 0.26 0.85
2005-06 9649.24 22031 31680.24 69.5 3580344 0.27 0.88
2006-07 11757.74 25375 37132.74 68.3 4145810 0.28 0.90
2007-08 14410.37 31567 45977.37 68.7 4723400 0.31 0.97
2008-09 RE 18476 36961 55437 66.7 5426277 0.34 1.02
2009-10 BE 18808 6021426 0.31
Notes: Figures of Central Expenditure for 2001-02 to 2007-08 are actuals while figure for 2008-09 is Revised Estimates (RE), and those for 2009-10 are Budget Estimates (BE), and for States's Expenditure, 2007-08 data is Revised Estimates and 2008-09 data is Budget Estimates. Centre'sexpenditure does not include the expenditure by various other ministries and departments.Source: Expenditure Budget Volume I for various years and RBI: State Finances - A Study of Budgets for various years. GDP figures from 2001-02to 2006-07 are from CSO, Consolidated Accounts of India; www.mospi.nic.in, for 2007-08 to 2009-10 are from Medium Term Fiscal PolicyStatement, Union Budget 2009-10.
Health

www.cbgaindia.org
HOW DID THE UPA SPEND OUR MONEY?
C.iv. Total Public Spending in the Country on Major Schemes in the Sector
(a) Communicable diseases are accorded lesser priorities
Communicable diseases are still major killers in India. Unfortunately, they are accorded very little priority in the UnionBudgets. Since 2004-05, there is a continuous decline in the share of National Disease Control Programme (NDCP) inthe Union Budget. At the same time, there is a substantial increase in the expenditure on HIV & AIDS alone. In2001-02 RE, only Rs. 199.7 crore was spent on HIV&AIDS, amounting to 3.3% of the health budget. In 2007-08 RE,Rs.1,133.39 crore were allotted, which is 7.6% of Union Budget (Fig 2.2). It has increased further to Rs. 1,310.71crore. Compared to this the allocation on NDCP was Rs 482.46 crore in 2001-02 RE which increased marginally toRs. 980.48 crore in 2007-08 RE and Rs. 1,025 crore in 2008-09 BE. This does not mean that the amount spent onHIV&AIDS should be brought down, but communicable diseases should also be accorded adequate priority, which asof now does not get reflected in the Union Budget. In a situation where Pulse Polio Immunization Programme alonegets Rs. 1,100.58 crore, Rs. 980.48 crore allotted to NDCP is no doubt a paltry sum.
Figure-2.2.: Proportion of Health and Family Welfare Budget Spent on AIDS and other Communicable Diseases
0.0
1.0
2.0
3.0
4.0
5.0
6.0
7.0
8.0
9.0
NDCP 7.5 6.8 8.5 8.2 7.1 6.9 6.5 5.5
AIDS 3.3 3.3 2.8 6.5 4.7 7.7 7.6 7.1
2001-02
RE
2002-03
RE
2003-04
RE
2004-05
RE
2005-06
RE
2006-07
RE
2007-08
RE
2008-09
RE
Pe
rce
nt
of
He
alth
Bu
dg
et
Source: Expenditure Budget Vol II, Union Budget, various years.
(b) Allocation on NRHM remained below par:
The financing of NRHM so far reveals that it focuses more on selective interventions and the aspect of universalisationis neglected. According to the mission document, the initial allocation for NRHM for the year 2005-06 would beRs. 6,700 crore, and in subsequent years 30% increase will take place. But for 2005-06, no separate head for NRHMwas created and funds for the existing programmes were used. For 2005-06, plan outlay on NRHM was Rs. 6,075.17crore. It received an increased outlay of Rs. 7,155.97 crore (RE) as plan funds in 2006-07. This has been furtherincreased to Rs. 9,801 crore (BE) in 2007-08 and RS. 10,786.25 crore in 2008-09. But for the year 2009-10 allocationon NRHM has almost stagnated. The non-plan outlays for these years remained almost stagnant around Rs. 32.29crore (2005-06 RE), Rs. 34.40 crore (2006-07 RE), Rs. 38 crore (2007-08 BE) and Rs. 44.25 crore. Even the commitmentto increase allocations by 30% every year has been violated. The increase has been 18-20% in nominal terms,whereas the real increase is much lesser. Further, around 80% of the increase in allocations took place in fourcomponents: HIV/AIDS Programme, Reproductive & Child Health (RCH), medical education and AYUSH (AyurvedaUnani Siddha Homoeopathy); whereas strengthening of the PHC infrastructure remained grossly neglected1.Furthermore, under Urban and Rural Family Welfare, which essentially means paying salaries for the ANMs, there hasnot been any substantial increase. This clearly reflects the lack of willingness on the part of the government to putbasic infrastructure and human resources in place.
Figure-2.3.: Expenditure on NRHM (Figures in Rs. crore)
1200211987.52
6075.17
7190.37
9634.81
2005-06 RE 2006-07 RE 2007-08 RE 2008-09 RE 2009-10 BE
Source: Expenditure Budget Vol II, Union Budget, various years. www.indiabudget.nic.in

22
(c) Increasing Influence of Centrally Sponsored Schemes (CSS) in Public Spending on Health & Family Welfare
There is an ever growing influence of Centrally Sponsored Schemes in health in recent years. Schemes like NRHM, theVertical Disease Control Programmes and RCH, which are financed partially or fully by the Centre, and implementedby the States, have gained increasing priority in the finances of health care. In 2002-03, even though only 17% of thehealth budget of the Centre and States were allocated to the CSS; there is a substantial increase since 2006-07. In2007-08 RE as much as 37.5% allocation are through CSS only. This clearly reveals a tendency of centralization inhealth care spending. Further, major CSS bypass State Budgets and are routed through different societies, thusleaving very little choice to States in spending. The entire budget of NRHM bypasses the state budget and goes toState Health Societies of respective states. The increasing influence of CSS also reveals in some sense the inability ofthe States to step up public investment on health. Public Health, being a State subject, must be devolved more fundsby the Centre to spend on their priorities.
(d)Growing Influence of External Agencies
The Standing Committee on Health and Family Welfare in its 21st Report registered strong objection over the practiceof including external assistance in the gross budget of the Department. In 2008-09 BE, the provision for ExternallyAided Projects in Central Plan was Rs. 3,237.71 crore. This is an increase of Rs. 723.43 crore over the previous year.For 2009-10 BE it marginally reduced to Rs. 3,192.71crore. The Committee observed that if the practice of includingexternal aid in domestic budget continues, then the commitment of the government to raise the allocation in thehealth sector to 2-3% of GDP will remain only on paper and not be realized in actual practice. Moreover, theCommittee also felt that financing non-plan expenditure by external aid is not a healthy practice. Further, it should benoted that the total contribution of external aid in health is merely 2% (Report of National Commission on Macroeco-nomics and Health, 2005) and there is no reason to believe that we desperately need such meagre amounts. Giventhat there is an enormous influence of these foreign agencies on our health policies and the little contribution theymake to our finances, India should completely do away with these funds and develop health services according to itsnational requirements. Unfortunately, there is no such effort in this direction. There is rather a gradual tendency to falla prey to the whims of these donors.
D. Outputs/ Services delivered by Govt. Interventions and Development Outcomes
D.i. Indicators of Outputs/ Services Delivered by Govt. Interventions
There is a huge shortfall in primary health care infrastructure in the country. According to the 2001 PopulationCensus, the shortfall in rural health infrastructure comes to 20,855 Sub-Centres, 4,883 Primary Health Centres and2,525 Community Health Centres. This means that overall there is a shortage of 12.6% of Sub Centres; 17.8% ofPHCs and 38.4% of CHCs. The shortage is more acute in High Focus States2. In the tribal areas though, the require-ment of CHCs is relatively less compared to the other parts of the country. The shortfall in Sub-Centres and PHCs arerelatively greater. During the Seventh Plan period (1985-90) there was a surge in the growth of creation of ruralhealth infrastructure in India. Unfortunately after the initiation of economic reforms, there was a gradual decline ingrowth rate during every Plan period.
Table-2.3.: Number of Health Institutions Functioning
2001 2006 2007
Sub-Centres 137311 144988 145272
PHCs 22842 22669 22370
CHCs 2633 3910 4045
Source: Health Information of India, various years.
Those institutions which are there in place also lack basic amenities. About 50% of Sub- Centres, 76% of PHCs and91% of CHCs are located in government buildings. The rest are located either in rented buildings or rent free Panchayat/Voluntary Society buildings. The shortage of government building in High Focus States is much higher compared tothe national average. Half of the PHCs in High Focus States are not in government buildings. The situation is slightlybetter in tribal areas, than the rest of the country, due to the special emphasis through the Tribal Sub-Plan. Very few
1 Funds under NRHM are provided to the State Health Societies, conditional to the approval of Programme Implemen-tation Plans (PIP) for each state. The RCH Flexible Pool and Mission Flexible Pool for Part A & B of the PIP, throughwhich flexible funds are provided to SHSs to spend on their own priorities, are with in the broad guidelines of theNRHM.
Health

www.cbgaindia.org
HOW DID THE UPA SPEND OUR MONEY?
institutions have adequate support infrastructure, like quarters, water supply, electricity etc. Only 38% of total thePHCs have the entire critical staff, whereas only 31% have the entire critical supplies (defined as 60% of critical inputs)and only 3% of PHCs have 80% of all critical inputs.
Table-2.4.: Availability of Health Institutions in Tribal Areas
Year SUB CENTRES PHCs CHCs
Required In position Short Fall Required In position Short Fall Required In position Short Fall
2001 26243 21429 4814 3999 3540 459 870 588 282
2007 25761 20682 4887 3853 3199 745 954 754 236
Source: Health information of India, various years
Shortage of human power at every level of service delivery is one of the major impediments in the way of comprehen-sive primary health care. Though, certain efforts have been made by the centre to fulfill the vacancies of ANM inrecent years, resulting in relatively less shortfall, overall there is a huge shortage of human resources at all levels. Theshortage is more acute for posts like Specialists at CHCs, Male Health Workers, Laboratory Technicians and StaffNurses. There is almost 60% shortage of Specialists in rural areas, for High Focus States the shortage is as high as80%. Generally at every level, there is shortage of human resources but it is more in tribal areas- one fifth posts ofdoctors, almost half posts of staff nurse and lab technicians and more than 85% of specialist posts are vacant in tribalareas.
Table-2.5.: Doctors at Primary Health Centres
Sanctioned In Position Vacant Vacancy as a %
2001 29689 25724 3965 13.36
2007 27274 22608 4920 18.04
Source: Health information of India, various years
D.ii. Indicators of Development Outcomes
The indicators of health outcomes clearly reveal that the situation has really not improved and at times it hasworsened. Especially the situation of the vulnerable sections of the society, women, children, SCs & STs and religiousminorities, remain a matter of huge concern. Further there remain huge inequalities in attaining health outcomes.
Table-2.6.: Health Indicators: Different Rounds of NFHS
Indicators NFHS I NFHS II NFHS III
Total Fertility Rate 3.39 2.85 2.68
Infant Mortality Rate 78.5 67.6 57
Under five Mortality Rate 109.3 94.9
% of Women with Anemia 51.8 56.2
Deliveries health facilities 25.5 33.6 40.7
Mothers Receiving at Least One Antenatal Check Up 62.3 65.4 77
Source: NFHS, various rounds
Even among women there is significant inequity in access among different income classes. In the lowest wealthquintile, 41% pregnant women do not receive antenatal care, whereas almost every pregnant woman (97.4%) fromthe highest income quintile receives antenatal care. Half of the pregnant women in the poorest income class do notreceive Iron Folic Acid (IFA) tablets and only one in ten of them take IFA tablets or syrups for full ninety days (NFHS III).Overall, only 3.8% pregnant women receive any intestinal parasite drug and access to it for women in better-offsections are much higher than those in the lower strata (NFHS III). Delivery of mother from the poorest quintile is 4.6times less likely to be attended by a medically trained person than her well off counterpart (NFHS III). MaternalMortality Rate is 301 per 100,000 live births (SRS, 2001-03). In backward states, like Uttar Pradesh, the MMR is
2 High Focus States in NRHM are Bihar, Jharkhand, MP, UP, Chhattisgarh, Rajasthan, Uttaranchal, Jammu and Kashmir,States of North East and Sikkim.

24
Health
significantly higher. More than a third (36%) of women has a Body Mass Index (BMI) below 18.5, indicating a highprevalence of nutritional deficiency.
Table-2.7.: Low Attainment of Health Indicators among Marginalized Social Groups
Indicators SCs STs All India
Infant Mortality Rate (per 1000 live births) 66.4 62.1 57
Under 5 Mortality Rate (per 1000 live births) 88.1 95.7 74.3
Under-five children acutely malnourished (%) 47.9 54.5 42.5
No antenatal care during pregnancy (%) 25.9 29.4 22.8
Delivered by a skilled provider (%) 40.6 25.4 46.6
Source: NFHS III
Highlights of Union Budget 2009-10
• There is only a marginal increase in allocation on Health and Family Welfare. From Rs18476 crore in2008-09 RE it has increased to only Rs18808 crore in 2009-10 BE.
• The overall spending as a proportion of GDP is 1.02% in 2008-09, far below the NCMP commitment.
• As a proportion of total Union Budget, spending on Health and Family Welfare has decreased from 2.11% in 2007-08 to 1.97 % in 2009-10.
• For the year 2009-10, no increase in Plan expenditure has been proposed.
• The allocation on NRHM has also stagnated at Rs12002 crore.
E. Concluding Remarks
At a time when influence of neo-liberal policies can be seen in every aspect of our life, it is quite unlikely that health,as a social sector, will remain insulated from the consequences of rampant liberalization. Further, liberalization whichaims to weaken government as an institution comes through government initiatives. Health policy making in the lastdecade and a half has revolved around the central theme of privatization of services. The tendency is to leave healthto the private sector and limit the role of the State only to public health, family planning and institutional delivery.Important policy measures adopted by the erstwhile NDA regime, like the National Population Policy 2000, NationalHealth Policy 2002 and National Drug Policy 2002 advocated rampant privatization in every sphere. Civil society,including NGOs, a miniscule section of the academia and a few political parties raised a hue and cry against liberal-ization. Unfortunately the UPA has done nothing to revert the liberalization process, it has only made things a littlemore subtle- privatization has been disguised under greater civil society involvement. Whether private sector is reallya part of civil society or not is a million dollar question which nobody dares to answer.
24

www.cbgaindia.org
HOW DID THE UPA SPEND OUR MONEY?

26
Water supply and sanitation are strongly intertwined with health, education, infrastructure as well as social andeconomic justice. In fact, it impacts and affects all segments of the society especially women and backward classes.The sector is even more pertinent, keeping in mind that 2008 was declared the International Year of Sanitation andthe years 2005-2015 as the Water for Life Decade. The current Interim Budget of 2009-10, however, does not showany increase in allocations, which is a cause for concern. A close look at the water supply and sanitation data of thepast five years will give us a clear indicator on the present government's policy priorities on a much neglected butextremely crucial sector.
A. Promises Made by UPA and its Policy Initiatives
• The Finance Minister in his Budget speech last year had proposed to enhance the allocation for the two Flagshipschemes- Rajiv Gandhi Drinking Water Mission (RGDWM) to Rs.7,300 crore with an initial outlay of Rs.200 croreand for Total Sanitation Campaign (TSC) to Rs.1,200 crore (including the North Eastern Region component). Inthe 2009-10 Budget Speech, the allocation for both the schemes has remained the same except for RGDWMwhere it has been increased slightly to Rs.7,400 crore.
• The National Common Minimum Programme (NCMP) through Bharat Nirman had also promised a time-boundplan to build rural infrastructure, under which rural drinking water was a major component. The time period forwhich the targets were set was 2005-06 to 2008-09.
• The Eleventh Plan targets to 'provide clean drinking water for all by 2009 and ensure that there are no slip-backsby the end of the Plan period'. It aims to provide 100% coverage of water supply to rural schools and 100% watersupply to the entire urban population by the end of the Eleventh Plan in 2012.
• For sanitation, the Eleventh Plan targets to build 7.29 crore individual toilets in rural areas. Under TSC, the targetis to achieve100% coverage by 2,012. The physical target is to cover 69 million households, 25769 sanitarycomplexes, 1,33,114 balwadis/aganwadis, all the remaining schools and rural sanitary marts and productioncentres. The target fixed for urban sanitation is 100% population coverage with 70% covered by sewerage facility
Water Supply & Sanitation
• The ambitious flagship programme of the UPA regime, Bharat Nirman, which includes the component ofdrinking water, has aimed to address the problem of coverage, sustainability and quality in rural areas. However,the 37th Report of the Standing Committee on Rural Development (MoRD) highlights the lack of seriousnessin providing the required allocation for effective implementation of the Bharat Nirman programme. This hasresulted in the achievement of only 57% targets under uncovered habitations, 64% under slipped-back and43% under quality affected habitations. This shows an urgent need to tackle the issue of safe, sustainabledrinking water supply to all in India.
• The National Rural Drinking Water Quality Monitoring & Surveillance Programme, unveiled under the RajivGandhi Drinking Water Mission (RGDWM) in 2006 attempts to look into the problem of water quality particularlyagainst chemical and biological contamination of ground water. However, targets for ensuring quality controlhave been missed and the problem still persists. The CA&G's latest Performance Audit Report highlights theproblem of underutilization as well as misuse of funds and non-functionality of water testing laboratories inmany project areas.
• The Nirmal Gram Puraskar (NGP) was constituted in 2005 as an award of incentives for Gram Panchayats toachieve 100% sanitation. NGP winners have grown from 38 in 2005 to 5,000 in 2007.
• The UPA Government revised the guidelines of the Total Sanitation Campaign (TSC) in 2007 by introducing thecomponent of Solid and Liquid Waste Management to promote the idea of ecological sanitation. It has furtherraised the subsidy for unit cost of Individual Household Latrines from Rs. 600 to Rs.1200. In addition, a muchneeded new National Policy on Urban Sanitation has been formulated to tackle the sanitation problem insmall, medium and metropolitan cities.
• The Government has pushed for 100% sanitation coverage in schools under TSC. The Finance Minister (2008-09 Budget) announced a grant of Rs. 200 crores for drinking water provision in schools with a new expenditurehead under Stand-alone Purification Systems. However, its effective implementation is yet to be assessed.
• The Delhi Declaration of SACOSAN-III (Third South Asian Conference on Sanitation, 2008) recognized theaccess to sanitation and safe drinking water as a basic right to all.

www.cbgaindia.org
HOW DID THE UPA SPEND OUR MONEY?
and 30% by low-cost sanitation. For solid waste management (SWM) 100% population is proposed to becovered.
B. Public Spending During 2003-04 to 2008-09
The total expenditure on Rural Water Supply and Sanitation as a proportion of total Union Government expenditurefor the last 5 years has shown a modest increase. For 2004-05 RE, it was 0.65% and this has increased to 0.9% in2008-09 RE(Table 3.1)
Table-3.1.: Total Expenditure on Rural Water Supply and Sanitation by the Department of Drinking WaterSupply (MoRD), Govt. of India
Year Rural Drinking Water Supply Union Govt. Expenditure on Water Supply and Sanitationand Sanitation*(Rs. crore) as Proportion of Total Expenditure from Union Budget (in %)
2003-04 RE 2751.39 0.58
2004-05 RE 3301.39 0.65
2005-06 RE 4761.52 0.93
2006-07 RE 5301.63 0.91
2007-08 RE 7461.8 1.05
2008-09 BE 8501.9 1.13
2008-09 RE 8502.27 0.94
2009-10 BE 8502.84 0.89
Note: * Union Budget Outlay for Deptt.of Drinking Water Supply under Ministry of Rural DevelopmentSource: Expenditure Budget Volume 2 -Union Budget for various years
C. Spending on the Sector from the Budgets of All States: 2003-04 to 2008-09
Table-3.2: Total Expenditure on Water Supply & Sanitation from the Budgets of All States & UTs (in Rs. crore)
Years Revenue Expenditure Capital Expenditure Total As % ofPlan Non-Plan Total Plan Non-Plan Total Expenditure GDP
2003-04 3002.55 3529.02 6531.57 3403.92 182.47 3586.39 10118 0.37
2004-05 2735.14 4197.61 6932.75 6247.83 131.4 6379.23 13312 0.42
2005-06 3987.53 4477.32 8464.86 5636.93 390.74 6027.67 14492.5 0.40
2006-07 4433.93 4340.62 8774.56 6955.55 393.56 7349.1 16123.7 0.39
2007-08 RE 4823.66 4963.44 9787.1 11044.66 652.12 11696.78 21483.9 0.45
2008-09 BE 5085.29 4451.64 9536.93 12290.37 834.45 13124.82 22661.8 0.42
Source: State Finances: A Study of Budgets of 2006-07, 2007-08 & 2008-09, RBI
As shown in Table 3.2, the revenue and capital expenditure of States and Union Territories in the water and sanitationsector have been demarcated into Plan and Non-Plan Expenditure. The trend in expenditure can be observed in theTable 3.2. The figures show a positive trend since capital expenditure has increased. Similarly, plan expenditure hasalso shown a significant rise from 2003-04 to 2008-09. The total expenditure as percentage of GDP has remainedconstant in most years.

28
C.i. Total Public Spending on Major Schemes in the Sector during 2004-05 to 2008-09
Table-3.3.: Total Sanitation Campaign: Release vs. Expenditure from 2004-05 to 2008-09
(In Rs. Crore)
Year Release Expenditure
Centre State Beneficiary Total Growth rate Centre State Beneficiary Total Utilisation* (%)
2004-05 347.22 111.48 144.77 603.48 0.00 207.21 149.67 108.66 465.54 77.14
2005-06 595.32 420.80 187.11 1203.23 99.38 284.72 288.28 152.76 725.77 60.32
2006-07 720.97 334.60 292.46 1348.03 12.03 622.64 259.25 150.81 1032.70 76.61
2007-08 911.70 395.17 281.49 1588.36 17.83 794.42 337.06 166.40 1297.88 81.71
2008-09 784.44 595.02 162.74 1542.19 -2.91 513.04 293.11 99.01 905.15 58.69
Total 3359.66 1857.07 1068.56 6285.29 307.55 2422.03 1034.27 677.64 4427.05 70.44
Note: *Percentage expenditure vis-à-vis releaseSource: www.ddws.nic.in
The financial release and expenditure for the TSC is given in Table 3.3. As seen, the growth rate between 2004-05 and2005-06 has been the highest at 99.38% and the lowest at - 2.91% between 2007-08 to 2008-09. The overallpercentage of expenditure in the sector has been 70.44% vis-à-vis releases.
Progress Report on Major Schemes in the Sector
• The Total Sanitation Campaign (TSC): A Centrally Sponsored Programme on rural sanitation has witnessedremarkable improvement after enhancing the resources and the stage is now set to achieve the MilleniumDevelopment Goal target by 2012 instead of 2015 as per Government sources. So far, more than 59 % ruralhabitations are equipped with toilet facilities. (Source: PIB) However, despite glowing reports from the Gov-ernment, sanitation is not on track to meet the MDG targets. The problem of open defecation (OD) stillpersists in rural areas. (74% practice OD in India; Source: WHO & UNICEF's Joint Monitoring Programme forWater Supply and Sanitation Report, Geneva, 2008).The Department of Drinking Water Supply (DDWS)figures primarily show 'coverage' (number of individual household latrines constructed) but not 'usage',making it difficult to make an assessment.
• Swajaldhara: After 1992, the 73rd Amendment Act gave Panchayati Raj Institutions (PRIs) a role in drinkingwater schemes; however, this is only on paper. The Swajaldhara programme was launched precisely for thepurpose of community ownership. A sum of Rs 40 crore was given by the 12th Finance Commission to thePRIs for Operation and Maintenance (O&M) of drinking water projects. Nonetheless, one has to assesswhether this sum is actually being utilized for the said purpose or not.
• Bharat Nirman / Accelerated Rural Water Supply Programme (ARWSP): Bharat Nirman, the ambitiousflagship programme of the government, has drinking water as one of its six components. More specifically,it addresses coverage, sustainability and quality of water. Since 2008-09 is the last year for this programme,it is essential to take stock of it. The 37th Report of the Standing Committee on Rural Development, Ministryof Rural Development (MoRD), Department of Drinking Water Supply (DDWS), Demand for Grants (2008-09), has analyzed that only 57% of the targets could be achieved under the category of uncovered habita-tions, 64 % under slipped-back and 43% under quality-affected habitations.
Table-3.4.: Release of Funds to States & UTs under Swajaldhara
Sanction Year Total Amount Released (Rs. crore)
2004-05 227.37
2005-06 458.19
2006-07 152.85
2007-08 145.71
Total 984.12
Source: www.ddws.nic.in
Water Supply & Sanitation

www.cbgaindia.org
HOW DID THE UPA SPEND OUR MONEY?
The financial release details of the Swajaldhara programme (given in Table 3.4) indicate a sharp decline in the releaseof funds since 2006-07.
Under Bharat Nirman /ARWSP, the release of funds to States and UTs (Table 3.5) has shown a sharp increase from2004-05 to 2007-08. However, it decreased in 2008-09. The fund release is not an indicator that fund expenditurehas been concomitant.
Table-3.5.: Release of Funds to States & UTs under ARWSP/ Bharat Nirman
Year Total Fund Release (Rs. crore)
2004-05 2120.55
2005-06 4093.11
2006-07 4552.40
2007-08 6425.84
2008-09 5516.15
Total 22708.05
Source: www.ddws.nic.in
D. Outputs/Services delivered by Govt. Interventions and Development Outcomes
D.i. Indicators of Output/Services delivered by Govt. interventions: 2004-05 to 2007-08
Under ARWSP, the targets and coverage of habitations (uncovered, slipped back and quality-affected) from 2004-05to 2007-08 is given in Table 3.6. The coverage of habitations against targets has been the highest during 2005-06and 2006-07. However, it has shown a decline in 2007-08.
Table-3.6.: Target and Coverage of Habitations (Uncovered, slipped-back and quality-affected) from 2004-05to 2007-08
Year Target Coverage % coverage against Targets
2004-05 74,868 69,639 93.02
2005-06 56,270 97,215 172.77
2006-07 73,120 1,07,350 146.81
2007-08 1,55,499 87,258 56.11
Source: www.ddws.nic.in
The details of Swajaldhara schemes can be seen in Table 3.7. However, in view of the recommendations made in theAnnual State Ministers' Conference in January 2006, the provisions have been modified. Hence, there is only one ruralwater supply programme i.e. ARWSP. No separate allocation is made for Swajaldhara and new schemes and projects.
Table-3.7.: Physical performance of Swajaldhara Schemes
Year No.of Schemes taken up Schemes completed
2004-05 3,662 2,243
2005-06 4,366 1,737
2006-07 1,247 184
Source: Outcome Budget of DDWS, 2008-09
According to the government, as compared to the year 2004, when only 27% rural families had toilet facilities, thenumber has increased to 59%. Compared to the earlier provision of Rs.625 per unit construction cost of toilets, now,for plain areas, a provision of Rs. 2,500 and for hill/remote areas a provision of Rs.3,000 has been made. Theprovision of 'Nirmal Gram Puraskar' made for promoting and motivating concerned stakeholders like PRIs and NGOsunder the TSC has resulted in a mass campaign. The latest data on hardware construction such as Individual House-hold Latrine (IHHL) for both Below Poverty Line (BPL) and Above Poverty Line (APL) households, school and balwaditoilets and sanitary complexes are given below in Table 3.8.

30
Table-3.8.: Physical Progress under TSC from 2004-05 to 2008-09
Year IHHL IHHL Total School Sanitary Balwadi(BPL) (APL) (APL+BPL) Toilets Complex Toilets
2004-05 27,63,142 17,16,690 44,79,832 55,226 1,623 10,631
2005-06 40,80,490 54,69,267 95,49,757 88,092 2,697 36,074
2006-07 47,71,876 49,28,504 97,00,380 1,31,937 2,990 53,168
2007-08 57,63,430 57,64,460 1,15,27,890 2,37,287 3,016 86,493
2008-09 40,93,748 41,77,265 82,71,013 1,72,154 2,331 42,369
Source: www.ddws.nic.in
D.ii. Development Outcomes
The aim of rural water supply and sanitation schemes is not only to ensure better health and living standards amongpeople but also to ensure active community participation and ownership through schemes like Swajaldhara. The TSCalso aims to raise the level of safety, convenience and dignity of women through construction of community sanitarycomplexes and separate toilet blocks for girl students in co-educational schools. To create equity, States and UTs arerequired to earmark and utilize at least 25% of the ARWSP funds for drinking water supply to SC's and atleast 10%to STs.
Water Supply & Sanitation
Highlights of Interim Budget 2009-10
• In the water supply and sanitation sector, the allocations for rural water supply (Rs.6570 crore, 2009-10 BE)and rural sanitation (Rs.1080 crore, 2009-10 BE) have remained the same as last year. Since the year 2008,was the International Year of Sanitation and 2009 marks the decadal year of the Total Sanitation Campaign,this is a point of concern.
• In urban water supply and sanitation, for the 'Integrated Low Cost Sanitation Programme' (a CentrallySponsored Scheme for the replacement of dry latrines into water borne flush toilets and the rehabilitation ofworkers engaged in manual scavenging), (the allocation in Union Budget has been drastically cut downfrom Rs.150 crore in 2008-09 BE to a meager Rs.40.03 crore in 2008-09 RE. However, for provision of SolidWaste Management near Airports in few selected cities, the allocation has been increased to Rs.12.56 crorein 2009-10 BE from Rs 0.01 crore in 2008-09 RE which signifies a positive development.
E. Conclusion
Although, the financial allocations in the rural water supply and sanitation sector have shown a rise in the pastfive years, however, expenditure figures are not always commensurate. Similarly, a mere increase in outputs doesnot necessarily translate into outcomes. A positive fact is that plan expenditure has been more than non-planwhich is a good indication. Since, water and sanitation require large investments in infrastructure, one can onlyhope that there is greater commitment by the government in bringing health and dignity to its people by focusingmore on the sector.
30

www.cbgaindia.org
HOW DID THE UPA SPEND OUR MONEY?

32
The rural economy of India, comprising around seventy-six % of the country's population and the economic activitiesthey engage in, holds within it vast untapped potential to take the economy to an equitable development and highgrowth trajectory. Notwithstanding the quantum of population, the contribution of the rural sector (particularly,agriculture and allied activities) to the national income and thereby the economy has declined sharply over the lastcouple of decades. Astute observations on such a phenomenon attributed it to the second generation of develop-ment of the Indian economy with declining reliance on the primary sector. However, behind such a phenomenon laya larger malaise characterized by inadequate rural infrastructure entailing lack of access to markets and quality life,inadequate access to proper health care and education, shrinking opportunities to gainful employment and a stag-nating agricultural production and growth. Given this yawning developmental gap, huge amount of investments arenecessary to boost the sagging rural productivity, income and infrastructure and to improve the overall aspects ofhuman development. Such a policy would not only promote food security by fostering agricultural production, itsstorage, warehousing and marketability but also promote demand for the manufactured goods thereby energizingother sectors of the economy.
Highlights of Rural India
• About 74 % of the households belong to rural India and account for nearly 76% of the total population.
• The population in the age group 15-59 years, which is defined to be prime-age or economically activepopulation, comprised about 58 % of total population in rural areas.
• Literacy rate for population of all ages was about 66% for males and 47% for females in the rural areas.
• Among the persons of age 5-29 years, about 38% in the urban areas and 32% in the rural areas eitherdiscontinued or dropped from their studies.
• In rural India, more than half of the usually employed ('all' workers) were self-employed - 57% among malesand nearly 62% among females.
• As of 2004-05, around 73% of the population living below poverty line (BPL) reside in rural areas.
The United Progressive Alliance (UPA) which came to power in 2004 at the Centre, promised in its agenda and theNational Common Minimum Programme (NCMP) policies on rural employment guarantee and other infrastructuraldevelopment of the rural sector. Accordingly, the UPA undertook a host of policy initiatives, landmark among whichis the National Rural Employment Guarantee Act (NREGA) which promises at least 100 days of wage employment toa single individual from every household seeking employment. Noteworthy also, is the UPA initiative of rural infra-structure development christened Bharat Nirman which encompasses issues of rural housing, rural electricity connec-tion, telephony, all-weather road connectivity, safe drinking water and sanitation and expansion of irrigation capacity.
Rural Development & Employment
• A landmark achievement for the UPA regime was the enactment of National Rural EmploymentGuarantee Act in 2005 and the subsequent implementation of National Rural EmploymentGuarantee Scheme (NREGS) making 100 days of wage employment for unskilled work, a right for individualsin the rural sector.
• A flagship programme christened Bharat Nirman has been initiated to strengthen rural infrastructure like ruralroads, housing, electricity, water and sanitation, telephony etc.
• The overall budgetary allocation for the Ministry of Rural Development, including all departments, have risenby 268% from Rs.18240.22 crore in 2004-05 RE to Rs. 67185.81 crore in 2008-09 RE. The overall allocationhowever declined marginally in 2009-10 BE to Rs. 62606.95 crore.
• Despite the significant rise in allocation, the performance of the programmes/schemes have been below paras utilization was poor in many states, particularly in case of Bharat Nirman, progress on targets set out to bereached is tardy as none of the targets have been fulfilled.
• Strengthening of implementation of the schemes at the grassroots level has received lesser priority in the UPAtenure. There is an urgent need to invest in adequate human resource and technical upgradation for betterplanning and monitoring of the developmental schemes at the State and local government level.

www.cbgaindia.org
HOW DID THE UPA SPEND OUR MONEY?
Although all these initiatives portend a promising future for the rural economy, an evaluation of these in terms ofresource allocation, utilization and physical achievements is imperative given that the term of UPA's rule is nearing itsend and fresh elections are in the offing.
A. Rural Development
Total expenditure on rural development has seen a marked increase over the entire period of UPA regime. From0.58% of GDP in 2004-05, it has steadily risen to 1.2% of GDP. Much of this rise in spending has been because ofincreased allocations for programmes on employment guarantee aimed at creating rural employment and alsobeneficiary driven programmes for rural housing. Certainly such a significant rise in spending in the rural sector willhave significant impact in ameliorating the condition of rural poor, however utilization of resources in most of theprogrammes have been a cause for concern. Some of the major schemes and programmes have been discussed insubsequent sections.
Table-4.1.: Total Expenditure on Rural Development by Central Government (in Rs. crore)
2004-05 2005-06 2006-07 2007-08 2008-09@ 2008-09 2009-10@
Total Expenditure on Rural 18240.22 27515.08 31021.01 37389.18 42425.96 67185.81 62606.95Development - of which
Dept of Rural Development 13885.4 21354.27 24297.72 28523.5 31524.06 56883.54 51706.95
Dept of Land Resources 1053.43 1399.29 1421.66 1403.86 2400 1800 2400
Dept of Drinking Water Supply 3301.39 4761.52 5301.63 7461.82 8501.9 8502.27 8500
Major Schemes
Sampoorna Gramin Rozgar 4590 7650 2700 3420 - - -Yojana*
National Food for Work 1818 4050 - - - - -Programme**
National Rural Employment - - 10170 10800 14400 30000.19 30100Guarantee Scheme
Swarnajayanti Gram 900 899.84 1080 1620 1933 2113 2115Swarozgar Yojana
Indira Awas Yojana 2607 2475 2625.05 3636 4859 7919 7920
Pradhan Mantri Gram 2219 3835.55 5103.06 6110 7075 7225.15 9135Sadak Yojana
Integrated Wasteland 333 454 453 - - - -Development Programme#
Drought Prone Areas 300 353 360 - - - -Programme#
Desert Development 215 268 270 - - - -Programme#
Integrated Watershed - - - 1053.55 1692.5 1440.5 1875.9Management Programme
Rural Water Supply 3301.39 4761.52 5301.63 7461 7650 7640 7640and Sanitation
Note: * Has been subsumed under NREGS, ** has been discontinued from 2006-07, # has been integrated into Integrated WatershedManagement Programme. @ are Budget Estimates and figures pertaining to all other years are Revised Estimates.
Source: Compiled from Expenditure Budget Vol II, various years
A.i. Rural Employment: National Rural Employment Guarantee Scheme
The National Rural Employment Guarantee Act (NREGA) enacted in September, 2005, was implemented fromFebruary 2, 2006 in 200 identified districts of the country in the form of NREGS. Its stated objective is to provide

34
100 days of guaranteed wage employment to each rural household opting for it. The coverage had gone up to330 districts with the addition of 130 new districts in 2007-08. The ongoing programmes of SGRY and NationalFood for Work Programme (NFFWP) were subsumed under NREGS in these districts. The coverage of NREGS has beenextended to all the 596 districts (excluding the urban districts) in the country in 2008-09. But the large increase incoverage did not reflect in the increase in allocation for 2008-09 - a mere Rs. 4,000 crore increase from Rs. 12,000crore in 2007-08 (RE) for 330 districts to Rs. 14,400 crore in 2008-09 (B.E)for 596 districts. However, the presentbudget (2009-10) reports a quantum leap in the allocation of funds for NREGS by 108% to Rs. 30,000.19 crore in2008-09 (R.E.). For the year 2009-10, allocation for NREGS has been kept pegged at the level of Rs. 30,100 crore inthe interim budget.
Highlights of NREGS
Employment provided to households: 3.78 Crore
Total (Persondays in Crore): 166.22
SCs: 46.93 [28.23%]
STs: 39.54 [23.79%]
Women: 80.43 [48.39%]
Others: 79.74 [47.98%]
Total works taken up: 21.93 Lakhs.
Works completed: 8.12 Lakhs.
Works in progress: 13.8 Lakhs.
Source: NREGS website: www.nrega.nic.in (as on 16th February 2009)
The novelty of NREGS compared to its precursors like SGRY1 and NFFWP2 are: a) a paradigm shift to a rights basedframework, which entails a legal guarantee of work unlike other programs which could be withdrawn by a govern-ment at will; b) disincentive for underperformance as unemployment allowance has to be paid by the state govern-ment within 15 days if work is not provided within 15 days of demanding the same; c) resource availability under thescheme is demand driven; d) accountability of the public delivery systems through social audit. Evidently, the schemebeing demand driven, utilization and, in turn, allocation depends on the actual demand for work by households.
Figure-4.1.: Availability and Utilization of Funds under NREGS
1 Swarnajayanti Grameen Rozgar Yojana2 National Food for Work Programme
0
5000
10000
15000
20000
25000
30000
2006-07 2007-08 2008-09
inR
s.C
rore
Total Availability
Total Utilization
Rural Development & Employment
Source: Outcome Budgets of Dept of Rural Development (various issues) and financial reports from website of NREGS, www.nrega.nic.in (as on16th February 2009)

www.cbgaindia.org
HOW DID THE UPA SPEND OUR MONEY?
The physical as well as financial progress of NREGS has continued to vary across states. The implementation in manyhigh potential states like Maharashtra, Karnataka, Bihar, West Bengal and Orissa is well below the national averagein both physical and financial progress during 2007-08. Maharashtra which has been topping the farmers' suicidechart could utilize only 25% of the total available funds in 2007-08 (till 29 February 2008). While some states haveshown good progress in implementation over the previous year, many have retreated. In particular, Orissa couldutilize only 51.76% of the available funds in 2007-08 against 82.39% in 2006-07.
Figure-4.2.: Allocation and Expenditure of Major States in NREGS (in 2007-08)
NREGS: Allocation & Expenditure
0
500
1000
1500
2000
2500
3000
Andhra
Pra
desh
Assa
m
Bih
ar
Gujra
t
Harya
na
Karn
atak
a
Kerla
Madhya
Pra
desh
Mahara
shtra
Oriss
a
Punja
b
Raja
sth
an
Tam
ilnadu
Utta
r
Pra
desh
WestB
enga
l
Chattis
garh
Jharkh
and
(in
Rs.
Cro
re)
Total Available
Fund
Total
Expenditure
Source: Computed from Outcome Budget 2008-09, Dept. of Rural Development
A.ii. Swarnajayanti Gram Swarozgar Yojana (SGSY)
The Swarnajayanti Gram Swarozgar Yojana (SGSY) aims at bringing the assisted poor families above the poverty lineby ensuring appreciable sustained level of income over a period of time. This objective was to be achieved by organizingthe rural poor into SHGs through the process of social mobilization, their training and capacity building and provisionof income generating assets. The overall objective of the scheme has been to integrate provisions like skill upgradation,infrastructure including marketing development and technology penetration into a programme providing forpoverty alleviation and sustainable livelihood options. By design, the programme meant to create widespread incomegenerating activities, through the empowering mechanism of SHGs, where group dynamics are expected to compensatefor the basic weaknesses of the individual rural poor and present them as credit worthy and financially accountableunits.
The funds are shared between Centre and States in the ratio 75:25, except in the case of North-East states where itis on 90:10 basis. Within the target groups, the guideline for the scheme provides that SC/ST should account for50%, women 40%, minorities 15% and 3% disabled. The revised estimates of SGSY for 2008-09 has shown amarginal increase from Rs. 1,933 crore to Rs. 2,113 crore. However, over the five-year period of UPA rule theallocation for the scheme has shown a general trend of increase keeping in line with the allocations in the sector.
Table-4.2.: Financial and Physical Progress of SGSY
2004-05 2005-06 2006-07 2007-08
Available Fund (in Crores) 1509.85 1558.52 1724.55 1833.89
Utilization (in Crores) 1290.88 1338.77 1424.19 1027.35
% Utilization 85.50 85.90 82.58 56.02
Physical Targets Achieved (in lakhs) 11.15 11.51 16.9 10.76
% of SC 31.62 33.28 35.48 28.61
% of ST 13.36 14.37 14.26 14.89
% of Women 54.32 57.58 73.71 71.53
% of Minorities - - 3.58 9.79
Source: Outcome Budget, MoRD, various issues.

36
B. Bharat Nirman
The programme of Bharat Nirman was conceived by the UPA regime to provide the necessary boost to ruralinfrastructure in a time bound manner within the period 2005 to 2009. As per the government assertions, thepurpose of Bharat Nirman was to infuse a sense of urgency to rural development which will unlock the growthpotential of rural India.
Highlights of Bharat Nirman
• Rural Electricity: Every village to be provided electricity: remaining 1,25,000 villages to be covered by 2009 aswell as connect 2.3 crore households.
• Rural Road: Every habitation over 1000 population and above (500 in hilly and tribal areas) to be provided anall-weather road: remaining 66,802 habitations to be covered by 2009.
• Rural Drinking Water Supply: Every habitation to have a safe source of drinking water: 55,067 uncoveredhabitations to be covered by 2009. In addition all habitations which have slipped back from full coverage topartial coverage due to failure of source and habitations which have water quality problems to be addressed.
• Rural Telephony: Every village to be connected by telephone: remaining 66,822 villages to be covered byNovember 2007.
• Augmenting Irrigation Capacity: Additional irrigation capacity of 10 million hectares (100 lakhs) of capacityto be created by 2009.
• Rural Housing: 60 lakh houses to be constructed for the rural poor by 2009.
B.i. Rural Housing (Indira Awaas Yojaana)
IAY is one of the major schemes of the Ministry of Rural Development (MoRD) and aims at providing proper housesto rural shelter-less people or people lacking proper shelter particularly ones who are below poverty line. The popular-ity of the scheme can be attributed to the fact that the scheme enables beneficiaries to participate and involvethemselves in construction of their home. The role of the State Government is confined to mere facilitating use oflocal, low cost, environment-friendly and disaster resistant technology and also in encouraging construction of sani-tary latrine and smokeless chulha. The funds for the IAY scheme are shared between the Central and the StateGovernment in the ratio of 75:25. The Central budget is allocated to the States based on a 75% weightage tohousing shortage and 25% weightage to poverty ratio. Similarly the district allocation is based on a 75% weightageto housing shortage and 25% to the share of SC/ST population. Out of the total allocation under the scheme, 60%are earmarked for SC/STs, 3% for persons with disability, and 15% for minorities. It is expected that all houses will besanctioned in the name of women or jointly with the husband. These provisions are geared to enable effectivetargeting of the weaker sections of the society. The financial assistance provided under the scheme for each house isRs. 35,000/- in plain areas and Rs. 38,500/- in hilly / difficult areas. Up to 20% of annual allocation of IAY can be spentfor upgradation of kutcha houses and/or credit-cum subsidy scheme. Rs.15,000/- is provided for up-gradation andunder Credit-cum-Subsidy Scheme households having an annual income of not more than Rs. 32,000/- are providedsubsidy of Rs. 12,500/-. They can also avail loan upto Rs. 50,000/- from banks for construction of house.
The allocation for IAY, quite uncharacteristic of previous trend, has shown a jump of around 63% from 2008-09 (B.E.)at Rs. 4859 crore to Rs. 7,919 in 2008-09 (R.E.). Clearly this can be seen as a last big effort to accelerate the progressof the scheme and meet its outlying targets. However, the budgeted allocation for 2009-10 has been pegged at Rs.7,920 crore which is almost same as 2008-09 (R.E).
Rural Development & Employment
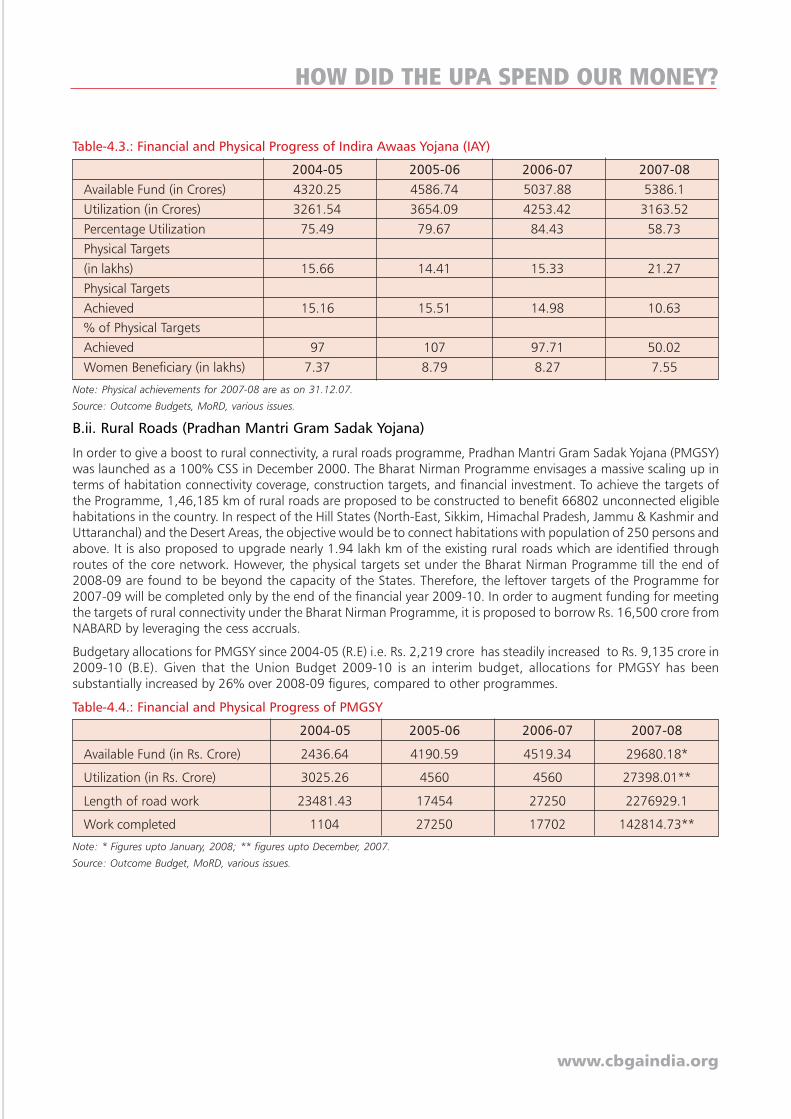
www.cbgaindia.org
HOW DID THE UPA SPEND OUR MONEY?
Table-4.3.: Financial and Physical Progress of Indira Awaas Yojana (IAY)
2004-05 2005-06 2006-07 2007-08
Available Fund (in Crores) 4320.25 4586.74 5037.88 5386.1
Utilization (in Crores) 3261.54 3654.09 4253.42 3163.52
Percentage Utilization 75.49 79.67 84.43 58.73
Physical Targets
(in lakhs) 15.66 14.41 15.33 21.27
Physical Targets
Achieved 15.16 15.51 14.98 10.63
% of Physical Targets
Achieved 97 107 97.71 50.02
Women Beneficiary (in lakhs) 7.37 8.79 8.27 7.55
Note: Physical achievements for 2007-08 are as on 31.12.07.
Source: Outcome Budgets, MoRD, various issues.
B.ii. Rural Roads (Pradhan Mantri Gram Sadak Yojana)
In order to give a boost to rural connectivity, a rural roads programme, Pradhan Mantri Gram Sadak Yojana (PMGSY)was launched as a 100% CSS in December 2000. The Bharat Nirman Programme envisages a massive scaling up interms of habitation connectivity coverage, construction targets, and financial investment. To achieve the targets ofthe Programme, 1,46,185 km of rural roads are proposed to be constructed to benefit 66802 unconnected eligiblehabitations in the country. In respect of the Hill States (North-East, Sikkim, Himachal Pradesh, Jammu & Kashmir andUttaranchal) and the Desert Areas, the objective would be to connect habitations with population of 250 persons andabove. It is also proposed to upgrade nearly 1.94 lakh km of the existing rural roads which are identified throughroutes of the core network. However, the physical targets set under the Bharat Nirman Programme till the end of2008-09 are found to be beyond the capacity of the States. Therefore, the leftover targets of the Programme for2007-09 will be completed only by the end of the financial year 2009-10. In order to augment funding for meetingthe targets of rural connectivity under the Bharat Nirman Programme, it is proposed to borrow Rs. 16,500 crore fromNABARD by leveraging the cess accruals.
Budgetary allocations for PMGSY since 2004-05 (R.E) i.e. Rs. 2,219 crore has steadily increased to Rs. 9,135 crore in2009-10 (B.E). Given that the Union Budget 2009-10 is an interim budget, allocations for PMGSY has beensubstantially increased by 26% over 2008-09 figures, compared to other programmes.
Table-4.4.: Financial and Physical Progress of PMGSY
2004-05 2005-06 2006-07 2007-08
Available Fund (in Rs. Crore) 2436.64 4190.59 4519.34 29680.18*
Utilization (in Rs. Crore) 3025.26 4560 4560 27398.01**
Length of road work 23481.43 17454 27250 2276929.1
Work completed 1104 27250 17702 142814.73**
Note: * Figures upto January, 2008; ** figures upto December, 2007.
Source: Outcome Budget, MoRD, various issues.

38
Rural Development & Employment
C. Conclusion
To sum up, the overall sectoral spending on rural development may have surpassed expectations, given the conservatismin fiscal expansion manifested by the UPA regime in its fiscal policies. However, before warming up to the numbers,caution needs to be exercised on the ground realities that prevail within the rural economy. Given the large scaledestitution and poverty that still prevail, there is no gainsaying that the significant increase in spending is well belowthe requisite amount required to lift rural poor out of poverty and bring about an overall improvement in quality oflife. Even for smaller tranches of spending to have maximum impact, it is absolutely necessary to improve the qualityof expenditure. The government's commitment on this front have definitely fallen short of expectations given the lowamount of non-plan spending in all the programmes/schemes, which is necessary to strengthen monitoring andother supportive activities required to improve the quality of public service delivery.
38

www.cbgaindia.org
HOW DID THE UPA SPEND OUR MONEY?

40
• Central Government’s expenditure on ‘rural economy’ has gradually increased from 1.82% of GDP in2003-04 to 2.54% of GDP in 2009-10 BE.
• A small increase in expenditure has been observed in Agriculture and Allied Activities since 2003-04 (as a shareof GDP, it was 1.19% and it has reached 1.63% in 2009-10 BE.
• The expenditure of the Ministry of Agriculture as a proportion of the GDP was 0.18% during 2004-05, and inthe budget estimate of 2009-10, it has reached 0.25%.
• Expenditure of the Ministry of Agriculture (Government of India) on Capital Account reduced drastically since2004-05 and it has reached 0.69% of the total expenditure of the Ministry in 2009-10 (it was 6.57% in2004-05).
• Since 2004-05, expenditure incurred by all States on Agriculture and Allied Activities shows an increasingtrend. The growth of this expenditure during the said period is around 72%.
• A significant increase is noticed in the Plan expenditure of All States during the period from 2004-05 to2008-09, and the growth is more than 200%.
• The Composition of Plan expenditure of All States on Agriculture and Allied Activities between 2004-05 to2008-09 shows the following trends:
• Crop Husbandry received top priority during the period and its share has slightly increased to 38% in2008-09 from 37% in 2003-04.
• Share of Co-operation has been increased to 14% in 2008-09 compared to 10% in 2003-04.
• Agriculture Research and Education was given a boost in 2008-09.
• Share of Forestry and Wild Life declined sharply in 2008-09 budgets compared to 2004-05 budgetallocations.
Agriculture
Agricultural sector has long been the mainstay of Indian economy in providing gainful employment to a large chunkof rural population. Low budget priorities, consequent decrease in purchasing power of the rural masses and a steadyincrease in input prices have been the core concerns of this sector which remains unaddressed by the successivegovernments and even the present government at the Centre. In wake of the worsening condition of small andmarginal farmers as seen in rising number of farmers' suicides, it is important to have a look at the trends of budget-ary investment of the United Progressive Alliance (UPA) government for the agricultural sector. The following sectionpresents a picture of the budgetary expenditure of the Central Government as well as the State Governments towardsagriculture and allied activities.
A. Promises Made by the UPA Government and its Policy Initiatives for this Sector
The National Common Minimum Programme (NCMP) set forth by the UPA government promised to provide the bestpossible alternatives to the challenges facing agrarian sector of the country during 2004. It held promises to addressburgeoning unemployment and agrarian distress, but in practice what it has performed is in no way different fromthe policy approaches of the previous National Democratic Alliance (NDA) government.
A.i. Promises Made in the NCMP for the Agriculture Sector
The NCMP, declared in May 2004, promised the following:
• Rural credit will be doubled in the next three years.
• All existing irrigation projects will be completed within three-four years.
• All dues of farmers will be cleared at the earliest.
• Public investment in agricultural research and extension, rural infrastructure and irrigation will be stepped up ina significant manner at the earliest.
• Crop and livestock insurance schemes will be streamlined to make them more effective.

www.cbgaindia.org
HOW DID THE UPA SPEND OUR MONEY?
• Controls that depress farm incomes will be systematically removed.
• All possible efforts will be made to maintain terms of trade in favour of agriculture.
A.ii. Major Policies Announced During the UPA Regime
Debt Waiver and Debt Relief Scheme
The most significant announcement of the Union Budget 2008-09 was the debt waiver and debt relief scheme forfarmers. The Finance Minister announced a debt waiver scheme in his budget presentation for the fiscal year2008-09 worth Rs. 60,000 crore, under which all agricultural loans disbursed by scheduled commercial banks,regional rural banks and cooperative credit institutions up to March 31, 2007 and overdue as on December 31, 2007which remained unpaid up to February 29, 2008, would be covered. For marginal farmers (holding up to 1 hectare)and small farmers (holdings up to 2 hectares), there would be a complete waiver of all loans that were overdue as onDecember 31, 2007 and which remained unpaid until February 29, 2008. In respect of other farmers, there would bea One Time Settlement (OTS) scheme for all loans that were overdue as on December 31, 2007 and which remainedunpaid until February 29, 2008. Under the OTS, a rebate of 25% would be given against payment of the balanceof 75%.
The scheme was initially expected to benefit 3 crore small and marginal farmers with loans worth of Rs. 50,000 croreand 1 crore more farmers from a 25% rebate against the one-time settlement of loans, which would cost anadditional Rs. 10,000 crore. The scheme has now been expanded and it is estimated that it would waive farm loansto the extent of Rs. 71,680 crore, nearly 20% more than the amount initially provisioned, with a plan to cover around4.2 crore beneficiaries. As it turns out, the number of small and marginal farmers covered is expected to be 3.7 crore,while the number of other farmers is estimated to be around 60 lakh. This effort of the government to minimise thestress of farmers is indeed a welcome step.
National Policy for Farmers, 2007
National Policy for Farmers, 2007, has been approved by the Government of India taking into account the recommen-dations of the National Commission on Farmers after consulting the State governments. The policy came up with awide range of coverage on a variety of issues related to farming communities.
National Horticulture Mission
The Government of India launched a Centrally Sponsored Scheme (CSS) called National Horticulture Mission (NHM) inMay, 2005 for holistic development of this sector ensuring horizontal and vertical linkages with the active participationof all the stakeholders. The main objectives of the mission are to enhance horticulture production through area-basedregionally differentiated strategies, improve nutritional security and income support to farm households, establishconvergence and synergy among ongoing programmes for horticulture development and promote, develop anddisseminate technologies.
Micro Irrigation Scheme
A Centrally Sponsored Scheme which was launched in March, 2006 to promote water use efficiency by adopting dripand sprinkler irrigation. Up to March, 2007, an expenditure of Rs. 366.4 crore was incurred and an area of 3.4 lakhhectares under drip and sprinkler irrigation system was covered. Allocation of funds during 2007-08 was Rs. 550crore for covering 3.6 lakh hectares. However, Rs. 266.7 crore of the allocated amounts was released till the end ofJanuary 2008.
National Bamboo Mission
Recognizing the potential of bamboo in terms of employment generation and providing sustainable livelihoods to thefarmers, National Bamboo Mission, a Centrally Sponsored Scheme approved by the Government of India in October,2006. The basic thrust of the scheme is to promote bamboo sector through an area based regionally differentiatedstrategies to generate employment opportunities for skilled and unskilled persons, especially unemployed youths.
Integrated Scheme of Oilseeds, Pulses, Oilpalm and Maize (ISOPOM)
ISOPOM, a Centrally Sponsored Scheme is being implemented since April 2004, in order to provide flexibility to theStates in implementation, based on regionally differentiated approach in promoting crop diversification and toprovide focused approach to the programmes. The scheme was introduced by merging the four erstwhile schemes ofOilseeds Production Programme (OPP), National Pulses Development Project (NPDP), Oilpalm Development (OPDP)and Accelerated Maize Development Programme (AMDP).

42
Agricultural Technology Management Agency (ATMA)
ATMA, a Centrally Sponsored Scheme, which was launched in March, 2005, was introduced for technologydissemination particularly at district level and below. The main objective of this programme is to support to stateextension programmes for extension reforms to make extension system farmer driven and farmer accountable.
B.i. Major Proposals in the Eleventh Five Year Plan (2007-2012)
In the context of the misery that this sector is suffering from, in terms of slowdown in growth rate, wideningeconomic disparities between irrigated and rain-fed areas, increased vulnerability to world commodity price volatilityfollowing trade liberalization, uneven and slow development of technology, inefficient use of available technologyand inputs, lack of adequate incentives and appropriate governance institutions, degradation of natural resourcebase, rapid and widespread decline in groundwater table, increased non-agricultural demand for land and water,aggravation in social distress in the form of upsurge in farmers' suicide etc, the Eleventh Five Year Plan sets strategy toaccelerate sustained agricultural annual growth rate at 4% per annum. For achieving annual growth rate of 4%, theactions proposed during the Eleventh Five Year Plan are as follows:
• Bringing technology to the farmers;
• Improving efficiency of investments, increasing systems support and rationalizing subsidies;
• Diversifying agriculture, while protecting food security concerns;
• Fostering inclusiveness through a group approach by which the poor, especially women, will get better access toland, credit and skills;
• Priority in agriculture research should be given in terms of increased investment;
• Research priorities have to shift towards evolving cropping systems suited to various agro-climatic conditions andtowards enhancing the yield potential in rain fed areas through development of drought and pest resistantvarieties;
• The Indian Council for Agriculture Research (ICAR) needs to be restructured with emphasis on greater account-ability;
• Adequate emphasis will also be given to better ground water utilization; and
• Investment in irrigation and irrigation delivery systems.
B.ii. Other Important Programmes/Schemes:
Continuation of Accelerated Irrigation Benefit Programme (AIBP)
The Central Government continued the AIBP which was introduced during 1996-97 for extending assistance tocomplete irrigation schemes which had remained incomplete in the Tenth Five Year Plan. Since its inception, theprogramme was primarily a loan from the Centre but in 2004-05 a grant component was added in the programme.Further, in December 2006, a revised guideline was prepared to provide 90% of the project cost as grant to SpecialCategory States, Drought Prone Area Programme (DPAP)/Tribal Areas and Kalahandi, Bolangir and Koraput (KBK)districts of Orissa.
National Project for Repair, Renovation and Restoration of Water Bodies
To cover a larger area under irrigation, the government sanctioned this project in January 2005 with an estimatedcost of Rs. 300 crore to be shared between the Centre and States in 3:1 ratio. By November 30, 2007 Central shareof Rs. 179.3 crore was released to the states, covering 1098 water bodies.
Development and Strengthening of Infrastructure Facilities for Production and Distribution of Quality Seeds
The scheme, in operation since 2005-06, essentially aims at to ensure production and multiplication of high yieldingcertified/quality seeds of all crops in order to make sufficient quantities of seeds available to farmers in time and at anaffordable price.
National Food Security Mission (NFSM)
Government of India launched NFSM, a Centrally Sponsored Scheme in August 2007. The major objective of thisscheme is to increase production and productivity of wheat, rice and pulses by 10, 8 and 2 million tonnes, respectivelyby the end of Eleventh Five Year Plan on a sustainable basis so as to ensure food security for the country.
Agriculture

www.cbgaindia.org
HOW DID THE UPA SPEND OUR MONEY?
Rashtriya Krishi Vikas Yojana (RKVY)
In order to achieve 4% annual growth in the agriculture sector during the Eleventh Five Year Plan, Government ofIndia approved this programme in August 2007, with an allocation of Rs. 25,000 crore. The programme aims toincentivise the States to increase the share of investment in agriculture in their State Plans. This programme isbasically a State Plan scheme and the funds under RKVY are provided as 100% grant from the Central Government.
C. Public Spending during the UPA regime
Though the NCMP has given much importance to increased public investment in the agriculture sector, budgetaryallocation/spending in this sector is far from satisfactory. Given the intensity of the agrarian crisis in India today, theexpenditure that the present government has incurred in this sector over a couple of years in order to address theseproblems is quite inadequate. The priorities accorded in the budgetary allocation and spending in subsequentbudgets since 2004-05 (during UPA regime) reflects that agriculture as a sector, which provides livelihoods to millionsof rural Indians, have remained utterly neglected.
C.i. Public Spending on Agriculture from the Union Budget
Table-5.1: Central Government Spending on the Rural Economy* as a Proportion of Union Budget and GDP
Year Expenditure on Rural Economy* Agriculture and Allied Activities
As a % of Total Union As a % of GDP at As a % of Total Union As a % of GDP atBudget Expenditure Market Prices Budget Expenditure Market Prices
2003-04 10.65 1.82 6.98 1.19
2004-05 9.91 1.57 7.30 1.15
2005-06 11.32 1.60 7.43 1.05
2006-07 14.58 2.05 8.28 1.16
2007-08 13.05 1.97 9.64 1.45
2008-09 RE 22.24 3.69 15.60 2.59
2009-10 BE 16.02 2.54 10.31 1.63
Note: * Includes expenditure on Agriculture and Allied Activities, Rural Development, Special Area Programmes, Irrigation and Flood Control andVillage and Small Industries
Source: Computed from the data given in Annual Financial Statement (AFS), Budget at a Glance, Various Years and Indian Public FinanceStatistics, 2007-08, GoI
Expenditure on rural economy as percentage of total Union Budget expenditure was 10.65% during 2003-04 andgets doubled in 2008-09 RE (22.24%). Share of expenditure on rural economy as % of GDP since 2003-04 has slightlyincreased from 1.82% in to 2.54% in recent budget estimates (2009-10). Hence, during the period 2003-04 to2009-10 expenditure on rural economy hovered around 1.5 to 2.5% of GDP.
Agriculture and allied activities, as a sector of the economy, is yet to receive priority in Central Government's budgetallocation. It is evident from the data (See table 5.1) that expenditure for agriculture and allied activities revolvesaround 1 to 1.5% of GDP during the period 2003-04 to 2009-10. Expenditure on agriculture and allied activities aspercentage of total spending ranges between 7 to 10%. The expenditure on agriculture and allied activities in2008-09 RE as a share both of GDP as well as total Union Budget is 2.59 and 15.60 respectively. This unprecedentedrise is noticed because of the budgetary provisions of around Rs. 45,000 crore over the budget estimate of 2008-09.This was made towards payment to the manufacturers/agencies under the scheme of sale of decontrolled phosphatic(P) and Potassic (K) fertilisers at concession rates to the farmers. However, a small increase in expenditure has beenobserved in agriculture and allied activities since 2003-04 (as a share of GDP, it was 1.19% and it has reached 1.63%in the budget estimate of 2009-10.
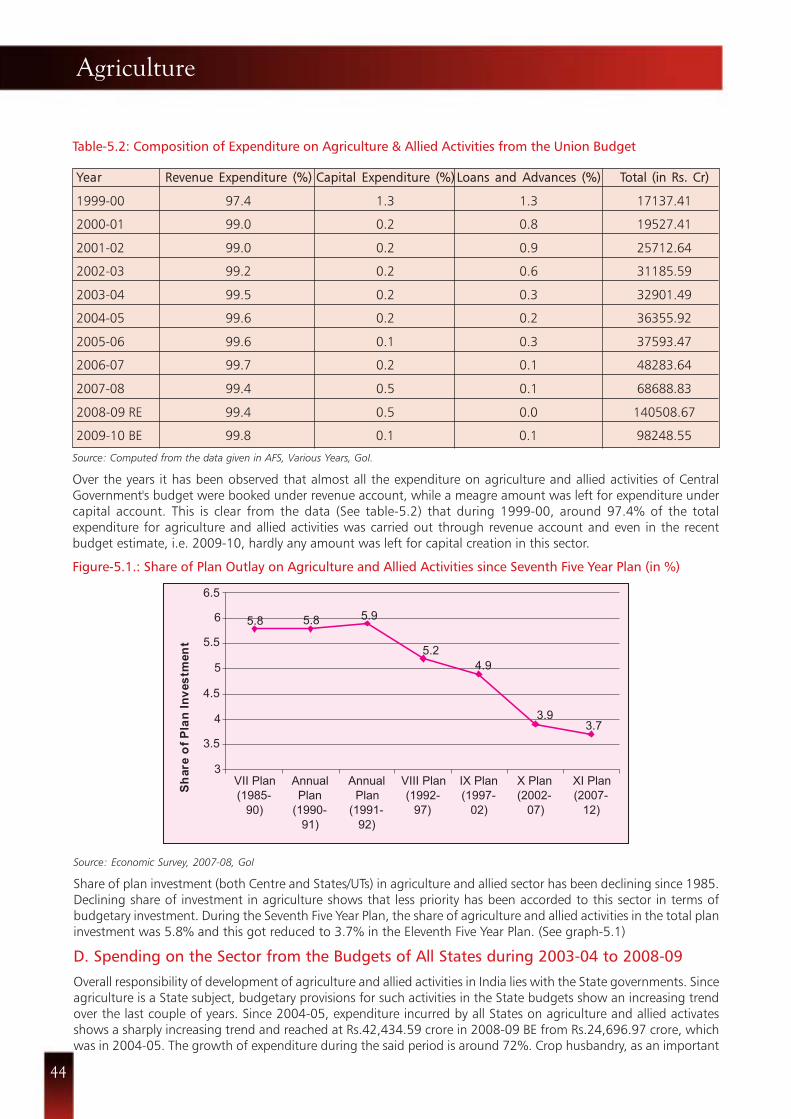
44
Table-5.2: Composition of Expenditure on Agriculture & Allied Activities from the Union Budget
Year Revenue Expenditure (%) Capital Expenditure (%) Loans and Advances (%) Total (in Rs. Cr)
1999-00 97.4 1.3 1.3 17137.41
2000-01 99.0 0.2 0.8 19527.41
2001-02 99.0 0.2 0.9 25712.64
2002-03 99.2 0.2 0.6 31185.59
2003-04 99.5 0.2 0.3 32901.49
2004-05 99.6 0.2 0.2 36355.92
2005-06 99.6 0.1 0.3 37593.47
2006-07 99.7 0.2 0.1 48283.64
2007-08 99.4 0.5 0.1 68688.83
2008-09 RE 99.4 0.5 0.0 140508.67
2009-10 BE 99.8 0.1 0.1 98248.55
Source: Computed from the data given in AFS, Various Years, GoI.
Over the years it has been observed that almost all the expenditure on agriculture and allied activities of CentralGovernment's budget were booked under revenue account, while a meagre amount was left for expenditure undercapital account. This is clear from the data (See table-5.2) that during 1999-00, around 97.4% of the totalexpenditure for agriculture and allied activities was carried out through revenue account and even in the recentbudget estimate, i.e. 2009-10, hardly any amount was left for capital creation in this sector.
Figure-5.1.: Share of Plan Outlay on Agriculture and Allied Activities since Seventh Five Year Plan (in %)
5.8 5.8 5.9
5.2
4.9
3.73.9
3
3.5
4
4.5
5
5.5
6
6.5
VII Plan
(1985-
90)
Annual
Plan
(1990-
91)
Annual
Plan
(1991-
92)
VIII Plan
(1992-
97)
IX Plan
(1997-
02)
X Plan
(2002-
07)
XI Plan
(2007-
12)
Sh
are
of
Pla
nIn
ves
tmen
t
Source: Economic Survey, 2007-08, GoI
Share of plan investment (both Centre and States/UTs) in agriculture and allied sector has been declining since 1985.Declining share of investment in agriculture shows that less priority has been accorded to this sector in terms ofbudgetary investment. During the Seventh Five Year Plan, the share of agriculture and allied activities in the total planinvestment was 5.8% and this got reduced to 3.7% in the Eleventh Five Year Plan. (See graph-5.1)
D. Spending on the Sector from the Budgets of All States during 2003-04 to 2008-09
Overall responsibility of development of agriculture and allied activities in India lies with the State governments. Sinceagriculture is a State subject, budgetary provisions for such activities in the State budgets show an increasing trendover the last couple of years. Since 2004-05, expenditure incurred by all States on agriculture and allied activatesshows a sharply increasing trend and reached at Rs.42,434.59 crore in 2008-09 BE from Rs.24,696.97 crore, whichwas in 2004-05. The growth of expenditure during the said period is around 72%. Crop husbandry, as an important
Agriculture

www.cbgaindia.org
HOW DID THE UPA SPEND OUR MONEY?
function of the sector, received top priority followed by forestry and wild life, co-operation and animal husbandry inthe State budgets during the period of analysis. (See table- 5.3)
Table-5.3.: Total Expenditure (by All States) on Agriculture and Allied Activities
Function/Year 2003-04 2004-05 2005-06 2006-07 2007-08 RE 2008-09 BE
Agriculture and Allied Activities(in Rs. Cr) 18894.62 24696.97 25397.6 31371.85 39546.92 42434.59
Crop Husbandry (%) 27.3 23.9 22.9 22.6 27.1 32.3
Soil and Water Conservation (%) 6.5 5.4 5.1 5.7 5.8 6.5
Animal Husbandry (%) 11.7 9.9 10.7 10.2 10.3 11.3
Dairy Development (%) 5.9 3.6 3.8 3.5 2.6 3.5
Fisheries (%) 2.4 2.2 2.7 2.7 2.9 3.3
Forestry and Wild Life (%) 22.7 17.5 19.6 17.7 16.2 17.0
Plantations (%) 0.1 0.1 0.0 0.0 0.0 0.0
Food Storage and Warehousing (%) 3.7 11.2 8.5 8.6 10.1 7.8
Agricultural Research and Education (%) 7.6 6.0 6.6 6.1 5.6 6.5
Cooperation (%) 11.1 19.8 19.7 22.5 18.8 11.1
Other Agricultural Programmes (%) 1.1 0.5 0.5 0.5 0.5 0.8
Source: State Finance-A Study of Budgets, Various Years, RBI
Since 2004-05, plan expenditure for agriculture and allied activities from the State budgets shows an increasingtrend. During the initial year of the UPA-led government, share of plan expenditure was around 30%, and that sharehas increased during subsequent years and reached at 53% during 2008-09 BE. Looking at the intra-sectoraldistribution of plan expenditure, most of the expenditure was on functions like crop husbandry, soil and waterconservation, fisheries and plantation. (See table-5.4) One of the obvious arguments is that huge plan investmentscannot yield desired outcomes in any sector, unless there is an equal and proportionate increase in non-planexpenditure in the sector to absorb plan expenditure.
Table-5.4.: Share of Plan Expenditure in Total Expenditure by all States on different Sub-sectors within Agricul-ture & Allied Activities (in %)
Function/Year 2003-04 2004-05 2005-06 2006-07 2007-08 RE 2008-09 BE
Agriculture and Allied Activities 34.0 29.9 32.6 41.4 45.8 53.3
Crop Husbandry 44.6 43.3 47.8 48.6 58.3 64.0
Soil and Water Conservation 69.3 71.0 69.7 74.4 76.0 78.4
Animal Husbandry 14.6 17.6 21.7 25.5 33.6 36.1
Dairy Development 5.4 8.2 13.4 22.6 38.2 51.5
Fisheries 45.7 50.8 47.0 54.4 51.4 61.0
Forestry and Wild Life 36.6 36.0 41.6 43.4 43.9 45.0
Plantations 66.0 58.6 52.6 56.3 53.8 53.2
Food Storage and Ware Housing 18.6 3.4 5.2 11.6 17.2 16.1
Agricultural Research and Education 19.7 22.1 26.8 28.8 30.3 45.9
Co-operation 31.6 22.0 17.3 47.6 46.6 65.8
Other Agricultural Programmes 13.2 32.9 43.7 38.6 49.7 63.3
Source: State Finance-A Study of Budgets, Various Years, RBI
If one looks at the distribution of total plan allocation of all States among different sub-sectors (functions) ofagriculture and allied activities, it is apparent that there has been a clear shift of priorities between 2003-04 and2008-09. During 2003-04, top priority was for crop husbandry followed by forestry and wild life, soil waterconservation and co-operation. However, though crop husbandry is still emphasized during 2008-09, the thrust ofplan investment shifted from forestry, wild life and water conservation to animal husbandry, co-operation andagriculture research and education. (See graph-5.2)

46
Figure 5.2.: Priorities for different Sub-sectors within Plan Expenditure on Agriculture and AlliedActivities (in %)
2008-09 BE
Food, Storage
and Ware
Housing
2%
Agricultural
Research and
Education
4%
Co-operation
10%Other
Agricultural
Programme
0%
Soil and Water
Conservation
13%
Animal
husbandry
5%
Dairy
Development
1%
Fisheries
3%
Forestry and
Wild Life
25%
Crop
Husbandry
37%
Agricultural
Research and
Education
6%
Other
Agricultural
Programme
1%
Co-operation
14%
Food, Storage
and Ware
Housing
2%
Forestry and
Wild Life
14%
Animal
Husbandry
8%
Dairy
Development
3%
Fisheries
4%
Soil and Water
Conservation
10%
Crop
Husbandry
38%
2003-04
Source: Computed from State Finance-A Study of Budgets, Various Years, RBI
Table-5.5.: Shre of Cpitl Expenditure in Totl Expenditure by ll States on different Sub-sectors within Agricultureand Allied Activities (in %)
Function/Year 2003-04 2004-05 2005-06 2006-07 2007-08 RE 2008-09 BE
Agriculture and Allied Activities 9.2 19.2 17.4 21.6 16.7 14.3
Crop Husbandry 7.8 4.4 2.4 2.9 5.3 2.9
Soil and Water Conservation 21.6 18.1 20.0 29.9 30.8 26.8
Animal husbandry 1.3 1.4 3.4 4.6 6.3 5.4
Dairy Development 0.7 0.9 1.2 1.2 0.6 0.2
Fisheries 11.4 12.2 10.9 12.5 12.2 14.5
Forestry and Wild Life 9.7 11.0 13.2 13.2 11.7 14.1
Plantations 13.8 48.8 51.2 49.7 50.7 49.6
Food Storage and Ware Housing -61.9 42.9 24.1 35.0 44.6 47.4
Agricultural Research and Education 2.1 1.5 2.1 3.3 1.1 1.6
Co-operation 45.7 50.1 52.2 56.9 31.7 38.2
Other Agricultural Programmes 3.5 4.2 7.1 5.7 9.9 7.0
Source: Computed from State Finance-A Study of Budgets, Various Years, RBI
Agriculture

www.cbgaindia.org
HOW DID THE UPA SPEND OUR MONEY?
Over the year, a stagnating trend (See table 5.5) of expenditure has been observed under capital heads by the Stategovernments for agriculture and allied activities. As is viewed that capital expenditure in any sector of the economywill push the future growth of the sector while contributing to the overall growth process of the economy. Hence,increased expenditure under such heads may reduce the crisis that prevails in this sector.
E. Trends in Agricultural Inputs
Table-5.6.: Gross Capital Formation (GCF) in Agriculture (at 1999-00 Prices)
Year Total GCF GCF in Share of GDP GCF in Agriculture(in Rs. crore) Agriculture Agriculture in Agriculture as % of
(in Rs. crore) Total GCF (in %) (in Rs. crore) Agriculture GDP
1999-00 506244 43473 8.59 409660 10.61
2000-01 488658 39027 7.99 407176 9.58
2001-02 474448 48215 10.16 433475 11.12
2002-03 555287 46823 8.43 398206 11.76
2003-04 665625 44833 6.74 441360 10.16
2004-05 795642 49108 6.17 441183 11.13
2005-06 950102 54905 5.78 468013 11.73
2006-07 1053323 60762 5.77 485937 12.50
Source: Economic Survey, 2007-08, Government of India,
Increase in productivity and hence production of agricultural output is dependent on capital formation in agriculturesector both from public and private sector. Gross Capital Formation (GCF) in agriculture as a proportion of total GCFhas shown a continuous decline over the years. (See table 5.6) However, GCF in agriculture relative to agriculturalGDP shows an increasing trend. It is pertinent to note that the rising trend of GCF in agriculture as percentage ofagricultural GDP is, in some sense, misleading. The declining share of agriculture in GDP is accountable for such amisleading trend. Hence, share of agriculture GCF to overall GCF provides us the complete picture. However, giventhe situation of low capital formation in this sector, targeting to achieve 4% of annual growth rate during EleventhFive Year Plan needs at least 16% of GCF in agriculture to agriculture GDP.
Table-5.7.: Institutional Credit Flow to Agriculture Sector (in Rs. crore)
Year/Agency Co-operatives RRBs Commercial Banks Total
2004-05 31424 12404 81481 125309
2005-06 39404 15223 125859 180486
2006-07 42480 20435 140382 203297
2007-08 ** NA NA NA 250000
Note: ** Taken from Key Features of Interim Budget 2009-10. RRB: Regional Rural Banks, NA-Not available
Source: Economic Survey, 2007-08, Government of India
As we know credit for agriculture sector is an indispensable input for the growth of this sector. Ensuring cheap andtimely disbursement of credit to the farmers retains their confidence to adopt agriculture as a means of livelihood. Itis true that promises made in NCMP have been fulfilled with regard to doubling the rural credit within the time frame.It is also true that they have announced a debt waiver and debt relief scheme for the farmers. But the scheme as ameans to reduce the stress of the farmers, fails to recognise the plight of such category of farmers (about 39%,during 2002, All India Debt and Investment Survey, RBI) who have had to take loan from non-institutional sources.
Consumption of chemical fertilisers such as N, P & K for agriculture has doubled during the period 1990-91 to2006-07, which, in fact, is not a good sign for Indian agriculture keeping in mind the quality of soil degradation dueto using chemical fertilisers. However, the composition of the use of chemical fertilisers since 1990-91 shows abalanced trend (See table-5.8).

48
Table-5.8.: All-India Consumption of Fertilisers in terms of Nutrients (N, P & K) since 1990-91 (in %)
Year N (Nitrogen) P (Phosphorus) K (Potassium) Total (in '000 Tonnes)
1990-91 63.7 25.7 10.6 12546.2
1991-92 63.2 26.1 10.7 12728.0
1996-97 72.0 20.8 7.2 14308.1
2000-01 65.4 25.2 9.4 16702.3
2001-02 65.2 25.2 9.6 17359.7
2002.03 65.1 25.0 9.9 16094.1
2003-04 65.9 24.6 9.5 16799.1
2004-05 63.7 25.1 11.2 18398.3
2005-06 62.6 25.6 11.9 20340.3
2006-07 63.6 25.6 10.8 21651.0
Source: Agriculture Statistics of India, 2008, GoI
Access to extension service workers for any government agency as a source of information on the use of moderntechnology in agriculture by the farming community in India is very low. This could be one of the major reasons forlow rate of growth of productivity of agriculture in India. Access to extension services workers as a source ofinformation in using modern technology by the farmers is only 5.7% which is still low among farmers falling undermarginal category of farmers households. Similar is the case in accessing any government agency. (See table-5.9)
Table-5.9.: Access to Extension Services (% of Farmer Households) during 2003*
Category of Farmers Marginal Small Marginal & Small Medium & Large Total
Access to extension service workers 4.1 8.1 4.9 10.1 5.7as a source of information onmodern technology for farming
Access to any government agency 5.4 8.9 6.1 12.5 7.2as a source of information on moderntechnology
Note: * All India includes the small states Goa, Delhi, Puducherry, & UTs
Source: Compiled from NSSO data on 59th round, Situation Assessment Survey of Farmers 2003
Higher the consumption of electricity for agricultural purposes higher would be agricultural productivity. If oneobserves the trend of consumption of electricity for agriculture purposes since 1991-92, it depicts a substantialdeclining trend. During 1991-91, proportion of total consumption of electricity for agriculture purposes out of totalelectricity consumption of the country was 28% which got reduced to around 22% during 2006-07. (See table 5.10)
Table-5.10: Share of Consumption of Electricity for Agricultural Purposes (in GWh)
Year As a Proportion of Total Consumption
1991-92 28.20
1996-97 29.98
2001-02 25.33
2002-03 24.88
2003-04 24.13
2004-05 22.93
2005-06 21.92
2006-07* 21.73
Note: * Provisional GWh: Giga Watt-hour
Source: Central Electricity Authority, New Delhi
Agriculture

www.cbgaindia.org
HOW DID THE UPA SPEND OUR MONEY?
Budgetary provision for food and likewise, subsidies plays an important role in securing food for all in general and forthe disadvantaged sections of the community in particular. Given the volatility in world food prices, ensuring fairprices to the farmers for agricultural produce on the one hand and providing food grains to the poorer sections of thesociety on the other hand through food subsidies becomes crucial. Although budgetary spending for major subsidiesincluding petroleum subsidy increased substantially (in absolute numbers) during 2003-04 to 2009-10, majority ofthe population continues to face food insecurity. During 2004-05, total food subsidy (Central Government's) bill wasRs.25798 crore and this increased to Rs.42490 crore in 2009-10 Budget Estimate. Data also reveals that foodsubsidies have been on the rise since 2007-08 (see Table 5.11).
Table-5.11: Expenditure on Subsidies from the Union Budget (in Rs. Crore)
Items/Year 2003-04 2004-05 2005-06 2006-07 2007-08 2008-09 RE 2009-10 BE
Food 25181 25798 23077 24014 31328 43627 42490
Indigenous (Urea) 8521 10243 10653 12650 12950 16517 8580Subsidies
Imported (Urea) Subsidies 0 494 1211 3274 6606 10981 7800
Sale of decontrolled 3326 5142 6596 10298 12934 48351 33600fertiliser with concessionto farmers
Petroleum Subsidy 6351 2956 2683 2699 2820 2877 3109
Grants to NAFED for 156 120 260 560 860 375 375MIS/PPS
Other Subsidies 788 1204 3042 3630 3428 6515 4978
Import/Export of sugar, 0 0 0 0 0 540 200Edible Oils etc
Interest Subsidies 170 564 2177 2809 2311 4063 2609
Other Subsidies 618 640 865 821 1117 1912 2169
Total Subsidies 44323 45957 47522 57125 70926 129243 100932
Total Subsidies as 1.61 1.46 1.33 1.38 1.50 2.38 1.68Proportion to GDP (%)
Total Subsidies as 9.41 9.22 9.40 9.79 9.95 14.35 10.59Proportion to TotalGovernment Expenditure (%)
Source: Compiled from Expenditure Budget Vol-1, 2009-2010, Government of India
F. Indicators of Outcomes
Table-5.12.: India's Imports/Exports of Agricultural Commodities vis-à-vis Total National Imports/ Exportsduring 1990-91 to 2007-08
Year Proportion of Agriculture Imports Proportion of Agriculture Exports toto Total National Imports Total National Exports
1990-91 2.79 18.49
1995-96 4.80 19.18
2003-04 6.12 12.70
2004-05 4.55 11.08
2005-06 3.26 10.78
2006-07 3.53 10.92
2007-08(P) 3.09 12.15
Note: P-Provisional Source: DGCI&S, Ministry of Commerce, Kolkata.

50
Table 5.12 depicts that proportion of agricultural imports to the total national imports have declined since 2003-04.Similar trend is also observed with regard to exports of agricultural products to the national products. It is importantto note that higher proportion of agricultural imports to the national imports signifies higher dependency of theeconomy on agricultural products.
Per capita net availability of food grains since 1990 shows a declining trend. One of the obvious presumptions of thiscould be that this warns the policy makers and the administrators to take bold steps at the earliest before getting intothe acute crisis of food. During 1990, per capita per annum net availability of food grain was 172.5 kg which gotreduced to 160.4 kg in 2007. Similar is the trend with net availability of food grain (grams per capita per day) whichwas 472.6 gram per capita per day during 1990 which reduced to 394.9 gram. The decline is around 78 grams percapita per day (16% over 1990). (See table 5.13)
Table-5.13.: Net Availability of Foodgrains since 1990
Years Net Availability of Food grains Net Availability of Food grains(Kg Per Capita Per Annum) (Grams Per Capita Per Day)
1990 172.5 472.6
1995 180.8 495.5
2000 165.9 416.2
2001 151.9 494.1
2002 180.4 437.6
2003 159.7 462.7
2004 168.9 422.4
2005 154.2 445.3
2006 162.5 439.3
2007 (P) 160.4 394.9
Note:
1. The net availability of food grains is estimated to be Gross Production (-) seed, feed & wastage, (-) exports (+) imports, (+/-) change in stocks.
2. The net availability of food grains divided by the population estimates for a particular year indicates per capita availability of food grains interms of kg/year. Net availability, thus worked out further divided by the number of days in a year i.e., 365 days gives us net availability of foodgrains in terms of grams / day
3. Figures in respect of per capita net availability given above are not strictly representative of actual level of consumption in the countryespecially as they do not take in to account any change in stocks in possession of traders, producers and consumers.
4. For calculation of per capita net availability the figures of net imports from 1981 to 1994 are based on imports and exports on Government ofIndia account only. Net imports from 1995 onwards are the total exports and imports (on Government as well as private accounts)
5. Food grains includes rice, wheat, other cereals and all pulses P- Provisional
Source: Agriculture Statistics of India, 2008, GoI
G. Interim Budget 2009-10: What about Major Schemes/Programmes in Agriculture andAllied Activities?
• There is no increase in allocation found in the budget 2009-10 for National Horticulture Mission. The allocationduring 2008-09 was Rs. 1,100 crore which has remained the same in 2009-10.
• The 2008-09 BE for the programme RKVY for the year 2008-09 was Rs. 3,165.67 crore and 2009-10 BE for thisprogramme is Rs. 3,153.3 crore. Hence, the allocation for RKVY has declined to the extent of Rs. 12 crore.
• Allocation for Department of Agriculture and Cooperation declined in 2009-10 compared to the previous year’sbudget estimates, from Rs. 10,734.45 crore in 2008-09 BE, it reduced to Rs. 10,651.45 crore in 2009-10 BE.
• An overall increase in allocation is observed for the Department of Agricultural Research and Education in2009-10 compared to previous year’s budget estimates. The increase is around 21%.
• However, no such increase is noticed in the Plan allocation for the Department of Agricultural Research andEducation and Department for Agriculture and Cooperation in 2009-10 compared to 2008-09.
• An increase of only Rs. 44 crore is observed for the Department of Animal Husbandry, Dairying and Fisheries.
• Allocation towards food subsidies declined to the tune of Rs. 1150 crore in 2009-10 BE compared to 2008-09 RE.
Agriculture
50

www.cbgaindia.org
HOW DID THE UPA SPEND OUR MONEY?

52
A. Promises & Policy Initiatives of the UPA Government
The United Progressive Alliance (UPA) in its National Common Minimum Programme (NCMP) promised for all-outefforts to ensure universal food and nutritional security in the country during its tenure. It launched the National Foodfor Work Programme (NFFWP) as a 100% Centrally Sponsored Scheme (CSS) in November 2004 in 150 most back-ward districts of the country to generate additional supplementary wage employment with food security. Under thisprogramme, cash and foodgrains are entirely provided by the Centre. Likewise, in the existing Sampoorna GrameenRozgar Yojana (SGRY), minimum wages in the SGRY are paid to the workers through a mix of minimum 5kgs offoodgrains and at least 25% in cash to protect the real wages of the workers, besides improving the nutritionalstandards of the families of the rural poor.
UPA's NCMP promises on Food and Nutrition Security
• To work out a comprehensive medium-term strategy for food and nutrition security. The objective will be tomove, over time, towards universal food security.
• To strengthen the Public Distribution System (PDS) particularly in the poorest and backward blocks of thecountry and to involve women's and ex-servicemen's cooperatives in its management.
• To launch special schemes to reach foodgrain to the most destitute and infirm.
• To establish Grain Banks in chronically food-scarce areas.
• To introduce Antyodaya cards for all households at risk of hunger.
• To bring about major improvements in the functioning of the Food Corporation of India (FCI) so as to controlinefficiencies that increase the food subsidy burden.
• To expand on a significant scale, nutrition programmes particularly for the girl child.
The UPA government enacted a very historic legislation, the National Rural Employment Guarantee Act in August2005 to provide a legal undertaking of at least 100 days of wage employment in every financial year to every ruralhousehold whose adult members volunteer to do unskilled manual work. In the first phase it covered 200 districts, inthe second phase 130 additional districts were covered and in the third phase, all remaining districts have beencovered since financial year 2008-09. The two important schemes for food security- SGRY and NFFWP have beensubsumed under NREGS.
During the UPA regime, the Village Grain Bank Scheme, which was hitherto with the Ministry of Tribal Affairs, wastransferred to the Department of Food & Public Distribution. The objective of the scheme was to establish GrainsBanks in chronic food scarce areas and to provide safeguards against starvation during the lean period. The schemewas also intended to mitigate drought-induced migration and food shortages by making foodgrains available in thevillage during calamities.
Food & Nutrition Security
• The UPA's NCMP had promised a lot for ensuring universal food and nutritional security through enactingNREGA and other policies like NPAG and Village Grain Bank scheme. It subsumed the old schemes andprogrammes like Sampoorna Grameen Rozgar Yojana (SGRY) and National Food for Work Programme (NFFWP)in NREGS.
• Central Government's outlays towards food security do not show any substantial improvement despite itspromises. Two important schemes ensuring food security viz. TPDS & AAY have not got substantial prioritizationin the budgets of the UPA Government.
• Union Budget outlays on other important interventions for achieving nutritional security, such as Supplemen-tary Nutrition Programme (SNP), Mid Day Meal (MDM) and food component of SGRY and NFFWP, haveshown that the UPA Govt. has not done much to address the problem of cute malnutrition in India.
• During the UPA regime, 80% population lived below Rs.100 ($ 2) per day (IGIDR, 2008), and 50% of ruralpopulation still maintain their livelihoods within Rs.580 as Monthly Per-capita Consumption Expenditure (MPCE)
• In the UPA regime, promises made by the NCMP for providing universal food security have turned out to beempty rhetoric. The allocation on food security (2004-05 to 2008-09) has remained around 1.18% of GDP.

www.cbgaindia.org
HOW DID THE UPA SPEND OUR MONEY?
The Government further approved the implementation of Nutritional Programme for Adolescent Girls (NPAG), throughthe Ministry of Women and Child Development, in 51 backward districts identified by the Planning Commission in theyear 2005-06 which provides 6 kg of free food-grains to undernourished adolescent girls only (pregnant women &lactating mothers are not covered as these are targeted under ICDS). The scheme is being continued for the AnnualPlan 2006-07 on pilot project basis. The funds are given as 100% grant to States/UTs so that they can provide foodgrains through the Public Distribution System (PDS) free of cost to the families of identified undernourished persons.The success of the intervention is dependent on effective linkages with the Public Distribution System. The targetgroups are adolescent girls (11-19 years) (weight < 35 Kg). The services provided are (i) 6 kg of free food-grains(wheat/rice/maize based on habitual consumption pattern of the state) /per month per beneficiary. (ii) nutrition andhealth education to the beneficiaries and their families.
Eleventh Five Year Plan Proposals on Food & Nutrition Security
• To introduce a single Central Issue Price for both BPL and APL families in those states where TPDS is notperforming satisfactorily.
• To introduce food stamps as a viable alternative to the present PDS system if markets can be integrated.
• To introduce Multi Application Smart Cards (MASCs) to facilitate simplification of procedures and enhance theefficiency of PDS.
• To stop the massive leakage of fiscal subsidy to the non-poor on the one hand and the ineffective targeting of thepoor by the cardholder-based TPDS system
• To redirect subsidies currently in the PDS to better funding of other schemes (MDM and ICDS).
• To universalize ICDS and to restructure its mission mode with a mission structure at the central level and a similarstructure at the state level with a greater focus on 0-3 year old children.
• To give priority to micronutrient malnutrition control, especially to tackle anaemia.
• To reduce anaemia among women and girls by 50% by the end of the Eleventh Plan
• To expand the existing Iron and Folic Acid Supplementation Programmes under RCH (NRHM) and to expandVitamin A Supplementation Programme for all children between nine months to five years of age and existinglow coverage to be brought to 90% by 2009
Furthermore, to ensure sustainable nutritional security to all children basically for the primary school children, the UPAimposed an Education Cess of 2% on all major Central Taxes through the Finance Act, 2004. Prarambhik Shiksha Kosh(PSK) has been established with effect from September 2005 as a dedicated non-lapsable fund to receive theproceeds of the cess. The funds in the Kosh are used for Sarva Shiksha Abhiyan (SSA) and National Programme forNutritional Support to Primary Education or the Mid Day Meal scheme. With regard to nutritional intake, MDM wasrevised in June 2006 under which a provision of cooked mid-day meal having nutritional value of minimum450 calories with 8-12 grams of protein has been envisaged. While the guidelines of providing free foodgrains at therate of 100 grams per child per school day remains, the cooking cost has been further increased to Rs. 1.50 per childper school day. The government also revised the coverage pattern of the scheme in October 2007 to reach out toupper primary level (Classes VI to VIII) in 3479 educationally backward blocks. From 2008-09 onwards, the programmehas been extended to all children up to upper primary level (from Class I to VIII) in all areas across the country. InIntegrated Child Development Services (ICDS), the Centre has increased the share in Supplementary Nutrition Programme(SNP) since 2005-06.
Besides providing food and nutritional inputs in ensuring security among the poor and marginalized, the Governmenthas also launched many other essential and related schemes with food security components in the National FoodSecurity Mission (NFSM), Rashtriya Krishi Vikas Yojana (RKVY) along with a comprehensive National Policy for Farmers(2007).
B. Public Spending during 2004-05 to 2008-09
The NCMP promise to attainment of food security has proved to be mere rhetoric. Government's allocations andexpenditure do not show any substantial improvement. Two important schemes ensuring food security - TPDS andAAY have not got substantial priority in the central food subsidy over the years. In 2005-06 the central food subsidydeclined to negative (-0.87%) compared to 2004-05. However, it has shown some improvement since. State share offood subsidy has gone down substantially in each financial year.

54
Source: Indian Public Finance Statistics 2007-08, Ministry of Finance, Govt. of India
Besides food subsidy, the combined expenditure of States on the crucial component of food storage and warehousingshows a very dismal picture. While the States' share a major chunk of the expenditure, the trend has fluctuated overthe years. In 2005-06, the rate of allocation was negative compared to 2004-05. However, it showed improvementin the next two years ending with negative growth in 2008-09. More importantly, while the revenue outlay hasshown improvement, the capital outlay has depreciated substantially over the years affecting food security as awhole.
Figure 6.2.: Total Expenditure on Food Storage and Warehousing by All States (in Rs. crore)
Food & Nutrition Security
23280
1199
23077
1163
24204
1100
25696
861
0
5000
10000
15000
20000
25000
30000
2004-05 2006-07 2007-08
Centre
States
2005-06
2757
2154
2701
3992
3321
2000
2500
3000
3500
4000
4500
2004-05 2005-06 2006-07 2007-08 2008-09
Chart-6.1.: Allocation on Food Subsidy by the Centre and All States (in Rs. crore)
Source: State Finances: A Study of Budgets of 2008-09, RBI
With regard to public expenditure on food security, both units of federal India have performed abysmally low onmany expenditure heads. Important components of nutritional security where Centre allocates substantially, such asSupplementary Nutrition Programme (SNP), Mid Day Meal (MDM) and food components of SGRY and NFFWP haveregistered insignificant growth. Particularly, the annual growth rate in the Centre's allocation for MDM programmehas gone down substantially since 2005-06. As noticed in the following table, while the annual growth rate of MDMin 2005-06 was 60%, it came down to 20% in 2008-09. In 2009-10 interim budget, the allocation of 8000 crore (BE)has remained stagnant with the revised estimate of 2008-09.

www.cbgaindia.org
HOW DID THE UPA SPEND OUR MONEY?
Table-6.1.: Total Public Expenditure on ‘Food Security’ in India (in Rs. crore)
Expenditure Heads 2004-05 2005-06 2006-07 2007-08(RE) 2008-09(BE)
Total Food Subsidy(Combined Centre+ States) 26997.06 24240.24 25114.48 32407.36 32666.59
Food Storage & Warehousing (Centre) 67.35 106.76 96.22 99.71 -38.97
Food Storage & Warehousing (All States) 2757 2154 2701 3992 3321
Nutrition (Including SupplementaryNutrition Programme) (Centre)** 8.6 1511.53 1512.67 2077.34 1696.41
Nutrition (State) 3226 4022 4845 6540 8594
MDM Scheme(Centre) 1507.5 3345.26 5348 6678 8000
SGRY & (NFFWP)/NREGS (Centre)* 2078 5548.5 16200 1956.54 6750 (RE)
Village Grain Banks (Centre)* NA NA NA 15.71 15.3
Total Expenditure (Centre +State) 36641.51 40928.29 55817.37 53766.66 61004.33
Note: For Food Subsidy & Storage and Warehousing (2008-09), the reference data has been taken from expenditure budget (Vol-II) ofDepartment of Food and Public Distribution; the SNP component of ICDS has started since 2007-08 onwards; and lastly the SGRY and NFFWPhave been subsumed in the NREGS- the component taken in NREGS are only food aspect of SGRY.
**the Centre share in SNP has been started since 2005-06 and for the 2008-09 the figure are available till 05.01.2009, (MWCD website),*Revised Estimates
Source: State Finances: A study of Budgets of 2008-09; Indian Public Finance Statistics 2007-08, Ministry of Finance; Expenditure Budget(vol-II) Union Budget of various years, Ministry of Women and Child Development website
The share of allocation for food security to GDP (current prices) reveals fluctuating trends. During the UPA regime(2004-2009), the average share of food security allocation has stayed close to 1.18% of GDP.
Figure 6.3.: Total Allocation on ‘Food Security’ as % of GDP (at current market prices)
1.12
1.14
1.35
1.14
1.16
1.00
1.05
1.10
1.15
1.20
1.25
1.30
1.35
1.40
2004-05 2005-06 2006-07 2007-08 2008-09
Source: GDP figures from 2001-02 to 2006-07 are from CSO, Consolidated Accounts of India; www.mospi.nic.in, for 2007-08 the figures arefrom IPF Statistics 2007-08, Ministry of Finance; while 2008-09 figure from Budget at a Glance, Union Budget 2009-10.
C. Extent and Magnitude of Food Insecurity in India
The following fact sheet shows the grueling status of food and nutritional insecurity in India. The UPA governmenthas failed to translate the rhetoric of NCMP into any visible change in the life of 'Aam Aadmi'.

56
Table-6.2.: Extent and Magnitude of Food Insecurity in India
Indicators Sources and reference years Values
Estimated Population 2004-5, NSS, 61st Round, 2004-5 1092 million
Annual Growth Rate of Population As per Census-2001 1.8 %
Annual Growth Rate of Foodgrain Production 1989-0 to 2006-7, Economic Survey,2007-8, GoI (Government of India). 1.18 %
Rural Household reported food inadequacy As per 2004-5, NSS 2.4 %
Persons Below Poverty Line in rural areas 2004-5 based on URP consumption 28.3 %(Rs. 12 per person per day) data, NSSO, 61st Round
Population below Rs. 50/- ($ 1) a day India Development Report, 2008, IGIDR 35.3 %
Population below Rs. 100/- ($ 2) a da y India Development Report, 2008, IGIDR 80.6 %
Proportion of children less than five years NFHS-III, 2005-6, GoI 48.0 %of age classified as Undernourished
Proportion of children less than five yearsof age classified as Underweight NFHS-III, 2005-6, GoI 42.5 %
Proportion of children less than five years of NFHS-III, 2005-6, GoI 23.7%age severely undernourished (according to height-for-age)
Proportion of children less than five years of NFHS-III, 2005-6, GoI 15.8%age severely undernourished (according to weight-for-age)
Proportion of children less than five years of NFHS-III, 2005-6, GoI 69.5%age in any degree of Anaemia
Rural population belonging to household having NSS, 62nd Round, 2004-05 19 %Monthly Per capita Consumption Expenditurebelow Rs. 365, i.e. Rs. 12 per person per day -All Category
Proportion of rural population in India NSS, 64th Round, 2006-07 50.3%having MPCE below the average level of Rs. 580
Proportion of urban population in India NSS, 64th Round, 2006-07 17.4%having MPCE below the average level of Rs. 990
Out of every rupee that the average rural Indian spent on food NSS, 64th Round, 2006-07 52 paisa
Out of every rupee that the average urban Indian spent on food NSS, 64th Round, 2006-07 37 paisa
Source: Reproduced from Nilachala Acharya (2009), "Food Security in India: A Critical Issue", forthcoming issue of Budget Track, CBGA, New Delhi
Provisions in the Interim Budget 2009-10
The UPA government in its 2009-10 Interim Budget has remained unresponsive to the problem of childmalnutrition in the country.
The much-required Central food subsidy has shown a decline in the Interim Budget 2009-10 in comparison to therevised estimate of 2008-09. The government has taken no initiative to universalise the Public Distribution System.
Promises made in the NCMP for providing universal food security have turned out to be empty rhetoric. Theallocation on ‘food security’ has remained around 1.18% of GDP during 2004-05 to 2008-09.
Food & Nutrition Security
56

www.cbgaindia.org
HOW DID THE UPA SPEND OUR MONEY?
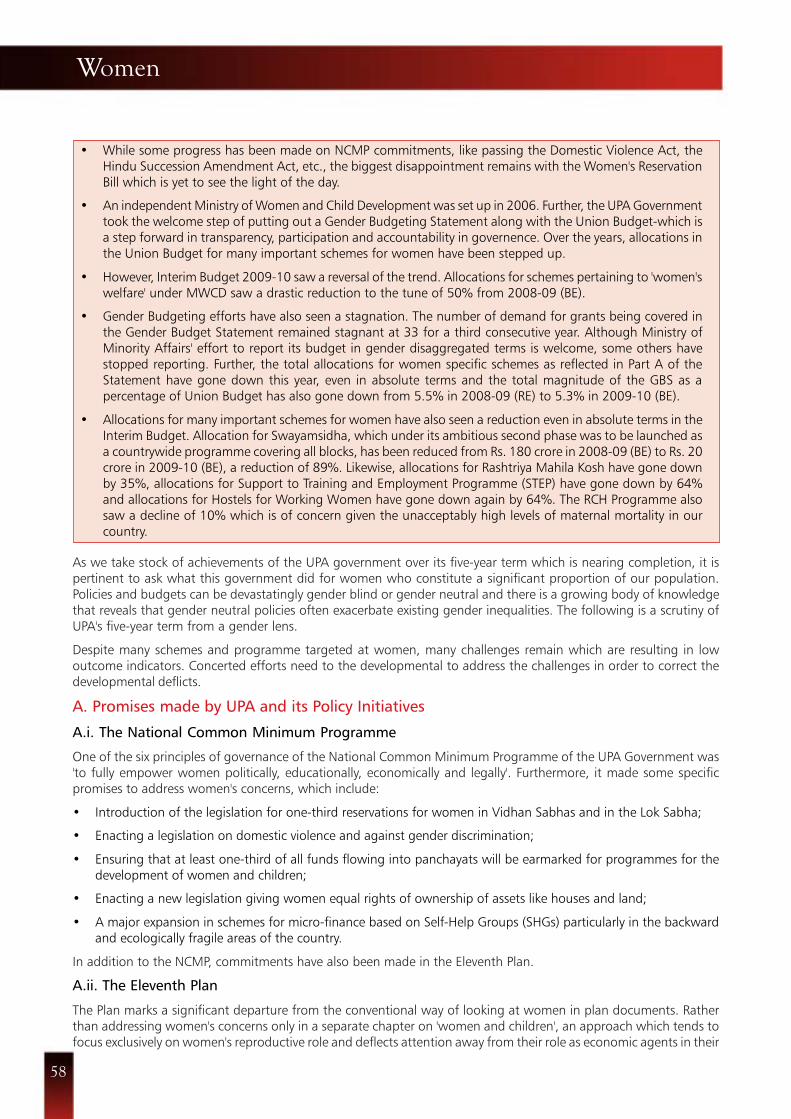
58
• While some progress has been made on NCMP commitments, like passing the Domestic Violence Act, theHindu Succession Amendment Act, etc., the biggest disappointment remains with the Women's ReservationBill which is yet to see the light of the day.
• An independent Ministry of Women and Child Development was set up in 2006. Further, the UPA Governmenttook the welcome step of putting out a Gender Budgeting Statement along with the Union Budget-which isa step forward in transparency, participation and accountability in governence. Over the years, allocations inthe Union Budget for many important schemes for women have been stepped up.
• However, Interim Budget 2009-10 saw a reversal of the trend. Allocations for schemes pertaining to 'women'swelfare' under MWCD saw a drastic reduction to the tune of 50% from 2008-09 (BE).
• Gender Budgeting efforts have also seen a stagnation. The number of demand for grants being covered inthe Gender Budget Statement remained stagnant at 33 for a third consecutive year. Although Ministry ofMinority Affairs' effort to report its budget in gender disaggregated terms is welcome, some others havestopped reporting. Further, the total allocations for women specific schemes as reflected in Part A of theStatement have gone down this year, even in absolute terms and the total magnitude of the GBS as apercentage of Union Budget has also gone down from 5.5% in 2008-09 (RE) to 5.3% in 2009-10 (BE).
• Allocations for many important schemes for women have also seen a reduction even in absolute terms in theInterim Budget. Allocation for Swayamsidha, which under its ambitious second phase was to be launched asa countrywide programme covering all blocks, has been reduced from Rs. 180 crore in 2008-09 (BE) to Rs. 20crore in 2009-10 (BE), a reduction of 89%. Likewise, allocations for Rashtriya Mahila Kosh have gone downby 35%, allocations for Support to Training and Employment Programme (STEP) have gone down by 64%and allocations for Hostels for Working Women have gone down again by 64%. The RCH Programme alsosaw a decline of 10% which is of concern given the unacceptably high levels of maternal mortality in ourcountry.
As we take stock of achievements of the UPA government over its five-year term which is nearing completion, it ispertinent to ask what this government did for women who constitute a significant proportion of our population.Policies and budgets can be devastatingly gender blind or gender neutral and there is a growing body of knowledgethat reveals that gender neutral policies often exacerbate existing gender inequalities. The following is a scrutiny ofUPA's five-year term from a gender lens.
Despite many schemes and programme targeted at women, many challenges remain which are resulting in lowoutcome indicators. Concerted efforts need to the developmental to address the challenges in order to correct thedevelopmental deflicts.
A. Promises made by UPA and its Policy Initiatives
A.i. The National Common Minimum Programme
One of the six principles of governance of the National Common Minimum Programme of the UPA Government was'to fully empower women politically, educationally, economically and legally'. Furthermore, it made some specificpromises to address women's concerns, which include:
• Introduction of the legislation for one-third reservations for women in Vidhan Sabhas and in the Lok Sabha;
• Enacting a legislation on domestic violence and against gender discrimination;
• Ensuring that at least one-third of all funds flowing into panchayats will be earmarked for programmes for thedevelopment of women and children;
• Enacting a new legislation giving women equal rights of ownership of assets like houses and land;
• A major expansion in schemes for micro-finance based on Self-Help Groups (SHGs) particularly in the backwardand ecologically fragile areas of the country.
In addition to the NCMP, commitments have also been made in the Eleventh Plan.
A.ii. The Eleventh Plan
The Plan marks a significant departure from the conventional way of looking at women in plan documents. Ratherthan addressing women's concerns only in a separate chapter on 'women and children', an approach which tends tofocus exclusively on women's reproductive role and deflects attention away from their role as economic agents in their
Women

www.cbgaindia.org
HOW DID THE UPA SPEND OUR MONEY?
own right, the Eleventh Plan tries to mark the centrality of women in all sectors. Although the extent to which thedifferent sections have been able to capture women's concerns remains unsatisfactory, the section on women doesmake significant commitments. Some of these which will bring cheer to women's groups include strengthening thepublic distribution system, revising the below-poverty line norms, recognizing Violence Against Women (VAW) as apublic health issue, reviewing the two-child norm, curtailing the harmful effects of television programmes thatpropagate patriarchal values and portray women in a negative, zero tolerance to discrimination against SC/ST andminority women, recognizing health needs of women with alternative sexualities and setting up a National Task Forceon VAW in Zones of Conflict. Some specific proposals include:
• A two-pronged strategy for women in agriculture: a) Ensuring effective and independent land rights forwomen, and b) Strengthening women's agricultural capacities. In addition, the plan seeks to address women'svulnerabilities due to farmer suicides.
• A pilot scheme for Leadership Development for Life, Livelihood, and Civic Empowerment of Minority Womento provide minority women with support, leadership training and skill development to assume leadershiproles.
• A social security policy that mitigates the negative impact of globalisation on women.
• Support women's access to housing loans via banks by developing a system of reaching housing finance atreasonable rates to poor women.
• A High Level Committee to conduct a review of SHG related policies and programmes.
• Enact a legislation which protects HIV positive women against discrimination in education, livelihoodopportunities, workplace, medical treatment and community.
• Create a mechanism to periodically report to the National Development Council the progress on Women'sPlans with respect to the National Policy for Empowerment of Women.
• Refine the norms of Women's Component Plan (WCP) to prioritize the most vulnerable as beneficiaries,particularly SC, ST women, Muslim women, single women, differently-abled and HIV positive women, amongothers.
• Amend the NCW Act to give the Commission more powers and likewise for the State Women's Commissions.
• Continued efforts towards gender budgeting and gender outcome assessment in all Ministries/Departmentsat Central and State levels and extend the concept of gender based plan component to PRIs and to the29 subjects transferred to them under the 73rd Constitutional Amendment.
B. Where have we reached?
Any commitment is only worth what it achieves. It is important to examine how far the commitments stated in theNCMP have been realized.
B.i. On the legal front:
• Despite several attempts, the Women's Reservation Bill still waits to see the light of the day.
• One of the biggest achievements of the UPA Government was passage of the Domestic Violence (DV) Act in2005. The Act was lauded by the women's groups for its comprehensive approach. However, the implementationof the DV Act faces severe bottlenecks, one of the biggest constraints being lack of adequate allocations to ensurethe implementation of the Act. Only a few states have allocated budget for the implementation of the Act, eventhese are grossly inadequate and allocations or directives from the Union Government in this regard are stillawaited. For effective implementation of the Domestic Violence Act, ensuring adequate allocations becomescritical.
• A discriminatory inheritance law was another area that needed urgent attention. The UPA Government amendedthe Hindu Succession Act which was another significant step forward. Giving daughters right to ancestralproperty can go a long way in changing the inherently unequal power equations.
• In December 2008, the historic Unorganized Workers' Social Security Bill was passed. It seeks to provide thebenefit of health, life and disability insurance, old-age pension and group accident scheme for unorganizedsector workers including farm workers and migrant labourers. Given that 97% of women workers are in theunorganized sector, this could have far reaching effects on women.

60
• Furthermore, some more legislative reforms are in the pipeline. The Sexual Harassment of Women at Work place(Prevention, Prohibition & Redressal) Bill is being finalized and the government has introduced a Bill in Parliamentto amend the Factories Act, 1948 to provide flexibility to women employees during night and requiring employersto ensure safety and protection of the employees. In addition, Medical Termination of Pregnancy Act is also beingrevised (the number of weeks being extended from 20 to 24).
• Amidst these positive moves, the Criminal Procedure Code (Amendment) Bill, 2008 is being viewed with concernby women's groups. The amendment restrains the police from arresting a person for criminal offences for whichthe maximum sentence is upto seven-year imprisonment. This has led to concerns that Section 498A of IPC(dowry harassment) may be rendered toothless as it has a maximum punishment of three years. Many otheroffences, some of which may be gender specific and attract a sentence of seven years or less, will also beimpacted.
B.ii. On the front of schemes:
UPA government has also introduced some new schemes for women. These include:
(a) Anganwadi Karyakartri Bima Yojana
This is a social security group scheme which was launched by the government to cover the risks of Anganwadiworkers and helpers and the premium amount per beneficiary per annum has been fixed at Rs. 280.
(b) Dhan Laxmi - a Conditional Cash Transfer Scheme for Girl Child
This scheme, launched initially on a pilot basis, aims to provide a set of staggered financial incentives for families toencourage them for better upbringing of girl child. Under the Dhan Laxmi scheme, an insurance cover of Rs 1 lakhwould be provided for the girl child at her birth and in all, cash package of around Rs 2 lakh will be provided to thegirl's family, preferably to the mother.
(c) Ujjawala- a Scheme for Rescue and Rehabilitation of Trafficked Women and Children
The scheme comprises 5 components - prevention, rescue, rehabilitation, reintegration and repatriation. It isproposed to be implemented through about 50 projects initially benefiting over 2500 victims.
(d) Incentive to Girls for Secondary Education
This is a centrally sponsored scheme to incentivise secondary education of girls with a total outlay of Rs.1500 crore.The scheme will cover all SC/ST girls who pass class VIII and girls who pass class VIII from Kasturba Gandhi BalikaVidyalayas and enroll for class IX in state-run or state-aided schools.
B.iii. On the front of budgets:
A worthwhile effort of the UPA government has also been the introduction of a Gender Budgeting Statement (GBS)as part of the Union Budget for 2005-06. The statement tries to capture the priority for women in Union Budgets. Thecoverage of the statement by various Union Government Departments has been growing over the years. Thisinitiative, which has been a long standing demand of several women's rights groups, is commendable, although thereis an urgent need to deepen the Gender Budgeting exercise, to expand its scope and to make it a more meaningfulexercise.
C. Public Spending during 2004-05 to 2008-09
It is not easy to capture the exact quantum of public spending on women. While it is easy to list those schemes thatare targeted exclusively for women, the more difficult task is to look at composite expenditure schemes and to assessthe percentage of resources flowing to women. In the absence of availability of such a figure (of how much exactly isbeing spent on women), one could try to assess approximate resources flowing to women in two ways.
One way is to use the GBS produced by the government as part of its budget documents. The table below summarisesthe GBS over the years. It is disappointing to note that not only have the number of demand for grants reporting inthe GBS remained stagnant for a third consecutive year, the total allocations for women specific schemes as reflectedin Part A of the statement have gone down in absolute terms and the total magnitude of the GBS has gone upmarginally in absolute terms but has gone down as a percentage of Total Expenditure from 5.5% in 2008-09 (RE) to5.3% 2009-10 (BE).
Women

www.cbgaindia.org
HOW DID THE UPA SPEND OUR MONEY?
Table-7.1.: Summary of the Union Budget Allocations for Women as presented in the Gender BudgetStatement (in Rs. crore)
No. of Total Allocations under Total Allocations Under Total magnitude ofDemands* Part A of the Statement** Part B of Statement*** Gender Budget
2005-06 10 Rs. 8,273.88 (RE) Rs. 15,966.63 (RE) Rs. 24,240.51 (RE)(4.77%****)
2006-07 24 Rs. 4,618.95 (RE) Rs. 17,632.46 (RE) Rs. 22,251.41 (RE) (3.8%)
2007-08 33 Rs. 8,428.66 (RE) Rs. 13,919.43 (RE) Rs. 22,348.09 (RE) (3.3%)
2008-09 33 Rs. 14,875.15 (RE) Rs. 34,748.20 (RE) Rs. 49,623.35(RE) (5.5%)
2009-10 33 Rs. 14,553.18 (BE) Rs. 36,605.86 (BE) Rs. 51,159.04 (BE) (5.3%)
Note: * In Union Budget covered under the Gender Budgeting Statement.
** Part A presents women specific provisions where 100% provisions are for women.
***Part B presents women specific provisions under schemes with at least 30% provisions for women.
**** Proportion of total Union Government Expenditure, shown in brackets.
Source: Gender Budgeting Statement, Expenditure Budget Vol. I, Union Budget - various years
However, analyzing the GBS cannot offer critical insights as these figures are disputed1. This year too, several mistakesremain. Many schemes under Ministry of Youth Affairs and Sports, although slated in Part-B of the statement, haveshown 100% of their allocations for women exclusively for women. These include schemes like Nehru Yuva KendraSangathan, National Service Scheme, National Service Volunteers Scheme, Youth Hostels and Scouting & Guiding. Asthe names of the schemes suggests, they cannot be exclusively for women. A persual of the annual report broughtout by the Ministry also does not indicate these schemes as exclusively for women. The Indira Awas Yojna still featuresin Part-A of the statement, implying that 100% of its allocations are exclusively for women, whereas the outcomeBudget of the Ministry reveals that this is an incorrect assumption.
Nonetheless while absolute figures given in the table above cannot be seen as the exact amount flowingto women, an analysis of the pattern of expenditure over the years gives some indication of the trend on spendingfor women. What can be said, without any doubt, is that the priority for women continues to be abysmallylow.
An alternative method of analysis could be assessing allocations of major schemes which affect women's health,education, employment, etc., (though these schemes may or may not be 'exclusively' for women). The section belowtries to analyse some such major schemes with significant components for women. It is not an attempt to make anexhaustive list of all schemes that impact women or assess the precise amount of what is the total magnitude offunds flowing to women as that exercise often resorts to using flawed assumptions of gender components in the lackof gender-disaggregated data; and that effort in any case, is already being made in the GBS produced by thegovernment. Rather, the aim is to look at the pattern of allocation over the years and at the larger superset ofschemes which will impact on various aspects of women's lives.
C.i. Women's Health
• Overall public spending on health continues to be low although it has been gradually stepped up over the years.This year saw a very marginal increase in spending on Health and Family Welfare from Rs. 18,476 crore in2008-09 (RE) to Rs. 18,808 in 2009-10 (BE). As a proportion of total Union Budget, spending on Health andFamily Welfare has, in fact, decreased from 2.11% in 2007-08 to 1.97% in 2009-10. The overall public spendingon health continues to be as low as 1.02% in 2008-09, far below the NCMP commitment of 3% of GDP. It is likelythat women would have suffered to a greater extent because of the persistence of gaps in the public health caresystem in the country.
• Although until last year, the UPA Government did increase allocations on some of the plan schemes addressingissues of women's health, for instance, Reproductive and Child Health (RCH) Programme, the overall impact ofsuch schemes cannot be expected to be significant. Union Budget outlay for RCH Programme has not beenincreased adequately in the last three years apparently because of lack of capacity in the backward states toimplement a significantly scaled-up RCH Programme. The Union Government should have taken strong measures
1 Subrat Das and Yamini Mishra, "Gender Budgeting Statement: Misleading and Patriarchal Assumptions", Economicand Political Weekly July 29, 2006 and Yamini Mishra and Bhumika Jhamb, "What Does Budget 2007-08 OfferWomen?" Economic and Political Weekly April 21, 2007

62
for capacity building of the programme implementing staff for RCH at the district and sub-district level in thebackward states which would have enabled them to implement the programme effectively and utilise highermagnitudes of budget outlays. The 2009-10 Union Budget brings a decline of 10% for the RCH Programmewhich is of concern given the unacceptably high levels of maternal mortality in our country.
• Union Budget outlays for Rural Family Welfare Services and Urban Family Welfare Services provide the salaries ofAuxiliary Nurse Midwife (ANMs) in the Health Sub-Centres in the rural and urban areas. The lack of any substantialincrease in the outlays for these schemes shows the neglect of human resource component of healthcare deliveryin the country.
• Furthermore, women's health policies seem squarely focused on reproductive health and are not premised on aholistic understanding of women's health needs through a life cycle approach. The Eleventh Plan has also recognisedthe need to move beyond the traditional focus on family planning and reproductive health, to adopt a holisticperspective on women's health so that other health needs of women are not neglected.
Table-7.2.: Allocations for Some Major Schemes on Women's Health (in Rs. crore)
Scheme Year
2003-04 2004-05 2005-06 2006-07 2007-08 2008-09 2009-10RE RE RE RE RE RE Interim
Budget
Rural Family Welfare Services 1561 1722 1259 982 1947 2228 2335
Urban Family Welfare Services 119 121 122 72 129 158 157
RCH Programme 442 486 1814 1338 1629 2737 2422
Development of Nursing Services 10 - 13 18 13 15 15
Source: Expenditure Budget Volume II, various yearsNote: The figures donot include the lumpsum provision for North-East Region.
C.ii. Women's Education
• The overall public spending on education in the country continues to be around 3.5% of the GDP which is grosslyinadequate to strengthen the public sector education system in the country. There has hardly been any progressin terms of Union Government spending on education as a proportion of GDP from 0.42% (2004-05) to 0.7%(2009-10). It is likely that women would be worst affected by the persistence of weaknesses in the educationsystem since they face a historical backlog and the institutionalised hegemony.
• The UPA Government took steps towards increasing the outlay for Sarva Shiksha Abhiyan (SSA) and Mid DayMeal (MDM) Schemes until last year, which was indeed appreciable. However, even with these increases, outlaysfor both the schemes remained inadequate to address the requirement of resources in elementary education inthe backward states. Moreover, the UPA Government from 2007-08 onwards has increased the burden of fundson the States progressively, which betrays its much publicized policy intent of increasing public spending oneducation to the level of 6% of GDP. This year's budget, very disappointingly saw a decline in the allocation ofSSA and a marginal increase in the allocation of MDM, which in real terms would be no increase at all.
• Women-specific interventions like Mahila Samakhya (MS), Kasturba Gandhi Balika Vidyalaya (KGBV) and NationalProgramme for Education of Girls at the Elementary Level (NPEGEL) have continued to get low magnitudes ofbudget outlays. Allocation of MS remained the same as last year, which in real terms is a decline. A new Schemeon Construction and Running of Girls Hostels for Secondary and Higher Secondary with an allocation of Rs. 54crore is welcome and could help in strengthening higher learning opportunities for girls.
• Furthermore, enrolling and retaining girls in schools requires a far more serious and focused approach on the partof the state given the deep-seated mental blocks that bind girls to limited traditional roles. This requires concertedefforts on part of the state-designing better programmes, including addressing concerns around pedagogy andensuring that these translate to better outcomes.
2 Agriculture Statistics of India, 2008, GoI
Women

www.cbgaindia.org
HOW DID THE UPA SPEND OUR MONEY?
Table-7.3.: Allocations for Some Major Schemes on Women's Education (in Rs. crore)
Scheme Year
2003-04 2004-05 2005-06 2006-07 2007-08 2008-09 2009-10RE RE RE RE RE RE Interim
Budget
Mahila Samakhya 14 15 24 26 34 38 38
KGBV 1 90 25 13 - - -
Condensed Courses for 4 5 5 5 6 6.3 6.3Women's Education
National Scheme for Incentive - - - 0.90 221 45to Girls for SecondaryEducation (SUCCESS)
Sarva Shiksha Abhiyan 2732 4754 7166 10146 12020 11940 11934
Mid Day Meal Scheme 1375 1507 3011 4813 6004 9514 9518
Access and Equity 16 5 6 6 0.90 0.27 0.01
Source: Expenditure Budget Volume II, various yearsNote: The figures donot include the lumpsum provision for North-East Region.
C.iii. Women and Water Supply and Sanitation
• It is unfortunate that the Gender Budgeting exercise carried out by the Union Government has not yet coveredthe flagship schemes in the Water and Sanitation Sector, namely, Accelerated Rural Water Supply Programme(ARWSP) and Total Sanitation Campaign (TSC), although the allocations for both these schemes have increasedover the last five years. The actual improvement on the ground, in terms of the access of poor households toimproved water and sanitation facilities and the usability of the outputs delivered by the schemes, is yet to beascertained.
• In the water supply and sanitation sector, the allocations for rural water supply and rural sanitation haveremained the same as last year, which in real terms, is a decline.
Table-7.4.: Allocations for Some Major Schemes on Water Supply and Sanitation(in Rs. crore)
Scheme Year
2003-04 2004-05 2005-06 2006-07 2007-08 2008-09 2009-10RE RE RE RE RE RE Interim
Budget
Accelerated Rural Water 2326 2610 3654 4050 5750 6570 6570Supply Programme
Rural Sanitation 148 360 630 720 954 1080 1080
Source: Expenditure Budget Volume II, various yearsNote: The figures donot include the lumpsum provision for North-East Region.
C.iv. Women and Food Security
• Food security is not a gender neutral issue. Women are closely involved in the production and processing of foodat all stages and patriarchal norms often put the burden of ensuring enough food for all members of thehousehold largely on women. Ensuring food sovereignty thus is as much a gender issue and the decline in the netavailability of food grains from 422 grams per capita per day in 2004 to 394 grams per capita per day in 2007 isan area of concern.
• Rather than stepping up allocations, the UPA government in its Interim Budget 2009-10 has stagnated theallocation on the MDM scheme. Increase in allocations of National Food Security Mission and National NutritionMission are meager. Worse still, food subsidy has shown a decline, which is of great concern for women. Increasein allocations of Integrated Child Development Scheme (ICDS) is welcome.
3 Pallavi Chavan, "Access to Bank Credit: Implications for Dalit Rural Households" Economic and Political WeeklyAugust 4, 2007

64
Table-7.5.: Allocations for Select Schemes on Food Security (in Rs. crore)
Scheme Year
2003-04 2004-05 2005-06 2006-07 2007-08 2008-09 2009-10RE RE RE RE RE RE Interim
Budget
National Food Security Mission - - - - 400 973 993
Food Subsidy 25200 25800 23200 24204 31545 43627 42489
Integrated Child Development 1341 1623 2931 3885 4777 5665 6026Services
National Nutrition Mission 7 9 12 12 13 21 22and other nutrition schemes
Source: Expenditure Budget Volume II, various yearsNote: The figures donot include the lumpsum provision for North-East Region.
C.v. Women's Employment and SHGs
• NSSO data clearly shows that the unemployment rate among rural males has increased from 5.6% in 1993-94 to8 % in 2004-05, and among rural females it has increased from 5.6% to 8.7% during this time period. In thisscenario, concerted efforts need to be made to improve women's participation in the work force as well as theproductivity of their work, especially in the light of the global recession which might aggravate the situation.
• However, table 7.6 shows reductions in allocations for many schemes and a near stagnation in others. Swayamsidha,the integrated scheme of MWCD for holistic empowerment of women, which under its ambitious second phasewas to be launched as a countrywide programme covering all blocks and with a larger coverage has seen areduction in allocation in even in absolute terms from Rs. 180 crore in 2008-09 (BE) to Rs. 20 crore in 2009-10(BE), a reduction of 89% is of deep disappointment. Likewise allocations for Rashtriya Mahila Kosh have gonedown by 35%, allocations for Support to Training and Employment Programme (STEP) have gone down by 64%and allocations for Hostels for Working Women have gone down again by 64% (from 2008-09 BE).
• NREGA is a major scheme for women's employment as out of the total person days of work generated more than48% have been by women and the increase in allocation of NREGA from 2008-09 BE to RE is welcome, thoughother gender concerns regarding NREGA, some of which have been discussed in the last section, still remain.
• Review of some of the major programmes meant for women indicates that there is an overwhelming focus onSHGs as a vehicle for women's empowerment and almost seems like a panacea for addressing all concerns ofwomen. However, there is a growing body of literature on SHGs that suggests otherwise-that, book keeping andmaintaining financial records have overshadowed the critical issues of women's empowerment, equity and justiceand even exclusion of Muslim, dalit and tribal women from many such groups, etc. Furthermore, in the hullabalooof SHGs, it is important to remind ourselves that women, especially poor women, are increasingly being excludedfrom formal sources of finance and, as a result, have to resort to borrowing from moneylenders at high interestrates. Financial inclusion requires increasing women's access to all types of credit sources, especially from commercialbanks and cooperatives and not just micro-finance institutions. Further, schemes for women need to be conceivedmore creatively rather than just redefining gender roles.
Women

www.cbgaindia.org
HOW DID THE UPA SPEND OUR MONEY?
Table-7.6.: Allocations for Some Major Schemes on Women's Employment and SHGs
(in Rs. crore)
Scheme Year
2003-04 2004-05 2005-06 2006-07 2007-08 2008-09 2009-10RE RE RE RE RE RE Interim
Budget
STEP 8 16 13 13 18 23 12
Swayamsiddha 8 16 27 22 45 20
Rajiv Gandhi National Crèche - - 41 94 100 91.8 91.5Scheme for Working Mothers
Hostels for Working Women 4 6 4.5 4 4 9.9 9
Swawlamban 18 22 7 - - - -
Rashtriya Mahila Kosh - - 0.01 10 12 31 20
Improvement in Working
conditions of Child\
Women Labour 68 98 116 121 153 147 90
Social Security for 13 13 - 0.10 2.5 204* 218*Unorganised Sector Workers
NREGS - - - 10170 10800 30000 30100
Sampoorna Grameen 9640 4590 7650 2700 3420 6750 -Rozgar Yojana
Swarnjayanti Gram 720 900 899 1080 1620 2113 2115Swarozgar Yojana
Swarnajayanti Shahri 94 122 160 250 344 515 515Rozgar Yojana
Priyadarshini Scheme - - - 1 10 23 27
Note: *Includes Health Insurance Scheme for Unorganised Sector**The figures donot include the lumpsum provision for North-East Region.
Source: Expenditure Budget Volume II, various years
C.vi. Most Marginalised Women
• Women are not a homogenous group and acknowledging the discrimination that women face is intersectional,it is important to assess how far budgets and policies have tried to address specific needs of most marginalisedwomen, including though not limited to dailt women, tribal women, Muslim women, disabled women, positivewomen, etc. The commitment in the Eleventh Plan for revision of Women's Component Plan (WCP) to prioritiseneeds of most vulnerable women must be implemented.
• Plan allocations earmarked for SCs and STs in the Union Budget continue to be very low and far below what waspromised in the Special Component Sub-Plan and Tribal Sub Plan norms of 16% and 8% respectively. The2008-09 Budget had actually reversed the trend of increasing allocations for SCs and STs and these stood at 7%and 4.2% in 2008-09 (RE). What proportions of this flow to women is yet to be ascertained concretely however,it cannot be very significant.
• The allocation for the pilot scheme for Leadership Development of Minority Women promised in the Eleventhplan, though small, is welcome.

66
Table-7.7.: Allocations for Some Major Schemes for Dalit, Tribal and Muslim Women (in Rs. crore)
Scheme Year
2003-04 2004-05 2005-06 2006-07 2007-08 2008-09 2009-10RE RE RE RE RE RE Interim
Budget
For Scheduled Castes
Special Assistance to SCP 377 374 398 440 487 578 470
Machinery for Implementation 31 35 37 37 39 43 42of PCR Act and Prevention ofAtrocities Act
Self Employment Scheme for - - - - 50 100 97Liberation and Rehabilitationof Scavengers
For Scheduled Tribes
SCA to TSP 461 497 689 817 817 860 900
Upgradation of Merit 51 77 188 222 162 195 218Hostels for STs
Construction of Boys/Girls 19 13 16 28 34 60 59
For Muslim Women
Scheme for Leadership - - - - - 4.5 5Development of MinorityWomen
Source: Expenditure Budget Volume II, various yearsNote: The figures donot include the lumpsum provision for North-East Region.
C.vii. Women in Difficult Circumstances
• Women across India face serious violations of their civil and political rights. Worse still, violence against womenhas been increasing (Table 7.9). The kind of institutional structure that is required across the country to addressthe needs of women in difficult circumstances cannot be developed with such meager allocations. Theinadequacy of the institutional structure to provide relief to women is particularly acute in parts of the countryaffected by armed conflict like the North-East and Kashmir.
• The number of functional Swadhar homes which are meant for women in distress remains abysmally low. As perthe Annual Report of the MWCD, 2007, number of such homes is 208 across the country, implying that there isn'tone even per district. Likewise is the case with Short Stay Homes, which are much lesser than what a country ashuge as India requires. However, allocations for these have not been stepped up. Reduction in the allocation ofSchemes for Rescue of Victims of Trafficking is to be noted with concern.
• The launch of two new schemes - Indira Gandhi National Widow Pension Scheme and Indira Gandhi NationalDisability Pension Scheme - is welcome, though the amount to be provided as pension is grossly inadequate. TheIndira Gandhi National Widow Pension Scheme will provide pension of Rs.200 to widows between the agegroups of 40-64 years.
Table-7.8.: Allocations for Some Major Schemes for Women in Difficult Circumstances (in Rs. crore)Scheme Year
2003-04 2004-05 2005-06 2006-07 2007-08 2008-09 2009-10RE RE RE RE RE RE Interim
BudgetSwadhar 0.80 3.69 5.5 13.5 13.5 13.5 13.5Short Stay Homes 15.35 14.40 15 15.72 15.9 15.9 15.9Scheme for Rescue of Victims - - 0.25 0.45 4.50 5.4 4.5of Trafficking*
Note: * modified to Comprehensive Scheme for Combating Trafficking in 2008** The figures donot include the lumpsum provision for North-East Region. Source: Expenditure Budget Volume II, Various Years
Women

www.cbgaindia.org
HOW DID THE UPA SPEND OUR MONEY?
D. Development Outcomes
While all these efforts have been made, the critical point of assessment must be whether these have translated at allin better outputs and outcomes for women. Let us examine some statistics to be able to make this assessment.
Males and Females
Table-7.9.: Discrimination Against Women in Every Sphere
Indicator Present Scenario
Child Sex Ratio 927 in 2001
Incidence of Anaemia Among pregnant women:
• Risen from 49.7% to 57.9% during 1998-99 and 2005-06.
Among ever-married women:
• Risen from 51.8% to 56.2% during the same period.
Maternal Mortality Rate 301 in 2001-03 (SRS)
• MMR particularly high in UP, Uttaranchal, Assam and MP
• 51.7% births take place without assistance from any health personnel
• Underage marriage among girls still widely prevalent.
Gender Differential in Education Literacy rate of women: 54.16% (75.5% for men)
Gender differential in education: 21.7%
• Although in absolute numbers illiterate women have decreased from1991 to 2001, drop out rates continue to remain high
• In 68 districts, either SC/ST female literacy is more than 5% but less than10%
• Compared to SC/ST girls, 61% of whom are out of school, only about12% of girls from upper caste households are out of school.
Female Work Participation Rate 28% (2004-05)
• Work participation rate for women in rural areas has increased from28.7% in 2000-01 to 32.7% in 2004-05, whereas in urban areas it hasincreased from 14% in 2000-01 to 16.6% in 2004-05. However, notonly does work participation rate remain lower for women than for menboth in rural and urban areas but also much of the increase in employ-ment among women has been in the form of self-employment..
Wage Disparity Ratio in Average wage/salary earnings (Rs. per day) received by regular wage/salariedemployees of age 15-59 yrs in 2004-05 for:
• Rural Males & Rural Females is Rs. 144.9/day and 85.5/day respectively
• Urban Males & Urban Females is Rs. 203.3/day and 153.2/day respectively
• The wage disparity ratio has widened during 1999-00 to 2004-05
Women's Representation in Parliament 9.1% in 2004:
• Improved only slightly from 6.1% in 1989
• The figure is very low as against that of 14.8%, 13.1%, 15.0% and 25%in Bangladesh, Malaysia, US and Mexico.
Violence against Women Crimes against women have been increasing:
• Rape cases increased from 16075 in 2001 to 18233 in 2004;
• Dowry deaths increased from 6851 in 2001 to 7026 in 2004;
• Cases of abduction and trafficking for sexual and other exploitations-19.4% and 7.2% respectively in 2005.
Source: Complied from Eleventh Five Year Plan Document (2007-2012), Planning Commission, Government of India

68
The figures tell the story. It is apparent from the table that women continue to face discrimination on all fronts despitemore than half a century of independence and the vision of "equality" that the Constitution had laid down. Worse still,we seem to be in a downward spiral of commitments not being fulfilled. Successive five year plans have also notfulfilled the targets they had set out for themselves, including the Tenth Plan as can be seen from the table below.
Table-7.10.: Monitorable Targets for the Tenth Plan and Achievements
IMR 45 by 2007 and 28 by 2012 57 (NFHS-3) and58( SRS 2005)
MMR 2 by 2007 and 1 by 2012 3.01 (SRS 1997-2003)
Gender gap in literacy Reduce by at least 50% by 2007 21.7%(Census of India)
Gender differential in wages Reduce by 50% by 2007 Ratio of female wage/male wage reduced to0.59 for rural and 0.75 for urban areas (NSSO,2004-05) therefore indicating an increase ingender differential in wage rates.
Source: Selected Educational Statistics, MoHRD, 2004-05
E. Challenges that remain
While the government's attempts towards Gender Budgeting is a welcome step, it will serve the larger goal ofpromoting gender equality only if it is understood more holistically and is done more comprehensively rather than asa mere accounting exercise of identifying flows from the budget meant for women. The recent economic downturnnotwithstanding, we must recognize that India's much celebrated growth saga has been premised on women's paid,underpaid and unpaid labour. Yet women's larger concerns as economic agents have seen adverse trends andstatistics bear these out. For instance, India's work participation rate at 28% continues to be low even in comparisonwith other developing nations like Sri Lanka (30%), Bangladesh (37%), and South Africa (38%). Another worryingfact is that despite a slight increase in employment, the average earning for rural women has declined between1999-2000 and 2004-05. This decline is more pronounced among poorer women. The average wage for men has,on the other hand, shown an increase across all categories. In this context, some specific areas of concern have beensummrised below:
E.i. Social sector allocations continue to be abysmally low:
Social sector allocation in India, despite some progress in recent years, continue to be abysmally low, whether youlook at them in comparison with other countries or in relation to the low development indicators or even in relationto the targets set out in the NCMP (6% of the GDP to be allocated for education and 3% for health). Social sectorallocations have a significant impact on women. For the budgets to be more gender sensitive, social sector allocationsmust be increased and at the same time the quality of spending must also improve. Furthermore, allocations targetedat women also need to be stepped up across different ministries given that women are lagging behind in alldevelopment indicators. Even the progress made on the legislative front for women will mean nothing unless backedby adequate resources to bring these laws into reality.
E.ii. Capitalising on women's underpaid and unpaid work:
Many of UPA's flagship programmes continue to rely on women's underpaid work. The Sarva Shikha Abhiyan (SSA)hires "para" teachers, who are local people, usually class VIII pass and pays them monthly wages as low as Rs. 1000to Rs. 3000 and these account for approximately 16% of all school teachers in the country. Likewise, under theIntegrated Child Development Scheme (ICDS), one of the largest schemes essentially depends on anganwadi workersand helpers, who were until recently paid around Rs. 1000 and Rs. 500 per month respectively. Although this hasseen some upward revision, the amount paid to them is still less than the minimum wages in most states. Theargument for not paying them minimum wages is that these are "social workers" or "volunteers" and therefore theyare not paid "wages" but are paid an "honorarium" since anganwadis are open for only a few hours in the day andhence the work in not supposed to be fulltime. However, a reality check would suggest that quite to the contrary thework expected from anganwadi workers is extensive and is definitely fulltime work. The National Rural Health Mission(NRHM) too relies on women's unpaid work. The Accredited Social Health Activist (ASHA) who is the most importantcomponent of the programme and is expected to perform a formidable list of tasks is also supposed to be anhonorary volunteer. Although some states are making an effort to pay them, what they are paid is grosslyinadequate. Thus, many of the flagship schemes of the UPA government are designed on the premise of capitalizingon women's unpaid and underpaid labour. Such "misplaced miserliness" on issues of such importance requires urgentredressal .
Women

www.cbgaindia.org
HOW DID THE UPA SPEND OUR MONEY?
E.iii. Gender concerns in the working of many schemes remain to be addressed:
Governments' responsibility does not end with designing and starting new schemes. How these schemes work inreality and whether they are able to address the needs of the people in an effective way is as much the government'sresponsibility. Many of the schemes designed by the government are not resulting in better developmental outcomefor the people and especially for women. Under NREGA for instance, the worksite facilities provided for in the Act,such as, crèches, etc., have not been provided in a majority of the states. Women headed households in many statesand single women in particular face discrimination in getting job cards. Furthermore, the adoption of excessivelyambitious work norms reduces the possibility of labourers, especially women, receiving minimum wages.
E.iv. Recognition of women's centrality across all sectors:
Women's location and centrality in all sectors needs to be recognized and policies for all sectors need to be genderresponsive. For instance, given the changing demographics of feminisation of agriculture since three-fourths of allwomen workers and 85% of rural women workers are in agriculture, the achievement of targets of agriculturalgrowth will depend on whether or not agricultural policies are gender responsive. To increase their productivity andeconomic contribution, women cultivators need land titles, credit, irrigation water, and infrastructure (technology,extension, and marketing support). Further, problems of women agricultural labourers need special attention, includingtheir wage levels, days of employment and access to basic social security. Women's employment in the formal sectorhas shown paradoxical trends with simultaneous increases in work participation rates, unpaid labour, migration forwork and open unemployment (Jayati Ghosh, 2009). It is of great concern that the largest increase in the regularemployment of urban women has been in domestic service. At the same time, the gender gap in the regular work,even in the formal sector, has gone up. Women's employment in the textiles and garments industry is growing butoften at much lower wages than men and with poorer working conditions. In addition to pro-active policies forencouraging greater women's participation in formal work, it is important to focus on enabling conditions, educationand training, child care facilities, timing of work and ensuring safety and health of women workers in organizedactivities .
E.v. Urgent need to implement what has been promised:
Despite the limitations of the framework of policy pronouncement, if what is promised is implemented, it would stillbe significant for the women of this country.
4 Jayati Ghosh, "Never Done and Poorly Paid, Women's work in Globalizing India", Women Unlimited 2009.
5 Gender and Governance, Reviewing Women's Agenda in the NCMP, Wada Na Todo Abhiyan, 2007
6 Towards Inclusive Growth: The Gender Dimension, Committee of Feminist Economists

7070

www.cbgaindia.org
HOW DID THE UPA SPEND OUR MONEY?

72
The persistence of significant deficits in the development of children in India is one of the major problems amidst highlevels of economic growth that India has witnessed over the last one and a half decades. Over the years, India hassucceeded in bringing down the Infant Mortality Rate (IMR) per 1000 live births from a level of 80 in 1990 to 55 in2007. However, it is still much higher than the levels not only in developed countries but also in many developingcountries, for instance Sri Lanka (15 in 2003) and China (37 in 2003). More importantly, the aggregate IMR for Indiahides a vast disparity prevailing across the States. The level of IMR still varies widely across the States, with theeconomically backward States, viz. Uttar Pradesh, Madhya Pradesh, Assam, Orissa, and Rajasthan recording veryhigh levels of IMR above 60 per 1000 live births in 2007 according to Sample Registration System (SRS) Bulletin, 2008.
The National Family Health Survey III has revealed that vaccination coverage (among children aged 12-23 months) inIndia has improved very marginally from 42% in 1998-99 to 44% in 2005-06. Likewise, the progress in coverage ofinstitutional deliveries has been very slow with only 40.7% coverage in the country in 2005-06. Moreover, the resultsfrom NFHS-III point to the disturbing fact that while the proportion of underweight children under 3 years was 47%in 1998-99, it still persisted at the level of 46% in 2005-06.
Table-8.1.: Key Indicators of Development Deficits of Children in India
State Infant Children Vaccination Coverage of Drop OutMortality Rate Under Age 3 Coverage Institutional Rates in Class
Who Are (in %) Deliveries I-X(Per 1000 Live Underweight (in %)
Births) (in %)
2007 (2005-06) (2005-06) (2005-06) (2004-05)
Uttar Pradesh 69 47 23 22 43.77
Chhattisgarh 59 52 49 15.7 *
Madhya Pradesh 72 60 40 29.7 64.7
Jharkhand 48 59 35 19.2 *
Assam 66 40 32 22.7 74.96
Orissa 71 44 52 38.7 64.42
Rajasthan 65 44 27 32.2 73.87
Bihar 58 58 33 22 83.06
Arunachal Pradesh 37 37 28 30.8 70.79
Andhra Pradesh 54 37 46 68.6 63.69
Tripura 39 39 50 48.9 73.36
Gujarat 52 47 45 54.6 59.29
Cont.... Next Page
Children
• The glaring deficits in the development of children in India seem to have persisted over the last five years; forinstance, the IMR is reported to be as high as 55 per 1000 live births in 2007, India having the lowest childimmunization rate in South Asia, and so on.
• The magnitude of 'Child Budget' within the Union Budget, i.e. the aggregate outlay for child specific schemes asa proportion of total budget outlay by the Union Government, increased from only 2.2 % in 2003-04 up to4.93 % in 2007-08. But the revised estimates of 2008-09 show a decline in the same to 4.13 % of the totalUnion Budget.
• If we take into account the fact that children (i.e. all persons up to the age of 18 years) constitute more than 40% the country's population and that many of the outcome indicators show persisting deficits in the develop-ment of children; the magnitude of 'Child Budget' at 4.13 % of the total Union Budget in 2008-09 (RE) cannotbe regarded as adequate.
• While the magnitude of 'Child Budget' is still inadequate, the prioritisation of this total amount earmarked forchildren in the Union Budget continues to show a skewed pattern; within the total resources earmarked forchildren in Union Budget 2008-09 (RE), 71.8 % is meant for Child Education, 16.2 % for Child Development,11.2 % for Child Health and only 0.8 % is meant for Child Protection.

www.cbgaindia.org
HOW DID THE UPA SPEND OUR MONEY?
Delhi 36 33 63 60.7 46.92
West Bengal 37 44 64 43.1 78.03
Jammu & Kashmir 51 29 67 54.3 53.75
Meghalaya 56 46 33 29.7 79.15
Karnataka 47 41 55 66.9 59.38
Uttarakhand 48 38 60 36 *
Haryana 55 42 65 39.4 32.48
Punjab 43 27 60 52.5 44.06
Nagaland 21 30 21 12.2 67.29
Maharashtra 34 40 59 66.1 54.16
Himachal Pradesh 47 36 74 45.3 32.42 #
Mizoram 23 22 46 64.6 66.95
Sikkim 34 23 70 49 82.3
Tamil Nadu 35 33 81 90.4 55.19
Manipur 12 24 47 49.3 43.02
Goa 13 29 79 92.6 40.65
Kerala 13 29 75 99.5 7.15
India 55 46 44 40.7 61.92
Note: Infant Mortality Rate (Per 1000 Live Births): Number of infant deaths per 1,000 live births in the last 5 years;Children Under Age 3 Who Are Underweight: Percentage of children under age 3 who are underweight (too thin for age);Vaccination Coverage: Percentage of children 12-23 months who have received all recommended vaccines;Coverage of Institutional Deliveries: Percentage of institutional births, based on the last 2 births in the 3 years before the survey.* Drop out rates are shown combined with the respective parent States.# The drop out rate (Class I-X) figure for Himachal Pradesh is for the year 2003-04.Source:1. SRS Bulletin, Registrar General, India (for data on- IMR per 1000 live births)2. National Family Health Survey (NFHS) - 3, Provisional Data for India and 29 States (Fact Sheets), 2005-2006, downloaded from www.nfhsindia.org(Children under age 3 who are underweight, Vaccination Coverage, and Coverage of Institutional Deliveries)3. Govt. of India, Ministry of Human Resources Development, Annual Report for 2006-07, downloaded from www.education.nic.in (for data onDrop Out Rates).
Socio-Economic Status of Children in India
• IMR is as high as 55 per 1000 live births (SRS, 2007).
• India has the lowest child immunization rate in South Asia.
• Birth registration in India is just 62% (Registrar General of India, 2004).
• Maternal Mortality Rate (MMR) is equally high at 301 per 100000 live births (SRS, 2001-03).
• Only 43.5% children in the age group of 12-23 months are fully immunized.
• The number of children orphaned in India is approaching 2 million (World Bank 2005).
• Only 21% children in the age group of 12-35 months receive a dose of vitamin A.
• Nearly 60000 newborns are infected every year from 189000 HIV positive women.
• Only 26% children who had diarrhoea got ORS (NFHS-3) as compared to 27% in NFHS-2.
• Three out of four children in India are anaemic.
• Every second new born has reduced learning capacity due to iodine deficiency.
• Children (0-3 years) underweight are 46% in NFHS-3, a marginal decrease from 47% in NFHS-2
• Children under 3 with anaemia are 79% (NFHS-3), an increase from 74.2% in NFHS-2.
• Only 23.4% children are breastfed within the first hour of birth (NFHS-3).
Source: Planning Commission, GoI: Eleventh Five Year Plan, 2007-12, Social Sector Spending, Voll-2, PP, 2007

74
In 2005, the National Plan of Action for Children, outlined commitments for the Central, State and local governmentsin the country towards fulfilling child rights, in four interlinked areas: child survival, child development, childprotection and child participation. These commitments, in turn, draw on the mandate delivered by the IndianConstitution.
The National Plan of Action for Children (2005), brought out by the Ministry of Women & Child Development,"commits the allocation of the required financial, material, technical and human resources from the Central and theState Government to ensure its full implementation. Investing in children lays the foundation for a just society, astrong economy, and a world free of poverty". This requires that Ministries and Departments with specific childbudgets and plans should ensure 100% spending and should also increase allocation in view of the large childpopulation. Along with many specific recommendations for Union and State Governments, a clear demarcation ofchild budget, spending and monitoring were put in the action plan.
To find out the magnitude of 'child budget' and keeping in mind the different needs of children in our country, allprogrammes/ schemes included in the 'Child Budget' are categorized into four sectors, viz.:
• Child Development
• Child Health
• Child Education
• Child Protection.
However, this categorization is subjective to some extent as certain child-specific schemes address multiple needs ofchildren and hence they can be considered to fall into more than one category. For instance, a scheme like "NationalProgramme for Nutritional Support to Primary Education (or the Mid-Day Meal scheme)" may be considered as a partof Child Education as well as a part of Child Development (in the analysis presented here, this scheme has beenincluded under Child Education). But in order to avoid double counting of child specific public expenditure, every suchscheme (addressing multiple needs of children) is included in any one of the four categories only.
A. Magnitude of ‘Child Budget’ in the Union Budget
The magnitude of 'Child Budget' within the Union Budget, i.e. the aggregate outlay for child specific schemes as aproportion of total budget outlay by the Union Government increased up to 4.93% in 2007-08 from only 2.2% in2003-04. But the revised estimates of 2008-09 show a significant decline to 4.13% of total Union Budget.
Figure-8.1: Outlays for Child Specific Schemes as a Proportion of Union Budget (in%)
Note: The figure for Total Expenditure from Union Budget in 2007-08 (RE) used in the present analysis does not include the Rs. 35,531croreworth of non-plan transaction undertaken in 2007-08 relating to the transfer of RBI's stake in SBI to the Government.
Source: GoI, Expenditure Budget Vol. I & II, Union Budget, (various issues)
Total Outlays for Child Specific Schemes as % of Total
Union Budget
2.22.54
4.17
4.63
4.93
4.13
0
1
2
3
4
5
6
2003-04
RE
2004-05
RE
2005-06
RE
2006-07
RE
2007-08
RE
2008-09
RE
Children

www.cbgaindia.org
HOW DID THE UPA SPEND OUR MONEY?
If we take into account the fact that children (i.e. all persons up to the age of 18 years) constitute more than 40% ofthe country's population and that many of the outcome indicators show persisting deficits in the development ofchildren; the magnitude of 'Child Budget' at 4.13% of the total Union Budget in 2008-09 (RE) cannot be regarded asadequate.
A.i. Prioritisation of Outlays Earmarked for Children in Union Budget 2008-09
While the magnitude of 'Child Budget' is still inadequate, the prioritisation of this total amount earmarked for childrenin the Union Budget 2008-09 shows a skewed pattern (Table 8.2 and Figure 8.2). The present analysis divides theentire 'Child Budget' into four categories, viz. Early Childhood Care & Development, Child Health, Child Education,and Child Protection. Each of the child-specific schemes selected from the Union Budget is considered only under anyone of these four categories.
Figure 8.2 below shows the sectoral composition of the total 'Child Budget' in Union Budget 2008-09 (RE). Within thetotal resources earmarked for children in Union Budget 2008-09 (RE), 71.8% is meant for Child Education, 16.2% forChild Development, 11.2% for Child Health and only 0.8% for Child Protection. This is very disturbing given that manyrecent cases have highlighted the vulnerability of children in the country, especially those children who are in variouskinds of difficult circumstances.
Figure-8.2: Sectoral Composition of the Total Outlay for Children in Union Budget 2008-09 (RE)
Source: Compiled from GoI, Expenditure Budget Vol. I & II, Union Budget 2008-09
Outlays for Early Childhood Care & Development as a proportion of total outlay by the Union Government havedecreased from 0.84% in 2007-08 (RE) to 0.67% in 2008-09 (RE). Outlays for Child Health as a proportion of the totalUnion Budget outlay is almost stagnant at around 0.45% in between 2007-08 (RE) and 2008-09 (RE). Outlays forChild Education registered a decline from 3.6% of the total Union Budget in 2007-08 (RE) to 2.96% of the total UnionBudget in 2008-98 (RE). Despite the relatively higher magnitude of Union Budget outlays for Child Education, thetotal public spending on education in the country continues at a low level. According to the Economic Survey for2007-08, the total budget outlay for Education Departments in the Centre and States combined stood at a meager2.84% of the GDP in 2007-08. Education Departments account for a substantial chunk of the total public spendingon education in the country. Hence, there can be no doubt about the fact that even Child Education remainsunder-funded in the government budgets in India.
However, it is the Child Protection sector which appears most neglected in the Union Budget. The outlay onChild Protection, registers a decline from 0.04% of the total Union Budget in 2007-87 (RE) to 0.03% of the totalUnion Budget in 2008-09 (RE). While the outlay for Integrated Child Protection Scheme (ICPS) has gone up, theoutlay for National Child Labour Project (NCLP) has been decreased in 2008-09 (RE) in comparison to2007-08 (RE).
Early Childhood
Care &
Development,
16.2
Child Health ,
11.2
Child Protection,
0.8
Child Education,
71.8
Child Protection Child Education
Early Childhood Care & Development Child Health
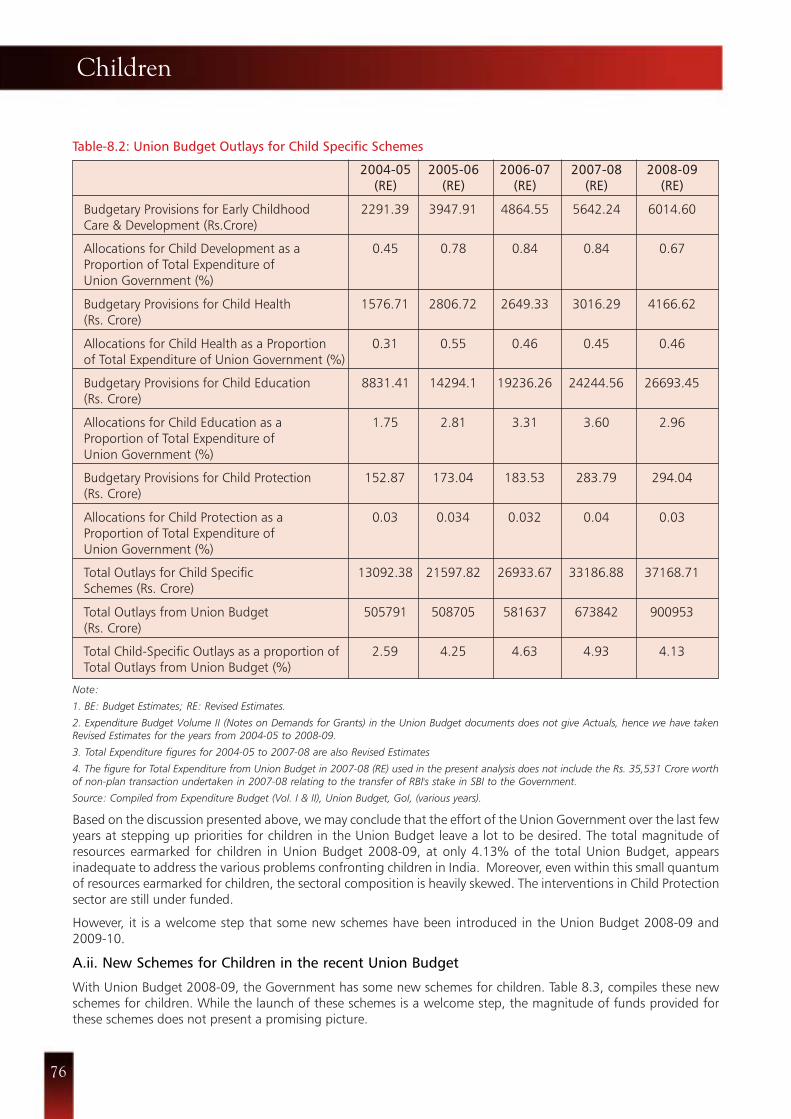
76
Table-8.2: Union Budget Outlays for Child Specific Schemes
2004-05 2005-06 2006-07 2007-08 2008-09(RE) (RE) (RE) (RE) (RE)
Budgetary Provisions for Early Childhood 2291.39 3947.91 4864.55 5642.24 6014.60Care & Development (Rs.Crore)
Allocations for Child Development as a 0.45 0.78 0.84 0.84 0.67Proportion of Total Expenditure ofUnion Government (%)
Budgetary Provisions for Child Health 1576.71 2806.72 2649.33 3016.29 4166.62(Rs. Crore)
Allocations for Child Health as a Proportion 0.31 0.55 0.46 0.45 0.46of Total Expenditure of Union Government (%)
Budgetary Provisions for Child Education 8831.41 14294.1 19236.26 24244.56 26693.45(Rs. Crore)
Allocations for Child Education as a 1.75 2.81 3.31 3.60 2.96Proportion of Total Expenditure ofUnion Government (%)
Budgetary Provisions for Child Protection 152.87 173.04 183.53 283.79 294.04(Rs. Crore)
Allocations for Child Protection as a 0.03 0.034 0.032 0.04 0.03Proportion of Total Expenditure ofUnion Government (%)
Total Outlays for Child Specific 13092.38 21597.82 26933.67 33186.88 37168.71Schemes (Rs. Crore)
Total Outlays from Union Budget 505791 508705 581637 673842 900953(Rs. Crore)
Total Child-Specific Outlays as a proportion of 2.59 4.25 4.63 4.93 4.13Total Outlays from Union Budget (%)
Note:
1. BE: Budget Estimates; RE: Revised Estimates.
2. Expenditure Budget Volume II (Notes on Demands for Grants) in the Union Budget documents does not give Actuals, hence we have takenRevised Estimates for the years from 2004-05 to 2008-09.
3. Total Expenditure figures for 2004-05 to 2007-08 are also Revised Estimates
4. The figure for Total Expenditure from Union Budget in 2007-08 (RE) used in the present analysis does not include the Rs. 35,531 Crore worthof non-plan transaction undertaken in 2007-08 relating to the transfer of RBI's stake in SBI to the Government.
Source: Compiled from Expenditure Budget (Vol. I & II), Union Budget, GoI, (various years).
Based on the discussion presented above, we may conclude that the effort of the Union Government over the last fewyears at stepping up priorities for children in the Union Budget leave a lot to be desired. The total magnitude ofresources earmarked for children in Union Budget 2008-09, at only 4.13% of the total Union Budget, appearsinadequate to address the various problems confronting children in India. Moreover, even within this small quantumof resources earmarked for children, the sectoral composition is heavily skewed. The interventions in Child Protectionsector are still under funded.
However, it is a welcome step that some new schemes have been introduced in the Union Budget 2008-09 and2009-10.
A.ii. New Schemes for Children in the recent Union Budget
With Union Budget 2008-09, the Government has some new schemes for children. Table 8.3, compiles these newschemes for children. While the launch of these schemes is a welcome step, the magnitude of funds provided forthese schemes does not present a promising picture.
Children

www.cbgaindia.org
HOW DID THE UPA SPEND OUR MONEY?
Table-8.3: New Schemes for Children in Union Budget 2008-09
Scheme(Allocation for 2008-09)
Support to One Year Pre-Primary inGovernment Local Body Schools(Rs 100 crore)
Scheme for upgrading 2000 KGBVs(residential schools/girls' hostels)(Rs. 80 crore)
New Model Schools(Rs.58.80 crore)
Objective
To formulate a new Centrally SponsoredScheme for providing assistance for pre-primary classes in government/localbody schools.
To establish one girls' hostel in eacheducationally backward block, about3500 in all.
To set up 6000 new high qualityschools, one in every block of thecountry.
Ministry/ Dept.
School Education & Literacy(2008-09)
Secondary Education(2008-09)
Source: Compiled from Union Budget, Expenditure Budget Vol. II, 2008-09
Table-8.4: New Schemes Announced in Union Budget 2008-09
Objective of the Scheme
Objective is given in the budgetdocument
As a follow-up to the implementation ofthe Sarva Shiksha Abhiyan (SSA) amassive increase in the number ofstudents completing upper primary level
Setting up of 6000 new for HighQuality Schools - one in every blockof the country
Creating girls hostel facilities forsecondary level students in eacheducationally backward block (about3500 in all).
The Assistance for appointmentLanguage Teachers of any language listedin the 8th schedule of the Constitutionthat is taught as third language.
Ministries/Department
Ministry of Minority Affairs
Department of SchoolEducation and Literacy
Name of the Scheme &Allocation
National Fellowship for Studentsfrom the minority communities(Rs 4.5 crore)
Rashtriya Madhyamik ShikshaAbhiyan (RMSA) (Rs 983.46 crore)
Scheme for Setting up of 6000 ModelSchools at Block Level as Bench Markof Excellence (Rs 312.90 crore)
Scheme for Construction and Run-ning of Girls Hostels for Students ofSecondary & Higher SecondarySchools (Rs.54.00 crore)
Appointment of Language Teachers( Rs 14.40 crore)

7878

www.cbgaindia.org
HOW DID THE UPA SPEND OUR MONEY?

80
It is well known that among the various socially disadvantaged groups, the Scheduled Castes (SCs/ Dalits) and ScheduledTribes (STs/ Adivasis) are among the most excluded. This is reflected in lower attainment of various developmentindicators among them compared to the rest of the population. In the post-independence era, successive governmentshave formulated laws, special programmes and policies for reaching these excluded sections of population, but allthese have eluded a large section of the SCs/STs. When the present UPA Government came to power, it made specificcommitments for the development of SCs/STs in the National Common Minimum Programme (NCMP).
Commitment for SCs/STs in the NCMP
• The UPA has urged the States to make legislation for conferring ownership rights in respect of minor forestproduce, including tendu patta, on all those people from the weaker sections who work in the forests.
• All reservation quotas, including those relating to promotions, to be fulfilled in a time-bound manner. Tocodify all reservations, a Reservation Act will be enacted.
• The UPA government launched a comprehensive national programme for minor irrigation of all lands ownedby dalits and adivasis. Landless families will be endowed with land through implementation of land ceiling andland redistribution legislation. No reversal of the ceiling legislation will be permitted.
• The UPA administration to take all measures to reconcile the objectives of economic growth and environmen-tal conservation, particularly, as far as tribal communities dependent on forests are concerned.
• The UPA is concerned with the growth of extremist violence and other forms of terrorist activity in differentstates. This is not merely a law-and-order problem, but a far deeper socio-economic issue which will beaddressed more meaningfully than has been the case so far. False encounters will not be permitted.
• The UPA government to review the overall strategy and programmes for the development of tribal areas toplug loopholes and to work out more viable livelihood strategies. In addition, more effective systems of reliefand rehabilitation to be put in place for tribal and other groups displaced by development projects. Tribalpeople alienated from their land will be rehabilitated.
• The UPA government is very sensitive to the issue of affirmative action, including reservations, in the privatesector. It will immediately initiate a national dialogue with all political parties, industry and other organizationsto see how best the private sector can fulfill the aspirations of SC and ST youth.
• Eviction of tribal communities and other forest-dwelling communities from forest areas to be discontinued.Cooperation of these communities to be sought for protecting forests and for undertaking socialafforestation. The rights of tribal communities over mineral resources, water sources, etc as laid down by lawtoll be fully safeguarded.
The Eleventh Five Year Plan envisages a number of ambitious targets and policies (for the overall development ofSCs/STs) as follows:
For Scheduled Castes
• Among the SCs, children of scavengers are educationally the most backward. The existing Pre-Matric scholarshipfor them needs to be revised in its funding pattern from 50:50 to 100% so that more target families send theirchildren to schools. Special attention needs be paid to retention in schools of SC students and the quality ofteaching for them.
• A Commission on Land Reforms will be set up which will specifically look into issues of - (a) continued possessionand effective uses of land distributed earlier to SCs under various programmes/legislative interventions; and (b)availability of land for distribution to SCs/STs/landless families. In all these, care will be taken to ensurepreferential/joint ownership for women.
Dalits & Adivasis
• A separate budget statement (Statement 21, Expenditure Budget Volume I) denoting the allocations earmarkedfor SCs/STs has been introduced in the Union Budget during the UPA tenure.
• However, it remains a matter of concern that the total magnitude of Plan allocations earmarked both for SCsand STs are far below the SCSP and TSP norms.
• With regard to fulfilling the NCMP commitments, except implementation of the Scheduled Tribes & OtherTraditional Forest Dwellers (Recognition of Forest Rights) Act, 2006, no other major initiatives have been realized.

www.cbgaindia.org
HOW DID THE UPA SPEND OUR MONEY?
• Large numbers of SCs depend on agricultural wages to sustain themselves and the State Governments thus needto revise agricultural wages every five years.
• Based upon the effective performance of the Finance and Development Corporations, the capital available at theirdisposal may be increased substantially to provide support to SC/ST businesses.
• Despite commitments made to the eradication of the obnoxious and dehumanizing practice of handling nightsoil manually, it still continues. Only 19 States and all UTs have adopted the Employment of Manual Scavengersand Construction of Dry Latrines (Prohibition Act, 1993). 9 States are yet to adopt the Act. A new scheme,namely the Self Employment Scheme for Rehabilitation of Manual Scavengers has been formulated torehabilitate the remaining 3.42 lakh scavengers out of the total number of 7.73 lakh in a time-bound manner byMarch, 2009 through training and extension of loans and subsidy. This has to be done in a mission mode withcommitment and zeal.
• Those belonging to the SC communities suffer from really high incidence of poverty and need to be provided withjob-oriented training to enable them to have better opportunities. Such training will be provided under theApprentice Act (refer to Labour and Employment Chapter).
• There is a need to complement protective legislations i.e. The Protection of Civil Rights Act, 1955 and ScheduledCastes and Scheduled Tribes (Prevention of Atrocities) Act, 1989 with a promotive legislation which should coverrights of SCs/STs with respect to education, vocational training, higher education and employment. Such legisla-tion may be drafted along the lines of the "Persons with Disabilities (Equal Opportunities, Protection of Rights andFull Participation) Act", 1995 which clearly spells out what is to be done and who should do it.
• The Department of Justice, Government of India, may establish a Special Law faculty to deal with the legal issuesof educating judicial officers, public prosecutors, police officials etc, to carry out the necessary research foreffective implementation of these two Acts. The Department should also review the judicial aspects and takeappropriate steps towards sensitizing the judiciary especially at the level of lower courts, to ensure more andspeedier convictions. It should also be ensured that Revenue, Health and other concerned Departments in theStates become more sensitized on the issue so that procedural delays in the investigation of offences under theAct are reduced.
• Elimination of caste-based discrimination and harassment in educational institutions should be remedied byestablishing 'Equal Opportunity Offices'.
• The private corporate sector will have to play a proactive role in providing sufficient job opportunities to theespecially marginalized and discriminated sections of Indian society. The Government shall explore all possibilitiesof introducing, in one form or the other, affirmative action including reservations in the private sector.
• There is a need to monitor implementation of programmes under Scheduled Caste Sub Plan. A Committee meantfor this purpose will be set up which will ensure that each Ministry's allocation of Scheduled Caste Sub Plan (SCSP)is indicated well in advance. Further if any particular Ministry is not able to utilize the earmarked allocation, actionshould be initiated to transfer the unused fund available to those Ministries/Departments which haveimplemented the SCSP more effectively.
For Scheduled Tribes
• The Fifth Schedule requires to be urgently operationalised. The Tribes Advisory Council (TAC) needs to be madeproactive, functioning as an advisory body to the State Government in matters relating to the STs. Second, itshould function as a tier in between the Zila Parishads in Scheduled Areas and the State Government. Itsjurisdiction should be expanded to cover all matters relating to tribal people, not limited as it is now to thosewhich are referred to it by the Governor.
• In the deficit areas, the requisite number of primary schools needs to be established. Specific norms for middleschools and high schools for tribal areas will be evolved and deficiencies made up. All schools should have properschool buildings, hostels, water, toilet facilities (particularly for the girls' schools).
• Residential high schools for ST boys and girls will be set up at suitable places. At the Gram Panchayat level, girls'hostels will be attached to the existing primary/elementary schools that do not have hostels.
• Textbooks in tribal languages, especially at the primary level, will be produced to enable better comprehension byST students up to Class III. Side by side, adequate attention will be paid to the regional languages so that childrendo not feel handicapped in higher classes.

82
• Efforts will be made to set up Industrial Training Institutes (ITIs) in the Tribal Sub Plan areas. Other training centreswill include community polytechnics, and undertaking rural/community development activities in their proximity,through application of science and technology.
• The Integrated Child Development Scheme (ICDS)/Anganwadi schemes for tribal areas will be evaluated andshortcomings eliminated.
• A large number of special coaching classes will be organized and the concerned institutions will be suitably aidedto enable ST students to compete in entry-level competitive examinations for professional courses.
• There is a need to constitute a special committee composed of eminent sociologists, anthropologists,educationists, administrators, representatives of scheduled tribe communities etc. to go comprehensively into theproblems of ST education and make recommendations for implementation.
• Efforts will be made to make available affordable and accountable primary health care facilities to STs and bridgethe yawning gap in rural health care services through a cadre of Accredited Social Health Activists (ASHA) andsectoral convergence of all the related sectors.
• Periodic reviews will be conducted of the delivery system and functioning of the health care institutions underthree broad heads to optimize service in the tribal areas: (i) health infrastructure, (ii) manpower and (iii) facilitieslike medicines and equipment.
• Action will be taken to make up the shortfall in the different categories of health institutions, liberalization ofnorms, addressing infrastructural deficiencies, application of quality standards and revitalization of Health CareSystems, Primary Health Centres and Community Health Centres.
• Towards making the existing tribal livelihoods more productive, intensive efforts will be mounted to restitute,vitalize and expand the agricultural sector. Use of irrigation in agriculture with a preference for organic farmingwill be a major step. Training centres will be opened to impart skills for diverse occupations to the tribals.
• Efforts will be made to promote horticulture, animal husbandry, dairy, sericulture, silviculture, cottage and smallindustry by extending necessary technology and credit, marketing and entrepreneurial information and training.
• To enable the tribal primary producers, collectors and consumers to enter into transactions with primarycooperatives, monopoly of corporations in certain items procured by them through contractors and middlemenwill be replaced by alternative market mechanisms like minimum price support with institutional backing. It willbe incumbent on national level organisations like Tribal Cooperative Marketing Development Federation of IndiaLimited (TRIFED) and National Agricultural Cooperative Marketing Federation (NAFED) to play their due role inmarketing of the tribal Minor Forest Produce (MFP).
• As visualized under NFP Resolution (1988), tribal association with forestry will be maximized through tribalcooperatives and self-help groups of tribal women.
• The Tribal Sub-Plan (TSP) will be reformed to restore its dynamic character and make it an effective instrument fortribal development.
• Once the National Tribal Policy is finalized, action will be taken to follow up on it.
• Prevention of exploitation of tribals through strict penal action against errant money-lenders, businessmen, trad-ers, middlemen, government servants and other exploiters. Effective implementation of the SC and ST(Prevention of Atrocities) Act, 1989.
• The practice of employment of contractors and middlemen by public sector organizations should be replaced bytribes-benefiting procedures.
• The strategy will be different for the two distinct categories of Primitive Tribal Groups (PTGs). The approach forheritage groups will place emphasis on conservation of the eco-system, life-styles and traditional skills along withan economic component. In the case of peripheral communities, the approach will be conservation of the
Dalits & Adivasis

www.cbgaindia.org
HOW DID THE UPA SPEND OUR MONEY?
eco-system, along with stress on economic programmes. The unique attributes of each group will determinespecific treatment in planning and implementation.
• A National Institute of Tribal Affairs (NITA) will be set up at the Central level. NITA will serve as a think-tank to theMinistry of Tribal Affairs. Expeditious step will be taken to set up the NITA.
Among the major policy initiatives in the post-Independence era for the upliftment of the SCs and STs are theScheduled Caste Sub Plan (SCSP) and Tribal Sub Plan (TSP), planned in 1979. But no previous government has madepublic any document regarding the implementation status of SCSP and TSP. From this point of view, it is quitepraiseworthy that only in the UPA tenure, a separate budget statement (Statement 21, Expenditure Budget Vol. I) forthe allocations earmarked for SCs/STs was made public. But at the same time, it is quite disturbing to see that thetotal magnitude of plan allocations earmarked both for SCs and STs are far below the SCSP and TSP norms.
Table-9.1.: Plan Allocations Earmarked for SCs from Different Min./Depts. in the Union Govt. (in Rs. crore)
Min./Depts. 2004-05 2005-06 2006-07 2007-08 2008-09RE RE RE RE RE
Dept. of Science & Technology 0 2.5 2.5 3 3
Ministry of Finance 0 0 3.02 0 0
Ministry of Tribal Affairs 0 0 0 0 0
*Ministry of Social Justice & Empowerment 986.13 1027.78 1260.14 1661.29 1779.25
*Dept. of Rural Development 2564.8 2771.67 2293 3134.33 4303.33
*Ministry of Labour & Employment 0.27 0.48 0.53 0.61 0.67
*Dept. of Women & Child Development 0 468.97 641.24 1494.4 1134
*Dept. of Secondary Education & Higher 0 266.33 259.28 453.52 4026.31Education (Ministry of HRD)
*Dept. of Elementary Education & Literacy 60 2027.57 2739.86 3509.65 987.16(Ministry of HRD)
*Ministry of Youth Affairs and Sports 0 13.29 13.04 17.9 20.73
*Ministry of Agriculture 0 0 0 136.37 228.16
*Dept. of Information Technology 0 0 7.06 20 19.33
*Dept. of Health & Family Welfare 0 0 1244.35 1676.19 1885.22
*Dept. of Small Scale Industries 0 0 0 136.8 210.77
*Ministry of Textiles 0 0 0 80.93 84.05
Dept. of Biotechnology 0 0 0 2.5 2
Ministry of Culture 0 0 0 2.93 3.93
Ministry of Pnachyat Raj 0 0 0 26.61 27.2
*Union Territories of Andaman & Nicobar 0 0 9.92 11.51 11.91Island, Daman & Diu, Dadra & NagarHaveli and Lakshadweep
Total Plan Exp. for SCs from Union Budget 3611.2 6578.59 8473.94 12367.77 14727.02
Note:
* The Union Budget documents do not segregate the total allocations earmarked for SCs/STs further to show allocations separately for SCs andSTs in these Ministries/ Departments. We assume here that following the proportion of SCs and STs in total population of the country (i.e. 16.2% for SCs and 8.2 % for STs as in Census 2001), out of the total funds earmarked for SCs and STs together, roughly two-third would be spent forSCs.
Source: Expenditure Budget Vol. I and Vol. II, Union Budget (respective years).

84
Table-9.2.: Plan Allocation Earmarked for SCs from the Union Budget (in Rs. crore)
2004-05 2005-06 2006-07 2007-08 2008-09RE RE RE RE RE
Total Plan Exp. for SCs from Union Budget 3611.2 6578.59 8473.94 12367.77 14727.02
Total Plan Exp. of Union Govt. 85061 109900 129804 152313 208252(excluding Central Assistance toState & UT Plans)
Proportion of total Plan Allocation 4.25 5.99 6.53 8.12 7.07earmarked for SCs (%)
Source: Calculated from the Expenditure Budget Vol. I and Vol. II, Union Budget (respective years).
From the above table, it is clear that allocation for the SCSP has increased over the years. In 2007-08, the planallocation earmarked for SCs stood at 8.12% of total plan expenditure of the Union Government. But it is still farbelow the SCSP norm of 16% (as a proportion of SC population the country). On the hand, it is quite depressing thatin 2008-09 (RE), it has declined to 7.07% of the total plan allocation of the Union Government.
Table-9.3.: Plan Allocations Earmarked for STs from Different Min./Depts. in the Union Govt. (in Rs. crore)
2004-05 2005-06 2006-07 2007-08 2008-09RE RE RE RE RE
Dept. of Science & Technology 0 2.5 2.5 3 3
Ministry of Finance 0 0 1.51 0 0
Ministry of Tribal Affairs 1069.45 1398.82 1652.68 1719.71 1970
*Ministry of Social Justice & Empowerment 0 0 25.03 34.9 36.25
*Dept. of Rural Development 1282.4 1385.83 1146.5 1567.17 2151.67
*Ministry of Labour & Employment 0.13 0.24 0.26 0.31 0.34
*Dept. of Women & Child Development 0 234.49 320.62 747.2 567
*Dept. of Secondary Education & Higher 0 133.16 129.64 226.76 493.58Education (Ministry of HRD)
*Dept. of Elementary Education & Literacy 30 1013.79 1369.93 1754.83 2028.16(Ministry of HRD)
*Ministry of Youth Affairs and Sports 0 6.64 6.52 8.95 10.37
*Ministry of Agriculture 0 0 0 68.19 114.08
*Dept. of Information Technology 0 0 3.53 10 9.67
*Dept. of Health & Family Welfare 0 0 622.17 838.09 942.6
*Dept. of Small Scale Industries 0 0 0 68.4 105.38
*Ministry of Textiles 0 0 0 40.47 42.03
Dept. of Biotechnology 0 0 0 1.25 1
Ministry of Culture 0 0 0 1.47 1.97
Ministry of Pnachyat Raj 0 0 0 13.31 13.95
*Union Territories of Andaman & Nicobar Island, 0 0 284 342.96 279.98Daman & Diu, Dadra & Nagar Haveliand Lakshadweep
Total Plan Exp. for STs from Union Budget 2381.98 4175.47 5564.89 7446.97 8771.03
Source: Calculated from the Expenditure Budget Vol. I and Vol. II, Union Budget (respective years)
Dalits & Adivasis

www.cbgaindia.org
HOW DID THE UPA SPEND OUR MONEY?
The scenario in terms of plan allocations earmarked for the STs in the Union Budget is not much different from thatof SCs discussed above. The proportion of total Plan Outlay of the Central Govt. earmarked for STs has increased overthe years (see Table 4.9), but suddenly declined to 4.21% in 2008-09 (RE) from 4.89% in 2007-08 (RE). Additionally,that too is grossly inadequate considering the proportion of ST population in total population of the country,i.e. roughly 8%.
Table-9.4.: Total Plan Allocation Earmarked for STs from the Union Budget (in Rs. crore)
2004-05 2005-06 2006-07 2007-08 2008-09RE RE RE RE RE
Total Plan Exp. for STs from UB 2381.98 4175.47 5564.89 7446.97 8771.03
Total Plan Exp. Of Union Govt. 85061 109900 129804 152313 208252(excluding Central Assistance toState & UT Plans)
Proportion of total Plan Allocation 2.80 3.80 4.29 4.89 4.21earmarked for STs (%)
Source: Calculated from Expenditure Budget Vol. I & II (various years).
Therefore, the plan allocations earmarked for SCs and STs in the Union Budget are far below the norms of both SCSPand TSP. In the Union Budget 2008-09, only 17 Ministries/Departments have shown some plan allocation for the SCs/STs. Again, the allocations would also be grossly inadequate for realizing the ambitious targets of the Eleventh FiveYear Plan. Since 2008-09 is the second year of the Eleventh Five Year Plan, the lack of willingness on the part of theCentral Government to seriously pursue the strategies of SCSP and TSP is a matter of serious concern.
As far as the NCMP promises are concerned, except the Scheduled Tribes and Other Traditional Forest Dwellers(Recognition of Forest Rights) Act, 2006, no other major initiatives have been taken by the UPA Government for thefulfillment of NCMP. Even the above mentioned Act is at a very preliminary stage of implementation; yet it has beenreiterated in the Interim Budget 2009-10. A paltry Rs. 100 crore capital has been raised in the Budget 2009-10 for theNational Safai Karamchari Finance and Development Corporation (NSKFDC) for providing loans at concessional rateto the STs or more precisely for the Safai karmacharis'. Besides the pre-Matric scholarship for children of thoseengaged in unclean occupations has been expanded in the Budget 2009-10.

8686

www.cbgaindia.org
HOW DID THE UPA SPEND OUR MONEY?

88
A. Promises made by UPA and its Policy Initiatives
According to Census 2001, religious minority groups constituted around 19 % of the total population in India, whichincludes Muslims (13.4%), Christians (2.3%), Sikhs (1.9 %), Buddhists (0.8%), Jains (0.4%) and others (0.6%).Theanalysis of socio-economic conditions of minority groups reveal a lot of variations in terms of development indicatorsamongst them. In this regard, the socio-economic situation of the Muslim population reflects poorly as compared tothe other religious minority groups. While on the one hand, it is believed that the level of backwardness amongMuslims is due to alienation from modern education (i.e. Science, English and Mathematics) both pre and post-Independence, on the other hand, there has been a continued neglect on part of the Central and State Governmentsto address the problems of minorities, especially with regard to the Muslim community. In this regard, no concretepolicy measures have been taken in the post Independence period to improve the conditions of minorities.
In 2004, the United Progressive Alliance (UPA) government in its National Common Minimum Programme (NCMP)promised to promote modern and technical education among all minority communities. Further, for social andeconomic empowerment of minorities, top priority was to be accorded to education and employment. The UPAgovernment also intended to enact a model comprehensive law to deal with communal violence and encourage theStates to adopt the same to generate faith and confidence in minority communities.
Promises Made in NCMP for Development of Minorities
• Focus on social and economic empowerment of minorities
• Systematic attention to education and employment of minorities
• Enactment of a comprehensive law to deal with communal violence in order to generate faith and confidence inminority communities.
In order to translate the promises made in NCMP into policy action, a High Level Committee was constituted onMarch 9, 2005 under the chairmanship of Justice Rajinder Sachar. The objective was to prepare a comprehensivereport on the social, economic and educational status of the Muslim community due to non-availability of authenticinformation on the same. Such information was needed for concrete policy action. The Sachar Committee submittedits report on November 17, 2006, which was tabled in both Houses of the Parliament on November 30, 2006.
The Sachar Committee recognized at the very outset that Muslims, like other minorities, faced multi-facetedchallenges related to security, identity and equity. The report analyzed the differentials between Muslims and otherSocio Religious Categories (SRCs) in terms of demographic characteristics, level of education, conditions ofemployment, credit flows, participation in public programmes and access to infrastructure. The findings of theCommittee revealed that the Muslim community lags behind in every aspect of socio-economic development.
Minorities
• Creation of a separate Ministry (Ministry of Minority Affairs) in the Union Government was a significant steptaken by the UPA.
• Constitution of Sachar Committee and its subsequent follow-up through the Action Taken Report has also beena step forward.
• Although several development programmes and schemes have been launched, the financial achievementand deliverable outputs of various schemes have been quite poor. Some of these include ScholarshipSchemes, National Minorities Development & Finance Corporation, Multi Sectoral DevelopmentProgramme, Schemes to improve representation of minorities in government service, Coaching andAllied Schemes.
• In the existing schemes, special provisions have been made for minorities. Under Sarva Shiksha Abhiyan (SSA),additional primary and upper primary schools were opened in minority concentrated areas; assistance has beenprovided to targeted Swarozgaris from the minority community under Swarnajayanti Gram Swarozgar Yojana(SGSY); approximately 50% of the targeted construction of houses for minorities below poverty line underIndira Awas Yojana (IAY) has been fulfilled; 49% of the targeted credit disbursement (priority sector lending) tominorities has been accomplished.

www.cbgaindia.org
HOW DID THE UPA SPEND OUR MONEY?
In response to the recommendations made by the Sachar Committee, Ministry of Minority Affairs (MMA) formulatedan Action Taken Report (ATR). With almost a year having elapsed since the presentation of the ATR, the process ofimplementation of ATR has been tardy with important areas of intervention for welfare of Muslims, such as providingemployment and economic opportunities, still not getting due attention of the policy implementing agencies.Besides, low budgetary support to the MMA and poor implementation of the scheme during 2006-07 and 2007-08(Table 10.4 and 10.5) paint a disappointing picture and questions the sincerity of the government towards thewelfare of minorities.
This fact sheet largely focuses on examining the socio-economic condition of minorities in India with special focus onthe Sachar Committee Report and examines the gaps in implementation of the Action Taken Report (ATR). The factsheet has been divided into three sections. Section I highlights the NCMP promises, findings of the Sachar CommitteeReport and new policy initiatives. Section II deals with the budgetary allocations made under different ministriesparticularly by the MMA. Section III focuses on implementation of schemes in terms of outcome/output delivered bythe MMA.
Table 10.1. highlights the various development indicators comparing the Muslim community with the nationalaverage.
Table-10.1.: Key Findings of the Sachar Committee
Variables Muslims (%) National Average (%)
Share in Population (2001) 13.4 -
Share in Total OBC population 15.7 -
Urban Population 36 28
Literacy (2001) 59.1 64.4
Out of School Children 25 -
Graduate 3.6 6.7
Diploma 0.4 0.7
Street Vending 12 4
Worker - Population Ratio 54.9 64.4
IAS 3 -
IPS 1.8 -
IFS 4 -
Poverty (2004-05) 31 22.7
Infant Mortality Rate 59 73
Source: Sachar Committee Report, 2006
Further, an important reason for marginalization of the Muslim community has been the high level of exclusion fromthe mainstream employment sector. Table 2 reveals that the share of Muslims in government jobs is a mere 6.4%. Thesituation is worse in States with a greater share of Muslim population. For example, in West Bengal, Uttar Pradeshand Assam, while the Muslim population is 25.2%, 18.5% and 30.9%, respectively, their representation ingovernment jobs is only 4.7%, 7.5%, and 10.9 %, respectively. Only 4.5% of the railway employees are Muslims, andof these 98.7% occupy lower-level positions. India's elite civil service corps has a miniscule 3.2% of Muslims.

90
Table-10.2.: Muslim Representation in Government Jobs
States Muslims in Total population (in %) Muslim Representation in Govt Jobs (in %)
Assam 30.9 11.2
West Bengal 25.2 4.2
Kerala 24.7 10.4
Uttar Pradesh 18.5 5.4
Bihar 16.5 7.6
Jharkhand 13.8 6.7
Karnataka 12.2 8.5
Delhi 11.7 3.2
Maharashtra 10.6 4.4
Andhra Pradesh 9.2 8.8
Gujarat 9.1 5.4
Tamil Nadu 5.6 3.2
Total 15.4 6.4Source: Sachar Committee Report, 2006
B. Policy Initiatives
Taking into consideration the poor development indicators among the Muslim community, the Sachar Committeesuggested policy measures and made specific recommendations covering four dimensions of development. First,mainstreaming and inclusiveness were to be the cornerstone of the policy framework for the Muslim community.Second, an urgent need was felt to increase the diversity in residential/ work places and educational institutions byincorporating Muslims. Third, the need for more equity-based measures to reduce the sense of discrimination thatthe community perceives. Fourth, availability of detailed information and formation of data bank to facilitate actionand monitoring of schemes and programmes meant for minorities.
Policy Measures for Minorities by UPA Government
• The National Monitoring Committee for Minorities Education (NMCME) was constituted in 2004 to look intoall aspects of education of minorities.
• Ministry of Minority Affairs was created on January 29, 2006 to deal with issues related to Minorities.
• A High Level Committee was constituted on March 9, 2005 under the chairmanship of Justice Rajinder Sacharto prepare a comprehensive report on the social, economic and educational status of the Muslim community
• The Sachar Committee submitted its report on November 17, 2006
• The details of follow-up of ATRs on the recommendation of Sachar Commiitee were presented in both housesof Parliament on August 31, 2007
• The follow-up of ATR has initiated many new schemes such as scholarship and coaching schemes, MultiSectoral Development scheme for overall development of minorities and focus on research and developmentof minorities.
• A new scheme for leadership development of minority women was launched by Ministry of Women and ChildDevelopment (MWCD) in 2008-09
• Proposal to earmark 15% of the country's budget for religious minorities under Prime Minister's15-point Programme
While reviewing the performance of UPA government regarding initiatives taken for development of minorities duringits tenure, we need to focus on the ATR and status of its implementation based on recommendation of SacharCommittee Report. On the basis of ATR, MME devised new schemes for all-round development of minorities.
Minorities

www.cbgaindia.org
HOW DID THE UPA SPEND OUR MONEY?
ATR of the Union Government
Special Development initiatives
o Targeted intervention in 90 minority concen-trated districts
o Improvement in civic amenities and eco-nomic opportunities in 338 towns.
Access to Credit
o Opening more branches of Banks in minorityconcentrated districts
o Priority sector lending to minorities
Access to Education
o Promotion of girls education
o Provision for girl's hostels
o Provision for scholarship for students
o Dissemination of information regardingschemes
o Madarsa Modernization Programme
o Recognition of Madrasa certificate toUniversities
Skill Development
o Promotion of skill development Initiative
Promotion of Social Inclusion
o Equal opportunity commission
o Diversity index in areas of education,housing and employment
o Compilation of national data bank
Status of Implementation
Special Development initiatives
o Multi Sectoral Development Scheme has beenlaunched.
o Inter- ministerial task force set up to look into thematter.
Access to Credit
o 496 branches opened in 2007-08
o RBI revised Master Circular to lend minorities from9% to 15% over the next three years
Access to Education
o 270 KGBVs sanctioned in blocks with more than20% minority population
o No concrete action has been taken
o Many schemes have been launched
o A scheme has been started in this regard.
o Scheme is being revised to make it more attractive
o UGC asked to work out modalities
Skill Development
o Inter-ministerial group formed
Promotion of Social Inclusion
o Report has been submitted
o Report has been submitted
o Desk has been created in the Ministry of Statistics
o A cell was constituted in the Planning Commission
Status of Implementation of Action Taken Report (ATR)
Source: Ministry of Minority Affairs, GoI
C. Public Spending during 2004-05 to 2008-09
There are three Ministries /Departments under the Union Government, namely Ministry of Minority Affairs (MME),Ministry of Women and Child Development (MWCD) and Department of Higher Education which allocate funds forschemes specifically meant for minorities. The schemes include Area Intensive and Madrasa Modernization Scheme,National Council for Promotion of Urdu Language, National Monitoring Committee for Minorities Education(Department of Higher Education), and Scheme for Leadership Development of Minority Women (MWCD). It can beseen in Table 10.3 that there has been a significant increase in Revised Estimates (RE) over the years. There are alsomany schemes being run by MMA which can be seen in Table 10.4. The following table shows the amount ofallocation made by different ministries.

92
Table-10.3.: Union Budget Outlays under Different Ministries Earmarked for Minorties (in Rs. crore)
Ministries/Department 2004-05 2005-06 2006-07 2007-08 2008-09 2009-10(RE) (RE) (RE) (RE) (RE) (BE)
Ministry of Minority Affairs - - 143.52 362.83 664.38 1016.5
Schemes for Minorities under 31.5 36 60.6 61.15 79.18 67.6Ministry of HumanResource Development
Schemes for Minorities under - - - - 4.5 4.5Ministry of Women DevelopmentChild Development
Total 31.5 36 204.12 423.98 784.06 1088.6
Source: Expenditure Budget, Vol-II, Union Budget document for various years
The Ministry of Minority Affairs had initiated a few schemes with scant budgetary allocation in 2006-07. Table 10.4shows that there has been an increase in budgetary allocation for the schemes related to welfare of minorities (sincethe formation of the Ministry in 2006). Given the extent of backwardness of the Muslim minority community, greaterbudgetary allocation is required. Most of the schemes run by the Ministry are based on the distribution of scholar-ships to students at different levels. A special scheme called Multi-Sectoral Development has been initiated for overalldevelopment of the community. The scheme is being operated in 90 minority-dominated districts. Considering thecoverage and level of backwardness of minority concentrated districts, this scheme needs more budgetary allocation.
Table-10.4: Union Budget Outlays under Ministry of Minority Affairs (in Rs. crore)
S.No Schemes 2006-07 2007-08 2008-09 2009-10(RE) (RE) (RE) (BE)
1 Secretariat 3.87 4.46 6.08 7.74
2 Grants-in -Aid to Maulana Azad EducationalFoundation(MAEF) 100 50 60 65
3 Free coaching and allied Scheme for Minorities 1.6 9 7.75 9
4 Research /Studies , Monitoring &Evaluation of 1 10.99 8.45 8.10development for Minorities including Publicity
5 Merit-cum -Means Scholarship for professional courses 10 48.6 58.44 72
6 Pre-Matric Scholarship for Minorities 9 71.90 83.70
7 Post-Matric Scholarship for Minorities 54 62.93 76.50
8 Multi Sectoral Development Programme for 66.97 251.89 517.45Minority concentrated districts
9 National Fellowship for Students from the - - - 4.50minority communities
10 Grants-in Aids to State channelising agencies 9 1.80 0.90engaged in implementation of National MinoritiesDevelopment & Finance Corporation (NMDFC)
11 Special Officer for Linguistic Minorities 1.04 1.23 1.74 1.98
12 National Commission for Religious and 1.99 0.16 - -Linguistic Minorities
13 National Commission for Minorities (NCM) 3.67 3.63 4.55 5.28
14 Scheme for Leadership Development of Minority - - - 0.45Women
15 Grants-in-aid to Wakf 2.06 2.9 2.35 2
16 Computerisation of records of State Wakf Boards - - - .90
17 Investment in Public Enterprises 16.47 63 67.50 67.50
18 Grants in Aid to North East 1.82 29.44 59 93.50
Grand Total 143.52 362.83 664.38 1016.5
Source: Expenditure Budget, Vol-II, Union Budget various years
Minorities

www.cbgaindia.org
HOW DID THE UPA SPEND OUR MONEY?
D.Outputs/Services delivered by Govt. Interventions and Development Outcomes
During 2006-07, following the recommendations of Prime Minister's 15-Point Programme, various ministries likeHuman Resource Development, Labour and Employment, Housing and Urban Poverty Alleviation, RuralDevelopment, and Women and Child Development made separate allocations for minorities in their ongoing schemes.But the implementation and outcome of various schemes are found to be very weak. A review of employment carriedout by Central Government has found that minority community members constitute a mere 5% of the total directrecruitment made by different ministries during 2007.
For 2006-07, the MMA in its outcome budget has shown that programmes like MAEF and NMDFC programme haveachieved 100% target, 47,783 people have benefited under NMDFC. Under the free coaching and allied scheme, thefinancial achievement was merely 26%, while 690 candidates benefited from the scheme. The outcome achievementfor 2007-08 can be seen in the table given below.
Table-10.5.: Performance of Selected Schemes during 2007-08 (from 01.04.2007 to 15.02.2008)
(in Rs. crore)
S.N Schemes/Programmes Financial Targets Financial Achievement Output/Outcome delivered
1 Grants-in -Aid to Maulana 50.00 50.00 No physical targets wereAzad Educational Foundation fixed(MAEF)
2 Free Coaching and Allied Scheme 10.00 2.00 620 candidatesfor Minorities benefited
3 Research /Studies , Monitoring 6.00 It was revised to 11.59&Evaluation of Development for crore for multi mediaMinorities Including Publicity campaign on social
inclusion
4 Merit-cum -Means Scholarship 54.00 12.05 Scholarships sanctioned tofor professional courses 4895 student
5 Pre-Matric Scholaship for Minirities 80.00 - Was not able to deliveroutput due to lateapproval of the scheme
6 Post-Matric Scholarship for Minirities 100.00 Was not able to deliveroutput due to lateapproval of the scheme
7 Multi Sectoral Development 120.00 - Financial target was revisedProgramme for Minority to 74.41crore, programmeconcentrated districts is waiting for approval
8 National Minorities Development 70.00 47.14Finance Corporation ,equitycontribution
Source: Ministry of Minority Affairs, Outcome Budget, 2008-09
In the light of NCMP promises made in 2004, it is clear from our assessment that the UPA government has takenmany policy initiatives for betterment of minorities such as creation of a separate ministry, constitution of SacharCommittee and launching of various development schemes. But the outcome budget for the year 2006-07 and2007-08 reveals that the financial achievement and deliverable outputs of various schemes implemented by MMAhas been extremely poor.

94
E. What does the Interim Budget 2009-10 have to offer?
• There is a marginal increase in the total budgetary allocation for the Ministry of Minorities Affairs in InterimBudget 2009-10, which is around Rs. 3 crore.
• The revised estimates for 2008-09 show a disappointing picture in terms of reduced spending under variousschemes implemented by the Ministry.
• The allocation under the scheme Multi Sectoral Development for addressing the development deficit in minorityconcentrated districts has increased from Rs.485.80 crore in 2008-09 to Rs.517.45 crore in 2009-10.
• In 2009-10, the Ministry of Minorities Affairs introduced three schemes namely National Fellowship for Studentsfrom the minority communities, Scheme for LeadershipDevelopment of Minority Women and Computerisation ofrecords of State Wakf Boards.
Minorities
94

www.cbgaindia.org
HOW DID THE UPA SPEND OUR MONEY?
96
A. Fiscal Policy Space during the UPA Government's Tenure
The UPA Government has often cited the impressive rate of economic growth during 2004-05 to 2007-08 as one ofthe major achievements of their tenure at the centre, although very few observers would doubt that this growth hasnot been 'inclusive'. In order to address the disadvantages confronting a majority of the country's population, theGovernment was expected to adopt a progressive fiscal policy and expand the scope of its interventions towardssocio-economic development through its budgets. However, figures for the last five years indicate that this Govern-ment ignored the need for a progressive fiscal policy for almost the whole of its five year tenure except for the lastyear, i.e. fiscal year 2008-09, which witnessed the impact of the global economic recession on Indian economy.
Table 11.1, given below, depicts the magnitude of Total Public Expenditure in India, which as a proportion of thecountry's Gross Domestic Product (GDP) has hovered around 27 % over the last decade. An international comparisonof total public expenditure across different countries for various years between 1997 and 2002, as presented in Figure11.1 below, reveals that the magnitude of Total Public Expenditure in India has been significantly lower than that inseveral developed countries as well as some of the developing countries. Hence, the overall fiscal policy space in Indiafor public investment towards socio-economic development of the country appears to have been limited in compari-son to several other countries. Therefore, in order to expand the fiscal policy space for public investments, themagnitude of Total Public Expenditure in India needed to be stepped up. However, we do not find any trend increasein this magnitude over the first four years of the UPA regime, i.e. from 2004-05 to 2007-08.
Resource Mobilisation & Fiscal Federalism
• Fiscal conservatism of the UPA Government has resulted in the magnitude of Total Public Expenditure in Indiabeing stagnant at around 27% of the GDP during the years from 2004-05 to 2007-08.
• In order to expand the overall fiscal policy space available to government for making public investments towardssocio-economic development, the magnitude of Total Public Expenditure from the Union Budget and StateBudgets needed to be stepped up significantly, which would have required the policymakers to adopt a liberalfiscal policy much before the onset of the economic recession in 2008-09.
• The magnitude of Total Tax Revenue in India has increased from 15 % of the GDP in 2003-04 to 18.14% of theGDP in 2007-08 (BE). However, even at the present level, the magnitude of Total Tax Revenue in India falls farshort of the levels of tax revenue collected in several other countries, and it is still inadequate from the point ofview of the magnitude of public investment needed in the country.
• The UPA Government should have stepped up significantly the revenue collections from direct taxes throughimposition of Capital Gains Tax, higher rates of Wealth Tax, and higher rates of taxes on speculative gains madein the stock markets, which were largely ignored by the government.
• The UPA Government should have taken strong measures to curb the magnitude of tax revenue foregone dueto tax exemptions, thereby, increasing the volume of tax collections significantly. Retaining only the progressiveelements in such tax exemptions, the government should have done away with many of the exemptions givento the affluent sections of the population, such as the exemptions given to the private corporate sector andthose in the indirect taxes on commodities that are consumed mainly by the richer sections of the population.
• The UPA Government has not taken any concrete measure towards providing greater fiscal space to the StateGovernments. Despite strong demands from the States, the Eleventh Five Year Plan has not shifted any signifi-cant number of Central Schemes to the States. On the other hand, the imposition of FRBM legislation on theStates through recommendations of the Twelfth Finance Commission relating to the Debt Relief Scheme hasconstrained significantly the fiscal space available to the State Governments for public investments. Thus, theUPA Government has continued the trend of growing centralisation of the federal fiscal architecture in thecountry which has been witnessed over the last one and half decades.

www.cbgaindia.org
HOW DID THE UPA SPEND OUR MONEY?
Table-11.1: Magnitude of Public Expenditure in India
Year GDP at Total Public Total Public Central Centralmarket prices Expenditure in Expenditure Government’s Government’s
(at current India1 at % of GDP Total Totalprices (in Rs. Crore) Expenditure2 Expenditure
(in Rs. Crore) (in Rs. Crore) as % of GDP
1999-2000 1952035 517056.1 26.5 307509.1 15.8
2000-01 2102314 552124.5 26.3 328264.7 15.6
2001-02 2278952 613591.0 26.9 360616.3 15.8
2002-03 2454561 661663.9 27.0 398878.9 16.3
2003-04 2754621 762764.7 27.7 426131.6 15.5
2004-05 3149412 824479.8 26.2 463830.9 14.7
2005-06 3580344 933641.8 26.1 501083.3 14.0
2006-07 (RE) 4145810 1123912.3 27.1 578605.9 14.0
2007-08 (BE) 4713148 1285593.1 27.3 683347.9 14.5
2007-08 4723400 - - 712732 15.1
2008-09 (RE) 5426277 - - 900953 16.6
2009-10 (BE) 6021426 - - 953231 15.8
Note: 1 This figure presents the Combined (Centre + States) Expenditure, incurred from the Union Budget and Budgets of all States and UTs (atcurrent prices). 2 This figure presents the Total Expenditure incurred from the Union Budget (at current prices).
Source: (i) Indian Public Finance Statistics 2007-08, Min. of Finance, GoI, 2008. (ii) Economic Survey 2007-08, Min. of Finance, GoI, 2008.
GDP for 2007-08, 2008-09 and 2009-10 are taken from Medium Term Fiscal Policy statement, 2009-10
Figure-11.1: Magnitude of Total Public Expenditure across Different Countries
Total Government Expenditure as a proportion of GDP
16.3
20.4
20.7
21.2
22.1
26.5
29.6
32.7
33.8
37.8
39.2
39.8
42.1
42.3
48.3
48.6
52.6
52.8
53.7
54.2
0 10 20 30 40 50 60
Pakistan
China, P.R.: Mainland
Mexico
Indonesia
Thailand
India
Argentina
U.S.
South Africa
Australia
U.K.
Brazil
Canada
Turkey
Germany
Belgium
Austria
France
Denmark
Sweden
(For various years between 1997 to 2002)
Total Expenditure as % of GDP
Source: Based on the data provided in Lorie, H. (2003), "Priorities for Further Fiscal Reforms in the Commonwealth of Independent States", IMFWorking Paper, International Monetary Fund.
We find that the Total Expenditure from the Union Budget stagnated between 14 % to 15 % of the GDP during2004-05 to 2007-08, before it shot up to 16.6 % of the GDP in the current financial year (i.e. 2008-09). The lack ofexpansion in the magnitude of Total Expenditure from the Union Budget for the large chunk of the UPA Government'stenure indicates the nature of the fiscal policy followed by it over the last five years.
In fact, the fiscal policies adopted by the successive governments at the Centre over the last one and a half decadeshave been marked by 'fiscal conservatism', which advocated strongly for reducing the magnitude of deficits in the

98
government's budget so that the size of public debt is kept under check. The implications of government borrowingfor the Indian economy, which according to several economists had been demand-constrained over the last decade,and the question of sustainability of public debt in India have been intensely debated among economists followingdifferent schools of thought. However, the policymakers at the Centre almost consistently adhered to fiscal conservatism,which also resulted in a misleading impression of a consensus being there in the domain of fiscal policy for thecountry.
Even if we don't question the economic rationale for the government's efforts to reduce the size of the public debt,the means through which it was achieved does raise serious concerns. As we shall discuss in the next section, India'sperformance in stepping up the magnitude of public revenue collected through taxes had been unsatisfactory until2004-05. In fact, the total tax-GDP ratio for the country had declined from the level of 16 % in 1989-90 to 13.8 % by2001-02. Thus, in an era marked by declining magnitude of tax revenue (as a proportion of the GDP), the policyefforts towards curbing the magnitude of public debt implied a check on the magnitude of Total Public Expenditurein the country.
In the last four fiscal years, even when the collection of tax revenue under the Central Government tax systemincreased significantly (from 9.7 % of the GDP in 2004-05 to 12.6 % of the GDP in 2007-08), there had been noexpansion in the magnitude of Total Expenditure from the Union Budget (as compared to the GDP). This was mainlybecause during 2003-2004, the fiscal conservatism of the policymakers at the Centre was given legal teeth throughthe enactment of a Fiscal Responsibility and Budget Management (FRBM) Act, which was notified by the UPAGovernment in 2004. The FRBM Act made it legally binding for the Centre to eliminate the Revenue Deficit (in theUnion Budget) and reduce the Fiscal Deficit (in the Union Budget) to less than 3 % of GDP by 2009-10. As a result,even when the tax-GDP ratio for the Centre grew visibly over the last few fiscal years, the magnitude of TotalExpenditure from the Union Budget (as compared to the GDP) was kept stagnant so that the Deficits in the UnionBudget could be reduced in accordance to the targets set under the FRBM Act.
Table-11.2: Deficits of the Central Government as % of GDP
Year Revenue Deficit as % of GDP Fiscal Deficit as % of GDP
2001-02 4.40 6.19
2002-03 4.40 5.91
2003-04 3.57 4.48
2004-05 2.49 3.98
2005-06 2.58 4.09
2006-07 1.94 3.44
2007-08 1.11 2.69
2008-09 BE 1.02 2.46
2008-09 RE 4.45 6.02
2009-10 BE 3.96 5.53
Note: GDP at Market Price figures (Base 1999-2000; At current prices) are taken from CSO; and GDP for 2007-08, 2008-09 and 2009-10 aretaken from Medium Term Fiscal Policy statement, 2009-10.
Source: Budget at a Glance, Government of India, various years.
As can be seen from Table 11.2 above, the Revenue Deficit (in the Union Budget) had been brought down from 3.6% of the GDP in 2003-04 to 1.1 % of the GDP in 2007-08, while the Fiscal Deficit (in the Union Budget) had beenreduced from 4.5 % of the GDP in 2003-04 to 2.7 % of the GDP in 2007-08. During these four years, manyprogressive economists and policy analysts had advocated strongly for scrapping the FRBM Act since it constrainedthe fiscal policy space available to the government and prevented it from adopting a progressive fiscal policy. Moreover,many economists had opined that the targets for deficit reduction set under the FRBM Act were arbitrary and did notfollow any strong economic logic. However, the UPA Government hardly paid any heed to such criticisms until theglobal economic recession struck Indian economy in 2008-09. In the wake of the ongoing economic recession, thegovernment decided to completely ignore the FRBM Act and resorted to a visible expansion in public spending fromthe Union Budget, financed by borrowing. In 2008-09 (RE), the Revenue Deficit has shot up to 4.45 % of the GDP,while the Fiscal Deficit has jumped to 6 % of the GDP. These developments clearly imply the arbitrariness of the targetsfor deficit reduction set under the FRBM Act and the fallacy of the arguments underlying fiscal conservatism in theIndian context.
Resource Mobilisation & Fiscal Federalism

www.cbgaindia.org
HOW DID THE UPA SPEND OUR MONEY?
However, in this context, it is rather disturbing to note that besides reducing the magnitude of Total Expenditure fromthe Union Budget (as compared to the GDP), the successive governments at the Centre had also advocated stronglyfor a check on the public spending by States over the last decade. It has been pointed out that starting with the TenthFinance Commission (whose recommendations were applicable for five years from 1995-96 to 1999-2000), both theTerms of Reference for the successive Finance Commissions as well as their recommendations have indicated a biastowards promoting the conservative fiscal policy of the Centre and contributed towards the growing dominance ofCentre in the federal fiscal architecture in India. We must note here that a Debt Relief Package for States recommendedby the Twelfth Finance Commission (in 2004 for the five years from 2005-06 to 2009-10) made it mandatory forStates to enact FRBM legislations from 2005-06 (in order to be eligible for the said package) and reduce deficits intheir State Budgets progressively. Except for West Bengal, almost all other States have enacted FRBM legislations bynow, and thus made it legally binding for themselves to eliminate their Revenue Deficits and keep their Fiscal Deficitsat less than 3 % of the Gross State Domestic Product (GSDP) by 2009. Even those economists who advocate stronglyfor government's efforts to reduce the size of the public debt have questioned the arbitrariness in the targets setunder the Central and State FRBM Acts. More importantly, serious concerns have been raised about the nature of'fiscal correction' achieved by some of the States in the post-FRBM era, since such reductions in deficits have beenachieved at the cost of compression of capital outlay and social sector spending from the State Budgets. A crisis in thefiscal health of the States in the late 1990s and early years of the present decade had left most of the States with littlescope to expand the magnitude of total expenditure from the State Budgets until 2004-05. However, even after therecovery in their fiscal health from 2005-06 onwards, the States have found it difficult to expand the overall size oftheir State Budgets given the mandatory requirements for reduction of deficits as per their FRBM Acts.
Thus, we observe that the fiscal conservatism of the UPA Government had resulted in the magnitude of Total PublicExpenditure in India being stagnant at around 27 % of the GDP during the years from 2004-05 to 2007-08. In orderto expand the overall fiscal policy space available to government for making public investments towards socio-economic development in the country, the magnitude of Total Public Expenditure from the Union Budget and StateBudgets needed to be stepped up significantly, which would have required the policymakers to adopt a liberal fiscalpolicy much before the onset of the economic recession in 2008-09.
B. Resource Mobilisation during the Last Five Years
In case of India, the overall fiscal policy space for making public investments towards socio-economic developmentdepends, in the long run, on the magnitude of tax revenue collected by the government, while, in the short run, italso depends on the policy adopted towards borrowing by the government. Hence, it would be pertinent to discussthe magnitude of tax revenue mobilized in the country during the tenure of the UPA Government. Table 11.3, givenbelow, presents an international comparison of the total magnitude of tax revenue collected in different countries in2004. It reveals that the total magnitude of tax revenue collected in India has been significantly lower than that inseveral developed countries as well as some of the developing countries. Thus, the overall public resources availableto the government in India for making investments towards socio-economic development appears to have beeninadequate in comparison to several other countries.
Table-11.3: International Comparison of Tax-GDP Ratio
Total Tax Revenue as a proportion of GDP in 2004
Countries Gross Tax Revenue as % of GDP
Sweden 50.7
Denmark 49.6
Belgium 45.6
Netherlands 39.3
Spain 35.2
U.S. 25.4
S. Korea 24.6
Mexico 18.5
India * 16.0
Note: *2004-05 BE (Total tax revenue for the country)
Source: Srinivasan, G. (2005), "Low tax-GDP ratio daunts India's quest to join developed world", Business Line, New Delhi, Oct. 13
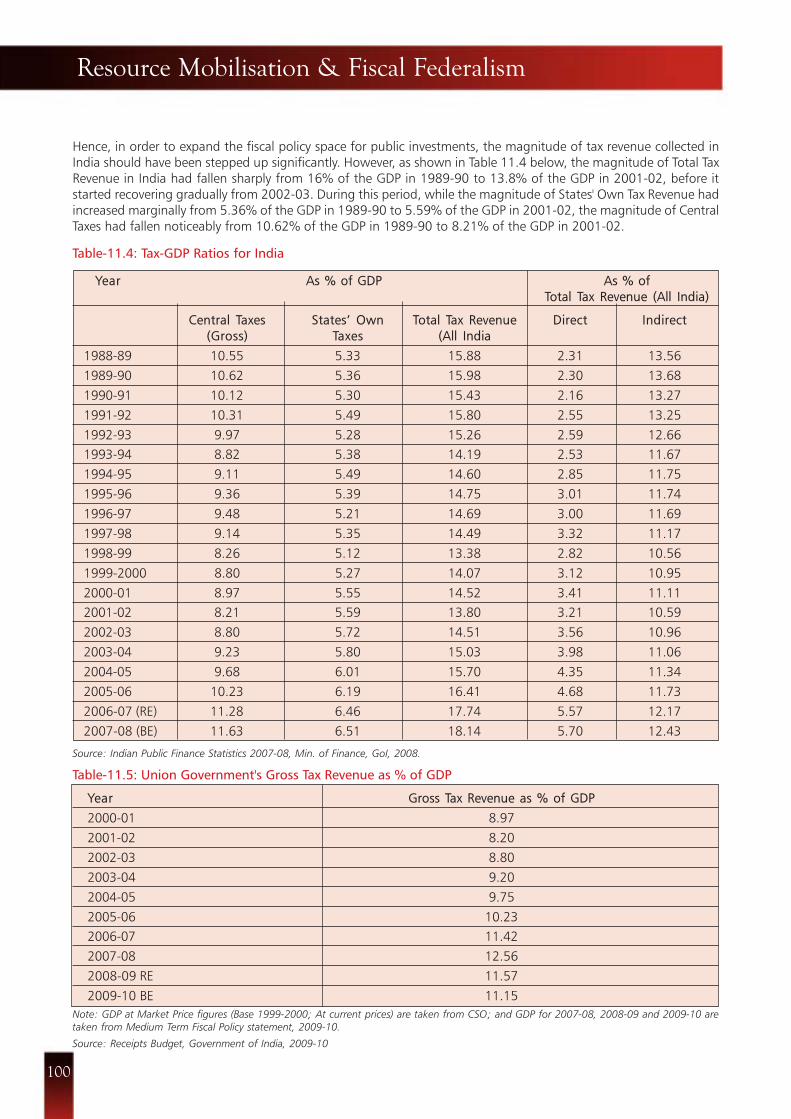
100
Hence, in order to expand the fiscal policy space for public investments, the magnitude of tax revenue collected inIndia should have been stepped up significantly. However, as shown in Table 11.4 below, the magnitude of Total TaxRevenue in India had fallen sharply from 16% of the GDP in 1989-90 to 13.8% of the GDP in 2001-02, before itstarted recovering gradually from 2002-03. During this period, while the magnitude of States' Own Tax Revenue hadincreased marginally from 5.36% of the GDP in 1989-90 to 5.59% of the GDP in 2001-02, the magnitude of CentralTaxes had fallen noticeably from 10.62% of the GDP in 1989-90 to 8.21% of the GDP in 2001-02.
Table-11.4: Tax-GDP Ratios for India
Year As % of GDP As % ofTotal Tax Revenue (All India)
Central Taxes States’ Own Total Tax Revenue Direct Indirect(Gross) Taxes (All India
1988-89 10.55 5.33 15.88 2.31 13.56
1989-90 10.62 5.36 15.98 2.30 13.68
1990-91 10.12 5.30 15.43 2.16 13.27
1991-92 10.31 5.49 15.80 2.55 13.25
1992-93 9.97 5.28 15.26 2.59 12.66
1993-94 8.82 5.38 14.19 2.53 11.67
1994-95 9.11 5.49 14.60 2.85 11.75
1995-96 9.36 5.39 14.75 3.01 11.74
1996-97 9.48 5.21 14.69 3.00 11.69
1997-98 9.14 5.35 14.49 3.32 11.17
1998-99 8.26 5.12 13.38 2.82 10.56
1999-2000 8.80 5.27 14.07 3.12 10.95
2000-01 8.97 5.55 14.52 3.41 11.11
2001-02 8.21 5.59 13.80 3.21 10.59
2002-03 8.80 5.72 14.51 3.56 10.96
2003-04 9.23 5.80 15.03 3.98 11.06
2004-05 9.68 6.01 15.70 4.35 11.34
2005-06 10.23 6.19 16.41 4.68 11.73
2006-07 (RE) 11.28 6.46 17.74 5.57 12.17
2007-08 (BE) 11.63 6.51 18.14 5.70 12.43
Source: Indian Public Finance Statistics 2007-08, Min. of Finance, GoI, 2008.
Table-11.5: Union Government's Gross Tax Revenue as % of GDP
Year Gross Tax Revenue as % of GDP
2000-01 8.97
2001-02 8.20
2002-03 8.80
2003-04 9.20
2004-05 9.75
2005-06 10.23
2006-07 11.42
2007-08 12.56
2008-09 RE 11.57
2009-10 BE 11.15
Note: GDP at Market Price figures (Base 1999-2000; At current prices) are taken from CSO; and GDP for 2007-08, 2008-09 and 2009-10 aretaken from Medium Term Fiscal Policy statement, 2009-10.
Source: Receipts Budget, Government of India, 2009-10
Resource Mobilisation & Fiscal Federalism

www.cbgaindia.org
HOW DID THE UPA SPEND OUR MONEY?
It may be worthwhile to note here that the decline in the magnitude of Central Taxes over the 1990s was rootedin some of the major policies taken by the Central Government in the era of economic liberalization. The reductionsof customs duties under the policy of trade liberalization and the subsequent reductions of excise duties (so thatdomestic producers in India get the same advantage as those of other countries from which India imported commodities)led to a significant decline in the magnitude of indirect taxes, which had fallen from 13.7% of the GDP in 1989-90to 10.6% of the GDP in 2001-02. The collections from direct taxes increased from 2.3% of the GDP in 1989-90to only 3.2% of the GDP in 2001-02, which was mainly because of the inability of the Central Government to increasecollections from direct taxes significantly in an era of rationalization (i.e. reduction) of direct tax rates. As a result,the tax-GDP ratio for the country registered a sharp decline during 1990s and in the early years of the presentdecade.
During 2003-04 to 2007-08, the collections from direct taxes have improved from 4% of the GDP to 5.7% of the GDP,one of the major factors underlying which could have been the improvement in tax administration in the country inthe era of impressive economic growth. Likewise, the collections from indirect taxes have gone up from 11% of theGDP in 2002-03 to 12.43% of the GDP in 2007-08 (BE), and the increase in collections from Service Tax is believed tohave contributed significantly in this regard. As a result of these improvements, the magnitude of Total Tax Revenuein India has increased from 15% of the GDP in 2003-04 to 18.14% of the GDP in 2007-08 (BE). However, even at thepresent level, the magnitude of Total Tax Revenue in India falls far short of the levels of tax revenue collected in severalother countries, and it is still inadequate from the point of view of the magnitude of public investment needed in thecountry.
Table 11.6: Revenue from Major Taxes as % of GDP
Year Corporation Taxes on Income Customs Uniontax other than Excise Duty
Corporation Tax
As Percent of GDP at MP
2000-01 1.70 1.51 2.26 3.26
2001-02 1.61 1.40 1.77 3.18
2002-03 1.88 1.50 1.83 3.35
2003-04 2.31 1.50 1.77 3.30
2004-05 2.63 1.56 1.83 3.15
2005-06 2.83 1.56 1.82 3.11
2006-07 3.48 1.81 2.08 2.84
2007-08 4.08 2.17 2.20 2.62
2008-09 RE 4.09 2.26 1.99 2.00
2009-10 BE 4.06 2.25 1.83 1.84
Note: GDP at Market Price figures (Base 1999-2000; At current prices) are taken from CSO; and GDP for 2007-08, 2008-09 and 2009-10 aretaken from Medium Term Fiscal Policy statement, 2009-10.
Source: Receipts Budget, Government of India, 2009-10
Moreover, it has been pointed out in the context of the increase in the magnitude of direct tax revenue that, over thelast decade, the share of the private corporate sector's surplus has increased very fast and hence the governmentshould have collected much greater magnitudes of tax revenue through corporate and personal income taxes. Likewise,the revenue collected through service tax too should have been much higher than what the government managed tocollect. As regards the composition of the tax revenue in 2007-08 (BE), we find that direct taxes contributed only5.7% of the GDP, while indirect taxes contributed 12.43% of the GDP which is more than two-third of the Total TaxRevenue in India. This clearly implies that the tax system prevailing in the country still lacks progressivity. In thiscontext, it can be argued that the UPA Government should have stepped up significantly the revenue collections fromdirect taxes through imposition of Capital Gains Tax, higher rates of Wealth Tax, and higher rates of taxes on speculativegains made in the stock markets, which were largely ignored by the government.

102
Table-11.7: Tax Revenue Foregone in the Central Government Tax System due to Tax Exemptions/Incentives/Deductions
Items Revenue Revenue Foregone Revenue Revenue Foregoneforegone in as % of aggregate foregone in as % of aggregate
2006-07 tax collection in 2006-07 tax collection in(in Rs. Crore) 2006-07 (in Rs. Crore) 2006-07
Corporate Income Tax 45034 9.56 58665 10.09
Personal Income-tax 32143 6.82 42161 7.25
Excise Duty 75475 16.02 87992 15.14
Customs Duty 137105 29.11 148252 22.51
Total 289757 61.51 337060 58.00
Less (Related to Export Credit) 50045 10.62 58416 10.05
Grand Total 239712 50.89 278644 47.94
Note:
• As per the Receipts Budget in Union Budget, " the estimates and projections are intended to indicate the potential revenue gain that would berealized by removing exemptions, deductions, weighted deductions and affected by removal of such measures….. (Also) the cost of each taxconcession is determined separately, assuming that all other tax provisions remain unchanged".
• Aggregate Tax Collection refers to the aggregate of net direct and indirect tax collected by the Central Government.
• The figure of Aggregate Tax Collection for 2006-07 is based on Actuals while that for 2007-08 is based on Revised Estimates.
Source: Receipts Budget 2008-09, Union Budget 2008-09, Government of India.
We must also note here that the numerous tax exemptions given under the Central Government tax system cost asubstantial magnitude of tax revenue. As shown in Table 11.7 above, the magnitude of tax revenue foregone due totax exemptions/ incentives/ deductions under the Central Government tax system was estimated to be worth 51% ofthe total tax collections in 2006-07 and worth 48 % of the total tax collections in 2007-08. Hence, the UPA Governmentshould have taken strong measures to curb the magnitude of tax revenue foregone due to such exemptions andincreased the volume of tax collections significantly. Retaining only the progressive elements in such tax exemptions,the government should have done away with many of the exemptions given to the affluent sections of the population,such as the exemptions given to the private corporate sector and those in the indirect taxes on commodities that areconsumed mainly by the richer sections of the population.
We may also note here that due to the ongoing economic recession and the tax relief given by the government toinduce an expansion in the economic activities in the country, the tax revenue of the Union Government has fallensharply from 12. 6% of the GDP in 2007-08 to 11.6% of the GDP in 2008-09 (RE), which is estimated to fall furtherto 11.15% of the GDP in 2009-10 (BE).
C. Issues in Fiscal Federalism
Over the last one and a half decades, the fiscal policy space available to the States has shrunk vis-à-vis that availableto the Centre. In the previous section, we discussed the decline in the tax-GDP ratio for the country in the posteconomic liberalization era in the 1990s. As shown in Table 11.4, the total tax revenue collected in India had fallenfrom 16% of the GDP in 1989-90 to 13.8% of the GDP in 2001-02, before it started recovering gradually from2002-03. The magnitude of tax revenue collected under the central government tax system had fallen from 10.6% ofthe GDP in 1989-90 to 8.2% of the GDP in 2001-02. In the wake of the resource crunch faced by the Centre (whichwas a consequence of some of the liberalization policies adopted by the Centre), the magnitude of financial resourcestransferred from Centre to States had been compressed.
Resource Mobilisation & Fiscal Federalism

www.cbgaindia.org
HOW DID THE UPA SPEND OUR MONEY?
Table-11.8: Gross Devolution and Transfers from Centre to States
Year Gross Devolution and Transfers GDT GDT as % of(GDT) from Centre to States1 as % of GDP Aggretate Disbursements of State
(in Rs. Crore)
1988-89 30333 7.2 45.2
1989-90 32862 6.8 42.8
1990-91 40859 7.2 44.9
1998-99 102268 5.9 39.1
1999-2000 95652 4.9 31.1
2000-01 106730 5.1 31.4
2001-02 119213 5.2 32.3
2002-03 128,657 5.2 31.4
2003-04 143,785 5.2 28.0
2004-05 160,750 5.1 29.0
2005-06 178,871 5.0 31.8
2006-07 220462 4.7 33.5
2007-08 (RE) 284063 5.2 36.1
2008-09 (BE) 331525 5.5 37.1
Note: Gross Devolution and Transfers (GDT) include: (i) States' Share in Central taxes, (ii) Grants from the Centre, and (iii) Gross Loans from theCentre.
Source: Reserve Bank of India (2007), State Finances: A Study of Budget 2007-08.
As shown in Table 11.8 above, the magnitude of gross devolution and transfers (GDT) from the Centre to States(which include: States' Share in Central taxes, Grants from the Centre, and Gross Loans from the Centre) had fallenfrom 7.2% of the GDP in 1990-91 to 4.9% of the GDP in 1999-2000, and it hovered around 5.1% of the GDP during2000-01 to 2004-05. As a proportion of Total Expenditure from the Budgets of all States, the magnitude of grossdevolution and transfers (GDT) from the Centre to States had fallen sharply from 45% in 1990-91 to 29% in 2004-05.
We find that the magnitude of gross devolution and transfers (GDT) from Centre to States shows a gradual improvementduring the tenure of the UPA Government, since it has improved from 29% of the Aggregate Disbursements of States(5.1% of the GDP) in 2004-05 to 37% of the Aggregate Disbursements of States (5.5% of the GDP) in 2008-09 (BE).However, we must note here that this magnitude is still far short of the level prevailing in the late 1980s when theGDT from Centre to States accounted for around 45% of the Aggregate Disbursements of States (around 7% of theGDP).
The decline in transfer of resources from Centre to States, especially during the second half of 1990s and early yearsof the present decade, had affected the fiscal health of the States adversely. Moreover, a rise in the administeredinterest rates in the country under the policies for financial sector liberalization meant that the interest paymentburden of the States rose sharply during the second half of 1990s and early years of the present decade. In additionto that a huge increase in States' outlay on salaries for government staff in the late 1990s (following the implementationof Fifth Pay Commission recommendations) meant a further blow to the worsening fiscal health of the States. As aresult of all these factors, most States confronted a crisis in their fiscal health during late 1990s and in the early yearsof this decade.
The dominance of the Central Government in the overall fiscal policy space in the country increased during thisperiod, when most of the States were confronting a severe crisis in their fiscal health. The situation has startedimproving since 2006-07. However, the overall fiscal policy space in India still continues to be dominated heavily bythe Centre. As has already been mentioned, starting with the Tenth Finance Commission (whose recommendationswere applicable for five years from 1995-96 to 1999-2000), both the Terms of Reference for the successive FinanceCommissions as well as their recommendations have indicated a bias towards promoting the conservative fiscal policyof the Centre and contributed towards the growing dominance of Centre in the federal fiscal architecture in India.We must note here that such a bias towards promoting the dominance of the Centre in the federal fiscal architecture

104
in India has been pointed out even in the Terms of Reference given to the Thirteenth Finance Commission, which willsubmit its recommendations in 2009 for the five fiscal years from 2010-11 to 2014-15.
Another major issue pertaining to the growing centralisation of the fiscal policy space in India is the changingcomposition of the grants given by Centre to States. Out of the different types of grants given by Centre to States,Non-Plan Grants (based on the recommendations of the Finance Commission) and Central Assistance for State PlanSchemes (based on the recommendations of the Planning Commission) constitute untied or block grants for States,which they can spend according to their own expenditure priorities. On the other hand, grants under Central PlanSchemes (Plan schemes of the Central Government in which Centre contributes 100% of the funds) and CentrallySponsored Schemes (Plan schemes of the Central Government in which every State has to contribute a certain shareof the funds) constitute the tied or conditional grants for the States. We find that in the total grants from Centre toStates, the combined share of Non-Plan Grants and Central Assistance for State Plan Schemes has fallen from 77.7%in 2000-01 to 72.7% in 2008-09 (BE). This decline would most likely be sharper if we extend the time period furtherand look at the composition of grants in the 1990s. On the other hand, the share of grants to States under CentralPlan Schemes and Centrally Sponsored Schemes (which are tied to the norms, conditionalities and unit costs of theCentral schemes) in the total grants to States has increased over the last five years. Again, this increase would mostlikely be sharper if we look at the composition of grants in the 1990s. In this context, many States have beendemanding for a significant increase in the magnitude of untied grants from the Centre, which would give them theadditional fiscal space to make public investments in accordance with their State-specific development priorities.
Table-11.9: Composition of Grants (to States) from the Centre
Year Grants from the Grants for Various Components as % of Total Grants from the Centre
Centre State Plan Central Centrally NEC/ Non-Plan(in Rs. Crore) Schemes Plan Sponsored Special Plan Grants
Schemes Schemes Schemes
2000-01 37783.8 42.9 3.0 19.0 0.3 34.8
2001-02 43082.3 45.1 2.9 19.4 0.5 32.0
2002-03 45682.5 43.4 3.8 19.0 0.5 33.4
2003-04 51348 49.8 2.6 19.3 0.6 27.7
2004-05 56857 52.6 2.3 18.4 0.5 26.2
2005-06 76750 37.5 2.9 17.3 0.4 41.9
2006-07 94451 42.6 2.2 18.4 0.3 36.4
2007-08 (RE) 124638 44.3 5.0 19.8 0.7 28.1
2008-09 (BE) 143030 46.6 4.6 19.0 0.7 26.1
Source: Reserve Bank of India, State Finances: A Study of Budgets, various issues.
However, the UPA Government has not taken any concrete measure towards providing greater fiscal space to theState Governments. Despite strong demands from the States, the Eleventh Five Year Plan has not shifted anysignificant number of Central Schemes to the States. On the other hand, the imposition of FRBM legislation on theStates through recommendations of the Twelfth Finance Commission relating to the Debt Relief Scheme has constrainedsignificantly the fiscal space available to the State Governments for public investments. Thus, the UPA Governmenthas continued the trend of growing centralisation of the federal fiscal architecture in the country which has beenwitnessed over the last one and half decades.
Resource Mobilisation & Fiscal Federalism

www.cbgaindia.org
HOW DID THE UPA SPEND OUR MONEY?
A & C - (Department of ) Agriculture and Cooperation
AABY - Aam Aadmi Bima Yojana
AAY - Antyodaya Anna Yojana
AH & D - (Department of ) Animal Husbandry and Dairying
AIBP - Accelerated Irrigation Benefit Programme
AIDS - Acquired Immune Deficiency Syndrome
AIIMS - All India Institute of Medical Sciences
AITUC - All India Trade Union Congress
AMDP - Accelerated Maize Development Programme
ANM - Auxiliary Nurse Midwife
APL - Above Poverty Line
APMC - Agriculture Produce Marketing Committee
AR & C - (Department of ) Agriculture Research and Education
ARWSP - Accelerated Rural Water Supply Programme
ASHA - Accredited Social Health Activist
ASSOCHAM - Associated Chambers of Commerce and Industry of India
ATAM - Agricultural Technology Management Agency
ATR - Action Taken Report
AYUSH - Ayurveda Unani Siddha Homoeopathy
BE - Budget Estimate
BMI - Body Mass Index
BPL - Below Poverty line
BRGF - Backward Regions Grant Fund
BSUP - Basic Services to Urban Poor
CAP - Comprehensive Action Plan
CBGA - Centre for Budget and Governance Accountability
CDS - Current Daily Status
CHC - Community Health Centre
CII - Confederation of Indian Industries
CPCB - Central Pollution Control Board
CSO - Central Statistical Organisation
CSOs - Civil Society Organisations
CSS - Centrally Sponsored Schemes
CVD - Countervailing Duty
CWS - Current Weekly Status
DDP - Desert Development Programme
DDWS - Department of Drinking Water Supply
Dept. - Department
DoNER - Development of North Eastern Region
DPAP - Drought Prone Area Programme
DPCs - District Planning Committees
DV - Domestic Violence
Acronyms

106
EFP - Emergency Feeding Programme
FCI - Food Corporation of India
FDI - Foreign Direct Investment
FICCI - Federation of Indian Chambers of Commerce and Industry
FIIs - Foreign Institutional Investors
FM - Finance Minister
FRBM - Fiscal Responsibility and Budget Management (Act)
GBS - Gender Budget Statement
GCF - Gross Capital Formation
GDP - Gross Domestic Product
GDT - Gross Devolution of Transfers
GOI - Government of India
HIV&AIDS - Human Immunodeficiency Syndrome & Acquired Immune Deficiency Syndrome
IAY - Indira Awaas Yojana
ICDS - Integrated Child Development Services
ICPS - Integrated Child Protection Scheme
IEDSS - Inclusive Education of the Disabled at the Secondary Stage
IEEMA - Indian Electrical and Electronics Manufacturers' Association
IFPRI - International Food Policy and Research Institute
IHHL - Individual Household Latrine
IHSDP - Integrated Housing and Slum Development Programme
IITs - Indian Institutes of Technology
IIM - Indian Institute of Management
IISER - Indian Institutes of Science Education & Research
IMR - Infant Mortality Rate
INTUC - Indian National Trade Union Congress
ISOPOM - Integrated Scheme of Oilseeds, Pulses, Oilpalm and Maize
ITIs - Industrial Training Institutes
IWDP - Integrated Wasteland Development Programme
JNNURM - Jawaharlal Nehru National Urban Renewal Mission
JSY - Janani Suraksha Yojana
KBK - Kalahandi, Bolangir and Koraput
KGBV - Kasturba Gandhi Balika Vidyalaya
LDP - Language Development Programme
MASCs - Multi Application Smart Cards
MDG - Millennium Development Goal
MDM - Mid-day Meal (Scheme)
MH - Million Hectares
MHRD - Ministry of Human Resource Development
MIS - Market Intervention Scheme
MMA - Ministry of Minority Affairs
MMR - Maternal Mortality Rate
MoHFW - Ministry of Health and Family Welfare
MoRD - Ministry of Rural Development
Acronyms

www.cbgaindia.org
HOW DID THE UPA SPEND OUR MONEY?
MRP - Mixed Recall Period
MS - Mahila Samakhya
MSJE - Ministry of Social Justice and Empowerment
NABARD - National Bank for Agricultural and Rural Development
NAFED - National Agriculture Cooperative Marketing Federation
NAIS - National Agricultural Insurance Scheme
NCM - National Commission for Minorities
NCMP - National Common Minimum Programme
NCW - National Commission for Women
NDA - National Democratic Alliance
NDCP - National Disease Control Programme
NEN - North East Network
NER - North Eastern Region
NFHS - National Family Health Survey
NFSM - National Food Security Mission
NFWP - National Food for Work Programme
NHM - National Horticulture Mission
NMCME - National Monitoring Committee for Minorities Education
NPAG - Nutritional Programme for Adolescent Girls
NPDP - National Pulses Development Project
NREGA - National Rural Employment Guarantee Act
NREGS - National Rural Employment Guarantee Scheme
NRHM - National Rural Health Mission
NSS - National Sample Survey
NSSO - National Sample Survey Organisation
NUHM - National Urban Health Mission
OPDP - Oilplam Development
OPP - Oilseeds Production Programme
OTS - One Time Settlement
PDS - Public Distribution System
PHC - Primary Health Centre
PIB - Press Information Bureau
PIP - Programme Implementation Plans
PMGSY - Pradhan Mantri Gram Sadak Yojana
PMSM - Pre-Matric Scholarship for the Minorities
PPP - Public Private Partnership
PPS - Procurement Support Scheme
PSK - Prarambhik Siksha Kosh
RBI - Reserve Bank of India
RCH - Reproductive and Child Health (Programme)
RE - Revised Estimate
RGDWM - Rajiv Gandhi Drinking Water Mission
RGGVY - Rajiv Gandhi Grameen Vidyutikaran Yojana
RIDF - Rural Infrastructure Development Fund

108
RKVY - Rashtriya Krishi Vikas Yojana
RMSA - Rashtriya Madhyamik Shiksha Abhiyan
RSVY - Rashtriya Sam Vikas Yojana
SBI - State Bank of India
SCARDBs - State Cooperative Agriculture Rural Development Banks
SCP for SCs - Special Component Plan for SCs
SCs - Scheduled Castes
SCSP - Scheduled Caste Sub Plan
SGRY - Sampoorna Grameen Rozgar Yojana
SGSY - Swaranjayanti Gram Swarozgar Yojana
SHGs - Self Help Groups
SJSRY - Swarna Jayanti Shahari Rozgar Yojana
SLNA - State Level Nodal Agency
SNP - Supplementary Nutrition Programme
SRCs - Socio Religious Categories
SSA - Sarva Siksha Abhiyan
SPAs - Schools of Planning and Architecture
SPQEM - Scheme providing Quality Education in Madrasas
STEP - Support to Training and Employment Programme
STs - Scheduled Tribes
SUCCESS - Scheme for Universal Access and Quality at the Secondary Stage
SWM - Solid Waste Management
TB - Tuberculosis
TLE - Teaching Learning Equipment
TPDS - Targeted Public Distribution System
TSC - Total Sanitation Campaign
TSP - Tribal Sub Plan
UEE - Universalisation of Elementary Education
UIDSSMT - Urban Infrastructure Development for Small and Medium Town
UIG - Urban Infrastructure and Governance
ULB - Urban Local Bodies
UNDP - United Nations Development Programme
UPA - United Progressive Alliance
URP - Uniform Recall Period
UT - Union Territory
UWEP - Urban Wage Employment Programme
VAMBAY - Valmiki Ambedkar Awaas Yojana
VAT - Value Added tax
VGB - Village Grain Bank Schemes
VPTs - Village Public Telephones
WCP - Women's Component Plan
WHO - World Health Organisation
Acronyms