how data can drive improvements in health systems mark pearson head, oecd health division japanese...
TRANSCRIPT

HOW DATA CAN DRIVE IMPROVEMENTS IN HEALTH SYSTEMS
Mark PearsonHead, OECD Health Division
Japanese Health Economics Association21 July, 2012

Structure of my talk
1. A cautionary tale: don’t ask me which health system is ‘the best’
2. Getting better international measures of health inputs
3. Getting better international measures of health outputs
4. Prices and volumes of activity

1. WHICH SYSTEM IS BEST?

4
Output
70
72
74
76
78
80
82
84
0 1000 2000 3000 4000 5000 6000
Efficiency frontier
Input
Ou
tpu
t in
eff
icie
ncy
Input inefficiency
Source: OECD, 2010
Efficiency of the health sectorDEA analysis
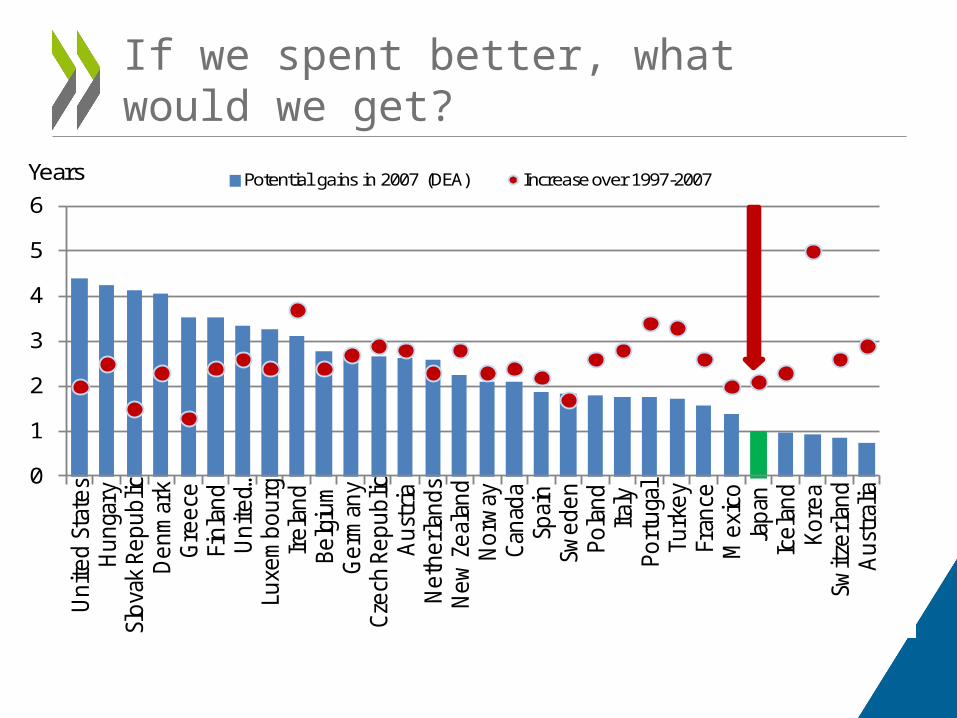
If we spent better, what would we get?
0
1
2
3
4
5
6
Uni
ted
Stat
esH
unga
rySl
ovak
Rep
ublic
Den
mar
kG
reec
eFi
nlan
dU
nite
d …Lu
xem
bour
gIr
elan
dBe
lgiu
mG
erm
any
Czec
h Re
publ
icA
ustr
iaN
ethe
rlan
dsN
ew Z
eala
ndN
orw
ayCa
nada
Spai
nSw
eden
Pola
ndIta
lyPo
rtug
alTu
rkey
Fran
ceM
exic
oJa
pan
Icel
and
Kore
aSw
itzer
land
Aus
tral
ia
Years Potential gains in 2007 (DEA) Increase over 1997-2007
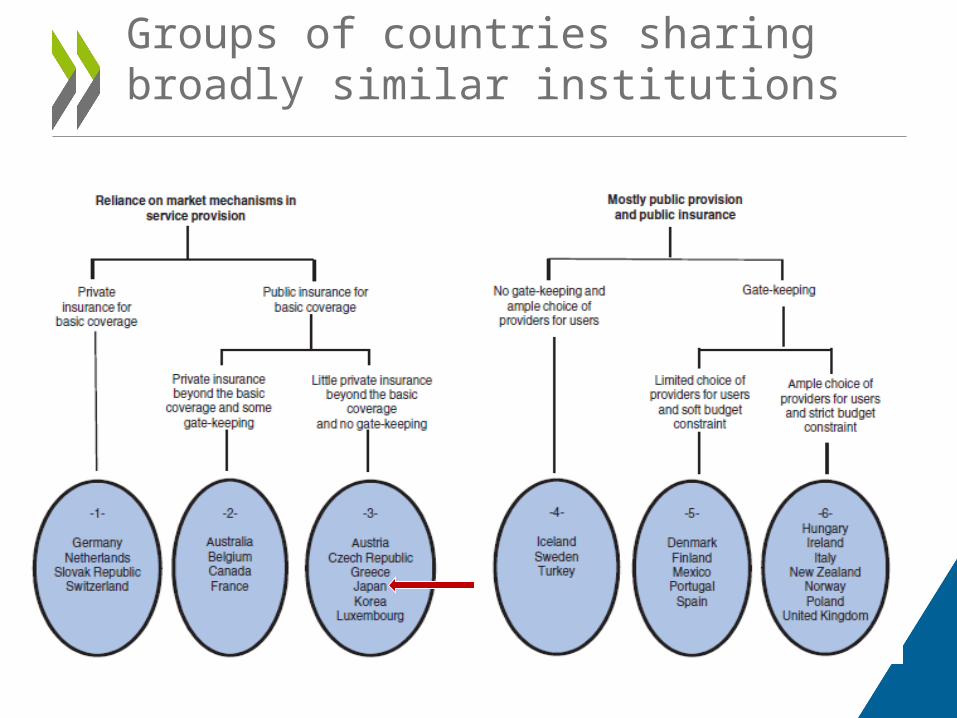
Groups of countries sharing broadly similar institutions

Efficiency varies more within groups of countries than across them
OECD average
AUS
AUTBEL
CAN
CZE
DNK
FIN
FRA
DEU
GRC
HUN
ISL
IRL
ITA
JPNKOR
LUX
MEX
NLDNZLNORPOL
PRT
SVK
ESPSWE
CHE
TUR
GBR
0
1
2
3
4
5
0 1 2 3 4 5 6
Potential gains in life expectancy (years, DEA)

Le Corbusier: villa Savoye

What do we currently spend on health?

2 . BETTER INTERNATIONAL MEASURES OF INPUTS

SHA Accounting Framework
Service Provision
HealthFinancing
Healthcare Consumption
What types of health goods and services are
consumed?
Who pays?
Who provides the
service?
Source: Adapted from IHAT for SHA 2011
Three dimensions of health accounting

SHA 2011: What is new and improved?
• Refined boundary setting• Continuity facilitated:
– Functions, Providers, Financing
• New health care classifications:– Factors of provision– Financing revenues
• Introduction of capital classification– Separate reporting for
current and capital
• Consistent labelling and categories introduced:– Link to intl. standards -
SNA 2008, provider classifications (e.g. ISIC)
– Larger compatibility between functions of care and providers
– Closer correspondence to financing “functions” of revenue raising, pooling and purchasing

A need to clarify the boundaries of LTC
0
0.5
1
1.5
2
2.5
3
3.5
4
Long Term Care, as a share of GDP, 2009 (or nearest year) LTC (Health) General government LTC (Health) Private sector LTC (Social) General government LTC (Social) Private sector
Different division between health and social care
Restricted boundary of LTC in health

Policy use of internationally comparable dataU
SA
GRE
ECE
CAN
IREL
AN
D
FRA
BEL
DEU
JPN
ITA
ESP
PRT
AUT
AUS
CHE
SVK
SWE
ISL
HU
N
FIN
SVN
LUX
NO
R
KOR
GBR
CZE
DN
K
POL
NZL
EST
MEX
200
400
600
800
In 2007, per capita spending on pharmaceuticals in Greece was second only to the US
USD PPP

3. BETTER INTERNATIONAL MEASURES OF OUTPUTS
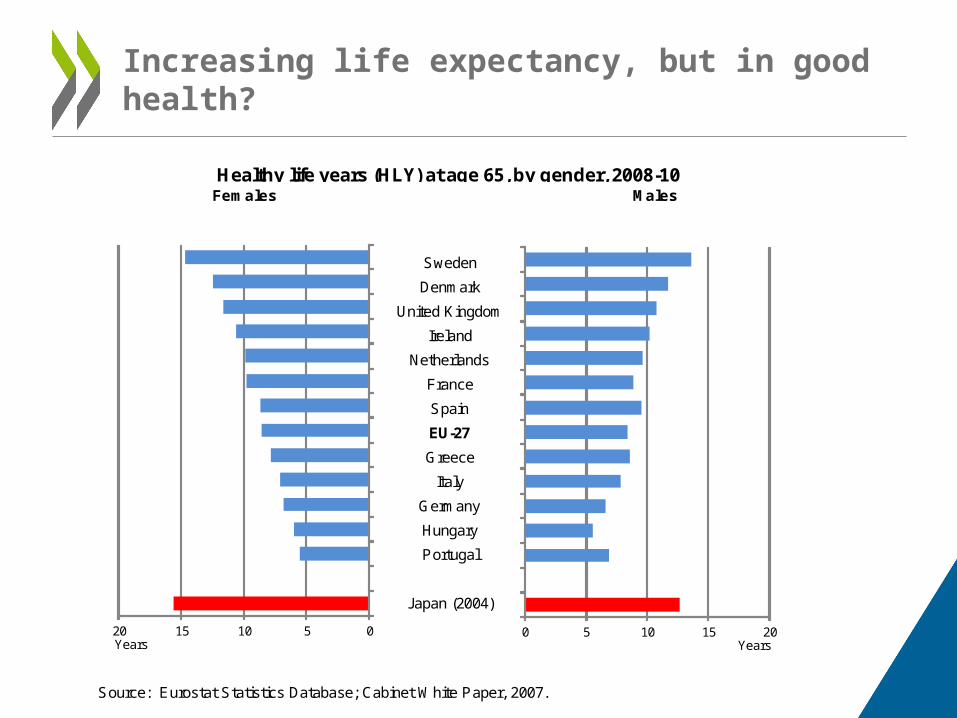
Increasing life expectancy, but in good health?
Sweden
Denmark
United Kingdom
Ireland
Netherlands
France
Spain
EU-27
Greece
Italy
Germany
Hungary
Portugal
Japan (2004)
Source: Eurostat Statistics Database; Cabinet White Paper, 2007.
Healthy life years (HLY) at age 65, by gender, 2008-10Females Males
05101520Years
0 5 10 15 20Years

What factors account for increases in life expectancy?
Contributions to changes in life expectancy
Women MenHealth care spending 1.14 1.34Smoking 0.00 0.12Alcohol 0.06 0.07Diet 0.02 0.02Pollution 0.15 0.29Education 0.50 0.49GDP 0.11 0.63
Observed changes 2.49 3.45

Cancer
Korea
United Kingdom
OECD
Germany
Finland
Canada
Japan
United States
0 10 20 30 40 50 60 70 80 90 100
Breast cancer five-year relative survival
1995-2000 2004-2009 or nearest period
Age-standardised rate (%)

Care for acute exacerbation of chronic conditions
Japan
Korea
Finland
United States
Sweden
OECD
Australia
0 1 2 3 4 5 6 7 8
Ischemic stroke 30 day in-hospital mortality
2000 2009 (or nearest year)
Age-sex standardised rate (%)

Care for acute exacerbation of chronic conditions
Sweden
Australia
United States
Finland
OECD
Korea
Japan
0 2 4 6 8 10
AMI 30 day in-hospital mortality
2000 2009 (or nearest year)
Age-sex standardised rate (%)

Care for chronic conditions
Australia
Canada
United States
United Kingdom
OECD (24)
Germany
Finland
Korea
0 20 40 60 80 100 120 140
Uncontrolled diabetes admissions, 2009 (or nearest year)
Age-sex-standardised rate per 100 000 population

Patient safety
Germany
Finland
United States
France
OECD (17)
United Kingdom
Canada
0 2 4 6 8 10
Foreign body left in during procedure, 2009 (or nearest year)
Crude Rate per 100,000 patients

4. PRICES AND VOLUME

Where the Japanese health system does MORE than other countries
Japan Rank compared with OECD countries
OECD average
Doctor consultations 13. 1per capita
1st 6.8 per capita
Practising nurses 10.1 per 1000 population
11th 8.7 per 1000 population
Hospital beds 8.1 per 1000 population
1st 3.4 per 1000 population
MRI units 43.1 per million population
1st 12.5 per million population
CT scanners 97.3 per million population
1st 22.8 per million population
Source: OECD Health Data 2012.

Widespread availability of medical technology
0
20
40
60
80
100
120
Per million population CT scanners
0
10
20
30
40
50
Per million population MRI machines
Source: OECD Health Data 2012.

Where the Japanese health system does LESS than other countries
Japan Rank compared with OECD countries
OECD average
Practising physicians 2.2 per 1000 population
29th 3.1 per 1000 population
Hospital discharges 107.1 per 1000 population
28th 151.6per 1000 population
Source: OECD Health Data 2012.

Irelan
d
Switzer
land
Luxe
mbo
urg
United
Sta
tes
Norway
Spain
Austra
lia
Austri
a
Franc
e
Denm
ark
Nethe
rland
s
Belgium
Sweden
Canad
aIta
ly
Portu
gal
Germ
any
OECD (mea
n)
Finlan
d
United
King
dom
Isra
el
Sloven
ia
Eston
ia
Czech
Rep
ublic
Poland
Slovak
Rep
ublic
Hunga
ry0
50
100
150
200
250
208 205197
185
172
148 147 145 141135
130 126119 116
108 105 104 100 10093
83 79
4438
32 3024
Comparative hospital price level, 2009
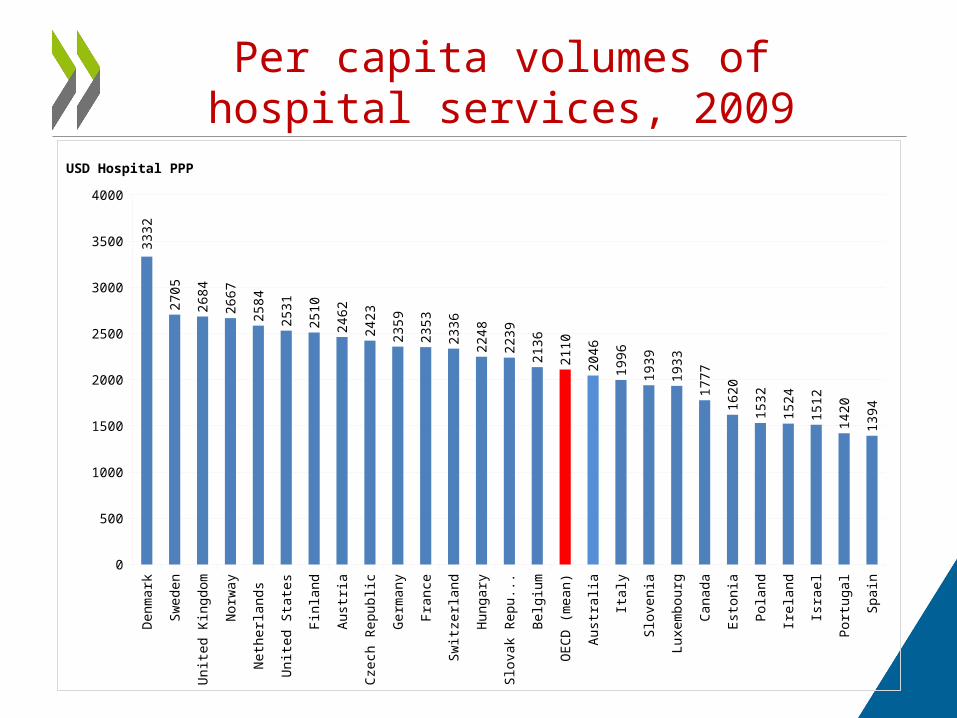
Per capita volumes of hospital services, 2009
Den
mar
k
Sw
eden
Uni
ted
Kin
gdom
Nor
way
Net
herla
nds
Uni
ted
Sta
tes
Fin
land
Aus
tria
Cze
ch R
epub
lic
Ger
man
y
Fra
nce
Sw
itzer
land
Hun
gary
Slo
vak
Rep
ublic
Bel
gium
OE
CD
(m
ean)
Aus
tral
ia
Ital
y
Slo
veni
a
Luxe
mbo
urg
Can
ada
Est
onia
Pol
and
Irel
and
Isra
el
Por
tuga
l
Spa
in
0
500
1000
1500
2000
2500
3000
3500
4000
3332
2705
2684
2667
2584
2531
2510
2462
2423
2359
2353
2336
2248
2239
2136
2110
2046
1996
1939
1933
1777
1620
1532
1524
1512
1420
1394
USD Hospital PPP

Service levels were maintained in Ireland…
Key Metrics 2006 2007 2008 2009 2010Patients treated as inpatients (% change over previous year)
2.3 3.9 -2.0 -1.2 -0.7
Patients treated as day cases (% change)
9.2 4.8 9.6 4.4 8.2
Attendances as out patients (% change)
7.5 10.7 5.9 2.5 6.0
Health expenditure 2006 2007 2008 2009 2010
Gross current expenditure (% change)
9.1 10 10.7 1.6 -4.1
Gross pay (% change) 8.1 6.7 5.7 2.1 -6.6

…while growth in health prices continued in the United States
Source: Martin et at, Health Affairs (2012)
Factors Accounting For Growth In Personal Health Care Spending, Selected Periods 2000–10.
THANK YOU FOR LISTENING
http://www.oecd.org/health/healthdata