how common crop yield measures misrepresent...
TRANSCRIPT
How Common Crop Yield Measures Misrepresent Productivity
among Smallholder Farmers
By Travis W. Reynolds,1,2 C. Leigh Anderson2, Elysia Slakie2 and Mary Kay Gugerty2
1Environmental Studies Program, Colby College
2Evans School Policy Analysis & Research Group,
Daniel J. Evans School of Public Affairs, University of Washington
Common estimates of agricultural productivity rely upon crude measures of crop yield,
typically defined as the weight of a crop harvested divided by the area harvested. But
this common yield measure poorly reflects performance among farm systems combining
multiple crops in one area (e.g., intercropping), and also ignores the possibility that
farmers might lose crop area between planting and harvest (e.g., partial crop failure).
Drawing on detailed plot-level data from Tanzania’s National Panel Survey, this paper
contrasts measures of smallholder productivity using production per hectare harvested
and production per hectare planted. Yield by area planted differs significantly from
yield by area harvested, particularly for smaller farms and female-headed households.
OLS regression further reveals different demographic and management-related drivers
of variability in yield gains – and thus different implications for policy and development
interventions – depending on the yield measurement used. Findings suggest a need to
better specify “yield” to more effectively guide agricultural development efforts.
2
1. Introduction
Modern agricultural development largely focuses on raising the productivity of small scale
farmers. Organization mission statements and budgets reflect this priority: the Food and
Agriculture Organization of the United Nations’ (FAO) mandate is to “raise levels of nutrition,
improve agricultural productivity, better the lives of rural populations and contribute to the
growth of the world economy” (emphasis added), while the United States Agency for
International Development (USAID) identifies increased productivity as a key to “inclusive
agriculture- led growth” (USAID, 2013). And the Bill & Melinda Gates Foundation Agricultural
Development Program states its core goal as “to reduce hunger and poverty for millions of
farming families in Sub-Saharan Africa and South Asia by increasing agricultural productivity
in a sustainable way” (BMGF, 2014; emphasis added). Over the past several decades
governments, non-profits and others have invested billions to raise crop yields in the pursuit of
productivity related goals (Conway, 2012).
But despite good intentions, common yield-based crop output measures – used ubiquitously
to identify successful interventions and target needy households – are a poor proxy for
smallholder farm productivity. Various measures including land productivity, labor productivity,
and total factor productivity are used to measure agricultural progress (Fuglie, 2008; Alston et
al., 2010). But crop yield – defined as a simple ratio of quantity harvested divided by area
harvested (e.g., kg/ha) – is most often used as the primary productivity indicator (Fermont &
Benson, 2011). The merits of this indicator (henceforth “common crop yield”) include its relative
ease of calculation and intuitive interpretation, acceptance among agronomists and agricultural
policymakers, and the relatively widespread availability of time-series data on crop production
and harvested area, allowing monitoring and comparisons of yield estimates over time (FAO,
2014). However this common yield measure is also known to be imperfect – both in the
reliability of the data used to generate yield (measurement error), and the appropriateness of the
measure itself as an indicator of agricultural productivity (measure validity).
In terms of measurement error, common crop yield estimates are often based on rough
estimates of aggregate production and area harvested. The FAO database – the most widely cited
source of crop yield data – is based on annual estimates of total production and total area
harvested from national Ministries of Agriculture (FAO, 2014). But as recent research has
3
emphasized, such aggregate national production estimates may be fraught with error – both
statistical and political (Sandefur & Glassman, 2015; Jerven, 2014). Moreover, owing to
significant variation in farming practices and growing conditions across farming systems and
agro-ecological zones, national-level yield estimates may differ starkly from yields realized by
any given smallholder farmer, or even by smallholders as a group (Craig et al., 1997).
Smallholder yield measurement in particular is complicated by numerous land-related factors
common in smallholder plots, including intercropping, harvests spread over a long time period,
irregular plot shapes, and non-planted areas due to trees, stumps, anthills/termite mounds and
other obstructions (Fermont & Benson, 2011; Casley & Kumar, 1988).
Meanwhile the validity of common crop yield as a measure of smallholder productivity is
undermined by only capturing a single output from a single input at a particular moment in time:
i.e., the weight of a given crop on a single parcel of land as measured at the end of the season
(kg/ha at harvest). As highlighted in recent scholarship, overuse of this sole indicator risks under-
emphasizing the value of multiple outputs and the costs associated with a host of other inputs to
farm production ranging from labor to crop inputs to environmental services (Reynolds et al.,
2015; Cassidy et al., 2013; Alston et al., 2010; Ehui & Pender, 2005). The measurement of
output per hectare harvested also ignores the possibility that smallholder farmers might
experience a loss in crop area between planting and harvesting, e.g., crop failure on some areas
or some entire plots. Plot area harvested may also be substantially smaller than plot area planted
due to poor germination, damage from pests or disease, floods, labor constraints, or lack of
market opportunities – all common circumstances for small scale farmers (Fermont & Benson,
2011). In such cases, overestimates of mean crop yields are likely so long as the null production
on abandoned cropland goes unaccounted for. In a sense, common measures of yield are thus not
truly indicators of aggregate agricultural productivity per se, but might rather be more accurately
construed as measures of “productivity among the productive.” The least productive plots – those
which produce no yields and thus constitute no area harvested – are omitted from common yield
calculations.
In this paper, we investigate whether the failure to include area losses in common crop yield
calculations might introduce significant error into smallholder crop yield estimates and thereby
bias research findings based upon those estimates. In particular, does the use of “production per
4
area planted” as a measure of crop productivity instead of “production per area harvested”
change agronomic and policy recommendations for improving small-scale farmer productivity?
Since productivity estimates are characterized by significant spatial and temporal variation, we
focus on the specific case of smallholder rice farming in Tanzania. Rice is the second most
common cereal cultivated in Tanzania behind maize, and its importance in the national diet is
growing (Minot, 2010; Raes et al., 2007). Drawing on detailed plot-level data from the 2007-
2008 Tanzania National Panel Surveys (NPS), conducted by the Tanzania National Bureau of
Statistics with support from the World Bank’s Living Standards Measurement Survey-Integrated
Surveys on Agriculture (LSMS-ISA) we explore variation in long rainy season1 rice yields using
alternative yield calculations. In the presence of frequent and substantial losses in plot area
between planting and harvesting, we hypothesize that analyses of factors explaining variability in
common crop yield (kg/ha harvested) may be less useful than an alternative yield estimate (kg/ha
planted) in designing interventions to increase agricultural productivity.
The paper is organized as follows. Section 2 summarizes challenges inherent in common
crop yield measures, and outlines theoretical determinants of variability in rice yields among
Tanzanian smallholders, including biotic, abiotic, management and socio-economic factors.
Section 3 describes the study sample and the empirical model, and Section 4 follows with a
presentation of results, including Ordinary Least Squares (OLS) regression illustrating the
different conclusions arising from the same regression model using two different outcome
measures from the Tanzania NPS data: total production per area harvested, and total production
per area planted. The final sections summarize the main findings and conclusions.
2. Sources of Error in Common Crop Yield Measures
Common crop yield is the weight of harvested product divided by crop area harvested and is
typically expressed in kilograms or metric tonnes per hectare (Fermont & Benson, 2011).
Common crop yield=∑Quantity harvested in kg
∑Area harvested in ha
1 The majority of Tanzania has one long rainy season that typically lasts from December through April. The North
and Northeastern parts of the country have a long rainy season lasting from March through May and a short rainy
season with lighter rainfall from October to December (Minot, N. (2010). Staple food prices in Tanzania.
Washington, D.C. International Food Policy Research Institute).
5
There are, however, various methods of measuring both the numerator and the denominator of
this seemingly simple equation.
Primary measures of quantity harvested include crop cutting (in which sample plots are
systematically harvested by experts) and farmer estimates. While crop cutting was previously
believed to be a superior method of measuring yields, Poatea (1988) followed by Boyko & Hill
(2009) and Fremont & Benson (2009) cite evidence that suggests farmer estimates may be a
better measure than crop cutting due to bias introduced in selecting the location for crop cutting.
Fremont and Benson (2011) later also found that different disciplines may use the same
terminologies when measuring crop production, but with different understandings of their
definitions: sociologists, agronomists, and economists all have different uses for yield
information and thus different specific yield concepts. Casley & Kumar (1988) identify at least
three distinct yield measures associated with different accounting of quantity harvested: (1)
biological (gross) yield, defined as yield before any harvest or post-harvest losses; (2) harvested
yield, defined as yield subtracting harvesting losses; and (3) economic yield, defined as yield
subtracting any harvesting or postharvest losses.
Common yield measures may contain additional error owing to intercropping and crop
mixing practices, where farmers plant multiple crops on one plot (Craig et al., 1997). This poses
particular problems for estimating yields on women’s plots – since women in Tanzania are more
likely to intercrop and also tend to plant smaller plots (EPAR, 2013). When common crop yield
is calculated without accounting for density of the intercrop, yields appear lower –
misrepresenting the “true productivity” of women smallholders (Cassidy et al., 2013).
In spite of such known inaccuracies in common yield measures, common yield-based data
from the United Nations Food and Agriculture Organization – FAOSTAT – remain among the
most commonly used data for evaluating country-level crop production trends. FAO defines crop
yield as “harvested production per unit of harvested area for crop products”.2 Perhaps even more
surprisingly, in spite of the widely differing accepted methods of calculating yield (as described
2 In Tanzania, FAOSTAT data generally comes from national government statistical agencies. Tanzania’s data are
drawn from agricultural census information collected by the Tanzania National Bureau of Statistics (NBS) and
NBS’s quarterly collection of data from the Ministry of Agriculture, Food Security, and Cooperatives. Collected
information relies on “eye estimation”, projective-forecasting, and Food Crop Production Forecasting Sample
Survey (CountrySTAT).
6
above) and collecting yield data (e.g., through household surveys or forecasting from simple
models and field checks), in a review of 14 articles published over the past decade on the topic of
rice yields in Africa, only one paper specified that it was using area harvested as the baseline for
yield calculations. The others did not provide a description of how yield was measured. The lack
of specificity suggests either that readers are assumed to understand that yield is calculated based
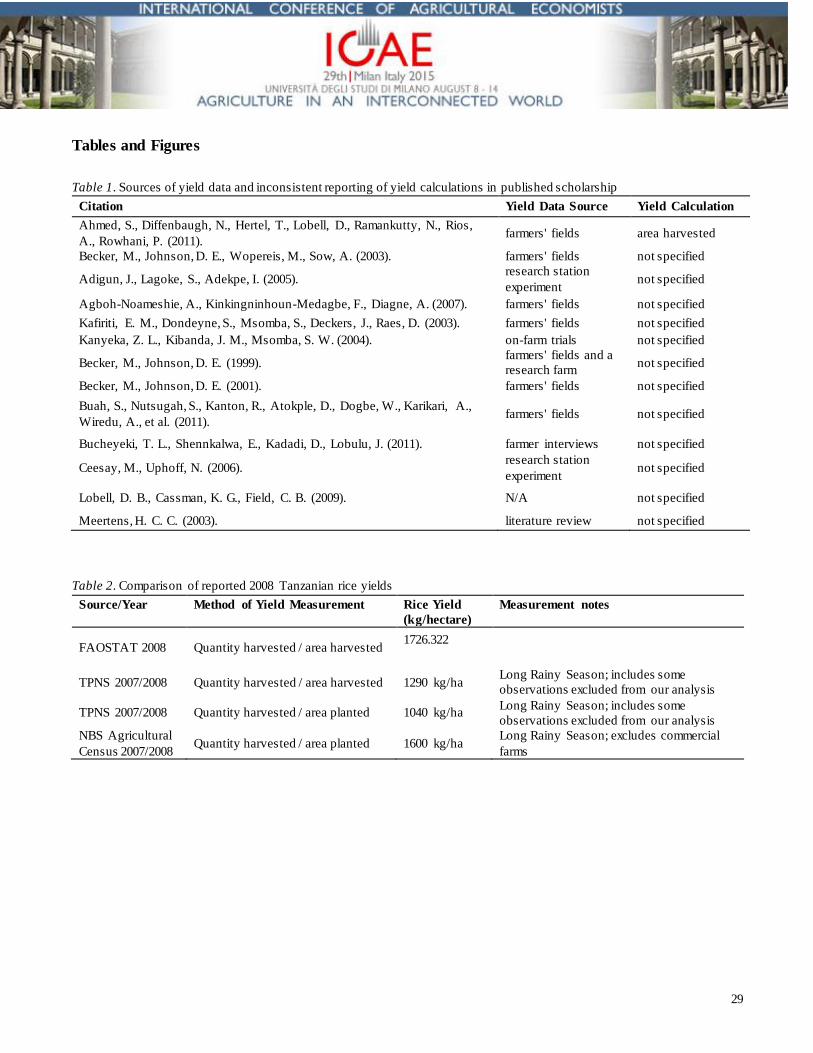
on area harvested or that yield measurement is not dealt with precisely (see Table 1).
[TABLE 1 HERE]
Inconsistent yield information presents challenges in designing appropriate interventions and
distributing resources. The spatial and temporal pattern of yields appears to vary considerably by
source and method, making it difficult to understand when and why yields fall below their
potential. But perhaps even more importantly, the above discussion implies that errors in
common crop yield measures are not random, but rather more likely to result in biased yield
estimates among low productivity smallholder farmers (most likely to cultivate irregular
marginal plots and to experience losses in cropping area over the growing season), and women
farmers (more likely to engage in intercropping practices poorly captured by yield measures).
By ignoring the possibility that smallholder farmers might experience a loss in crop area
between planting and harvesting, e.g., crop failure on some of the area planted, overestimates of
mean crop yields are likely using common crop yield calculations so long as the null production
on abandoned cropland goes unaccounted for. Figure 1 illustrates how common yield measures
may systematically overestimate mean yield relative to one alternative yield measure –
production by area planted – by omitting lost crop area planted from yield calculations. The
figure further illustrates how common yield measures might also bias estimates of the marginal
returns to productivity-enhancing interventions – by omitting information about “failed”
management practices when calculating the relative productivity only looking at cropping area at
the time of harvest.
[FIGURE 1 HERE]
Based on the preceding discussion, we posit and empirically test the following hypotheses:
Hypothesis 1: Crop productivity estimates based on crop harvest quantity per area harvested
will differ significantly and systematically from productivity estimates based on crop harvest
quantity per area planted for certain subsets of smallholder rice farmers in Tanzania; and
7
Hypothesis 2: Estimates of the marginal gains to productivity-enhancing strategies in
Tanzanian smallholder rice farming will differ depending upon the measure of productivity
used.
3. Smallholder Rice Yields in Tanzania
According to FAOSTAT the Tanzanian food supply per capita of paddy rice3 (unmilled
weight) was 30.1 kg in 2009, compared to only 24.8 kg/capita in 1999. The agricultural census in
2007/2008 reported a 20% increase in the number of households cultivating rice in the country
compared to 2002/2003 (National Bureau of Statistics, 2012). And the 2008 Tanzania National
Panel Survey (NPS) found 17% of households in cultivated the crop nationally (Bergh, et al.,
2012). Rice consumption furthermore appears to be income elastic in Tanzania, that is, as
households increase their income they spend even greater shares of earnings on rice (Minot,
2010). Rice imports have also increased in recent years (Raes et al., 2007).
In spite of growing demand for rice small scale farmers in Tanzania regularly harvest yields
far below the world average. But the diversity and complexity of production systems in Tanzania
poses a significant challenge to researcher and agricultural development practitio ners trying to
understand this apparently poor performance. About three quarters of rice in Tanzania is grown
in the rainfed lowland system, on non-irrigated fields that are flooded for at least part of the
season; another 20-23% of rice is grown in the rainfed upland system, and the remaining 4-8% is
grown in irrigated flood plains (Balasubramanian et al., 2007; Meertens et al., 1999; Kanyeka et
al., 1994). The Tanzania NPS, which provides agricultural statistics at a zonal level, found mean
plot sizes for rice ranging from 0.26 ha in Zanzibar Zone to 1.5 ha in Western Zone (Bergh et al.,
2012). The Morogoro, Shinyanga, Mwanza, and Tabora regions of Tanzania account for 62.7%
of the total area cultivated with rice. Morogoro has the largest proportion of land cultivating rice
(31%), followed by Zanzibar (22.2%) (NBS, 2012).4 However, on a per household basis,
3 The degree of milling is another area of imprecision in the literature. FAO and the TNPS report yield of paddy or
rough rice, before the hull is removed in milling. Removing the hull reduces weight by approximately 20%
(http://www.fao.org/docrep/t0567e/T0567E07.htm). 4 Morogoro (18.7%%), Shinyanga (19.3%), Mwanza (13.7%), Tabora (11%).
8
Zanzibar has the lowest acreage planted with rice (0.37 ha), while Rukwa has the highest (1.34
ha) (NBS, 2012).
Irrigation is rare among Tanzanian farmers. In 2007/2008 7.8% of households cultivating rice
irrigated according to the Agricultural Census, while the Tanzania NPS found 5% of paddy plots
were irrigated in the long rainy season (NBS, 2012). On average, households planting rice used
0.5 to 0.9 hectares for rice; in most regions this accounts for about a third of the household’s
landholdings, suggesting that rice is one of multiple crops cultivated by the household (National
Bureau of Statistics, 2006). While both women and men participate in rice cultivation, women
form a majority in most of the day-to-day activities (National Rice Development Strategy, 2009;
Mwakalila, 2005; Kiagho et al., 2004; Meertens et al., 1999). Of households cultivating rice in
the 2008 long rainy season, 23% of the households had female majority ownership of the crop
(NBS, 2012).
[FIGURE 2 HERE]
According to FAOSTAT (2014), Tanzanian rice yields averaged 1900 kg/ha between 2001
and 2011. However there are significant disparities in rice yield estimates across published data
sources in any given year. Figure 1 contrasts yield estimates from FAOSTAT, the Tanzanian
Agricultural Census, and the Tanzanian NPS. Rice yields increased 37.5% between the
2002/2003 census (1000 kg/ha) and the 2007/2008 census (1600 kg/ha) and range from a low of
700 kg/ha in Dodoma to 3400 kg/ha in Manya (NBS, 2012). NBS Agriculture Census data
separate smallholder farmers from commercial farmers, which in part may explain the difference
from FAOSTAT estimates (Table 2). But even within the NBS data there is substantial variation
in yield estimates depending on whether an area harvested or area planted measure is used.
[TABLE 2 HERE]
4. Modeling Determinants of Smallholder Rice Yield
Myriad theories seek to explain variation in crop yields across smallholder farmers, and
many studies seek to estimate “yield gaps” between the observed yield and the theoretically
attainable yield for a crop in a given ecological (e.g., soil types and rainfall) and institutional
(e.g., access to inputs and markets) context. Waddington et al. (2010) attempted to quantify the
relative significance of various constraints and associated yield losses for six food crops in 13
9
farming systems, using survey data from 672 experts, including geneticists, plant protection
scientists, agronomists, social scientists, economists, extension agents, input suppliers, and
farmers. In the two systems where rice farming is prevalent – the Sub-Saharan Africa Root Crop
and Cereal-Root Crop Mixed systems – the authors found socio-economic constraints accounted
for the largest share of yield losses (38% and 51% respectively).5 Similarly, the top constraint in
both systems came from the socio-economic category: namely the limited and expensive supply
of fertilizer.
However many other constraints clearly play significant roles in determining crop production
– we therefore adopt the four categories of production constraints developed by a panel convened
by the CGIAR Generation Challenge Programme: abiotic, biotic, management, and
socioeconomic (Waddington, Li, Dixon et al., 2009). Abiotic constraints include environmental
factors such as soil and climate. Biotic constraints come from living organisms such as weeds,
pests, and diseases. Management and socioeconomic constraints are human-made but differ in
scope from each other: management constraints include fertilizer and water management, while
socioeconomic constraints focus on input prices and credit access. These proposed constraints to
yield form the basis for our empirical investigation on variability in Tanzania.
4.1. Abiotic Constraints
The primary abiotic constraints relevant for rice production in Tanzania are soil quality, soil
type, and climate. Farmers in Tanzania consistently report poor soil quality, and soil tests
confirm these reports (Meertens et al., 1999; Meertens, 2003; Meertens et al., 2003; Mghase et
al., 2010). Lowland soils in Tanzania are classified as vertisols, described as “heavy clay soils”
with high potential for rice cropping (Balasubramanian et al., 2007; Raes et al., 2007; IUSS,
2006). Upland soils in Tanzania have less clay and are classified as inceptisols, rich in organic
material (Balasubramanian et al., 2007). Heavy clay soils are preferable for rice cultivation
because they are less permeable, and therefore retain better moisture than more sandy soils; as a
result, expected yields for heavy clay soils are higher (Raes et al., 2007). Soil tests of upland rice
5 While fertilizer and improved variety use is included under management, high prices and availability of these
inputs are included in socio-economic constraints, which explains the large share of yield losses associated with the
socio-economic category.
10
in four districts in southern Tanzania (Ulanga, Kyela, Morogoro, and Korogwe) found that while
the soil was “medium to very high[ly] capable of supporting the growth of rice,” low to medium
nitrogen and phosphorus levels restricted rice yields (Mghase, 2010). Soils in northern Tanzania,
both upland and lowland, were found to be similarly deficient, indicating a potential for fertilizer
use to increase soil nutrients and rice yields (Ndakidemi & Semoka, 2006). In some places in the
Shinyanga region of northwest Tanzania, rice has been cultivated for 30-40 years on the same
soil, with very little fertilizer use (Meertens et al., 2003).
Lack of rainfall can also severely limit yields. Studies focusing on rainfall found that a dry
year for lowland rice typically averages 500 kg/ha yields, a normal year averages 1000 kg/ha,
and a wet year averages 2000 kg/ha (Raes et al., 2007). In a study in the drought-prone Mwanza
region Meertens et al. (1999) found rice fields were left to fallow one out of every three years
due to insufficient rainfall. Two recent studies using different datasets from Tanzania concluded
that higher temperatures further decrease yields (Rowhani et al. 2011; Ahmed et al. 2011).
4.2. Biotic Constraints
Primary biotic constraints to rice production in Tanzania are weeds, pests, and disease.
Weeds have long ranked as one of the biggest problems for rice farmers in Tanzania (Meertens et
al., 1999). The parasitic weed Striga in particular represents an increasingly serious problem in
upland rice regions of Tanzania (Riches et al., 2005). The degree of weed infestation relates to
the method and quality of land preparation and soil type, but water depth is the most important
determinant; if there is permanent, sufficient water depth then weeds cannot grow, but if fields
are dry for an extended period then the weeds will grow faster than the rice plants (Meertens et
al., 1999). A series of studies across West Africa and Tanzania showed that well-weeded plots
had yields 1000 to 2000 kg/ha higher on average (Fofana & Rauber, 2002; NERICA, 2008;
Becker & Johnson, 1999; Becker & Johnson, 2001; Becker et al., 2003; Adigun et al., 2005).
Disease and pests are also significant biotic constraints. Banwo (2003) reports rice yellow
mottle virus (RYMV) as the most important disease affecting rice production in Tanzania,
particularly in rainfed lowlands. High RYMV incidence has been reported in all rice-cultivating
areas, but affects the highest producing regions (Morogoro, Mbeya, Shinyanga and Mwanza) at a
higher rate (Kanyeka et al., 2007). Yield losses of up to 100% have been reported in West Africa
11
and Tanzania due to RYMV (Luzi-Kihupi, 2009; Abo et al., 1997). Rice blast, another rice
disease, also negatively affects rice, particularly in upland regions (NERICA, 2008; Luzi-Kihupi
et al., 2009). Animal and insect pests, including primates, birds, rats, and a variety of insects
negatively affect rice yields in Tanzania (Mghase et al., 2010; Balasubramanian et al., 2007;
Banwo, 2002). Damage from birds is higher for rice plots that are planted early, contain early-
maturing cultivars, and/or lack sufficient labor for birdscaring (Meertens et al., 1999).6 Insects
are particularly problematic because they also act as vectors for both plant and human diseases
(Banwo et al., 2002).
Finally, research in Tanzania and Uganda has also illustrated significant yield gaps between
improved variety (IV) seeds and traditional rice varieties in all ecosystems (Bucheyeki et al.
2011; Waddington et al., 2010; NERICA, 2008; Kijima et al., 2006; Mwaseba, 2005; Msomba et
al., 2004; Kanyeka, 2004; Meertens et al., 1999). Traditional varieties may be vulnerable to
certain pests or diseases, and are often prone to lodging7 or crop failure under the marginal
rainfall patterns of Tanzania (Luzi-Kihupi et al., 2009). In the development of IV seeds, higher
yields can be achieved by improving resistance to disease and insects (Bucheyeki et al., 2011) as
well as abiotic constraints such as drought. Despite the increased yield potential of IV seeds,
significant barriers to widespread adoption are evident. First, focusing exclusively on
characteristics related to yield may overlook other traits that are important to farmers. For
example, one farmer survey in southeast Tanzania found that smallholders’ holistic rating
(including factors such as ease of milling and eating qualities) of many IV seeds was lower than
many traditional varieties (Kafiriti et al., 2003).8 A second important constraint in Tanzania is
poor channels for seed distribution; 18% of rice farmers in one survey cited lack of seed
availability as a problem affecting yields (Bucheyeki et al., 2011). Even when farmers use
improved variety seeds, other management constraints may prevent increases in yield or income
from IV seed. Nakano and Kajisa (2012) found that modern variety seed did not have a
statistically significant impact on yield or income under rainfed conditions and that even under
6 Meertens et al. (1999) found that farmers spent an average of 25 labor days per hectare birdscaring. 7 Lodging “is the permanent displacement of the stem of a free-standing crop plant from the vertical” (Oladokun &
Ennos, 2006). 8 Farmers included in study mostly had irrigated rice fields.
12
irrigation, proper water management, including improved bunds, was necessary for improved
yields and incomes.
4.3. Management Constraints
Management constraints to rice production in Tanzania include planting method, irrigation
and water management, fertilizer use, and fallowing or intercropping.
A number of studies from Tanzania and West Africa found that lower yields were associated
with larger plots, likely due to the increased labor and inputs required to manage large plots
(Carletto et al., 2015; Nakano et al., 2011; Nakano, Bamba, Diagne et al., 2011; Sakurai, T.,
2006). Another study from Tanzania found that larger plots decreased the likelihood that farmers
would adopt IV seeds or fertilizers (Nakano et al., 2011). The literature is mixed regarding the
impact of broadcast seeding compared to transplanting seeds. Anecdotal evidence and summary
statistics from a survey of rice farmers in Tanzania suggest that transplanting seeds9 is associated
with higher yields (Mwaseba, 2005; Nakano, 2011), and in studies in Nigeria and The Gambia,
optimal plant spacing was found to be 20 x 20 cm, which cannot be achieved with the broadcast
method of planting (Oikeh et al., 2009; Ceesay & Uphoff, 2006). However, regression analysis
in two studies in West Africa found transplanting seeds had no significant effect on production
(Saito et al., 2010) and that transplanting may be constrained by labor availability. Meertens et al
(1999) found that 20 more labor days per hectare were used for transplanting compared to direct
seeding10 (Meertens et al., 1999).
Because of rice’s hydrological needs, water management is among the most important
determinants of yields. Typically, yields are around 1000 kg/ha in upland areas and 2000 kg/ha
in lowland areas and rise to 3400 kg/ha in irrigated areas, with a possible range of 600 to 10000
kg/ha (NERICA, 2008; Raes et al., 2007). However, a study of irrigation in Tanzania found low
sustainability of current irrigation schemes due to poor local-level operation and maintenance
(Therkildsen, 2011). Bunded fields in Tanzania that store rainwater and limit runoff have been
shown to increase yields by 10% in permeable soils and 75% in heavy clay soils (Raes et al.,
9 Transplanting seeds means that seeds have already germinated in a nursery before being planted in the field. 10 Direct seeding means seeds are directly planted into the field via broadcasting, dibbling, or drilling. One study
found no significant differences in rice yields resulting from these different methods (Oyewole et al., 2010).
13
2007; Hatibu et al., 2006). In an experimental study in the Senegal River Valley, researchers
found the labor-intensive System of Rice Intensification (SRI) had higher water productivity and
similar yields compared to rice grown under modern management practices, but only when
weeds were adequately controlled (Krupnik et al., 2012).
Fertilizer access and use is yet another key determinant of rice production: several studies in
West Africa and Tanzania have found that fertilizer use generally increased yields relative to
control groups (Becker et al., 2003; Buah et al., 2011; Meertens, 2003; Meertens et al., 2003;
Becker et al., 2001; Becker et al., 1999; Saito et al., 2010; Oikeh et al., 2009). Research across
Sub-Saharan Africa has found potentially large benefits to the application of nitrogen fertilizer,
accounting for 1500 kg/ha increase in irrigated conditions in Benin (Saito et al., 2010), 1200 to
2400 kg/ha increase in lowland rice in Tanzania (Meertens, 2003b), and 950 kg/ha in upland rice
in Nigeria (Oikeh et al., 2007). Many studies have further suggested particular environmental
and management conditions affect the magnitude of impact fertilizer had on rice yields. The
amount of fertilizer, rainfall, and weeding have all been found to affect the degree to which
fertilizer increases yields. In two studies in Tanzania and Nigeria, plots receiving a high nitrogen
application (60 kg/ha or 120 kg/ha) had lower yields than both the 30 kg/ha and no-treatment
plots (Meertens, 2003; Oikeh et al., 2009). Higher levels of precipitation accounted for larger
yields among fertilized plots in Nigeria (Oikeh et al., 2007; Oikeh et al., 2009; Meertens, 2003).
Inorganic fertilizer was shown to be more effective than synthetic fertilizer on irrigated plots in
Côte d’Ivoire (Becker et al., 1999 & Becker et al., 2001). This same study also warned that
without weeding, synthetic fertilizer may only increase weed biomass.
Organic fertilizers such as farmyard manure or rice husks both have increased yields by as
much as 1000 kg/ha in lowland rice in Tanzania. Limitations to organic fertilizer use include
difficulty in transporting manure and limited availability of rice husks and manure. While studies
have shown that the application of 10 tons of manure per hectare increases yields by 880 to 1000
kg/ha, the average farmer in Tanzania has only enough manure to cover 0.36 ha at that rate
(Meertens, 2003). Moreover like synthetic fertilizer, manure application can result in more
weeds (Meertens et al., 2003).
Lastly, different fallowing methods have been shown to affect rice yields. In a study of
upland fields in Côte d’Ivoire, leguminous fallowing (cultivating wild-growing legumes during
14
the dry season) accounted for a 29% increase in rice yields over the more common weedy fallow
(Becker et al., 1999). Another study of upland fields in Côte d’Ivoire showed that as fallow
periods became shorter (less than five years followed by five straight years of cultivation), yields
decreased an average of 300 kg/ha (Becker et al., 2001). The study of upland rice fields in Côte
d’Ivoire found that intercropping legumes and rice decreased yields for both crops, despite
increasing soil nitrogen and reducing weed growth (Becker et al., 1999). An experiment in
Nigeria found that intercropped rice intercropped with groundnuts performed favorably
compared to monocropped rice in regards to pest infestation (stem borer and green stink bug).
However, the authors note that only some crop combinations and densities outperformed mono-
cropped rice (Epidi et al., 2008).
4.4.Socioeconomic Constraints
Credit access, labor, livestock, input access and prices, extension, and individual
characteristics such as age and gender make up the primary socioeconomic constraints to rice
production. A recent study of rice farmers in Tanzania suggested that credit access had a
significant effect on rice yields. The simple presence of a farmer co-op within the village was
associated with a 190 kg/ha increase in rice yields (Nakano & Kajisa, 2011). The study found
credit was increasingly important for inputs or practices that regularly require cash on hand, such
as chemical fertilizer use and tractor use for constructing a bund or leveling land, but did not
have a significant effect on adoption of improved seed varieties. The study suggested that in
many cases the farmer’s past production record was used as an indicator of credibility, thus
limiting the ability of many rainfed farmers to access credit.
Availability of labor is another key management factor that explains variability in rice yields.
In one study in Tanzania, total labor days per hectare ranged from 210-269 for rice farmers in the
lowland ecosystem, depending on the intensity of cultivation and access to an ox plough, which
was comparable to the labor requirements for rainfed lowland and upland cultivation (Meertens
et al., 1999). Since most households harvest rice by cutting each head separately, harvesting
alone accounted for an average of 126 labor days per hectare; for comparison, in other rice-
growing countries like Laos, Nepal, and Madagascar, harvesting only requires between 11 and
27.5 labor days per hectare on average (Meertens et al., 1999). Rice also has high labor
15
requirements because of the intensity of weeds (Adigun et al., 2005). Finding labor for weeding
is particularly difficult because it must be done at the height of the season, when laborers are
more likely to be working on their own fields; therefore, a study in Tanzania found that the price
of hired labor increases during a point in the season where households are particularly likely to
have cash constraints (Meertens et al., 1999).
Ownership or access to livestock can also have a significant impact on labor requirements.
Meertens et al.’s study in Tanzania (1999) found that having access to an ox plough reduced the
labor days per hectare from 48 to 9 for land preparation, and that land preparation may be
delayed if households need to hire or borrow an ox plough. Bucheyeki et al. (2011) hypothesize
that high rates of rice cultivation among members of the Sukuma ethnic group may be related to
high rates of cattle ownership, which makes it possible to use ox ploughs for land preparation
and ox carts for transportation. Livestock also increases access to farmyard manure.
High input prices were also among the most commonly cited yield constraints by rice farmers
in Tanzania (Bucheyeki et al., 2011; Meertens et al., 1999). The Tanzanian government
previously subsidized fertilizers, but prices have increased since those subsidies ended in the
early 1990s (Meertens, 2003). Access to affordable inputs is particularly difficult for farmers
who live in remote villages where the roads are in poor condition, and therefore few traders
come to buy and sell goods. This lack of competition allows them to pay lower prices for crops
and charge higher prices for inputs, which reduces the profitability of input use (Meertens et al.,
1999). Rice-related extension has also proved to be important in whether improved variety seeds
and modern planting methods were adopted by both irrigated and rainfed farmers in Tanzania
(Nakano et al., 2011), while experience with rice farming has also proved to be an important
indicator in rice yields. Two studies of farmers in upland and lowland ecosystems in Uganda and
Côte d’Ivoire found that farmer’s experience had a significant impact on rice yields (Kijima et
al., 2006; Sakurai, T.; 2006). One study of smallholders in Tanzania observed that younger
farmers were more willing to transport manure to distant plots and construct soil conservation
structures as part of a project to increase soil fertility. Additionally, the outlier poor farmers who
purchased inorganic fertilizer were generally younger (Mowo et al., 2006). Another study found
that younger farmers in Nigeria were more likely to adopt New Rice for Africa (NERICA)
improved varieties (Tiamiyu, 2009).
16
Finally, gender is another possible determinant of rice productivity. Peterman (2011),
studying farmers in Nigeria and Uganda, suggests than men and women may have different
productivity based on different availability and quality of inputs, and that they also may have
different production functions. She observes that female-controlled plots of any crop have lower
productivity than male-controlled plots in the same household, even when controlling for
unobservable household characteristics, which indicates that household bargaining and decision
making about input allocation matters. In Sub-Saharan Africa as a whole, female farmers have
been less likely to adopt technologies that improve productivity (Cagley, 2009). Women may be
constrained by labor availability, education, cultural appropriateness of adopting technology, and
inadequate access to resources (Cagley, 2009).
5. Data and Methods
5.1. Survey Design
The Tanzania National Panel Survey (NPS) data were collected over a twelve-month period
from October 2008 through September 2009. The sample design was constructed to produce
nationally representative estimates, and it consists of 3,265 households from eight administrative
zones, each with a rural/urban cluster, for a total of sixteen sampling strata. The resulting data
can produce nationally representative estimates, however, sample size limitations preclude
reliable statistics at the regional or district level. Agricultural households completed an additional
farm questionnaire, resulting in 2,474 respondents who report involvement in any crop, fishing,
or livestock cultivation.
5.2. Regression Analysis and Methods
We aim to understand the drivers of rice yields in Tanzania and examine whether and how
yield measurement methodology might impact both mean productivity estimates and also shape
explanations of yield drivers. We calculate area planted by multiplying the reported size of the
plot and the proportion that was planted with rice (100%, 75%, 50% or 25%). Farmers directly
reported the area harvested. Some observations therefore have differences between area planted
and area harvested due to reporting differences rather than actual area differences. Where
farmers reported harvesting more area than planted, area planted was replaced with area
17
harvested. The sample furthermore omits a small number of observations where farmer reports
regarding crop area losses were found to exceed the farmers’ total landholdings (likely reflecting
data error). Quantities harvested were collected based on farmer estimations of weight. As
discussed above, these estimates are likely an imperfect but empirically accepted measure of
quantity.
Based on area values we calculated the rice yield two ways, first, using the weight harvested
divided by the area harvested and then using the amount harvested divided by the area planted.
As discussed above, area harvested does not account for loss of crop area due to drought, rains,
fire, insects, animals, crop theft, diseases and community problems, lack of labor, and other
factors. While these area losses may be infrequent in field trials, farmers in the Tanzania NPS
frequently report harvesting less area than planted and yields between the two measures differ
substantially. Yield observations greater than 12,000 kg/ha were deemed improbable outliers and
eliminated from the analysis. Based on the literature review on rice constraints, a variety of
variables meant to measure abiotic, biotic, management, and socio-economic constraints were
included in the yield regression analysis. We compared two models. Model 1 is an OLS
regression on yield by area harvested and Model 2 uses the same independent variables
suggested by the literature review, but regresses on yield by area planted. Unless otherwise
noted, each variable included in the regression had a minimum number of plot observations
(>30). Certain variables found to be important in the literature review were excluded from the
regression due to insufficient observations or unavailability of data. These include access to
credit, weeds, and input prices.
5.3. Description of the Sample
In the 2007/2008 survey seven percent of all long rainy season plots described in the survey
contained rice. Of these 534 rice plots, we had sufficient data on 376 plots from 318 households
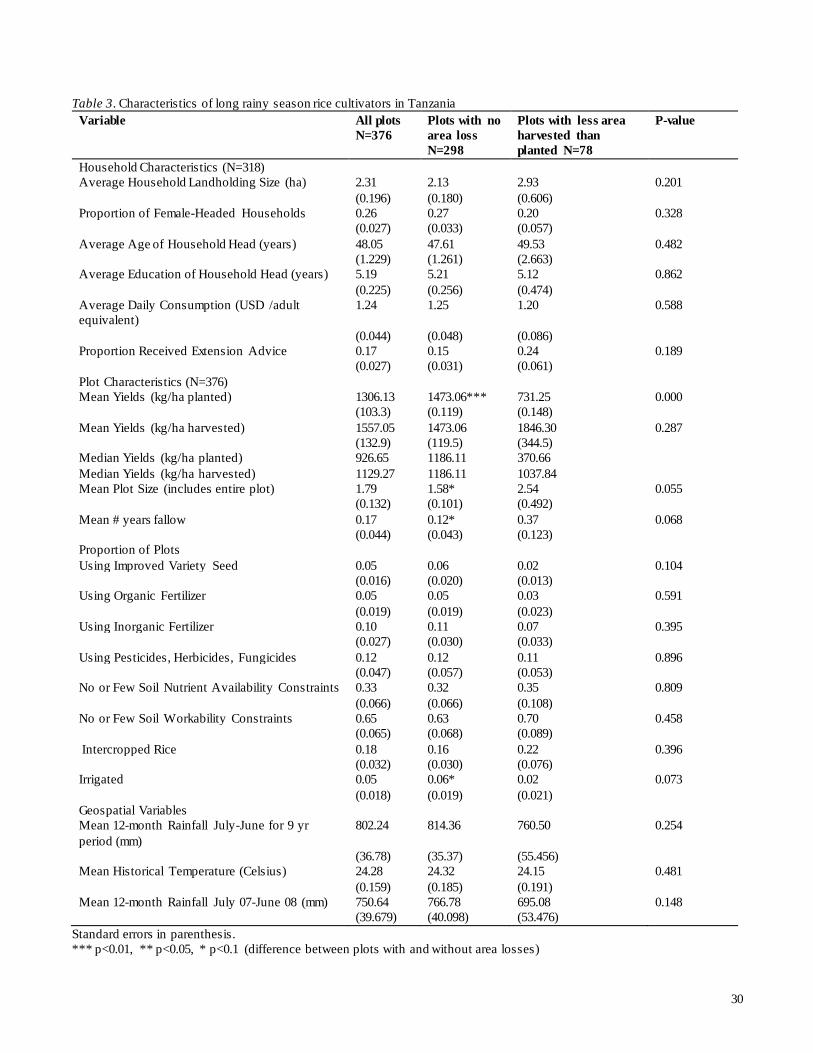
to include in the analysis. Table 3 shows descriptive statistics for the sample in three groups: (1)
for all plots in our sample (N=376), (2) those with losses in area between planting and harvesting
(N=78 plots), and (3) those without area losses (N=298 plots). P-values show the statistical
significance of differences in characteristics between plots with and without area losses.
[TABLE 3 HERE]
18
The average household in the sample had 5.4 members and 2.31 hectares of land. Twenty-six
percent of households were headed by females. The average head of household was 48 years old
and had just over 5 years of education (though 96 household heads reported no formal
education). Mean plot yields of area harvested for the sample were 1557.049 kg/ha (median:
1129.3kg/ha), while mean yield for area planted was 1306.1 kg/ha (median: 926.6 kg/ha). Both
yield measures are substantially less than FAOSTAT’s yield estimate for the year 2008 of 2000
kg/ha.
A minority of plots in the sample had fertilizers or pesticides applied, with 10% using
inorganic fertilizer, 5% using organic fertilizer and 12% using a pesticide, herbicide or fungicide.
Use of improved variety (IV) seeds was also low, with only 5% of plots in the sample planted
with IV seeds. Eighteen percent of the plots were intercropped, although we do not have
information on the planting density of any of the plots. Irrigation was also infrequently reported;
only 5% of plots were irrigated. We found significant differences between plots with area loss
and those without for yield by area planted, proportion irrigated, and number of years the plot
was last left fallow.
The most common reason reported by farmers for a loss in area between planting and
harvesting was drought (see Figure 3).
[FIGURE 3 HERE]
6. Regression Results
Table 4 provides the results from two OLS regressions on the yield of rice plots. The overall
explanatory power of the regressions is slightly higher for the yield measurement by area planted
(Model 2) with an R-squared of 0.497, compared to 0.412 for yield by area harvested (Model 1).
Comparing the models suggests very different policy recommendations arising from an
examination of yields as defined by area planted as opposed to by area harvested. For yield by
area harvested, rainfall, soil nutrient availability, historical temperatures, plot size, household
head education level, labor, and access to ox labor are significantly associated with yield
variation. Based on the results of the analysis of yield by area harvested, interventions that
address abiotic constraints (for example targeting rice interventions in areas that reliably receive
19
sufficient rainfall) and increasing access to labor saving technology, such as ox plows are most
likely (of the drivers) to be associated with higher yields.
Analysis of the alternate yield measure, which replaces area harvested with area planted in
the yield calculation, reveals four additional significant variables: higher than average rainfall,
female head of household, extension advice received by the household, and marketing of rice by
the household. The number of years the plot was left fallow is not significant in this regression.
The other eight significant variables from the area harvested regression are also significant in the
area planted analysis (signs are the same, but levels of significance and size of coefficients
differ).
[TABLE 4 HERE]
As expected, rainfall lower than a nine year average was associated with lower yields in both
models. The effect was stronger in Model 1, where rainfall less than 50 mm below the average
was associated with harvesting an average of 372 kg of rice less than normal rainfall plots.
Rainfall in 2007-2008 was low for many Tanzanian households, 260 of the 376 plots were in
areas that received lower than average rainfall. Alternate models incorporated overall rainfall for
the year, but this variable was not significant, indicating that deviation from expected rainfall
may be more important than amount of rain in areas growing rice. Interventions that decrease
water requirements, improve water efficiency, or provide irrigation may mitigate low rainfall
constraints.
While data from the Harmonized World Soil Data on soil nutrient availability shows that
having no or slight constraints to soil nutrient availability was positively associated with yield in
both models, the coefficient is more than twice as large in Model 1 compared to Model 2. Using
the common yield metric wherein area losses are not included, having no or few soil nutrient
constraints is associated with a 726 kg increase in per-hectare yield, while in Model 2
(accounting for area losses) the association is only 315 kg/ha. This suggests that measuring yield
by area harvested may overestimate the importance of soil nutrient availability relative to other
factors in determining Tanzanian rice yields.
Higher historical temperatures were also associated with lower yields in both models, as
predicted by the literature. Each 0.1 degree Celsius increase in average temperatures was
associated with a decrease of 17.5 kg and 10.9 kg for Model 1 and Model 2, respectively, with a
20
higher level of significance in Model 1. (Note that seed varieties that perform better in warmer
temperatures may improve yields in warmer areas, however our data do not allow differentiation
based on such variety-specific traits). As expected by theory, larger plot sizes were associated
with lower yields in both models. Each additional hectare of land ownership was associated with
a decrease in yields of 317 kg and 271 kg, respectively for Models 1 and Model 2. Though our
results indicate associations, not causality, interventions that encourage better management of
smaller plots may prove more effective in increasing small scale farmer productivity than
interventions that encourage farmers to expand the area under production.
As for demographic variables, each year of formal education received by the household head
is associated with a slightly higher but significant yield (56 kg/ha harvested; 31 kg/ha planted).
(For reference, about one third of farmers reported no formal education (96 out of 318 household
heads); and the average was 5.2 years.) The number of days of household and hired labor was
positive and significant for both models. Each additional day of household labor was associated
with higher yields of about 1 kg/ha in both models. The coefficient for hired labor was roughly
nine times larger than that of household labor. This is consistent with the literature and implies
the importance of additional labor during times when household labor is scarce. Finally, while
the survey did not ask farmers directly whether ox plows were used on rice plots, we used
information about whether households owned or rented oxen or ox implements as a proxy for
animal labor. Plots cultivated by households with access to animal labor had significantly higher
yields than households without oxen or ox implements. While the association was highly
significant in both models, the coefficient was twice the size in Model 1, suggesting measuring
yield by area harvested may overestimate the effect of animal labor. In both models, the
coefficient was large: access to oxen was associated with an increase of 1196 kg/ha harvested
and 643 kg/ ha planted.
6.1 Additional explanatory factors when evaluating yield by area planted:
While the above factors explaining variability in yield are similar in both models, Model 2
(area planted) reveals additional significant variables. Rainfall above 50mm higher than average
is associated with smaller yields by 652 kg/ha. The rainfall results suggest (again extrapolating
generously) that interventions that improve outcomes under high rainfall situations may be as
21
important as those that mitigate consequences of low rainfall. The coefficient for high rainfall
was larger and more significantly associated with lower yields than low rainfall, though high
rainfall was much less common in 2007-08 (29 out of 376 plots) than low rainfall (260 out of
376 plots). Evaluating yields by area harvested underestimates the detrimental effects of high
rainfall, perhaps because flooding can wash away entire areas of the plot, which would then not
be considered in area harvested.
Measures of yield by area planted also have implications for female-headed households:
female-headed households were associated with yields 212 kg/ha lower than male headed
households in Model 2 (while the coefficient was insignificant in Model 1). The negative
association between female heads of household and lower rice yields may indicate constraints
faced by female-headed households not accounted for elsewhere in the model. Gender sensitive
interventions and additional research into the constraints faced by female headed households
could improve yields for these households.
Unexpectedly, households that received extension advice produced yields 251 kg/ha lower
than other households. While this analysis does not provide an explanation for that finding, it is
possible that farmers are incompletely implementing advice, for example using fertilizers
without adequate irrigation, leading to poor outcomes. Alternatively, the farmers receiving
extension services may have less experience or exhibit other characteristics (such as low
production that is being deliberately targeted by extension agents) that affect their productivity.
Finally, the effect of market access is amplified when yield by area planted is considered.
Households that sold rice produced yields 572 kg/ha higher than households that did not market
their harvest. The large and highly significant coefficient for selling rice suggests two
possibilities. Farmers may be more likely to choose to sell rice when they harvest the amount
they expected to harvest at planting (i.e., they have no area losses). Alternatively, market
oriented farmers may be less likely to experience area losses, due to better land or management
practices.
7. Conclusions
Small scale rice farmers in Tanzania regularly harvest yields far below the world average. To
increase production, yield constraints must be accurately identified and remedied. But to increase
22
productivity there is an additional need to recognize differences in farming practices and
growing conditions that vary widely across farming systems, across agro-ecological zones, and
across levels of poverty (Waddington et al., 2010). The latest Tanzanian NPS data show
smallholder yields continue to differ drastically from national trends not only for rice, but also
for maize and millet (where yields of the most productive 5% of farmers are up to four times
greater than the median). Such disconnects may well imply “yield gaps” yet to be overcome, but
they may also imply that the simple kg/ha measures used to track national production in the past
are not working to track smallholder progress today.
The continued reliance on harvested yield as the primary indicator of agricultural
productivity is all the more troubling because over time the sources of yield data have, in many
ways, become even more suspect (Jerven, 2014) with both national and industry reports of yield
data coming under increasing scrutiny (Sandefur & Glassman, 2015). The results of this analysis
suggest the choice to measure rice yields using area harvested rather than area planted provides
very different estimates of mean agricultural productivity and, moreover, analyses based on those
different results will lead to different conclusions regarding factors that explain yield variability.
In our sample of Tanzanian rice farmers, smallholders harvested less than the area they planted
on 23% of the sample plots. Farmers reported area losses even more frequently for other crops in
the Tanzania NPS (e.g., maize, sorghum, or wheat), suggesting discrepancies between alternative
yield calculations may be even larger. Findings suggest a need to better specify yield measures in
published findings, with yield by area planted offering a more accurate indication of where
investments are most needed to improve smallholder productivity.
Such measurement inconsistencies alone should make us question the common yield metric.
But perhaps even more fundamental are the missing pieces of a simple “kg/ha” proxy relative to
the more complex smallholder farm productivity we intend to track. Common crop yield has
been increasingly criticized in social and environmental segments of the research community
(Cassidy et al., 2013), in large part because the numerator and denominator of yield (kilograms
and hectares) don't allow for direct consideration of benefits outside of weight harvested, or costs
outside the (implicit) cost of land. The specific example of intercropping – especially common
among smallholder subsistence and women farmers – is an important example. Intercropping
involves growing multiple crops interwoven on a single piece of land. But common yield’s
23
“kilograms of crop X per hectare harvested” precludes the possibility of incorporating intercrops
into productivity estimates, despite the potential dietary diversity, soil nutrient, and risk
management benefits afforded by multiple crops (Khan et al., 2014).
Similarly the costs of household labor, hired labor, purchased fertilizer, and environmental
damages from different farm practices are all excluded from the common yield measure – as,
therefore, are changes in the relative value of these inputs year-to-year. From a farm income
perspective this is a potential concern, since there is no guarantee that the highest-yielding
management strategy (in total kg/ha) is also the highest profit-generating strategy (in net kg/$).
From a societal perspective, defining "success" in terms of common crop yield similarly means
that project evaluations can only consider labor, social and environmental costs secondarily
(Tittonell & Giller, 2013). These are not caveats to an otherwise fine measure – they are
fundamental flaws with real repercussions.
There is an urgent need to better specify productivity measures in agricultural initiatives and
scientific studies purporting to target smallholder productivity. Calculating yield by area planted
is a first step towards a more accurate accounting of agricultural productivity to help prioritize
investments for the most marginal farmers. But if the goal is more than crop output alone – if it
includes improved nutrition, higher incomes, and lower risk among all rural poor – then the
agricultural development community requires an even broader set of measures that better reflect
that goal.
References
Abo, M., Sy, A., Alegbejo, M., 1997. Rice yellow mottle virus (RYMV) in Africa: Evolution,
distribution, economic significance on sustainable rice production and management strategies. J.Sust. Agric., 11(2-3), 85-111.
Adigun, J., Lagoke, S., Adekpe, I., 2005. Efficacy of selected herbicides for weed control in rain-fed upland rice in the Nigerian Northern Guinea Savanna. Agricultura Tropica et Subtropica, 38(3-4), 99-106.
Agboh-Noameshie, A., Kinkingninhoun-Medagbe, F., Diagne, A., 2007. Gendered impact of NERICA adoption on farmers’ production and income in Central Benin. AAAE Second
International Conference: Agricultural Growth, Poverty Reduction and Millennium Development Goals in Africa (pp. 189-191), Nairobi.
Ahmed, S., Diffenbaugh, N., Hertel, T., Lobell, D., Ramankutty, N., Rios, A., Rowhani, P.,
2011. Climate volatility and poverty vulnerability in Tanzania. Glob. Env. Change, 21, 46-55.
24
Alston, J.M., Beddow, J.M., & Pardey, P.G. 2010. Global patterns of crop yields and other
partial productivity measures and prices. Balasubramanian, V., Sie, M., Hijmans, R., Otsuka, K., 2007. Increasing rice production in Sub-
Saharan Africa: Challenges and opportunities. Adv.Agro., 94, 55-133. Banwo, O., 2002. Management of major insect pests of rice in Tanzania. Plant Prot. Sci., 38(3),
108-113.
Banwo, O., Makundi, R., Abdallah, R., 2002. Rice yellow mottle virus (RYMV) incidence and abundance of vectors in sequentially cropped lowland rice in Tanzania. Arch.
Phytopathology Plant Prot., 35(3), 171-180. Banwo, 2003. Rice Yellow Mottle Virus (RYMV) Disease: A national problem in Tanzania.
Acta Phytopathologica et Entomologica Hungarica, 38 (1-2).
Becker, M., Johnson, D. E., 1999. The role of legume fallows in intensified upland rice-based systems of West Africa. Nutrient Cycl. Agroecosystems, 53(1), 71-81.
Becker, M., Johnson, D. E., 2001. Cropping intensity effects on upland rice yield and sustainability in West Africa. Nutrient Cycl. Agroecosystems, 59(2), 107-117.
Becker, M., Johnson, D. E., Wopereis, M., Sow, A., 2003. Rice yield gaps in irrigated systems
along an agro-ecological gradient in West Africa. J. Plant Nutr. Soil Sci., 166(1), 61-67. Benin, S., Kennedy, A., Lambert, M., McBride, L., 2010. Monitoring African agricultural
development processes and performance: A comparative analysis. ReSAKSS Annual Trends
Outlook Report. International Food Policy Research Institute, Washington, DC. Buah, S., Nutsugah, S., Kanton, R., Atokple, D., Dogbe, W., Karikari, A., Wiredu, A., et al.,
2011. Enhancing farmers’ access to technology for increased rice productivity in Ghana. Af. J. Agric. Res., 6(19), 4455-4466.
Bucheyeki, T. L., Shennkalwa, E., Kadadi, D., Lobulu, J., 2011. Assessment of rice production
constraints and farmers preferences in Nzega and Igunga districts. J. Advances Dev. Res., 2(1), 30-37
Carletto, C., Jolliffe, D., Banerjee, R., 2015. From tragedy to renaissance: improving agricultural data for better policies. J Dev Studies, 51(2), 133-148.
Cassidy, E.S., 2013. Redefining agricultural yields: from tons to people nourished by hectare.
Environ. Res. Let., 8(3), 3. Cassman, K., 1999. Ecological intensification of cereal production systems: Yield potential, soil
quality, and precision agriculture. Proc. Nat. Acad. Sci., 96(11), 5952-5959. Casley, D.J., Kumar, K., 1988. The Collection, Analysis, and Use of Monitoring and Evaluation
Data. World Bank / John Hopkins University Press.
Ceesay, M., Uphoff, N., 2006. The effects of repeated soil wetting and drying on lowland rice yield with System of Rice Intensification (SRI) methods. Int. J. Agric. Sustainability, 4.
Conway, G., 2012. One Billion Hungry: Can We Feed the World? Cornell University Press: Ithaca, NY.
Craig, B.J., Pardey, P.G., & Roseboom, J. 1997. International productivity patterns: accounting
for input quality, infrastructure, and research. American Journal of Agricultural Economics, 79(4), 1064-1076.
Eboh, E. C., Okeibunor, J. C., 2005. Malaria prevalence and impact on farm household labour use and productivity in the irrigated rice production system of Omor community, Nigeria. Tanzania Health Res. Bulletin, 7(1), 7-15.
25
Ehui, S., Pender, J., 2005. Resource degradation, low agricultural productivity, and poverty in
Sub-Saharan Africa: Pathways out of the spiral. Agric. Econ., 30(s1), 225-242.). Epidi, T. T., Bassey, A. E., Zuofa, K., 2008. Influence of intercrops on pests’ populations in
upland rice (Oryza sativa L.). Af. J. Env. Sci. Tech., 2(12), 438-441. Evans School Policy Analysis & Research Group (EPAR), 2013. Integrated Surveys on
Agriculture, United Republic of Tanzania: Intercropping. EPAR Research Brief No. 216.
Farooq, M., Kobayashi, N., Wahid, A., Ito, O., Basra, S., 2009. Strategies for producing more rice with less water. Advances Agro., 101, 351-388.
Fermont, A., Benson, T., 2011. Estimating Yield of Food Crops Grown by Smallholder Farmers. International Food Policy Research Institute.
Fofana, B., Rauber, R., 2002. Weed suppression ability of upland rice under low-input conditions
in West Africa. Weed Res., 40(3), 271-280. Food and Agriculture Organization of the United Nations (FAO), 2014. “About FAO.” FAO,
Rome. Fuglie, K. O. 2008. Is a slowdown in agricultural productivity growth contributing to the rise in
commodity prices? Agricultural Economics, 39(s1), 431-441.
Hatibu, N., Mutabazi, K., Senkondo, E., Msangi, A. (2006). Economics of rainwater harvesting for crop enterprises in semi-arid areas of East Africa. Agricultural Water Management, 80, 74-86.
IUSS Working Group, 2006. World Reference Base for Soil Resources. World Soil Resources Report No.103. Rome.
Jerven, M., 2014. The political economy of agricultural statistics and input subsidies. J. Agrarian Change, 14(1), 129-145.
Kafiriti, E. M., Dondeyne, S., Msomba, S., Deckers, J., Raes, D., 2003. Coming to grips with
farmers’ variety selection - the case of new improved rice varieties under irrigation in south east Tanzania. Tropicultura, 21(4), 211-217.
Kanyeka, Z. L., Kibanda, J. M., Msomba, S. W., 2004. TXD85 and line 88: New high-yielding varieties with acceptable grain quality in Tanzania. Int. Rice Res. Notes, 29(1), 29-30.
Kanyeka, Z., Msomba, S., Kihupi, A., & Penza, M., 1994. Rice ecosystems in Tanzania:
Characterization and classification. Res. Training Newsletter, 9(1-2), 13-15. Kanyeka, Z., Sangu, E., Fargette, D., Pinel-Galzi, A., Hérbrard, E., 2007. Distribution and
diversity of local strains of rice yellow mottle virus in Tanzania. Af. Crop Sci. Society, 15(4), 201-209.
Khan, Z. R., 2014. Achieving food security for one million sub-Saharan African poor through
push–pull innovation by 2020. Phil. Trans. Royal Soc. B, 369(1639), 20120284. Kiagho, E., Hatibu, N., Mahoo, H., Gowing, J., 2004. Tanzanian Country Report. London.
Retrieved from http://www.dfid.gov.uk/r4d/PDF/Outputs/Forestry/R7937_-_Tanzanian_country_report.pdf
Kijima, Y., Sserunkuuma, D., Otsuka, K., 2006. How revolutionary is the “NERICA
revolution”? Evidence from Uganda. Dev. Econ., 44(2), 252-267. Kimhi, A., 2006. Plot size and maize productivity in Zambia: Is there an inverse relationship?
Agric. Econ., 35(1), 1-9.
26
Kinkingninhoun-Medagbe, F., Diagne, A., Simtowe, F., Agboh-Noameshie, A., Adegbola, P.,
2010. Gender discrimination and its impact on income, productivity, and technical efficiency: evidence from Benin. Agric. Human Values, 27(1), 57-69.
Krupnik, T. J., Rodenburg, J., Haden, V. R., Mbaye, D., Shennan, C., 2012. Genotypic trade-offs between water productivity and weed competition under the System of Rice Intensification in the Sahel. Agric. Water Management, 115, 156-166.
Lobell, D. B., Cassman, K. G., Field, C. B., 2009. Crop yield gaps: their importance, magnitudes, and causes. Ann. Rev. Env. Res., 34(1), 179-204.
Luzi-Kihupi, A., Zakayo, J., Tusekelege, H., Mkuya, M., Kibanda, N., Khatib, K., Maerere, A., 2009. Mutation breeding for rice improvement in Tanzania. In Q. Y. Shu (Ed.), Induced Plant Mutations in the Genomics Era (pp. 385-387). Rome: Food and Agriculture Organization of
the United Nations. Retrieved from http://umc.edu.dz/vf/images/art-3511/i0956e.pdf McDonald, A. J., Hobbs, P. R., Riha, S. J., 2006. Does the system of rice intensification
outperform conventional best management?: A synopsis of the empirical record. Field Crops Res., 96(1), 31-36.
Meertens, H. C. C., 2003. The prospects for integrated nutrient management for sustainable
rainfed lowland rice production in Sukumaland, Tanzania. Nutrient Cycling Agroecosystems, 65, 163-171.
Meertens, H. C. C., Kajiru, G. J., Ndege, L. J., Enserink, H. J., Brouwer, J. (2003). Evaluation of
on-farm soil fertility research in the rainfed lowland rice fields of Sukumaland, Tanzania. Exp. Agric., 39(1), 65-79.
Meertens, H. C. C., Ndege, L. J., Lupeja, P. M. 1999. The cultivation of rainfed, lowland rice in Sukumaland, Tanzania. Agric., Ecosystems Env., 76, 31-45.
Mghase, J. J., Shiwachi, H., Nakasone, K., Takahashi, H., 2010. Agronomic and socio-economic
constraints to high yield of upland rice in Tanzania. Af. J. Agric. Res., 5(2), 150-158. Minot, N., 2010. Staple Food Prices in Tanzania. Variation in Staple Food Prices: Causes and
Consequences and Policy Options. African Agricultural Marketing Project: Maputo, Mozambique.
Mowo, J., Janssen, B., Oenema, O., German, L., Mrema, J., Shemdoe, R., 2006. Soil fertility
evaluation and management by smallholder farmer communities in northern Tanzania. Agric., Ecosystems Env., 116, 47-59.
Msomba, S., Kibanda, J., Penza, H., Tusekelege, H., Mkuya, M., Kafiriti, E., Mbapili, J. C., et al., 2004. TXD306--A high-yielding and medium-maturing aromatic rice for the rainfed lowland and irrigated ecosystems in Tanzania. Int. Rice Res. Notes, 29(1), 30-31.
Mwakalila, S., 2006. Socio-economic impacts of irrigated agriculture in Mbarali District of south-west Tanzania. Physics Chem. Earth, Parts A/B/C, 31(15-16), 876-884.
Mwaseba, D. L., 2005. Impact of agricultural research: A study of on-farm development effects of agricultural research in Southern Highlands and Eastern Zones of Tanzania. Development. Norwegian University of Life Sciences. Retrieved from
http://www.umb.no/statisk/noragric/publications/phdtheses/dismas_fulltext_thesis.pdf Nakano, Y., Bamba, I., Diagne, A., Otsuka, K., Kajisa, K., 2011. The possibility of a rice green
revolution in large-scale irrigation schemes in Sub-Saharan Africa. Washington, D.C. Retrieved from http://www-
27
wds.worldbank.org/servlet/WDSContentServer/WDSP/IB/2011/02/07/000158349_20110207
101601/Rendered/PDF/WPS5560.pdf Nakano, Y., Kajisa, K., 2011. The impact of access to credit and training on technology
adoption: A case of the rice sector in Tanzania. Agricultural & Applied Economics Associations 2011 AAEA & NAREA Joint Annual Meeting. Pittsburgh. Retrieved from http://ageconsearch.umn.edu/bitstream/103763/2/Nakano and Kajisa2011_110705.pdf
Nakano, Y., Kajisa, K., 2012. How does the Adoption of Modern Variety increase Productivity and Income?: A Case of the Rice Sector in Tanzania. Agricultural & Applied Economics
Associations 2012 Annual Meeting. (No. 124924). Seattle. National Sample Census of Agriculture 2002/2003, Crop Sector - National Report. (2006). Dar
es Salaam. Retrieved from
http://harvestchoice.org/sites/default/files/downloads/publications/Tanzania_2002-03_Vol2-.pdf
Ndakidemi, P., Semoka, J., 2006. Soil fertility survey in Western Usambara Mountains, northern Tanzania. Pedosphere, 16(2), 237-244.
Nwilene, F., Agunbiade, T., Togola, M., Youm, O., Ajayi, O., Oikey, S., Ofodile, S., et al., 2008.
Efficacy of traditional practices and botanicals for the control of termites on rice at Ikenne, southwest Nigeria. Int. J. Tropical Insect Sci., 28(1), 37-44.
Oikeh, S., Nwilene, F., Diatta, S., Toure, A., Okeleye, K., 2007. Responses of upland NERICA
rice to nitrogen and phosphorus in forest agroecosystems. Agro. J., 100(3), 735-741. Oikeh, S., Toure, A., Sidibe, B., Niang, A., Semon, M., Sokei, Y., Mariko, M., 2009. Responses
of upland NERICA rice varieties to nitrogen and plant density. Arch. Agro. Soil Sci., 55(3), 301-314.
Oladeebo, J., Fajuyigbe, A., 2007. Technical efficiency of men and women upland rice farmers
in Osun State, Nigeria. J. Human Ecology, 22(2), 93-100. Oladokun, M., Ennos, A., 2006. Structural development and stability of rice Oryza sativa L. var.
NERICA 1. J. Exp. Botany, 57(12), 3123-3130. Oyewole, C., Ajayi, O., Ojuekaiye, R., 2010. Evaluation of seven upland rice (Oryzae sativa)
cultivars sown by three methods in Anyigba, Kogi State, Nigeria. Af. J. Agric. Res., 5(16),
2089-2096. Peterman, A., Quisumbing, A., Behrman, J., Nkonya, E., 2011. Understanding the complexities
surrounding gender differences in agricultural productivity in Nigeria and Uganda. J. Dev. Stud., 47(10), 1482-1509.
Poatea, D., 1988. A review of methods for measuring crop production from smallholder
producers, Exper. Agric., 24:1-14 Cambridge University Press. Raes, D., Kafiriti, E. M., Wellens, J., Deckers, J., Maertens, A., Mugogo, S., Dondeyne, S., et al.,
2007. Can soil bunds increase the production of rain-fed lowland rice in south eastern Tanzania? Agric. Water Management., 89, 229-235.
Reynolds, T.W., Waddington, S., Anderson, C.L., Chew, A., True, Z., Cullen, A., 2015
Environmental impacts and constraints associated with the production of major food crops in Sub-Saharan Africa and South Asia. Food Security, in press.
Reynolds, T.W., Huber, C.H., Farley, J., 2010. Investing in human and natural capital: An alternative paradigm for sustainable development in Awassa, Ethiopia. Ecol. Econ., 69(11), 2140-2150.
28
Riches, C., Mbwaga, A., Mbapila, J., Ahmed, G., Harris, D., Richards, J., Silverside, P., et al.,
2005. Improved weed management delivers increased productivity and farm incomes from rice in Bangladesh and Tanzania. Aspects Applied Bio., 75, 127-138.
Rowhani, P., Lobell, D. B., Linderman, M., Ramankutty, N., 2011. Climate variability and crop production in Tanzania. Agric. For. Meteor., 151(4), 449-460.
Saito, K., Azoma, K., Sie, M., 2010. Grain yield performance of selected lowland NERICA and
modern Asia rice genotypes in West Africa. Crop Sci., 50(1), 281-291. Sakurai, T., 2006. Intensification of rainfed lowland rice production in West Africa: Present
status and potential green revolution. Dev. Econ., 44(2), 232-251. Sandefur, J., Glassman, A., 2015. The political economy of bad data: evidence from African
survey and administrative statistics. J. Dev. Studies, 51(2), 116-132.
Somado, E., Guei, R., Keya, S. (Eds.)., 2008. NERICA: The New Rice for Africa - A Compendium. Cotonou, Benin: WARDA.
Therkildsen, O., 2011. Policy Making and Implementation in Agriculture: Tanzania’s Push for Irrigated Rice. Copenhagen.
Tiamiyu, S., Akintola, J., Rahji, M., 2009. Technology adoption and productivity difference
among growers of New Rice for Africa in savanna zone of Nigeria. Tropicultura, 27(4), 193-197.
Tilahun, T., Minale, L., Alemayehu, A., Zelalem, T., 2007. Comparison of transplanting and
direct dry seeding of rice in Fogera plain. In A. Ermias, T. Akalu, A. Alemayehu, W. Melaku, T. Tilahun, & B. Wondimu (Eds.), Proceedings of the 2nd Annual Regional
Conference on Completed Crop Research Activities (pp. 41-47). Bahir Dar, Ethiopia: Amhara Regional Agricultural Research Institute.
Tittonell, P., Giller, K. E., 2013. When yield gaps are poverty traps: ecological intensification in
African smallholder agriculture. Field Crops Res. 143, 76-90. Udry, C., Hoddinott, J., Alderman, H., Haddad, L., 1995. Gender differentials in farm
productivity: Implications for household efficiency and agricultural policy. Food Policy, 20(5), 407-423.
U.S. Agency for International Development (USAID). “Feed the Future.” USAID, Washington
DC. Waddington, S. R., Li, X., Dixon, J., Hyman, G., de Vicente, M. C., 2010. Getting the focus
right: Production constraints for six major food crops in Asian and African farming systems. Food Security, 2(1), 27-48.
29
Tables and Figures
Table 1. Sources of yield data and inconsistent reporting of yield calculations in published scholarship
Citation Yield Data Source Yield Calculation
Ahmed, S., Diffenbaugh, N., Hertel, T., Lobell, D., Ramankutty, N., Rios,
A., Rowhani, P. (2011). farmers' fields area harvested
Becker, M., Johnson, D. E., Wopereis, M., Sow, A. (2003). farmers' fields not specified
Adigun, J., Lagoke, S., Adekpe, I. (2005). research station
experiment not specified
Agboh-Noameshie, A., Kinkingninhoun-Medagbe, F., Diagne, A. (2007). farmers' fields not specified
Kafiriti, E. M., Dondeyne, S., Msomba, S., Deckers, J., Raes, D. (2003). farmers' fields not specified
Kanyeka, Z. L., Kibanda, J. M., Msomba, S. W. (2004). on-farm trials not specified
Becker, M., Johnson, D. E. (1999). farmers' fields and a
research farm not specified
Becker, M., Johnson, D. E. (2001). farmers' fields not specified
Buah, S., Nutsugah, S., Kanton, R., Atokple, D., Dogbe, W., Karikari, A.,
Wiredu, A., et al. (2011). farmers' fields not specified
Bucheyeki, T. L., Shennkalwa, E., Kadadi, D., Lobulu, J. (2011). farmer interviews not specified
Ceesay, M., Uphoff, N. (2006). research station
experiment not specified
Lobell, D. B., Cassman, K. G., Field, C. B. (2009). N/A not specified
Meertens, H. C. C. (2003). literature review not specified
Table 2. Comparison of reported 2008 Tanzanian rice yields
Source/Year Method of Yield Measurement Rice Yield
(kg/hectare)
Measurement notes
FAOSTAT 2008 Quantity harvested / area harvested 1726.322
TPNS 2007/2008 Quantity harvested / area harvested 1290 kg/ha Long Rainy Season; includes some
observations excluded from our analysis
TPNS 2007/2008 Quantity harvested / area planted 1040 kg/ha Long Rainy Season; includes some
observations excluded from our analysis
NBS Agricultural
Census 2007/2008 Quantity harvested / area planted 1600 kg/ha
Long Rainy Season; excludes commercial
farms
30
Table 3. Characteristics of long rainy season rice cultivators in Tanzania
Variable All plots
N=376
Plots with no
area loss
N=298
Plots with less area
harvested than
planted N=78
P-value
Household Characteristics (N=318)
Average Household Landholding Size (ha) 2.31 2.13 2.93 0.201
(0.196) (0.180) (0.606)
Proportion of Female-Headed Households 0.26 0.27 0.20 0.328
(0.027) (0.033) (0.057)
Average Age of Household Head (years) 48.05 47.61 49.53 0.482
(1.229) (1.261) (2.663)
Average Education of Household Head (years) 5.19 5.21 5.12 0.862
(0.225) (0.256) (0.474)
Average Daily Consumption (USD /adult
equivalent)
1.24 1.25 1.20 0.588
(0.044) (0.048) (0.086)
Proportion Received Extension Advice 0.17 0.15 0.24 0.189
(0.027) (0.031) (0.061)
Plot Characteristics (N=376)
Mean Yields (kg/ha planted) 1306.13 1473.06*** 731.25 0.000
(103.3) (0.119) (0.148)
Mean Yields (kg/ha harvested) 1557.05 1473.06 1846.30 0.287
(132.9) (119.5) (344.5)
Median Yields (kg/ha planted) 926.65 1186.11 370.66
Median Yields (kg/ha harvested) 1129.27 1186.11 1037.84
Mean Plot Size (includes entire plot) 1.79 1.58* 2.54 0.055
(0.132) (0.101) (0.492)
Mean # years fallow 0.17 0.12* 0.37 0.068
(0.044) (0.043) (0.123)
Proportion of Plots
Using Improved Variety Seed 0.05 0.06 0.02 0.104
(0.016) (0.020) (0.013)
Using Organic Fertilizer 0.05 0.05 0.03 0.591
(0.019) (0.019) (0.023)
Using Inorganic Fertilizer 0.10 0.11 0.07 0.395
(0.027) (0.030) (0.033)
Using Pesticides, Herbicides, Fungicides 0.12 0.12 0.11 0.896
(0.047) (0.057) (0.053)
No or Few Soil Nutrient Availability Constraints 0.33 0.32 0.35 0.809
(0.066) (0.066) (0.108)
No or Few Soil Workability Constraints 0.65 0.63 0.70 0.458
(0.065) (0.068) (0.089)
Intercropped Rice 0.18 0.16 0.22 0.396
(0.032) (0.030) (0.076)
Irrigated 0.05 0.06* 0.02 0.073
(0.018) (0.019) (0.021)
Geospatial Variables
Mean 12-month Rainfall July-June for 9 yr
period (mm)
802.24 814.36 760.50 0.254
(36.78) (35.37) (55.456)
Mean Historical Temperature (Celsius) 24.28 24.32 24.15 0.481
(0.159) (0.185) (0.191)
Mean 12-month Rainfall July 07-June 08 (mm) 750.64 766.78 695.08 0.148
(39.679) (40.098) (53.476)
Standard errors in parenthesis.
*** p<0.01, ** p<0.05, * p<0.1 (difference between plots with and without area losses)
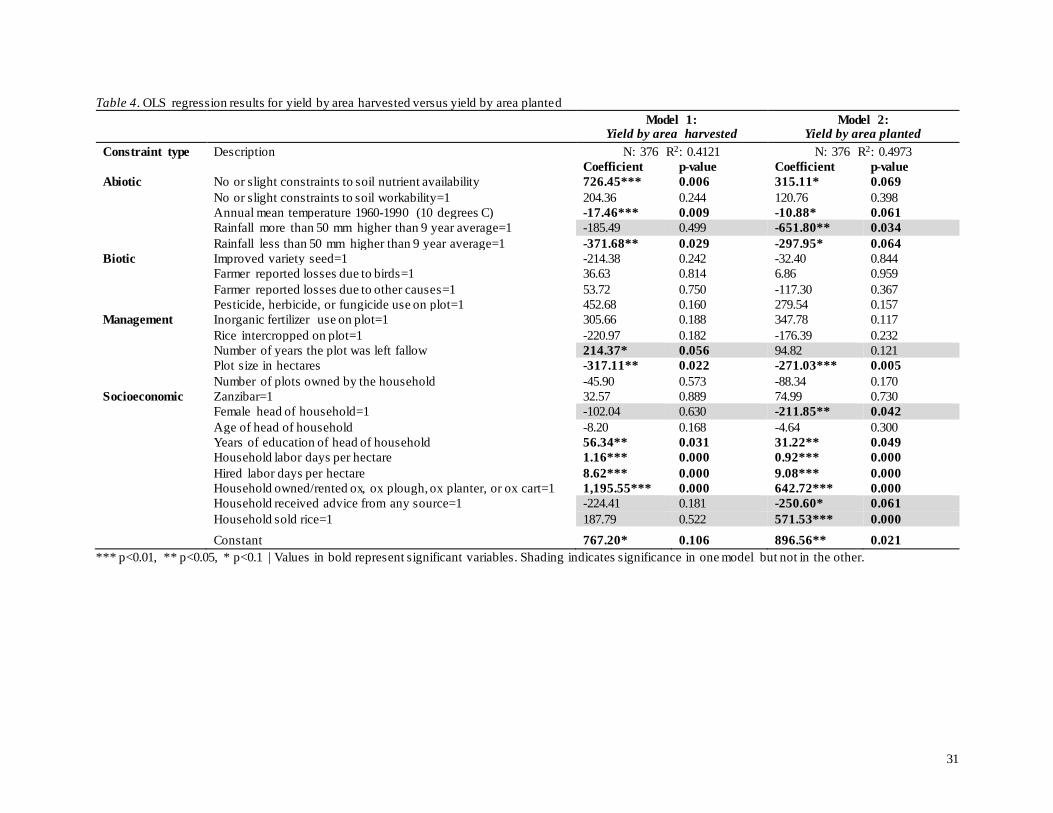
31
Table 4. OLS regression results for yield by area harvested versus yield by area planted
Model 1: Yield by area harvested
Model 2: Yield by area planted
Constraint type Description N: 376 R2: 0.4121 N: 376 R2: 0.4973
Coefficient p-value Coefficient p-value
Abiotic No or slight constraints to soil nutrient availability 726.45*** 0.006 315.11* 0.069
No or slight constraints to soil workability=1 204.36 0.244 120.76 0.398
Annual mean temperature 1960-1990 (10 degrees C) -17.46*** 0.009 -10.88* 0.061
Rainfall more than 50 mm higher than 9 year average=1 -185.49 0.499 -651.80** 0.034
Rainfall less than 50 mm higher than 9 year average=1 -371.68** 0.029 -297.95* 0.064
Biotic Improved variety seed=1 -214.38 0.242 -32.40 0.844
Farmer reported losses due to birds=1 36.63 0.814 6.86 0.959
Farmer reported losses due to other causes=1 53.72 0.750 -117.30 0.367
Pesticide, herbicide, or fungicide use on plot=1 452.68 0.160 279.54 0.157
Management Inorganic fertilizer use on plot=1 305.66 0.188 347.78 0.117
Rice intercropped on plot=1 -220.97 0.182 -176.39 0.232
Number of years the plot was left fallow 214.37* 0.056 94.82 0.121
Plot size in hectares -317.11** 0.022 -271.03*** 0.005
Number of plots owned by the household -45.90 0.573 -88.34 0.170
Socioeconomic Zanzibar=1 32.57 0.889 74.99 0.730
Female head of household=1 -102.04 0.630 -211.85** 0.042
Age of head of household -8.20 0.168 -4.64 0.300
Years of education of head of household 56.34** 0.031 31.22** 0.049
Household labor days per hectare 1.16*** 0.000 0.92*** 0.000
Hired labor days per hectare 8.62*** 0.000 9.08*** 0.000
Household owned/rented ox, ox plough, ox planter, or ox cart=1 1,195.55*** 0.000 642.72*** 0.000
Household received advice from any source=1 -224.41 0.181 -250.60* 0.061
Household sold rice=1 187.79 0.522 571.53*** 0.000
Constant 767.20* 0.106 896.56** 0.021
*** p<0.01, ** p<0.05, * p<0.1 | Values in bold represent significant variables. Shading indicates significance in one model but not in the other.
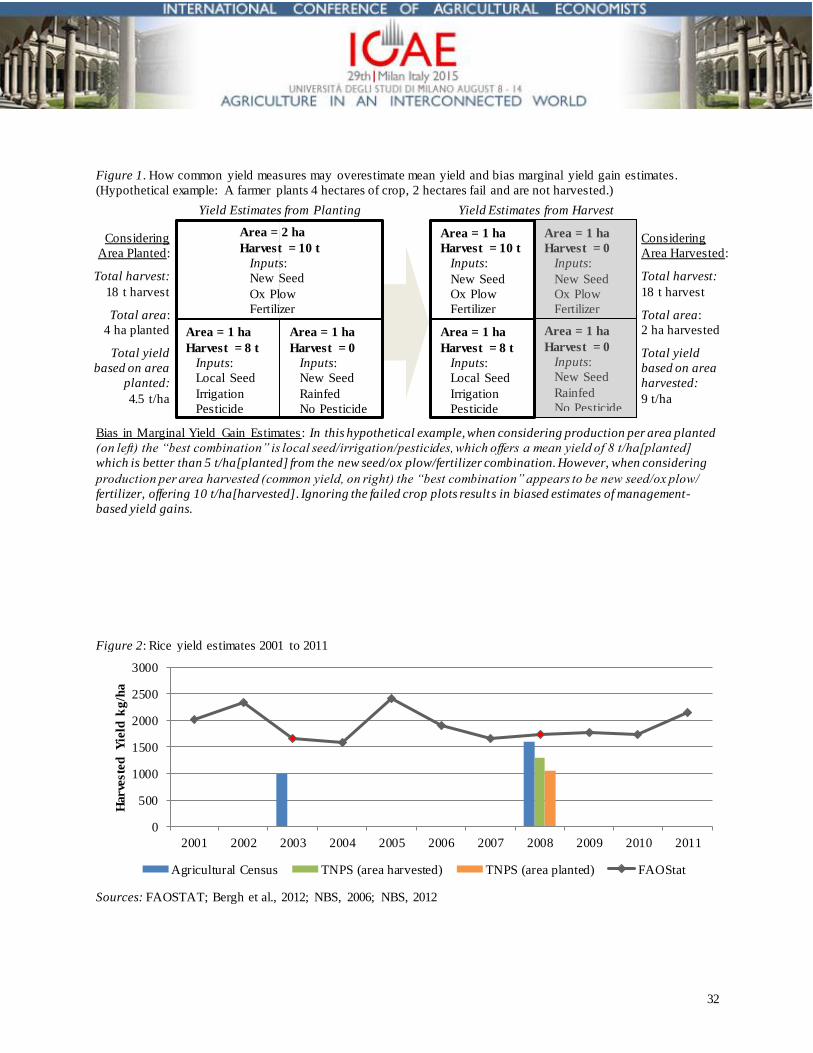
32
Figure 1. How common yield measures may overestimate mean yield and bias marginal yield gain estimates.
(Hypothetical example: A farmer plants 4 hectares of crop, 2 hectares fail and are not harvested.)
Yield Estimates from Planting Yield Estimates from Harvest
Bias in Marginal Yield Gain Estimates: In this hypothetical example, when considering production per area planted
(on left) the “best combination” is local seed/irrigation/pesticides, which offers a mean yield of 8 t/ha[planted]
which is better than 5 t/ha[planted] from the new seed/ox plow/fertilizer combination. However, when considering
production per area harvested (common yield, on right) the “best combination” appears to be new seed/ox plow/
fertilizer, offering 10 t/ha[harvested]. Ignoring the failed crop plots result s in biased estimates of management-
based yield gains.
Figure 2: Rice yield estimates 2001 to 2011
Sources: FAOSTAT; Bergh et al., 2012; NBS, 2006; NBS, 2012
0
500
1000
1500
2000
2500
3000
2001 2002 2003 2004 2005 2006 2007 2008 2009 2010 2011
Harve
ste
d
Yie
ld k
g/h
a
Agricultural Census TNPS (area harvested) TNPS (area planted) FAOStat
Area = 2 ha
Harvest = 10 t
Inputs:
New Seed
Ox Plow
Fertilizer
Area = 1 ha
Harvest = 8 t
Inputs:
Local Seed
Irrigation
Pesticide
Area = 1 ha
Harvest = 0
Inputs:
New Seed
Rainfed
No Pesticide
Area = 1 ha
Harvest = 10 t
Inputs:
New Seed
Ox Plow
Fertilizer
Area = 1 ha
Harvest = 0
Inputs:
New Seed
Ox Plow
Fertilizer
Area = 1 ha
Harvest = 8 t
Inputs:
Local Seed
Irrigation
Pesticide
Area = 1 ha
Harvest = 0
Inputs:
New Seed
Rainfed
No Pesticide
Considering
Area Planted:
Total harvest:
18 t harvest
Total area:
4 ha planted
Total yield
based on area
planted:
4.5 t/ha
Considering
Area Harvested:
Total harvest:
18 t harvest
Total area:
2 ha harvested
Total yield
based on area
harvested:
9 t/ha
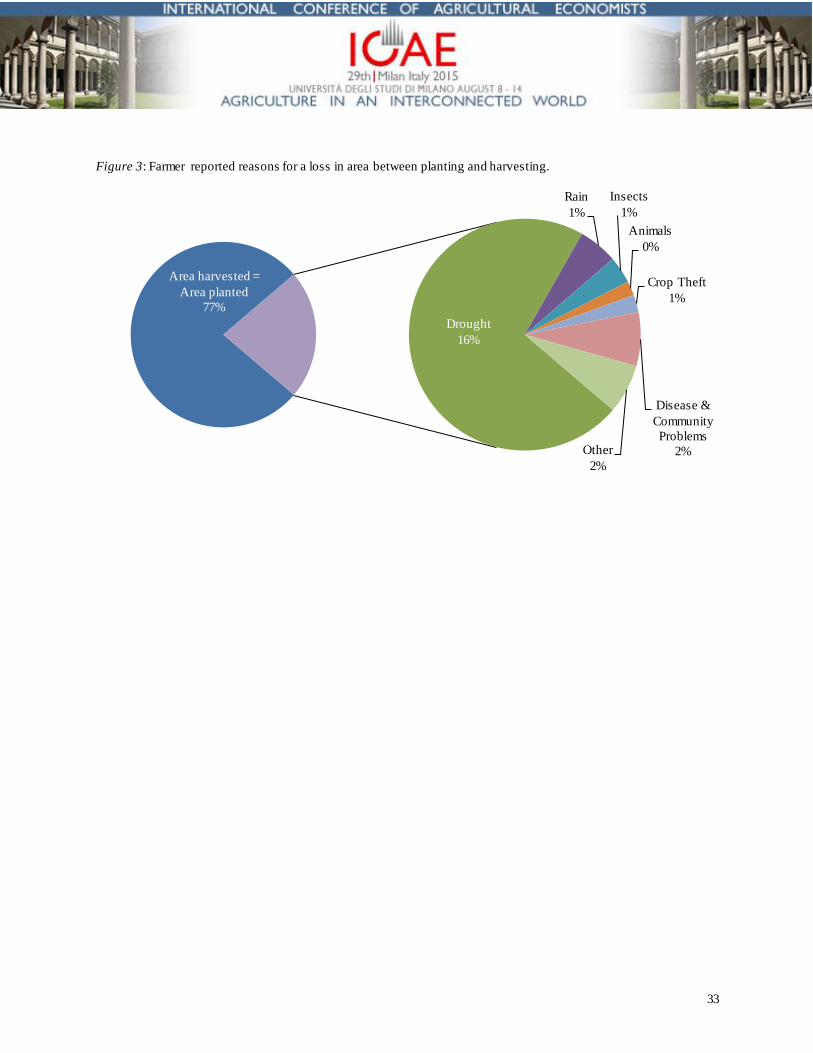
33
Figure 3: Farmer reported reasons for a loss in area between planting and harvesting.
Area harvested =
Area planted
77%
Drought
16%
Rain
1%
Insects
1%
Animals
0%
Crop Theft
1%
Disease &
Community
Problems
2%Other
2%