how collective is collective efficacy? the importance of ...eprints.ncrm.ac.uk/4020/1/working paper...
TRANSCRIPT

1

2
How collective is collective efficacy? The importance of consensus in
judgments about community cohesion
Ian Brunton-Smith, Department of Sociology, University of Warwick
Patrick Sturgis, Department of Social Statistics, University of Southampton
George Leckie, Centre for Multilevel Modeling, University of Bristol
Keywords: collective efficacy, mixed-effects location scale model, neighborhood effects, multilevel
model, consensus effects
DRAFT APRIL 2017

3
ABSTRACT
Existing studies have generally measured collective efficacy by combining survey respondent ratings of
the local area into an overall summary for each neighborhood, resulting in a substantive focus on variation
in its average between neighborhoods. In this paper, we focus on the variability in consensus of collective
efficacy judgments. To account for differential consensus amongst residents, we use a mixed-effects
location scale model, with variability in the consensus of judgments treated as an additional
neighborhood-level random effect. Our results confirm that neighborhoods differ, not just in their overall
levels of collective efficacy, but also in the extent to which residents agree with one another in their
assessments. In accord with findings for US cities, our results show consensus in CE assessments is
affected by the ethnic composition of neighborhoods in London. Additionally, we show that heterogeneity
in collective efficacy assessments is consequential, with higher levels of worry about crime and risk
avoidance behavior in areas where CE consensus is low.

4
INTRODUCTION
There is now compelling evidence that collective efficacy (henceforth CE) plays an important role in
shaping the patterning of crime, disorder, and citizen perceptions of victimization risk across local
areas. CE is a confluence of networks, values, and norms of reciprocity which combine to enable
communities to intervene in order to suppress deviant behavior and to maintain social order, or, as
Sampson puts it, CE is “the process of activating or converting social ties among neighborhood
residents in order to achieve collective goals, such as public order or control of crime” (Sampson, 2010:
802). Research across a range of international contexts has shown that areas characterized by higher
CE have lower levels of crime (e.g. Armstrong, Katz and Schnelby, 2015; Mazerolle, Wickes and
McBroom, 2010; Oberwittler, 2007; Odgers et al., 2009; Sampson, 2012; Sampson and Wikström,
2007; Zhang, Messner and Liu, 2007) and lower levels of fear of victimization and perceived disorder
(e.g. Brunton-Smith, Sutherland and Jackson, 2014; Farrall, Jackson and Gray, 2009; Sampson, 2009).
CE has been posited as the social psychological mechanism through which structural characteristics of
local areas influence crime-related outcomes, mediating associations between neighborhood socio-
economic disadvantage, on the one hand, and recorded and perceived crime rates on the other
(Morenoff, Sampson and Raudenbush, 2001; Sampson, 2012; Sampson, Raudenbush and Earls,
1997). CE is also important for understanding a range of other neighborhood-dependent social
phenomena, such as risky sexual behavior amongst teenagers (Browning et al., 2008), adolescent
mental health (Browning et al., 2013), and confidence in the police (Nix et al., 2015).
CE is considered to be an attribute of neighborhoods rather than of individuals; a combination of the
networks, norms, and social trust that exists between residents and the capacity this endows them with
to control and suppress deviant behavior (Mazerolle, Wickes and McBroom, 2010; Sampson, 2012;
Zhang, Messner and Liu, 2007). The collective and inherently subjective nature of the concept poses
challenges for valid and robust measurement. Existing empirical studies have predominantly

5
approached these measurement challenges by eschewing ‘objective’ indicators and, instead,
combining the subjective ratings of survey respondents into summary indicators (Raudenbush and
Sampson, 1999). This has been done either by simple averaging (e.g. Bruinsma et al., 2013; Wells et
al., 2006; Zhang, Messner and Liu, 2007), or by using more complex modeling approaches to produce
estimates which adjust for compositional differences between individuals and areas (e.g. Browning et
al., 2008; Brunton-Smith, Sutherland and Jackson, 2014; Sampson, Raudenbush and Earls, 1997;
Wikström et al., 2012;). These studies have focused on variation between neighborhoods in the
average of CE assessments across residents. They ask whether higher or lower average levels of CE
across neighborhoods is (conditionally) related to outcomes such as recorded crime and perceptions of
victimization risk. By way of contrast, however, considerably less attention has been paid to differences
between neighborhoods in the variability of assessments around their averages. Yet there are good
reasons to believe that the level of consensus between residents in assessments of CE will differ
across neighborhoods (Browning, Dirlam and Boetter, 2016) and, moreover, that such differences will
be consequential for social attitudes and behavior (Downs and Rocke, 1979).
In this paper we consider CE from this perspective; we assess how variability in individual assessments
of CE affect and are affected by other individual and neighborhood level characteristics. Using data
from a large random survey of London residents, we extend the standard two-level mixed-effects model
(multilevel model or hierarchical linear model) commonly employed in neighborhood effects research, to
a mixed-effects location scale model (Hedeker, Mermelstein and Demirtas, 2008). This allows us to
model the within-neighborhood heterogeneity in CE ratings as a function of characteristics of individual
raters and of neighborhoods. In addition to describing the patterning of CE consensus across
neighborhoods, we also assess whether and how this heterogeneity is predictive of individual level fear
of criminal victimization and risk avoidance behavior.

6
The remainder of the paper is structured as follows. First, we review the existing literature on CE before
setting out our theoretical expectations regarding the likely causes and consequences of variability in
CE judgments across neighborhoods. We then describe the data and measures on which our analysis
is based and describe the mixed-effects location-scale model. After presenting the results of our
analysis, we conclude with a consideration of the implications of our findings for understanding how CE
judgments both shape and are shaped by features of the neighborhood environment.
COLLECTIVE EFFICACY: CENTRAL TENDENCY AND VARIANCE
CE is now firmly embedded in the lexicon of modern criminological theory and empirical research as an
extension of classical theories of social disorganization (Park and Burgess, 1925; Shaw and McKay,
1942; Thomas and Znaniecki, 1927). First described in Sampson and colleagues’ pioneering research
on the spatial patterning of crime in the city of Chicago (Morenoff, Sampson and Raudenbush, 2001;
Sampson 2012; Sampson, Raudenbush and Earls, 1997), it has been proposed as the key social
psychological mechanism to account for why some neighborhoods possessing predisposing structural
characteristics – socio-economic disadvantage, residential mobility, and ethnic heterogeneity –
experience high levels of crime, while others do not. These and subsequent studies (Mazerolle, Wickes
and McBroom, 2010; Odgers et al., 2009; Zhang, Messner and Liu, 2007) have shown that socially
cohesive neighborhoods are characterized by cross-cutting social networks and high levels of
interpersonal trust, combined with a willingness to intervene to prevent norm-deviant behavior. Drawing
on Bandura’s (1997) theory of self-efficacy, Sampson’s notion of CE emphasizes residents’ shared
expectations about the beliefs and likely actions of others, viewing this as underpinning a community’s
“latent capacity for action” (Sampson, 2013: 20). From this perspective, it is residents’ beliefs about the
likely behavior of others and not simply the objective level of informal social control or signs of disorder
in the neighborhood that are key to CE’s role in shaping community behavior and, therefore,
maintaining order.
7
More recent studies have explored how individuals’ assessments and interpretations of neighborhood
structural properties are informed by subjectivities and local context. Here, the focus has been on
understanding how individual and neighborhood-level characteristics are related to differences in
residents’ interpretations of signs of disorder. For example, Sampson (2009) has shown that the same
signifiers – an abandoned car, graffiti, a broken window – are interpreted differently, depending on
residents’ beliefs about the ethnic composition and social status of an area (see also Sampson, 2012;
Sampson and Raudenbush, 2004). An abandoned car in a predominantly white area does not induce
crime-related cognitive schema to the same extent that it does in a predominantly black neighborhood.
Thus, Sampson (2013: 17) argues that “norms about order are inherently cognitive and contextual,
conditioning responses to what are presumed to be objective markers of disorder.” Similarly, Hipp
(2010) has shown that whites, women, parents, and longer-term residents generally perceive higher
levels of crime and disorder than other demographic groups, while Sutherland, Brunton-Smith and
Jackson (2013) found higher ratings of CE amongst older people, ethnic minorities, and longer-term
residents.
While these studies have identified factors that seem to influence perceptions of the level of CE in a
neighborhood, few to date have focused on heterogeneity between residents in these judgments. An
exception is Browning, Dirlam and Boettner (2016) who focus on the relationship between the size of
the Latino immigrant population and ratings of CE in Chicago and LA neighborhoods. They find a
nonlinear association between the concentration of Latinos and levels of CE agreement within
neighborhoods. When the proportion of Latinos in a neighborhood is low, CE consensus decreases as
the Latino share increases but, once the share of Latinos reaches a threshold of approximately 40%,
further increases in concentration result in higher CE consensus. This non-linearity, Browning et al
argue, reflects changes in the neighborhood narrative frames of recently arrived immigrants as their
share of the resident population increases. Frame convergence itself derives from growth in the number

8
of shops, community initiatives, and so on targeted at the immigrant group. In other words, the
neighborhood comes increasingly to be defined by all residents as diverse and co-ethnic, leading to
shared understandings of both immigrant and non-immigrant groups about its readiness and capacity to
control deviant behavior.
Here, we extend Browning, Dirlam and Boettner’s focus on the variability in CE consensus across
neighborhoods both methodologically and substantively. Methodologically, we include an additional
neighborhood-level random effect in the level-1 variance function to allow for residual differences in the
degree of neighborhood consensus, after adjusting for covariates. As well as yielding more accurate
standard errors on the coefficient estimates in the scale equation (Leckie, 2014; Leckie et al., 2014),
this also enables derivation of neighborhood-specific predictions of CE consensus. Substantively, we
assess whether variation in CE consensus across neighborhoods affects social and behavioral
outcomes. Recall that a key tenet of CE theory is that it is the beliefs that individuals hold about the
attitudes and likely behavior of other neighborhood residents that are integral to shaping community
responses to norm-deviant behavior (Sampson, 2013). What I believe about the likely attitudes and
behavior of other neighborhood residents is key to determining my own attitudinal and behavioral
responses to threat-inducing situations. Thus, to the extent that residents share common assessments
of residents’ trust, reciprocity, and propensity to intervene, collective action will be facilitated. By the
same token, where residents do not agree about the level of CE in the neighborhood, the latent
capacity for action will be diminished, even in neighborhoods where the average of CE assessments is
high.
HYPOTHESES
Our first hypothesis concerns how neighborhood ethnic composition affects the level of consensus in
CE ratings. As noted earlier, Browning, Dirlam and Boettner (2016) observe a nonlinear association

9
between the share of Latinos and the level of CE consensus in Chicago and LA neighborhoods. We
test whether the same non-linearity generalizes to London, a city which has a very different history of
immigration, ethnic composition and politics compared to American counterparts (Sturgis et al., 2014).
Additionally, we extend our analysis to assess how ethnic group concentration affects within-group CE
consensus. If non-linearity in the relationship between immigrant concentration and CE consensus
derives from greater equivalence of narrative frames between minority and majority ethnic group
residents, it follows that within-group CE consensus should also increase as the proportion of residents
of one’s own ethnic group increases. We therefore specify our first hypothesis as:
H1: within ethnic group consensus in CE assessments will be positively correlated with the proportion of
neighborhood residents from the same ethnic group in the neighborhood
In addition to assessing how the ethnic composition of neighborhoods affects CE consensus, we also
test whether neighborhood differences in CE consensus are themselves predictive of individual beliefs
about and behavioral responses to victimization risk. Our expectation here turns on the importance of
‘theory of mind’ in Sampson’s account of CE, “a key argument of collective efficacy theory is that it
matters what I think others think, making collective efficacy a kind of deterrence or moral rule—a
generalized mechanism of “common knowledge” that goes beyond any single act of control”
(Sampson, 2013: 20). In positioning residents’ expectations about the beliefs and likely actions of
others as central in determining whether a community has the capacity to act, it follows that there
should be less opportunity for informal or latent processes to be translated into action in neighborhoods
where CE consensus is low. On the other hand, where there is consensus about the likely behavior of
other residents, CE will function as a more reliable indicator of the attitudes and likely behavior of
residents, in the event that intervention is required to maintain order. We should therefore expect
10
residents’ worry about victimization risk to be higher in neighborhoods with lower levels of CE
consensus, leading to our second hypothesis:
H2: (Higher levels of) CE consensus in a neighborhood will be correlated with (lower levels of)
individual-level worry about criminal victimization
If a lack of consensus about the level of CE in a neighborhood inhibits its ability to support collective
action and reduce residents’ concerns about the risk of victimization, we should expect low levels of CE
consensus to affect behavioral as well as psychological outcomes. Our third hypothesis is therefore:
H3: (Higher levels of) CE consensus in a neighborhood will be correlated with (lower levels) of risk
avoidance behavior
MODELLING STRATEGY
To test these hypotheses we use a mixed-effects location scale model (Hedeker, Mermelstein and
Demirtas, 2008). This extends the standard two-level mixed-effects model (Goldstein, 2011;
Raudenbush and Bryk 2002; Snijders and Bosker, 2012) by relaxing the assumption of a common
level-1 variance, instead allowing it to vary randomly across level-2 units and as a function of
covariates. Whereas Hedeker et al. proposed their model in the context of analyzing intensive
longitudinal data, it has since also been applied to cross-sectional settings (Brunton-Smith, Sturgis, and
Leckie, 2017; Leckie et al., 2014). In the present case we have individuals at level-1 within
neighborhoods at level-2 and so it is the within-neighborhood (between individual) variance in CE
assessments which we allow to vary from neighborhood to neighborhood, in addition to the usual mean
differences.
11
Let 𝑦𝑖𝑗 denote the continuous CE assessment score for individual 𝑖 (𝑖 = 1,… , 𝑛𝑗) living in area 𝑗 (𝑗 =
1, … , 𝐽). The standard two-level random-intercept mixed-effect model for 𝑦𝑖𝑗 can then be written as
𝑦𝑖𝑗 = 𝐱𝑖𝑗′ 𝛃 + 𝑢𝑗 + 𝑒𝑖𝑗 (1)
where 𝐱𝑖𝑗 is a vector of individual- and area-level covariates with coefficients 𝛃, 𝑢𝑗 is a random
intercept representing unobserved influences common to all individuals in area 𝑗, and 𝑒𝑖𝑗 is the
residual. The random effect and residual are assumed independent of one another and of the
covariates and to be normally distributed with zero means and constant variances, 𝑢𝑗~𝑁(0, 𝜎𝑢2), and
𝑒𝑖𝑗~𝑁(0, 𝜎𝑒2). The between-neighborhood random effect variance 𝜎𝑢
2 captures the variability in
adjusted mean levels of CE across areas. The within-neighborhood or residual variance 𝜎𝑒2 measures
the average variability in residents’ assessments that are unexplained by the model.
The degree of residual clustering in the data is typically then assessed by the intra-class correlation
coefficient (ICC), derived as 𝜌 = 𝜎𝑢2(𝜎𝑢
2 + 𝜎𝑒2)−1 and interpreted both as the proportion of
unexplained variation which lies between neighborhoods and as the correlation in adjusted responses
between two randomly selected residents in the same neighborhood. The ICC can therefore be used as
a measure of consensus in assessments of CE amongst residents in the same area, with a higher ICC
indicating greater consensus.
Whereas the mixed-effects model in equation 1 assumes constant within-neighborhood variance, which
is to say 𝜎𝑒2 is constrained to be equal across all areas, the mixed-effects location scale model relaxes
this assumption by specifying an auxiliary log-linear equation for this variance as a function of
covariates and an additional neighborhood random effect. This allows neighborhoods to differ in the
residual variability (i.e., the variability or ‘scale’ of ratings) once direct effects on the mean have been

12
accounted for. The log link function ensures the within-neighborhood variance takes positive values. It
is written as
ln (𝜎𝑒𝑖𝑗2 ) = 𝐰𝑖𝑗
′ 𝛂 + 𝑢𝑗[2]
(2)
where ln (𝜎𝑒𝑖𝑗2 ) is the log of the now heterogeneous within-neighborhood variance, 𝐰𝑖𝑗 is a vector of
individual- and neighborhood-level covariates with coefficients 𝛂, and 𝑢𝑗[2]
is the additional area
random effect. We use the ‘[2]’ superscript to distinguish this random effect from the usual area
random effect in equation 1, which we now denote 𝑢𝑗[1]
. Positive 𝛂 coefficients identify groups (and
neighborhood characteristics) with more variable CE assessments, while negative coefficients indicate
that CE assessments are less variable compared to the average.
In the terminology of the mixed-effects location scale model, the 𝑢𝑗[1]
are ‘location’ (i.e., mean) random
effects, while the 𝑢𝑗[2]
are ‘scale’ (i.e., variance) random effects. The two sets of area random effects
are assumed bivariate normally distributed with zero mean vector and constant variance-covariance
matrix.
(𝑢𝑗[1]
𝑢𝑗[2])~𝑁 {(
00) , (
𝜎𝑢[1]2
𝜎𝑢[1]𝑢[2] 𝜎𝑢[2]2 )} (3)
The variance-covariance matrix summarizes how neighborhoods differ in average levels of CE
(summarized by 𝜎𝑢[1]2 ), and also in variability across residents (summarized by 𝜎𝑢[2]
2 ). The association
between the mean and variance in each neighborhood (𝜎𝑢[1]𝑢[2]) can also be estimated. i

13
By specifying heterogeneous within-neighborhood variances, it follows that the ICC now also varies
across areas and as a function of the covariates, allowing analysis of the heterogeneity in
neighborhood agreement in CE ratings. The usual population-averaged ICC yielded by the standard
mixed-effects model is recovered by first calculating the population-averaged within-neighborhood
variance
E (𝜎𝑒𝑖𝑗2 |𝐰𝒊𝑗) = exp(𝐰𝑖𝑗
′ 𝛂 + 0.5𝜎𝑢[2]2 ) (4)
and then substituting this for the level-1 variance in the expression for the ICC.
DATA AND MEASURES
We use data from the UK Metropolitan Police Public Attitude Survey (METPAS), a face-to-face survey
of London residents aged 15 and over. METPAS has a multistage sample design, with households
randomly selected from the Post Office Address File within each of London’s 32 boroughs each quarter.
Our data is drawn from the April 2007 to March 2010 rounds of the survey, with a response rate over
the three years of 60% (Cello, 2009). We use the Middle Layer Super Output Area (MSOA) census
geography (Martin, 2001) to represent neighborhoods. MSOA are broadly equivalent to US census
tracts and provide an approximation to a plausible neighborhood geography, comprising an average of
4,000 households that are grouped together based on similarity of housing tenure, with an average size
of 0.6 square miles. During the construction of MSOAs, consideration was given to the presence of
major roadways and other physical barriers within the environment that may signify the boundary of a
neighborhood area for residents. Data are available for a total of 46,346 residents within 982 MSOAs
across London (an average of 47 sampled residents). ii
Collective Efficacy

14
Collective efficacy is measured using six items tapping different aspects of social cohesion and informal
social control which closely mirror the questions used in Sampson, Raudenbush and Earls (1997). For
each item, respondents rated their local area on a five-point scale from strongly disagree (1) to strongly
agree (5):
1. People in this neighborhood can be trusted.
2. People act with courtesy to each other in public spaces in this area.
3. You can see from the public space here that people take pride in their environment.
4. If any of the children or young people around here are causing trouble, local people will tell
them off.
5. The people who live here can be relied upon to call the police if someone is acting suspiciously.
6. If I sensed trouble whilst in this area, I could get help from people who live here.
Responses to all six items were combined using exploratory factor analysis (EFA). A single factor with
an eigenvalue greater than 1 was extracted, representing the overall rating of neighborhood collective
efficacy for each individual (details of the factor model and parameter estimates are included in
appendix table A1). Higher scores on the factor score correspond to assessments of higher collective
efficacy.
Worry about Victimization
Worry about victimization is measured using four items. Respondents were asked how worried they
were about having your home broken into and something stolen, being mugged or robbed in this area,
being insulted or pestered by anybody whilst in the street, and being physically attacked by a stranger
in the street in this area. For each item, the response alternatives were ‘not at all worried’, ‘not very
worried’, ‘fairly worried’ and ‘very worried’. EFA was used to combine the scores from each item, with

15
factors retained if they had an eigenvalue greater than 1. This identified a single summary scale, with
higher sores indicating more worry about crime overall (factor loadings included in appendix table A1).
Risk Avoidance Behavior
Risk avoidance behavior is measured using a three item scale. Respondents were asked how often do
you do these things in your local area, simply as a precaution against crime: avoid using public
transport, avoid particular streets during the day, and avoid particular streets at night (Never,
occasionally, sometimes, most of the time, always). The items were combined using a Generalized
Partial Credit Item Response model with a single latent factor (for full details see appendix table A2).
Neighborhood Characteristics
For each MSOA, variables from the UK census 2001 are included to measure structural characteristics
of local areas. A total of 21 raw census count variables were combined using a factorial ecology model
(Raudenbush and Sampson, 1999; Rees, 1971), to generate a series of neighborhood indictors
covering: concentrated disadvantage, urbanicity, population mobility, age structure, housing structure,
and MSOA population size (details of the full factor structure are included in appendix table A3). The
ethnic composition of the local area is measured by the percentage share of each ethnic group in each
MSOA (White, Asian, Black, Other), with a quadratic term also included to allow for nonlinearity. We
also include a compound measure of total neighborhood crime in 2005. This is based on police
recorded crime from 33 different offences under the broad categories of burglary, theft, criminal
damage, and violence, from the Index of Multiple Deprivation (Noble et al., 2004). We include individual
level predictors for respondent gender, age, ethnicity, marital status, social class, housing tenure,
length of residence, employment status, and whether he/she has been the victim of crime in the past
year (self-report), and sample size in each neighborhood.

16
ANALYSIS
We fit a series of models of increasing complexity. Model 1 is a standard mixed-effects model with no
covariates, it partitions the total variability in CE ratings into within- and between-neighborhood variance
components. Model 2 is a mixed-effects location scale model with no covariates which allows the
within-neighborhood variance in ratings to vary across areas. Significant variation across areas implies
that residents of different neighborhoods vary in their level of agreement about the extent of CE. Model
3 incorporates the individual and neighborhood covariates to explain differences in average levels of
CE as well as variability around these averages. In addition to the main effects of each covariate, we
also include the interaction between respondent ethnicity and the proportion of local residents who
share the same ethnic origin. Examining the effect for each ethnic group separately in this way allows
for the possibility that living in an area with a larger proportion of residents from the same ethnic origin
will hold greater salience for minority ethnic groups, who typically make up a comparatively small share
of the population in most local neighborhoods.
In models 4-7, we explore the relationship between residents’ worry about victimization risk, their risk
avoidance behavior and the mean and consensus measures of neighborhood CE. Two-level mixed
effects models are estimated, in which worry about victimization and risk avoidance behavior are the
outcomes and the (reliability adjusted) empirical Bayes estimates of the location and scale effects �̂�𝑗[1]
and �̂�𝑗[2]
derived from model 2 are included as predictors. To ensure that effects of the measure of
neighborhood CE variability are not the result of differences in the levels of worry of those that depart
the most from the neighborhood mean CE, we also control for individual CE ratings.
Models are estimated using Markov Chain Monte Carlo (MCMC) methods as implemented in the Stat-
JR statistics package (Charlton et al., 2013).

17
RESULTS
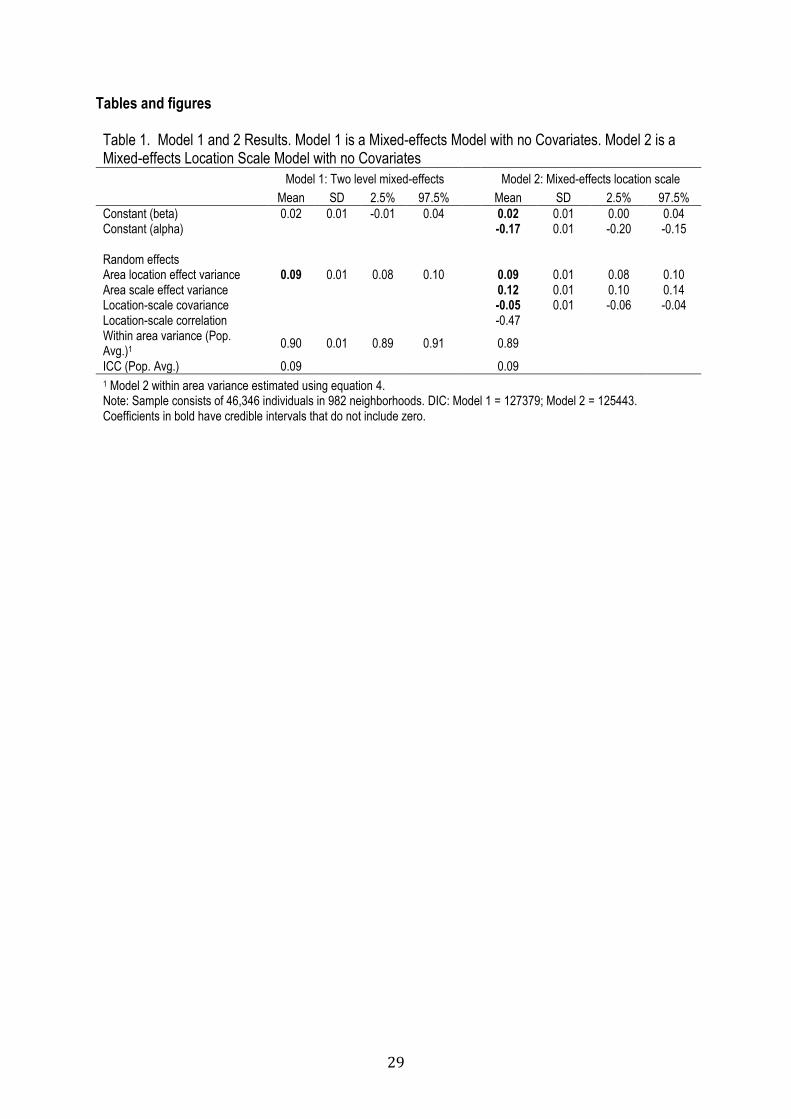
Model 1 (Table 1) shows that the majority of variability in CE ratings is between residents, with
neighborhoods accounting for 9% of the total variance (ICC = 0.09). This falls in the middle of the range
of estimates from previous studies which have found between 5% and 20% of the variation in CE to be
situated at the neighborhood level (Raudenbush and Sampson, 1999).
TABLE 1 HERE
Allowing for differential consensus across neighborhoods results in an improvement in model fit with the
DIC dropping from 127379 in Model to 125443 Model 2. The scale effect variance (0.12) shows that
there are significant differences between neighborhoods in the level of CE consensus. This is shown
graphically in Figure 1, which plots the model estimated ICC for each of the 982 MSOA in London, with
95% credible intervals (the higher the ICC, the higher the level of CE consensus). The population-
average ICC is again 0.09 (indicated by the red horizontal line) around which there is considerable
variability, with 95 MSOAs (10%) having an ICC that is significantly lower than this average, and 132
MSOAs (13%) with an ICC significantly higher than this average. In short, CE is more ‘collective’ in
some neighborhoods than it is in others.
FIGURE 1 HERE
There is a significant negative correlation (-.47) between the random location and scale effects, such
that areas with higher average CE also tend to have more consensus about the extent of CE in the
neighborhood. One explanation may be that neighborhoods which are high in CE are also richer in
contextual cues and signifiers on which judgments are based, leading to a higher level of agreement
between raters.

18
Model 3 (Table 2) adds the individual and neighborhood level covariates to the location and scale
equations. Although the fixed effects in the location equation are not our substantive focus in this paper,
it is worth noting that ratings of CE are higher amongst older residents, Asian and black ethnic
minorities, full-time workers, and longer-term neighborhood residents. In contrast, single people, those
in lower social class groups, people in rented accommodation, and victims of crime report lower levels
of CE. At the neighborhood level, average CE is lower in more economically disadvantaged and more
urban neighborhoods, and in neighborhoods that have a higher concentration of terraced housing and
flats. The direction of these coefficients is consistent with existing studies (Mazerolle, Wickes and
McBroom, 2010; Mennis, Lashner Dayanim, and Grunwald 2013; Twigg, Taylor, and Mohan, 2010).
TABLE 2 HERE
Turning to the model 3 scale equation, where positive coefficients indicate characteristics associated
with lower CE consensus, we see that groups with higher socio-economic status, home owners, and full
time employees have higher CE consensus, while women, victims of crime, and those who are single or
divorced have higher CE consensus. The positive coefficient for victims of crime indicates that the CE
ratings of this group are more variable compared to non-victims, so consensus in judgments is lower. In
model 3 we find the same non-linear relationship as Browning, Dirlam and Boettner (2016), with CE
consensus declining as the share of minority residents increases up to a threshold of approximately
30%, beyond which further increases in the proportion of black/Asian residents increases the level of
CE consensus. This can be seen in Figure 2, which plots fitted values of the level-1 variance from
model 3 against the percentage of black and Asian residents in the neighbourhood.
FIGURE 2 HERE
19
We find partial support for hypothesis H1; within-ethnic group CE consensus increases as the
proportion of residents from the same ethnic group increases, although this is only significant for black
residents. For Asian residents the coefficient is in the expected direction but is not significantly different
from zero, while for white residents there is no evidence of a relationship between white concentration
and the level of CE consensus amongst whites. This may be due to whites being the majority ethnic
group in nearly all neighborhoods, creating an upper bound or ‘ceiling effect’ on further increases in
white concentration.
Finally, we assess how heterogeneity in CE consensus between neighborhoods is related to individual
attitudes and behavior toward victimization risk. To preserve space, we present only the parameter
estimates for the mean and variance of CE in Table 3, the full model estimates are included in the
Appendix (Tables A5 and A5). In line with theoretical expectation and consistent with existing studies
(Brunton-Smith, Sutherland and Jackson, 2014), model 4 finds that individual level worry about
victimization risk is lower in areas with higher average levels of CE. Additionally, we find that worry
about victimization is significantly higher in neighborhoods where CE consensus is lower, supporting
hypothesis H2. Indeed, when we account for the level of CE consensus in model 5, the coefficient for
average levels of CE is no longer significantly different from zero.
Turning to the behavioral outcome, model 6 shows that residents are less likely to report risk avoidance
behavior as the mean level of neighborhood CE increases, with model 7 showing an additional
independent effect of CE consensus; as within neighborhood agreement about the level of CE in the
neighborhood increases, risk avoidance behavior declines. For both outcomes then, we find that CE
consensus has an independent effect, even when accounting for mean levels of neighborhood CE.
20
TABLE 3 HERE
DISCUSSION
Sociologists have long observed that crime has a strong spatial patterning and much attention in the
criminological literature has been devoted to describing and explaining how this arises, is maintained,
and reproduced (Brantingham and Brantingham, 1995; Pratt and Cullen, 2005; Sampson, 2012; Shaw
and McKay, 1942; Wilson and Kelling, 1982; Weisburd, Groff, and Yang, 2012). While there is a great
deal that remains to be understood about the social, physical, and economic causes of localized
concentrations of criminal activity, if criminological research can lay claim to having produced a single
stylized fact, the highly stratified nature of the spatial distribution of crime must be a primary contender.
Neighborhoods with high rates of unemployment, low household incomes, high population density and
turnover, and poorly maintained housing stock are consistently subject to substantially higher rates of
offending and disorderly behavior than their more salubrious counterparts (Sampson, 2012; Shaw and
McKay, 1942; Weisburd, Groff, and Yang, 2012).
Yet this relationship is far from deterministic; some areas possessing these structural features
experience considerably lower levels of crime and disorder than others, for reasons that have not been
well understood. Sampson and colleagues (1997; 2012) have proposed the concept of CE to account
for this disparity, contending that CE serves as a collective resource derived from shared norms of trust
and reciprocity, social networks and informal ties which endow a community with the capacity to
intervene to prevent criminal activity and to suppress norm-discordant behavior (Sampson, 2012).
Empirical studies in a range of contexts have borne out the essential premise of CE theory; that
controlling for differences in predisposing structural features, neighborhoods with higher measured
levels of CE have lower rates of crime, disorder, and fear of crime (Brunton-Smith, Sutherland and
21
Jackson, 2014; Mazerolle, Wickes and McBroom, 2010; Odgers et al. 2009; Zhang, Messner and Liu,
2007).
A key feature of CE theory is that it relates to individuals’ beliefs about the attitudes and likely behavior
of other neighborhood residents; it is, fundamentally, about what residents believe other residents think
and how they are likely to act in different contexts (Sampson, 2012). This inherently social
psychological perspective implies that some residents will find these judgments easier to make than
others and that this will give rise to variability in the level of consensus about CE across neighborhoods.
Existing empirical research into the causes and consequences of CE has focused on differences in its
average across neighborhoods, with little emphasis on the possible substantive importance of
heterogeneity in these collective judgments. Our objective in this paper has been to address this lacuna
by investigating whether and how local areas differ in the consensus of residents about CE and
whether variability in CE consensus is itself consequential for residents’ judgments about the likelihood
of criminal victimization. Using a mixed-effects location scale model (Hedeker, Mermelstein and
Demirtas, 2008), our findings demonstrate that neighborhoods in London differ systematically in the
consensus of CE judgments, with some 10% of neighborhoods exhibiting levels of consensus which
are significantly above and 13% which are significantly below the population average.
We have also shown that heterogeneity in CE consensus is systematically related to structural features
of local environments. In particular, CE consensus is dependent on the ethnic composition of
neighborhoods, with the pattern we find in London closely mirroring the nonlinear relationship reported
in Browning, Dirlam and Boettner’s (2016) examination of neighborhoods in Chicago and LA. When the
share of minority residents in a neighborhood is low, increasing dissensus is evident as the share of
minority residents increases. But, when the total share of minority residents moves beyond a threshold
of 30-40%, further increases are associated with more consensus in CE assessments. Additionally, we

22
found CE consensus to be higher as the proportion of residents from the rater’s own ethnic group
increases for black residents. Both relationships support the idea of a mechanism based on shared
cognitive frames; with ethnic group concentration driving convergence in the frames individual residents
bring to judgments about levels of CE. Future research could usefully explore additional mechanisms
linking resident and neighborhood level characteristics to CE consensus, in addition to assessing the
spatial and temporal generality of the relationships we have observed for London in the mid-2000s.
In addition to evaluating the correlates of heterogeneity in CE judgments, we also assessed for the first
time whether this variability is itself related to the sorts of outcomes that CE has been posited to
influence, such as rates of criminal offending, disorderly behavior, and expressed fear of criminal
victimization. A key aspect of Sampson’s conception of CE is that it relates to residents’ beliefs about
the likely attitudes and behavior of other people in their neighborhood. It follows from this that in
neighborhoods where CE consensus is low, residents’ ability to make inferences of this nature will be
impeded. We found, in line with this theoretical expectation, that CE consensus is negatively associated
with both expressed worry about criminal victimization and risk avoidance behavior. In neighborhoods
where levels of consensus are higher than average, residents worry less about criminal victimization
and are less likely to avoid risky places and situations.
Our findings add to a growing understanding in criminology of how structural features of local areas
exert an influence on crime and disorder indirectly, through social psychological filters of cognition,
judgment, and affect (Mazerolle, Wickes and McBroom, 2010; Mennis, Lashner Dayanim, and
Grunwald 2013; Sampson, Raudenbush and Earls, 1997; Zhang, Messner and Liu, 2007). We have
shown that, for a complete account of how CE functions in local environments, it is necessary to
consider not only the average but also the variability across individuals and neighborhoods in these
assessments. Much, however, remains to be understood about the causes and consequences of CE

23
consensus, including other structural features of local environments, how general these findings are to
other national and international contexts, and to other indicators of crime and disorder. These, we
contend, represent fruitful avenues for future research.

24
REFERENCES
Armstrong, Todd. A., Charles M. Katz, and Stephen M. Schnelby. 2015. The relationship between
citizen perceptions of collective efficacy and neighborhood violent crime. Crime and Delinquency
61:121-42.
Bandura, Albert. 1997. Self-Efficacy: The Exercise of Control. New York: Freeman.
Brantingham, Patricia L., and Paul J. Brantingham. 1995. Criminality of place: Crime generators and
crime attractors. European Journal on Criminal Policy and Research 3:5-26.
Browning, Christopher R., Lori A. Burrington, Tama Leventhal, and Jeanne Brooks-Gunn. 2008.
Neighborhood structural inequality, collective efficacy, and sexual risk behavior among urban
youth. Journal of Health and Social Behavior 49:269-85.
Browning, Christopher R., Brian Soller, Margo Gardner, and Jeanne Brooks-Gunn. 2013. ‘Feeling
disorder’ as a comparative and contingent process: Gender, neighborhood conditions, and
adolescent mental health. Journal of Health and Social Behavior 53:296-314.
Browning, Christopher R., Jonathan Dirlam, and Bethany Boettner. 2016. From heterogeneity to
concentration: Latino immigrant neighborhoods and collective efficacy perceptions in Los Angeles
and Chicago. Social Forces 95:779-807.
Bruinsma, Gerben. J. N., Lieven J. R. Pauwels, Frank M. Weerman, and Wim Bernasco. 2013. Social
disorganization, social capital, collective efficacy and the spatial distribution of crime and
offenders: An empirical test of six neighborhood models for a Dutch city. British Journal of
Criminology 53:942-63.
Brunton-Smith, Ian, Patrick Sturgis, and George Leckie. 2017. Detecting, and understanding
interviewer effects on survey data using a cross-classified mixed-effects location scale model.
Journal of the Royal Statistical Society: Series A (Statistics in Society) 180:551-68.

25
Brunton-Smith, Ian, Alex Sutherland, and Jonathan Jackson. 2014. Bridging structure and perception:
On the social ecology of beliefs and worries about neighborhood violence in London. British
Journal of Criminology 54:503-26.
CELLO MRUK research. 2009. Public Attitude Survey Technical Report (Q1 2009/10). CELLO mruk
research.
Charlton, Christopher M. J., Danius T. Michaelides, Richard M. A. Parker, Bruce Cameron, Camille
Szmaragd, Huanja Yang, . . . and William J. Browne. 2013. Stat-JR Version 1.0. Centre for
Multilevel Modelling, University of Bristol and Electronics and Computer Science, University of
Southampton. Retrieved from http://www.bristol.ac.uk/cmm/software/statjr/.
Downs, George W., and David M. Rocke. 1979. Interpreting heteroscedasticity. American Journal of
Political Science 23:816-28.
Farrall, Stephen, Jonathan Jackson, and Emily Gray. 2009. Social order and the fear of crime in
contemporary times. USA: Oxford University Press.
Goldstein, Harvey. 2011. Multilevel Statistical Models. 4th edition. Chichester, UK: John Wiley & Sons.
Hedeker, Donald, Robin J. Mermelstein, and Hakan Demirtas. 2008. An application of a mixed-effects
location scale model for analysis of ecological momentary assessment (EMA) data. Biometrics
64:627–34.
Hedeker, Donald, and Rachel Nordgren. 2013. MIXREGLS: a program for mixed-effects location scale
analysis. Journal of Statistical Software 52:1-38.
Hipp, John R. 2010. Resident perceptions of crime and disorder: How much is ‘bias’, and how much is
social environment differences? Criminology 48:475–508.
Leckie, George. 2014. runmixregls: A program to run the MIXREGLS mixed-effects location scale
software from within Stata. Journal of Statistical Software 59:1-41.

26
Leckie, George, Robert French, Christopher Charlton, and William J. Browne. 2014. Modeling
heterogeneous variance-covariance components in two-level models. Journal of Educational and
Behavioral Statistics 39:307-32.
Martin, David. 2001. Geography for the 2001 Census in England and Wales. Office of National
Statistics.
Mazerolle, Lorraine, Rebecca Wickes, and James McBroom. 2010. Community variations in violence:
The role of social ties and collective efficacy in comparative context. Journal of Research in Crime
and Delinquency 47:3-30.
Mennis, Jeremy, Suzanne Lashner Dayanim, and Heidi Grunwald. 2013. Neighborhood collective
efficacy and dimensions of diversity: A multilevel analysis. Environment and Planning A 45:2176-
93.
Morenoff, Jeffrey D., Robert J. Sampson, and Stephen W. Raudenbush. 2001. Neighborhood
inequality, collective efficacy, and the spatial dynamics of urban violence. Criminology 39:517-59.
Nix, Justin, Scott E. Wolfe, Jeff Rojek, and Robert J. Kaminski. 2015. Trust in the police: The influence
of procedural justice and perceived collective efficacy. Crime and Delinquency 61:610-40.
Noble, Michael, Gemma Wright, Chris Dibben, George Smith, David McLennan, Chelsie Anttila, Helen
Barnes, Christina Mokhtar, Stefan Noble, David Avenell, Jo Gardner, Illaria Covizzi, and Myfanwy
Lloyd. 2004. The English Indices of Deprivation 2004. London: Office of the Deputy Prime Minister
Publications.
Oberwittler, Dietrich. 2007. The effects of neighborhood poverty on adolescent problem behaviours: A
multi-level analysis differentiated by gender and ethnicity. Housing Studies 22:781–803.
Odgers, Candice L., Terrie E. Moffitt, Laura M. Tach, Robert J. Sampson, Alan Taylor, Charlotte L.,
Matthews, and Avshalom Caspi. 2009. The protective effects of neighborhood collective efficacy
on British children growing up in deprivation: A developmental analysis. Developmental
Psychology 45:942-57.

27
Park, Robert E., and Ernest W. Burgess. 1925. The City. Chicago: The University of Chicago Press.
Pratt, Travis C., Francis T. Cullen. 2005. Assessing macro-level predictors and theories of crime: A
meta-analysis. Crime and Justice 32:373–450.
Raudenbush, Stephen W., and Anthony S. Bryk. 2002. Hierarchical Linear Models: Applications and
Data Analysis Methods. 2nd edition. Thousand Oaks, CA: Sage.
Raudenbush, Stephen W., and Robert J. Sampson. 1999. Ecometrics: Toward a science of assessing
ecological settings, with application to the systematic social observation of neighborhoods.
Sociological Methodology 29:1–41.
Rees, P. H. 1971. Factorial ecology: An extended definition, survey and critique of the field. Economic
Geography 47:220–33.
Sampson, Robert J. 2009. Disparity and diversity in the contemporary city: Social (dis)order revisited.
The British Journal of Sociology 60:1-31.
Sampson, Robert J. 2010. Collective Efficacy Theory. In Encyclopedia of Criminological Theory.
Volume 2, eds. Francis T. Cullen and Pamela Wilcox, Sage Publications.
Sampson, Robert J. 2012. Great American City: Chicago and the Enduring Neighborhood Effect.
Chicago: University of Chicago Press.
Sampson, Robert J. 2013. 2012 presidential address to the American Society of Criminology – The
place of context: A theory and strategy for criminology’s hard problems. Criminology 51:1-30.
Sampson, Robert J., Stephen W. Raudenbush, and Felton Earls. 1997. Neighborhoods and violent
crime: A multilevel study of collective efficacy. Science 277:918-24.
Sampson, Robert J. and Stephen W. Raudenbush. 2004. Seeing disorder: Neighborhood stigma and
the social construction of broken windows. Social Psychology Quarterly 67:319–42.
Sampson, Robert J., and Per-Olof Wikström. 2007. The Social Order of Violence in Chicago and
Stockholm Neighborhoods: A Comparative Inquiry. In Order, Conflict, and Violence, eds. Ian
Shapiro, Stathis N. Kalyvas and Tarek E. Masoud, New York: Cambridge University Press.
28
Shaw, Clifford R., and Henry D. Mckay. 1942. Juvenile Delinquency in Urban Areas. Chicago:
University of Chicago Press.
Snijders, Tom. A. B., and Roel J. Bosker. 2012. Multilevel Analysis: An Introduction to Basic and
Advanced Multilevel Modeling. 2nd edition. Sage.
Sturgis, Patrick, Ian Brunton-Smith, Jonathan Jackson, and Jouni Kuha. 2014. Ethnic diversity and the
social cohesion of neighbourhoods in London. Ethnic and Racial Studies 37:1286-1309.
Thomas, William I., and Florian Znaniecki. 1927. The Polish Peasant in Europe and America. New
York: Alfred A. Knopf.
Twigg, Liz, Joanna Taylor, and John Mohan. 2010. Diversity or disadvantage? Puntnam, Goodheart,
ethnic heterogeneity, and collective efficacy. Environment and Planning A 42:1421-38.
Weisburd, David, Elizabeth Groff, and Sue-Min Yang. 2012. The Criminology of Place: Street Segments
and our Understanding of the Crime Problem. Oxford: Oxford University Press.
Wells, William, Joseph A. Schafer, Sean P. Varano, and Timothy S. Bynum. 2006. Neighborhood
residents' production of order: The effects of collective efficacy on responses to neighborhood
problems. Crime and Delinquency 52:523-50.
Wikström, Per-Olof, Dietrich Oberwittler, Kyle Treiber, and Beth Hardie. 2012. Breaking Rules: The
Social and Situational Dynamics of Young People’s Urban Crime. Clarendon Studies in
Criminology. Oxford: Oxford University Press.
Zhang, Lening, Steven F. Messner, and Jianhong Liu. 2007. A multilevel analysis of the risk of
household burglary in the city of Tianjin, China. British Journal of Criminology 47:918-37.
29
Tables and figures Table 1. Model 1 and 2 Results. Model 1 is a Mixed-effects Model with no Covariates. Model 2 is a Mixed-effects Location Scale Model with no Covariates
Model 1: Two level mixed-effects Model 2: Mixed-effects location scale
Mean SD 2.5% 97.5% Mean SD 2.5% 97.5%
Constant (beta) 0.02 0.01 -0.01 0.04 0.02 0.01 0.00 0.04 Constant (alpha) -0.17 0.01 -0.20 -0.15
Random effects
Area location effect variance 0.09 0.01 0.08 0.10 0.09 0.01 0.08 0.10 Area scale effect variance 0.12 0.01 0.10 0.14 Location-scale covariance -0.05 0.01 -0.06 -0.04 Location-scale correlation -0.47 Within area variance (Pop. Avg.)1
0.90 0.01 0.89 0.91 0.89
ICC (Pop. Avg.) 0.09 0.09
1 Model 2 within area variance estimated using equation 4. Note: Sample consists of 46,346 individuals in 982 neighborhoods. DIC: Model 1 = 127379; Model 2 = 125443. Coefficients in bold have credible intervals that do not include zero.

30
Table 2. Model 3 Results. Model 3 adds Individual Covariates to Model 2 (Location and Scale)
Model 3: Location equation (beta) Model 3: Scale equation (alpha)
Mean SD 2.5% 97.5% Mean SD 2.5% 97.5%
Constant -0.26 0.08 -0.42 -0.10 -0.46 0.12 -0.68 -0.20 Female 0.00 0.01 -0.01 0.02 0.04 0.01 0.01 0.06 Age (centred) 0.01 0.00 0.01 0.02 0.01 0.01 -0.01 0.02
Ethnicity (ref: white) Asian 0.13 0.06 0.01 0.24 0.04 0.10 -0.15 0.23 Black 0.16 0.06 0.05 0.28 0.13 0.10 -0.07 0.32 Mixed/Other -0.02 0.07 -0.15 0.12 0.00 0.11 -0.23 0.23 Marital status (ref: married) Single -0.08 0.01 -0.11 -0.06 0.14 0.02 0.10 0.17 Widowed -0.06 0.02 -0.09 -0.02 0.02 0.03 -0.03 0.08 Divorced/Separated -0.17 0.02 -0.21 -0.13 0.18 0.03 0.12 0.24 Social class (ref: Class A/B) Class C -0.06 0.01 -0.08 -0.04 0.07 0.02 0.03 0.11 Class D/E -0.05 0.02 -0.08 -0.02 0.12 0.03 0.07 0.17 Tenure (ref: Privately owned) Rented (social) -0.15 0.01 -0.18 -0.13 0.21 0.02 0.17 0.25 Rented (private) -0.16 0.01 -0.18 -0.13 0.07 0.02 0.03 0.11 Rented (other) -0.11 0.04 -0.18 -0.04 0.25 0.05 0.14 0.35 Work status (ref: Employed full-time) Part-time -0.05 0.02 -0.09 -0.02 0.07 0.03 0.02 0.13 Student -0.04 0.02 -0.08 0.00 -0.10 0.04 -0.17 -0.03 Not-working -0.08 0.01 -0.10 -0.05 0.10 0.02 0.06 0.14 Victim of crime -0.29 0.02 -0.32 -0.25 0.45 0.02 0.40 0.49 Residence length 0.03 0.00 0.02 0.03 0.05 0.00 0.04 0.05
Neighborhood measures Economic disadvantage -0.15 0.02 -0.19 -0.11 0.06 0.03 0.01 0.12 Population mobility 0.00 0.01 -0.02 0.03 -0.02 0.02 -0.06 0.02 Urbanicity -0.06 0.01 -0.08 -0.04 0.02 0.02 -0.01 0.05 Age profile 0.01 0.01 -0.01 0.03 0.03 0.02 0.00 0.07 Housing structure -0.10 0.02 -0.13 -0.07 0.01 0.02 -0.03 0.06 Crime rate -0.03 0.02 -0.07 0.02 -0.14 0.03 -0.20 -0.08 Proportion Asian -0.69 0.24 -1.17 -0.23 0.61 0.33 -0.01 1.28 Proportion Asian2 0.89 0.42 0.09 1.71 -1.17 0.57 -2.32 -0.06 Proportion Black -0.49 0.40 -1.25 0.30 1.62 0.56 0.53 2.78 Proportion Black2 1.54 0.86 -0.15 3.18 -2.78 1.20 -5.18 -0.41 Proportion Other 13.67 1.68 10.38 17.14 -4.82 2.15 -8.84 -0.43 Proportion Other2 -74.77 10.51 -96.08 -54.09 11.65 13.52 -15.75 37.36 Proportion own ethnic group 0.04 0.07 -0.09 0.18 0.13 0.11 -0.10 0.34 *Asian 0.25 0.14 -0.03 0.51 -0.35 0.23 -0.81 0.11 *Black -0.18 0.17 -0.51 0.15 -0.92 0.29 -1.49 -0.35 *Mixed/other 1.43 0.59 0.26 2.59 0.01 1.00 -1.95 1.97 Cluster size (centred) 0.00 0.00 0.00 0.00 0.00 0.00 0.00 0.00 Random effects
Area location effect variance 0.06 0.00 0.05 0.06
Area scale effect variance 0.09 0.01 0.08 0.11
Location-scale covariance -0.03 0.00 -0.03 -0.02 Location-scale correlation -0.37
Note: Sample consists of 46,346 individuals in 982 neighborhoods. DIC = 122806. Coefficients in bold have credible intervals that do not include zero.

31
Table 3. Model 4-7 Results. Model 4 and 5 examine Worry about Criminal Victimization. Model 6 and 7 examine Risk Avoidance Behavior
Worry about criminal victimization Risk avoidance behavior Model 4: CE mean only Model 5: CE mean and variance Model 6: CE mean only Model 7: CE mean and variance
Mean SD 2.5% 97.5% Mean SD 2.5% 97.5% Mean SD 2.50% 97.5% Mean SD 2.5% 97.5%
Constant -0.37 0.05 -0.48 -0.28 -0.38 0.05 -0.48 -0.28 -0.16 0.04 -0.24 -0.08 -0.16 0.04 -0.24 -0.08
Level 1 covariates YES YES YES YES
Level 2 covariates YES YES YES YES
Collective efficacy (mean) -0.12 0.04 -0.20 -0.04 -0.02 0.05 -0.11 0.08 -0.19 0.03 -0.25 -0.14 -0.12 0.03 -0.19 -0.06
Collective efficacy (variance) 0.17 0.04 0.09 0.25 0.12 0.03 0.06 0.18
Random effects
Area variance 0.08 0.00 0.07 0.09 0.08 0.00 0.07 0.09 0.03 0.00 0.03 0.04 0.03 0.00 0.03 0.04
Individual variance 0.81 0.01 0.80 0.82 0.81 0.01 0.80 0.82 0.43 0.00 0.43 0.44 0.43 0.00 0.43 0.44
Note: Sample consists of 46,346 individuals in 982 neighborhoods. Model 4 DIC = 122745. Model 5 DIC = 122741. Model 6 DIC = 60892. Model 7 DIC 60888. Coefficients in bold have credible intervals that do not include zero. Level 1 covariates: gender, age, ethnicity, marital status, social class, tenure, work status, victim of crime, residence length, individual collective efficacy rating. Level 2 covariates: economic disadvantage, population mobility, urbanicity, age profile, housing structure, crime rate, proportion Asian, black, mixed, proportion own ethnic group, cluster size.

32
Figure 1 Ranked Neighborhood ICC Presented with 95% Credible Intervals. Red Horizontal Line Shows the
Mean of the ICCs across Neighborhoods

33
Figure 2 Percentage Residents from Black and Asian Backgrounds and Collective Efficacy Variance
0
0.1
0.2
0.3
0.4
0.5
0.6
0.7
0.8
0.9
0% 10% 20% 30% 40% 50%
Leve
l-1 v
aria
nce
Percent black Percent Asian

34
Appendix
Table A1. Factor Loadings (Maximum Likelihood)
Factor loadings
Collective Efficacy
People in this neighborhood can be trusted 0.74
People act with courtesy to each other in public spaces in this area 0.73
You can see from the public space here in the area that people take pride in their environment 0.71
If any of the children or young people around here are causing trouble, local people will tell them off 0.73
The people who live here can be relied upon to call the police if someone is acting suspiciously 0.71
If I sensed trouble whilst in this area, I could get help from people who live here 0.57
Eigenvalue 2.93
Worry about crime
How worried are you about having your home broken into and something stolen? 0.69
How worried are you about being mugged or robbed in this area? 0.77
How worried are you about being insulted or pestered by anybody whilst in the street 0.90
How worried are you about being physically attacked by a stranger in the street in this area? 0.84
Eigenvalue 2.59
Table A2. Generalized Partial Credit Model Results B S.E
How often do you do these things in your local area, simply as a precaution against crime…?
Avoid using public transport
Discrimination 0.96 0.02
Difficulty
Occasionally vs. Never 2.82 0.06
Sometimes vs. Occasionally 1.72 0.04
Most of the time vs. Sometimes 2.25 0.06
Always vs. Most of the time 1.67 0.07
Avoid area during day
Discrimination 5.87 0.32
Difficulty
Occasionally vs. Never 1.04 0.01
Sometimes vs. Occasionally 1.59 0.01
Most of the time vs. Sometimes 2.12 0.02
Always vs. Most of the time 2.35 0.03
Avoid area at night
Discrimination 1.11 0.02
Difficulty
Occasionally vs. Never 0.94 0.02
Sometimes vs. Occasionally 1.39 0.02
Most of the time vs. Sometimes 1.39 0.03
Always vs. Most of the time 1.42 0.03

35
Table A3. Rotated Component Loadings from Factorial Ecology
Neighborhood Measure
Socio-economic disadvantage
Urbanicity Population Mobility
Age Profile
Housing Profile
Working population on income support 0.89 0.25 0.19 0.14 0.09
Lone parent families 0.85 0.22 0.00 0.26 0.15
Local authority housing 0.85 0.06 -0.01 0.15 -0.17
Working population unemployed 0.84 0.29 0.17 0.12 0.13
Non-Car owning households 0.80 0.42 0.36 -0.01 0.06
Working in professional/managerial role -0.79 0.00 0.15 0.15 -0.37
Owner occupied housing -0.61 -0.25 -0.35 -0.57 0.05
Domestic property 0.10 0.92 0.17 0.05 0.11
Green-space -0.21 -0.90 -0.18 -0.01 -0.04
Population density (per square KM) 0.25 0.82 0.26 0.15 -0.14
Working in agriculture -0.13 -0.66 -0.01 -0.18 -0.03
In migration -0.07 0.10 0.92 0.07 0.07
Out migration -0.02 0.16 0.90 0.12 0.13
Single person, non-pensioner households 0.36 0.36 0.74 0.13 -0.09
Commercial property 0.38 0.43 0.53 0.02 -0.09
More than 1.5 people per room 0.43 0.47 0.51 0.20 -0.33
Resident population over 65 -0.05 -0.21 -0.27 -0.89 -0.02
Resident population under 16 0.43 0.04 -0.46 0.64 0.19
Terraced housing 0.32 0.26 0.10 0.27 0.69
Vacant property 0.32 -0.12 0.49 -0.17 0.53
Flats 0.45 0.36 0.49 0.01 -0.52
Eigen Value 9.3 3.3 1.9 1.4 1.3

36
Table A4. Model 4 and 5 Results for Worry about Criminal Victimization. Model 4 only includes CE Mean. Model 5 also includes CE Variance.
Model 4: CE mean only Model 5: CE mean and variance
Mean SD 2.5% 97.5% Mean SD 2.5% 97.5%
Constant -0.37 0.05 -0.48 -0.28 -0.38 0.05 -0.48 -0.28 Female 0.22 0.01 0.21 0.24 0.22 0.01 0.21 0.24 Age (centred) -0.01 0.00 -0.01 0.00 -0.01 0.00 -0.01 0.00 Ethnicity (ref: white) Asian 0.25 0.02 0.21 0.30 0.25 0.02 0.21 0.30 Black 0.13 0.02 0.08 0.18 0.13 0.02 0.08 0.18 Mixed/Other 0.15 0.03 0.10 0.21 0.15 0.03 0.10 0.20 Marital status (ref: married) Single -0.05 0.01 -0.08 -0.03 -0.05 0.01 -0.08 -0.03 Widowed -0.10 0.02 -0.13 -0.07 -0.10 0.02 -0.13 -0.07 Divorced/Separated 0.04 0.02 0.01 0.08 0.04 0.02 0.01 0.08 Social class (ref: Class A/B) Class C 0.03 0.01 0.01 0.06 0.03 0.01 0.01 0.06 Class D/E 0.06 0.02 0.02 0.09 0.06 0.02 0.02 0.09 Tenure (ref: Privately owned) Rented (social) 0.00 0.01 -0.02 0.02 0.00 0.01 -0.02 0.02 Rented (private) -0.08 0.01 -0.10 -0.05 -0.08 0.01 -0.10 -0.05 Rented (other) -0.04 0.03 -0.10 0.03 -0.04 0.03 -0.10 0.03 Work status (ref: Employed full-time) Part-time 0.00 0.02 -0.04 0.03 -0.01 0.02 -0.04 0.03 Student -0.14 0.02 -0.18 -0.09 -0.14 0.02 -0.18 -0.09 Not-working -0.03 0.01 -0.05 -0.01 -0.03 0.01 -0.06 -0.01 Victim of crime 0.35 0.01 0.33 0.38 0.35 0.01 0.32 0.38 Residence length 0.05 0.00 0.04 0.05 0.05 0.00 0.04 0.05 Individual collective efficacy rating -0.19 0.00 -0.19 -0.18 -0.19 0.00 -0.19 -0.18
Neighborhood measures Economic disadvantage 0.10 0.02 0.06 0.15 0.10 0.02 0.06 0.15 Population mobility 0.01 0.01 -0.02 0.04 0.01 0.01 -0.02 0.04 Urbanicity 0.03 0.01 0.01 0.06 0.04 0.01 0.01 0.06 Age profile 0.00 0.01 -0.03 0.03 0.00 0.01 -0.03 0.02 Housing structure 0.04 0.02 0.00 0.07 0.04 0.02 0.01 0.08 Crime rate -0.06 0.03 -0.12 -0.01 -0.05 0.03 -0.10 0.00 Proportion Asian 0.98 0.08 0.82 1.14 1.00 0.08 0.84 1.16 Proportion Black -0.44 0.18 -0.79 -0.09 -0.49 0.17 -0.81 -0.15 Proportion Other 0.25 0.57 -0.85 1.40 0.40 0.60 -0.76 1.58 Proportion own ethnic group 0.19 0.03 0.12 0.26 0.19 0.03 0.12 0.26 Cluster size (centred) 0.00 0.00 0.00 0.00 0.00 0.00 0.00 0.00 Collective efficacy (mean) -0.12 0.04 -0.20 -0.04 -0.02 0.05 -0.11 0.08 Collective efficacy (variance) 0.17 0.04 0.09 0.25 Random effects
Area location effect variance 0.08 0.00 0.07 0.09 0.08 0.00 0.07 0.09 Area scale effect variance 0.81 0.01 0.80 0.82 0.81 0.01 0.80 0.82
Note: Sample consists of 46,346 individuals in 982 neighborhoods. Model 4 DIC = 122745. Model 5 DIC = 122741. Coefficients in bold have credible intervals that do not include zero.
37
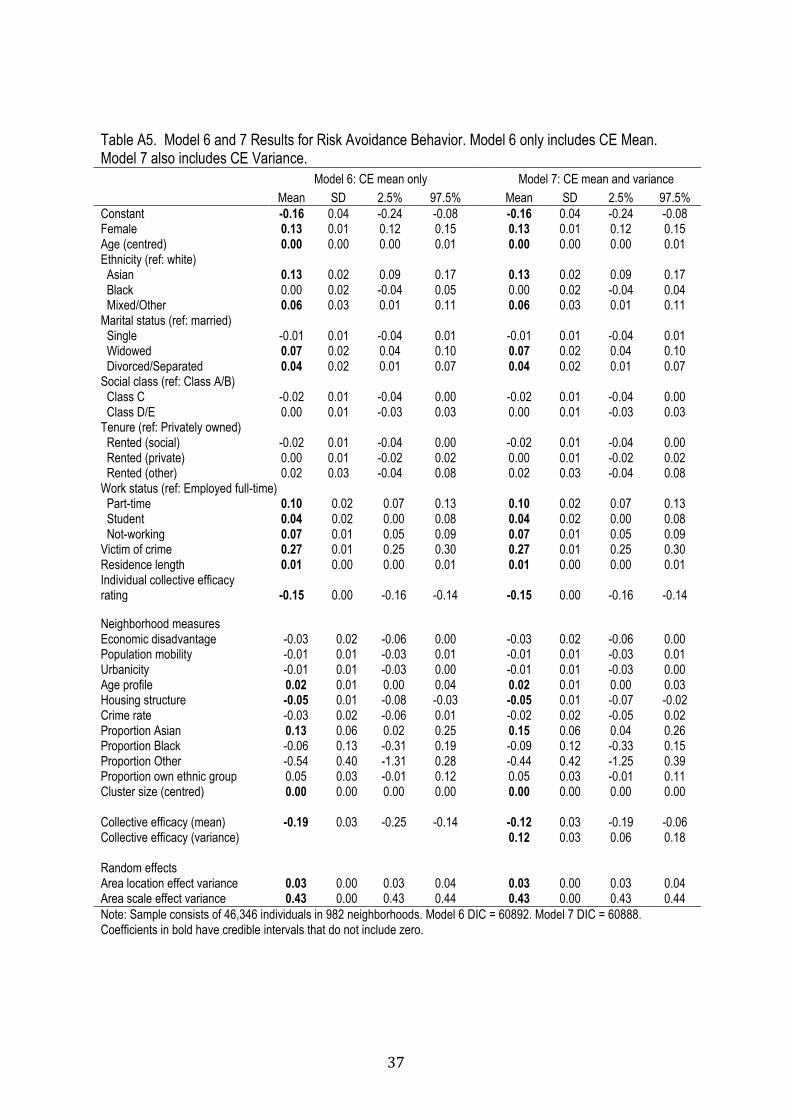
Table A5. Model 6 and 7 Results for Risk Avoidance Behavior. Model 6 only includes CE Mean. Model 7 also includes CE Variance.
Model 6: CE mean only Model 7: CE mean and variance
Mean SD 2.5% 97.5% Mean SD 2.5% 97.5%
Constant -0.16 0.04 -0.24 -0.08 -0.16 0.04 -0.24 -0.08 Female 0.13 0.01 0.12 0.15 0.13 0.01 0.12 0.15 Age (centred) 0.00 0.00 0.00 0.01 0.00 0.00 0.00 0.01 Ethnicity (ref: white) Asian 0.13 0.02 0.09 0.17 0.13 0.02 0.09 0.17 Black 0.00 0.02 -0.04 0.05 0.00 0.02 -0.04 0.04 Mixed/Other 0.06 0.03 0.01 0.11 0.06 0.03 0.01 0.11 Marital status (ref: married) Single -0.01 0.01 -0.04 0.01 -0.01 0.01 -0.04 0.01 Widowed 0.07 0.02 0.04 0.10 0.07 0.02 0.04 0.10 Divorced/Separated 0.04 0.02 0.01 0.07 0.04 0.02 0.01 0.07 Social class (ref: Class A/B) Class C -0.02 0.01 -0.04 0.00 -0.02 0.01 -0.04 0.00 Class D/E 0.00 0.01 -0.03 0.03 0.00 0.01 -0.03 0.03 Tenure (ref: Privately owned) Rented (social) -0.02 0.01 -0.04 0.00 -0.02 0.01 -0.04 0.00 Rented (private) 0.00 0.01 -0.02 0.02 0.00 0.01 -0.02 0.02 Rented (other) 0.02 0.03 -0.04 0.08 0.02 0.03 -0.04 0.08 Work status (ref: Employed full-time) Part-time 0.10 0.02 0.07 0.13 0.10 0.02 0.07 0.13 Student 0.04 0.02 0.00 0.08 0.04 0.02 0.00 0.08 Not-working 0.07 0.01 0.05 0.09 0.07 0.01 0.05 0.09 Victim of crime 0.27 0.01 0.25 0.30 0.27 0.01 0.25 0.30 Residence length 0.01 0.00 0.00 0.01 0.01 0.00 0.00 0.01 Individual collective efficacy rating -0.15 0.00 -0.16 -0.14 -0.15 0.00 -0.16 -0.14
Neighborhood measures Economic disadvantage -0.03 0.02 -0.06 0.00 -0.03 0.02 -0.06 0.00 Population mobility -0.01 0.01 -0.03 0.01 -0.01 0.01 -0.03 0.01 Urbanicity -0.01 0.01 -0.03 0.00 -0.01 0.01 -0.03 0.00 Age profile 0.02 0.01 0.00 0.04 0.02 0.01 0.00 0.03 Housing structure -0.05 0.01 -0.08 -0.03 -0.05 0.01 -0.07 -0.02 Crime rate -0.03 0.02 -0.06 0.01 -0.02 0.02 -0.05 0.02 Proportion Asian 0.13 0.06 0.02 0.25 0.15 0.06 0.04 0.26 Proportion Black -0.06 0.13 -0.31 0.19 -0.09 0.12 -0.33 0.15 Proportion Other -0.54 0.40 -1.31 0.28 -0.44 0.42 -1.25 0.39 Proportion own ethnic group 0.05 0.03 -0.01 0.12 0.05 0.03 -0.01 0.11 Cluster size (centred) 0.00 0.00 0.00 0.00 0.00 0.00 0.00 0.00 Collective efficacy (mean) -0.19 0.03 -0.25 -0.14 -0.12 0.03 -0.19 -0.06 Collective efficacy (variance) 0.12 0.03 0.06 0.18 Random effects
Area location effect variance 0.03 0.00 0.03 0.04 0.03 0.00 0.03 0.04 Area scale effect variance 0.43 0.00 0.43 0.44 0.43 0.00 0.43 0.44
Note: Sample consists of 46,346 individuals in 982 neighborhoods. Model 6 DIC = 60892. Model 7 DIC = 60888. Coefficients in bold have credible intervals that do not include zero.

38
i A non-linear association between the mean and variance is also permissible, allowing for the fact that the variability of CE assessments may be lower in neighborhoods with very high or low average estimates of CE (Hedeker and Nordgren, 2013; Leckie, 2014). However, examination of residuals suggested a linear covariance was sufficient in the current analysis. ii The City of London was not included in the METPAS sample frame as it is not under the jurisdiction of the Metropolitan Police force. The City of London is atypical, acting primarily as a business and financial center with a very low resident population (approximately 7,000) but a very high day-time population (approximately 300,000).