C. T. Bauer College of Business Institute for Regional Forecasting www.bauer.uh.edu/centers/irf
Houston Job Growth Takes a Mid-Year Breather
Robert W. Gilmer Institute for Regional Forecasting
C.T. Bauer College of Business University of Houston
Presenter
Presentation Notes
- This presentation is going to be focused closely on Houston, on energy, and how energy has driven a nearly decade of local growth It is now five and a half years since the last recession began in December 2007, next month will be four years since the recovery began in June 2009. The combination of our first financial crisis since the Great Depression, and fragile recovery, has kept the public focused on the U.S. economy. I have talked a great deal about the U.S. in my public presentations in recent years, because of this intense interest. But since the U.S. recovery began, the course of the U.S. economy has not meant much to Houston. Houston has been able to reach past a slow growing U.S. economy, and to tap into rapidly expanding world trade, and to take advantage of high oil prices. I will talk about the U.S. economy today – the consensus forecast is still for it to muddle along at 2.2 percent GDP growth and 1 percent job growth – but the focus is on oil, natural gas, petrochemicals, and the Houston economy – the real drivers of recent growth in Houston.
Since the financial crisis the Texas economy has pulled away from the U.S.
These are broader indexes of the business cycle than just the payroll employment showed earlier. They are designed to specifically track the business cycle, and contain several variables: payroll employment Unemployment real retail sales real wages This just confirms what Gov. Perry kept telling us during the campaign – that Texas has widely outperformed the U.S.
But in the same way, Houston has widely outperformed the state of Texas. Houston was outgrowing the state of Texas both before and after the crisis.
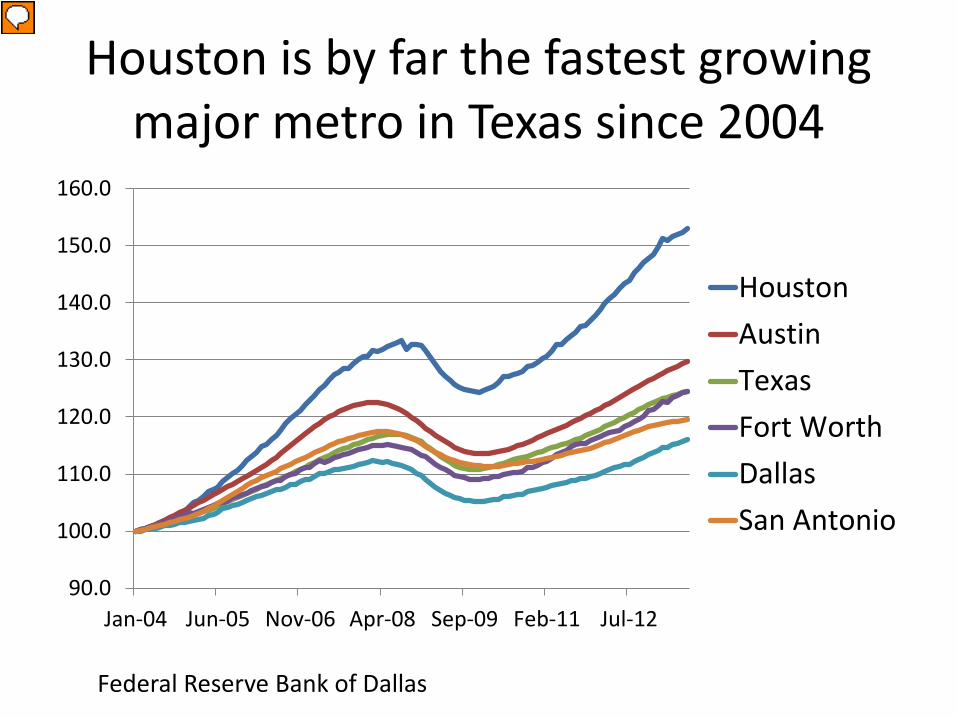
Houston is by far the fastest growing major metro in Texas since 2004
90.0
100.0
110.0
120.0
130.0
140.0
150.0
160.0
Jan-04 Jun-05 Nov-06 Apr-08 Sep-09 Feb-11 Jul-12
HoustonAustinTexasFort WorthDallasSan Antonio
Federal Reserve Bank of Dallas
Presenter
Presentation Notes
This chart orders the performance of major metropolitan areas according to the Federal Reserve Bank of Dallas business cycle indexes Houston and Austin lead the state While Fort Worth, Dallas and San Antonio lag
Year-to-date Houston job growth is running at 2.8 percent
-6
-4
-2
0
2
4
6
Note: December to December changes, except 2013 which is annualized year-to-date
Presenter
Presentation Notes
This is the annual percent change in payroll employment in Houston since 1996 Houston was swept into recession just like the rest of the nation with the onset of the financial crisis, and from Dec 2008 to Dec 2009 we lost 107,600 jobs. But the jobs came back quickly. While the U.S. is still 2.9 million jobs short of the 2007 peak, Houston restored all its jobs by November 2011. We added 105,700 jobs (Dec-Dec) last year. But the more interesting story is that this expansion has actually been underway since 2003-2004. If you start in Dec 2003, Houston has added 475,000 jobs, that is about how many jobs there are in Omaha (463,000) or Honolulu (452,000). Before the crisis, Houston did not stand out. Everyone was doing well. We shared the downturn. And the long expansion has only become obvious as Houston has soared, and the rest of the country has lagged badly.
Houston employment shows strength in recovery (3-month percent change at annual rates)
-8
-6
-4
-2
0
2
4
6
8
Jan-
07 Apr
Jul
Oct
Jan-
08 Apr
Jul
Oct
Jan-
09 Apr
Jul
Oct
Jan-
10 apr
jul
oct
11-Ja
nap
rju
loc
t12
-Jan
apr
july oct
13-Ja
n
U.S.
Houston
Bureau of Labor Statistics
Presenter
Presentation Notes
This is the same payroll data, now shown on a monthly basis, and compared to the U.S. Houston came to the recession later, did not go in as deeply, and recovered at about the same pace. - But since the recession, the taller, red bars tell us that Houston has out-stripped the U.S. by a wide margin. Since the recession ended in 2009, Houston employment has grown at 3.3 percent annual rates, the U.S. at one percent.
Purchasing managers’ index U.S. and Houston compared (s.a.)
25
30
35
40
45
50
55
60
65
70
75
Houston
U.S.
Presenter
Presentation Notes
The first piece of information we get on the U.S. economy each month is the Purchasing Manager’s Index. If it is above 50, it indicates expansion, below 50 indicates contraction. We get a similar index for Houston based on responses from local purchasing managers Note in 2003-2004, Houston separates itself from the rest of the nation by about 10 points. We fall into the crisis like the rest of the country, but come out quickly, and again separate ourselves What is the magic in 2003? It marks the year that the price of oil began to rise, and rise sharply, for $50, to $60, to $80 and ultimately $140 per barrel. Oil prices fell with the crisis, but came back quickly. Like always – and for better or worse – it is the price of oil that separates the Houston economy form the U.S.
Houston unemployment rate falls on strong job growth
2
3
4
5
6
7
8
9
10
11
U.S.Houston
Bureau of Labor Statistics
%, s.a.
Presenter
Presentation Notes
Just another way to compare Houston to the U.S. The local unemployment rate rose later, did not rise as far, and has come back down to 6.0 percent. All of the U.S. decline in the unemployment rate has been due to a fall in labor force participation – about half demographic and half discouraged workers – Houston’s decline has been built on real job gains
Is too much good news now driving Houston’s economy?
Basic v non-basic industries
Since 2010,Houston, growth led by mining, manufacturing, prof services
(% change Dec 2009 – Dec 2011) -5 0 5 10 15 20 25 30
NonfarmUpstream OilConstruction
ManufacturingWholesale
RetailTranspt and Utilities
InformationFinance
Prof/Buss ServEd and Health
Leisure/HospitalityOther Serv
Gov't
Since Dec 2011 growth is much more broadly based
-1 0 1 2 3 4 5 6 7 8
NonfarmUpstream OilConstruction
ManufacturingWholesale
RetailTranspt and Utilities
InformationFinance
Prof/Buss ServEd and Health
Leisure/HospitalityOther Serv
Gov't
Too much good news? Economic base slows, non-basic growth accelerates
(3-month change at annual rates, s.a)
-5
0
5
10
15
20
25
30
BaseNonBase
Slowdown? Yes … but healthy growth still likely for Houston
110,200
81,500
61,600
81,200
0
20,000
40,000
60,000
80,000
100,000
120,000
2012 2013 2014 2015
Houston Annual Job Growth Q4/Q4
What makes Houston grow?
• U.S. economic growth • Global growth drives local exports,
keeps oil prices high • Energy upstream and downstream
Presenter
Presentation Notes
When we discuss Houston’s growth, there are three areas to watch The national economy – we have a number of industries here that are tied to the U.S. economy: HP, AIG, Sysco, and Waste Management We have ties to the global economy through our exports and through activity at the Port of Houston And energy is critical – exploration, refining, chemicals, pipelines, and engineering. They account for perhaps half the jobs in Houston, at least if we go through the multipliers that recognize that energy employees shop at local grocery stores, laundries and dry cleaners. Without energy, Houston would be half the size it is today. Energy is the focus for today
The U.S. economy has provided little support for Houston
Presenter
Presentation Notes
As we look at the developed nation, U.S., Japan, Europe, I can definitively tell you that we are the best horse in the glue factory. The outlook for the U.S. is pretty much more of the same. Good news in housing and rising public revenues is offset by new taxes and federal spending cuts.
Gross domestic product (%-change, annual rates)
-10
-8
-6
-4
-2
0
2
4
6
2005 2006 2007 2008 2009 2010 2011 2012 2013
Presenter
Presentation Notes
GDP is the best and broadest measure we have of GDP growth, and it has averaged about 2.3 percent since the recovery began This is a disappointing figure for a recovery period, when you have 10 percent unemployment, and 20 percent of the U.S. factory capacity not utilized. Recovery should be a quick and easy process of bringing people back to work That has not been the case this time
Job Market Improves Too Slowly, Employment Growth Lags Recovery
Presenter
Presentation Notes
The job market has been even more disappointing than production
U.S. payroll jobs still 2.0 million short of prior peak in 2007
Houston’s jobs had returned from the 2009 downturn by November 2011, but the U.S. is still 2.9 million jobs (2.1 percent) of its peak in January 2008.
U.S. Employment Growth In Thousands of New Jobs per Month,1990 to 2011
-850
-650
-450
-250
-50
150
350
Bureau of Labor Statistics
3-month average
Presenter
Presentation Notes
The average monthly job increases have been slow: 85 per month in 2010, 175,000 in 2011, 183,000 monthly in 2012 – an average of 150,000 -- 150,000 is roughly what is required to cover new entrants to the labor force, so job growth has done little to nothing in bringing down unemployment -- During the decade-long expansions of the 1980s and 1990s, we average 250,000 new jobs per months -- Why so slow? Primary reason is slow output growth. You can cover the first percentage point of GDP growth with productivity gains, increases in output per worker. If you are only growing at 2 percent for year, it generates little demand for new workers.
What is missing from growth at 15 quarters after the trough?
Contribution to GDP (%)
3 Recent Recoveries
This Recovery
GDP 3.9 2.2
Cons 2.6 1.5
Res Inv 0.5 -0.4
Fixed Inv 0.9 1.2
Net Exports -0.6 -0.20
Gov’t 0.50 -0.3
Consumption, housing, and state/local gov’t all a drag (%) -2 -1 0 1
GDP
Cons
Res I
Non Res I
Govt
Net X
Presenter
Presentation Notes
Milton Friedman in the 1960s, and more recently Rhinehart and Rogoff, have set our expectations for growth after a financial crisis. Friedman told us that after a normal recession, we should quickly return to a trend growth path. Recovery will be fast, with little permanent loss, and no damage to long-term growth. But after a financial crisis, it is not so easy. The damage from the crisis, including tight credit due to financial institutions being hurt, will keep growth slow for a prolonged period. It does not have to be just financial institutions, however. The financial crisis left three big holes in the U.S. economy: -- Housing -- State and local spending (lost property and sales tax revenue) - The big one is consumption as the consumer works their way out of debt
Expect improvements in 2013?
• Housing market will start to add to GDP • State and local government revenues allow
them to grow • The consumer would have made substantial
progress on deleveraging – except for $200 billion in new taxes
Presenter
Presentation Notes
We should have expected a big year in terms of improvement in the U.S. economy We probably will see housing return to adding to GDP See state and local governments close their revenue gap and grow again But the consumer – the biggest gap – is likely to feel the effects of $200 billion in new taxes
Is the housing upturn finally here?
0
200
400
600
800
1,000
1,200
1,400
1,600
1,800
2,000
00 '01
'02
'03
'04
'05
'06
'07
'08
'09
10 11 12 13
PermitsStarts
Presenter
Presentation Notes
You can see how badly housing hurt the economy, with nearly an 80 percent decline in new home construction It appears to have made a definitive turn upward It will begin adding to GDP this year, but working its way up slowly from low levels
Housing prices stabilized and turned up over last summer of 2012
(index: 12-mo percent change)
-25.0
-20.0
-15.0
-10.0
-5.0
0.0
5.0
10.0
15.0
20.0
Case ShillerFHFA monthly
Pessimism quickly recedes in new home market
(NAHB homebuilder sentiment)
0
10
20
30
40
50
60
70
80
00 01 02 03 04 05 06 07 08 09 10 11 12 13
Optimism
Pessimism
Presenter
Presentation Notes
Pessimism quickly receded in the new home construction market. This is National Association of Homebuilder’s sentiment index. You can some return to reality in recent months about the long slog still ahead of us in getting back to a normal 1.0 to 1.2 million units
Consumer still working to deleverage after housing debt build-up
The big hole in the recovery has been the consumer. -- The consumer piled up significant debt levels during the early 2000s -- Debt to disposable personal income ratio rose from 95 percent to 135 percent, most of it in housing debt -- Working that debt off has been a long process for the consumer. It has forced significant cuts in consumer spending, and it has cost over a percent age point per year in GDP growth -- This year the consumer would have moved into the final stages of the deleveraging if not for a pile of new taxes that may delay it
University of Michigan Consumer Sentiment Data
50.0
55.0
60.0
65.0
70.0
75.0
80.0
85.0
90.0
95.0
100.0
Retail sales, ex. Autos, 2005-2012
Seasonally adjusted data
Monthly change at annual rates Monthly sales ($million)
* -40
-30
-20
-10
0
10
20
30
40
Jan-
05De
c-05
Nov
-06
Oct
-07
Sep-
08Au
g-09
Jul-1
0Ju
n-11
May
-12
Apr-
13
retail sales 6-mo average250000
270000
290000
310000
330000
350000
Dec-04 Nov-07 Oct-10
Auto Sales Still In Recovery
8.0
9.0
10.0
11.0
12.0
13.0
14.0
15.0
16.0
17.0
18.0
2006 2007 2008 2009 2010 2011 2012 2013
Million units, annual rate
New taxes in 2013 finally catching up with the consumer
• Payroll taxes rise $126 billion, Bush-era tax cut loss to high-income earners will be $50 billion, and Affordable Care Act adds $24 billion.
• Total tax increase is $200 billion or 1.6 percent of disposable personal income.
• Expected real consumer spending to drop by one percent or more in the first half of 2013, but delayed a quarter
U.S. GDP growth muddles through at 2.0-2.5 percent in 2013
(Percent change 2007 to 2014)
-10
-8
-6
-4
-2
0
2
4
6
Forecast
Houston real estate is in trying to catch up with past economic growth
Presenter
Presentation Notes
We talked about basic and non-basic industries – those that lead growth and those that follow -- real estate is the ultimate follower, often the last to respond as you move to the point where all the slack in the economy is finally taken up -- I had a call from a reporter recently, sure we were already over-building. I tried to assure her that first we really did need to build a new Tulsa, Omaha or Honolulu. Then we very well might overbuild – we have certainly done it before. But we weren’t there yet.
Existing homes sales in Houston are back on a strong track (monthly MLS, s.a.)
Home prices did not fall in Houston like elsewhere in U.S.
(median price, s.a.)
100000
110000
120000
130000
140000
150000
160000
170000
180000
190000Dollars
MLS, Texas A&M Real Estate Center
Presenter
Presentation Notes
Houston’s housing market is overheated. - The only question is why it took so long to wake up. Prices never got out of line, we were not waiting for prices to fall We have had solid job growth for three years But sometime last year, everyone woke up.
Houston single-family inventory falling sharply
3.0
4.0
5.0
6.0
7.0
8.0
9.0
Months supply at 3.1 in July
MLS, Texas A&M Real Estate Center
Presenter
Presentation Notes
So strong in fast, they have pulled inventory below the healthy 6-month level to only 3.6 months It is a seller’s market with homes selling quickly, multiple offers Supply of existing homes is limited by the fact that prices have not yet risen enough to inspire move-up sellers – not that homes are available to move up anyway
Houston single-family permits began to pick up in 2012
6-mo average
SF Permits
Texas A&M Real Estate Center
Presenter
Presentation Notes
It is also limited by a shortage of lots for new home construction -- We will probably build 28-30,000 new homes in Houston this year, not that far off of what we built last year -- The problem is a shortage of lots. All the smaller parcels of 50-100 acres have been snapped up, and it takes TIME to assemble larger parcels. -- New home sales are at such a brisk pace, that some builders have put their sales force on allocation, limiting sales and making sure that the wealth is shared
Local Real Estate Development Moving Very Quickly to Catch Up With Past Growth • All markets see rent and construction rising, vacancy
rates and cap rates falling • Apartment construction is focused inside the Loop, but
Woodlands/Montgomery County is leading an acceleration in the suburbs
• Large blocks of office space have disappeared in hottest markets like the Energy Corridor, West Sam Houston, and Woodlands.
• Retail led by suburbs, especially grocery-anchored strip malls
• Industrial has lowest vacancy rate in decades
Presenter
Presentation Notes
Last year, all the important real estate markets made a definitive turn. -- All are enjoying rising rents, falling cap rates, new construction is rising. News of 100,000 new jobs sort of lubricates the whole development process I have summarized how good it is here It is fair to say that this is needed space. We are in a catch-up period. But remember that this is the caboose. The ride does end when the engine slows down
Domestic drilling pulls back in 2012-2013
Presenter
Presentation Notes
We all know the story of the shale revolution by now. - The dogged persistence of George Mitchell in the Barnett Shale. Instead of allowing the hydrocarbons to leak out of the source rock for millions of years, trapping it in a stratigraphic rock formation, and sending the geologist out to look for these scattered pockets of hydrocarbons, we go straight to the source rock and take it out. The source rock is shale, and we use horizontal drilling and hydraulic fracturing to extract the natural gas. There is no longer any exploration risk. And shale is one of the most common of all rocks. This map shows the location of hydrocarbon bearing shale in the U.S.. It might be easier to just show where shale is NOT found.
0.0%
10.0%
20.0%
30.0%
40.0%
50.0%
60.0%
70.0%
1/5/2007 1/5/2009 1/5/2011 1/5/2013
% DIR.% HORIZ.% VERT.
Horizontal Drilling Grows with Shale Gas, Complex Oil Projects
Baker Hughes
Presenter
Presentation Notes
Since 2007, drilling has shifted from 20 percent horizontal drilling to over 60 percent This is important to Houston service companies, because the horizontal drilling and fracturing is far more resource intensive than a typical vertical well, creating greater revenues. And – for awhile – stronger margins.
Since 2005 U.S. Marketed Natural Gas Production Has Grown Rapidly
In terms of bringing new supplies of natural gas to market, we have had too much success! This hockey stick chart shows the increase in U.S. natural gas supplies since 2006, taking marketed production to all-time high levels We are well past the previous peak in 2003 The U.S. has now passed Russia as the world’s largest natural gas producer
Is marketed production of natural gas finally peaking?
1400000
1500000
1600000
1700000
1800000
1900000
2000000
2100000
2200000
Jan-05 Apr-06 Jul-07 Oct-08 Jan-10 Apr-11 Jul-12
NGMktseas adj
DOE/EIA
Presenter
Presentation Notes
There are some early signs that perhaps the natural gas market is stabilizing. Marketed natural gas might finally be peaking BUT just to (perhaps) stop the growth in natural gas production it has been necessary to remove over 450 rigs from gas-directed drilling since late 2011.
Natural gas inventories return to normal – with help from cold spring? (percent above or below 5-year average)
-40
-20
0
20
40
60
80
DOE/EIA
Presenter
Presentation Notes
Another optimistic sign that the natural gas market might be stabilizing, is the return of balance in natural gas inventories - Inventories spiked over the winter of 2011-12. And have slowly moved back to normal levels. -- A cold winter this year, and very long and cold spring have contributed to this pull-down in inventory in recent months
Natural gas price below $4.50 keeps takes out gas-directed rigs
0
2
4
6
8
10
12
14
16
0
200
400
600
800
1000
1200
1400
1600
1800
Jan-02 Sep-03 May-05 Jan-07 Sep-08 May-10 Jan-12
Gas RigsGas Price$4.50/mcf
Gas Rigs
Gas Price
Presenter
Presentation Notes
This chart track the price of natural gas and the number of rigs drilling for natural gas. We think the current critical price is about $4.50/Mcf. Above $4.50 drilling expands, below $4.50 drilling contracts. Since the July 2008 peak in drilling, over 1000 gas-directed rigs have been diverted to oil or taken out of service Just in the last 16 months, 479 have been removed from gas-directed drilling
Thank God for shale oil. Just as we learned to take natural gas from the source rock, now we also know how to extract oil. The rule now is that we can keep the oil fields busy as long as the price of oil is above about $65
High Oil/Low Gas Price Push Drilling Toward Oil-Directed Activity
0.0%
10.0%
20.0%
30.0%
40.0%
50.0%
60.0%
70.0%
80.0%
90.0%
01/05/07 01/05/09 01/05/11 01/05/13
Oil-DirectedGas-Directed
Baker Hughes
Presenter
Presentation Notes
The important thing is that oil-directed drilling has offset much of the decline in gas-directed drilling. -- For the twenty years leading up to 2009, 80 percent of U.S drilling was directed to natural gas, today the drilling is 80 percent directed to oil - Over the last 6 years, we have seen a dramatic and rapid swing from natural gas to oil
200
400
600
800
1000
1200
1400
1600
1800
2000
2200
U.S. Rig Count Weakens on Low Natural Gas Prices
Baker Hughes
Presenter
Presentation Notes
Oil-directed drilling has not completely erased the loses to natural gas. Since October 2011, domestic drilling activity is down about 261 rigs or 13 percent. It has created an over-supply of equipment, eliminated any shortage of crews, and seriously reduced the margins of the oil-service companies, especially for horizontal drilling and fracturing
The frantic edge is off domestic oil exploration and production
• Capital spending will be flat in 2013, margins squeezed, local hiring has already slowed
• There is good news offshore, where deep-water drilling continues to improve
• There is a lot of catch-up on infrastructure – on land and offshore – that won’t show up in the rig count
• Oil-directed activity now dominates U.S. drilling activity
Presenter
Presentation Notes
Global drilling is healthy
• Oil is a global product, easily transported and sold around world
• Drilling outside North America bounced back strongly after the financial crisis, should be strong in 2013
• These markets are important for Houston-based producers and oil-service firms. It is high revenue, high margin work for service companies.
• Like the U.S., these markets are 80 percent dependent on oil-directed activity
Presenter
Presentation Notes
The market for oil services outside the U.S. looks more healthy Oil is the global fungible product Been strong since the crisis High revenue, high margin work 80 percent oil directed Let’s take a look
This is the rig count outside the U.S. and Canada. You can see the quick return from the financial crisis downturn, and strong growth since that time. The work drives high margins and high revenue for the large oil service companies share in Houston – Halliburton, Schlumberger, Baker Hughes, and Weatherford
Share of foreign oil-directed activity today – by region
0102030405060708090
Total Europe Middle east Africa LatinAmerica
Asia Pacific
Percent Drilling Activity 2013 Q2
Baker Hughes
Presenter
Presentation Notes
Like the U.S., these foreign markets are also 80 percent driven by oil-directed drilling. There is variance across markets, with much less in Europe and more in Latin America. But the price of oil is the chief factor keeping the markets healthy.
Technology + High Oil Prices Unlock Oil Reserves – at a price
Dollars/Barrel Where?
Deep-water Drilling $50-$85 Gulf of Mexico, West Africa, Brazil
Tar Sands $65-$75 Alberta, Venezuela, Russia, Congo
Shale Oil $65-$75 North Dakota, Permian Basin, Eagle Ford
Presenter
Presentation Notes
Oil prices are critical the health of both the U.S. and global drilling markets. And price needs to remain above $65-$75 per barrel to make this work. We can certainly point to the importance of technology in new developments in the oil fields Tar sands We talked about George Mitchell and shale Deep-water drilling has been compared to going to the moon in terms of technical challenges BUT none of them work without a price of $65-$75. Not in the short-term, and certainly not in the long term
Who sets the price of oil: Exxon?, the Federal Reserve? the Illuminati?
Presenter
Presentation Notes
It is a question I can answer, at least in terms of who has kept the price high for the last decade
For the last decade world oil prices have been driven by emerging markets • Since 2003, all the growth in the global
demand for oil has come from emerging markets, especially Brazil, China, and India
• It has not just been oil, but food, agricultural products, and metals that have seen prices soar
• China alone accounts for one-third of increased oil demand since 2003. China and other Asia are nearly 60 percent.
Presenter
Presentation Notes
The answer: emerging markets, especially in Brazil, China, and India
Oil part of a wider commodity price boom since 2003
0
100
200
300
400
500
600
FoodAg Raw MaterialsMetalsCrude Oil
International Monetary Fund
Presenter
Presentation Notes
In terms of price increases, oil rose fastest and further But metals, food and agricultural materials like fertilizer and potash were right behind.
The developing world has been the global engine of growth since 2008
After 2003, the emerging markets really began to accelerate They were slowed briefly by the financial crisis. And since the end of the financial crisis, the emerging markets have really been the primary engine of growth in the global economy. As early as 2003, their acceleration in growth put pressure on global commodity prices. Since 2003, their growth has been fast enough to keep those prices high
Where has the emerging market growth come from?
• They have developed deep and rapidly growing domestic markets
• They have been good policy actors – balanced fiscal budgets, independent central banks, and enormous foreign exchange reserves
• They are now large markets, this year passing the developed nations in total GDP
Presenter
Presentation Notes
How did the emerging markets pull this off? Can they really decouple from the developed countries that have been their markets?
Growth in the Demand for Oil Comes from the Emerging Markets
(million b/d)
-4
-2
0
2
4
6
8
10
12
14
1996-2003 2003-2012
GlobalOECDNon-OECD
International Energy Agency
Presenter
Presentation Notes
In terms of the demand for oil, the emerging markets (green bar) became the main driver by the late 1990s, and the only driver since 2003. In the developed OECD nations, because of conservation and slow growth, the demand for oil is below its 2003 levels.
Percent contributions to oil demand growth since 2003
32.3% 25.0%
16.9% 13.7% 5.6% 5.5%
0.0%
5.0%
10.0%
15.0%
20.0%
25.0%
30.0%
35.0%
China OtherAsia
MiddleEast
LatinAmerica
FSU Africa
International Energy Agency
Presenter
Presentation Notes
Who are the actors since 2003? -China accounts of one third -The rest of Asia another quarter -Followed by the Middle East, Latin America, the FSU, and Africa
Global Growth Sluggish in 2013 (% GDP Growth)
2011 2012 2013 2014
World 4.0 3.2 3.3 4.0
U.S. 1.8 2.2 1.9 3.0
Europe 1.4 -0.6 -0.3 1.1
Japan -0.6 2.0 1.6 1.4
--- --- --- --- China 9.3 7.8 8.0 8.2
India 7.7 4.0 5.7 6.2
Brazil 2.7 0.9 2.0 4.0 Source: IMF World Economic Outlook, April 2013
Presenter
Presentation Notes
Here is the problem: The price of oil depends on emerging country growth, and the emerging nations are looking a little tired. Growth slowed significantly in these countries over the last couple of years. China from 10, to 9, to 8 percent India, from 9, to 8, to only 4 percent last year Brazil from 6 percent in 2010 to only .9 percent in 2012. Some of the slowdown is self-inflicted, as independent central banks steeped in to slow inflation But tight monetary and fiscal policies have been reversed now. Growth is expected to reaccelerate according to the IMF. And growth is expected to keep oil prices above $70 per barrel. But the global economy is the key risk to Houston’s growth in 2013 and 2014. We will come back to these risks in a few minutes.
Houston’s ties to oil and natural gas
Presenter
Presentation Notes
Houston is home to classic clusters, both upstream and downstream
Houston’s upstream exploration jobs now total over 100,000
20
30
40
50
60
70
80
90
100
110
120
1990
1990
1991
1992
1993
1994
1995
1996
1997
1998
1999
2000
2001
2001
2002
2003
2004
2005
2006
2007
2008
2009
2010
2011
2012
2012
Producer Employment
Producer +Services
Bureau of Labor Statistics
Presenter
Presentation Notes
This up stream cluster provides Houston with about 105,000 jobs – about 53,000 in producer jobs, and 51,000 in services Not surprisingly, the service jobs -- tied to work at the wellhead, and to the number of working rigs -- is less stable
Annual earnings in upstream oil double the typical Houston job in 2011
($000/worker)
Bureau of Economic Analysis
140.5
71
0
20
40
60
80
100
120
140
160
Upstream Oil All Jobs
2011
0
20
40
60
80
100
120
140
160
2001 2003 2005 2007 2009 2011
Upstream Oil
All Houston Jobs
2001-2012
Presenter
Presentation Notes
And as we add these jobs in Houston, in an important sense, they should count twice. The average wages, salaries, and employer-paid benefits are twice the level of the average job in Houston. These are skilled jobs – petroleum engineers, chemical engineers, geologists, and geophysicists. In this sense, maybe we should count 210,000 jobs upstream – not 105,000.
Houston adds manufacturing jobs since 2003
180
190
200
210
220
230
240
250
260
manufacturing employment (000)
Bureau of Labor Statistics
Presenter
Presentation Notes
There are important linkages to Houston’s manufacturing employment. Few U.S. cities can point to growth in manufacturing jobs in the U.S. in recent years – and Houston is one.
Machinery and Fabricated Metal Bring 115,000 Jobs in Houston
20
25
30
35
40
45
50
55
60
65
199019921994199619982000200220042006200820102012
MachineryFab Metal
Thousand
Bureau of Labor Statistics
Presenter
Presentation Notes
Manufacturing ties to chemicals and refining, as we will see, but in terms of job GROWTH, machinery and fabricated metal are the key industries. -- We now have about 115,000 jobs, divided equally between machinery and fabricated metal. -- These jobs are up by 45,000 since 2004.
But production hours worked fall in in mid-2013
3032343638404244464850
HoustonUS
Bureau of Labor Statistics
Presenter
Presentation Notes
The pressure on the manufacturing of these oil-field goods can be seen in the weekly hours in Houston manufacturing, which has risen to 48 hours per week. Contrast to Dallas at 43 hours, and the U.S. at less than 42 I asked a local oil service company about these numbers, and the answer I got was, “We are makin’ stuff as fast as we possibly can.”
Houston is the capital of a refining and petrochemical complex on the Texas
and Louisiana Gulf Coast
Presenter
Presentation Notes
The best way to look at Houston’s refining and petrochemical complex is: Refiners turn a barrel of oil into products like gasoline, kerosene, or jet fuel Petrochemical producers turn (in North America) natural gas liquids into plastic and synthetic rubber 3) Recognize that these are very closely related industries, and are often co-located, with inputs that might be shared, or products that can compete
Presenter
Presentation Notes
Houston is the capital of a Gulf Coast industry that spreads along the Gulf of Mexico from Corpus Christi in the west – through Victoria, Brazoria, Houston, Texas City, Beaumont, Port Arthur, Orange, Lake Charles, Baton Rouge, and New Orleans. This is sometimes called the petrochemical crescent
Gulf Coast Refining Margin ($/bbl)
0
5
10
15
20
25
30
marginSix-mo avg
Pace refining margins, Oil and Gas Journal
Presenter
Presentation Notes
Refining has been profitable. Not the Golden Age of refining once anticipated, and which ended about 2009. It was not the financial crisis that eroded margins, but a big expansion of capacity, especially the Motiva Refinery in Port Arthur, which doubled in size.
Four of eight largest ethylene complexes in the world are in Houston
Company Plant location Capacity (million tpy) Formosa Taiwan 2,935.0 Nova Alberta 2,811.7 Arabian Petrochem Saudi Arabia 2,250.0
Just four years ago, petrochemicals were thought to be a dying industry in the U.S. Natural gas was too expensive The growing markets were in Asia It was a dying industry in the U.S., slowly consolidating back onto the Houston Ship Channel But it was still big. Ethylene is probably the key building block on the Gulf Coast, and as you can see in this chart, 4 of the 8 largest ethylene complexes in the world in Houston We will soon have much more
Natural gas energy content equivalent to $20 per barrel for oil
0
20
40
60
80
100
120
140
Jan-01 Nov-02 Sep-04 Jul-06 May-08 Mar-10 Jan-12
oil $/bnat gas $/b
DOE/EIA and calculations of the author
Presenter
Presentation Notes
Petrochemicals provide the good news story about the low price of natural gas. Outside North America, producers of petrochemicals use oil-based naphtha, which is priced much like oil. In North America, Petrochemicals are made from natural gas liquids (ethane, propane, butane, etc.) and priced much like natural gas The chart shows the price of oil in dollars per barrel, compared to the price of natural gas – with the energy equivalent also stated in dollars per barrel. While oil is near $100 per barrel, natural gas has been near $20-$25 per barrel Which would you rather have as a feedstock?
August margins for ethylene were 41 cents per pound in North America, -17 cents elsewhere
Feedstock
Feedstock
Margin
Margin
-30
-10
10
30
50
70
90
110
130
150
Etane Naphtha
FeedstockOther VariableFixed CostMargin
Muse, Stancil Cash Ethylene Margins, Oil and Gas Journal, 2013
Presenter
Presentation Notes
Here is the accounting for last month: U.S. producer: 10 cents in feedstock cost, 49 cent margin Global producer: $1.34 in feedstock cost, and a – 9 cent margin The competitive advantage for domestic producers is enormous
New ethylene capacity concentrated on the U.S. Gulf Coast
Company Location Capacity (mm lb/yr)
Start-Up
Exxon Baytown 3,300 2016
Chevron Phillips Baytown 3000 2017
Dow Chemical U.S. Gulf Coast 4,200 2017
Ineos Lake Charles, LA 3,000 2018
CP Chem Baytown, TX 2,500 2016/2017
Braskem/Idesa Mexico 2,200 2015
Shell Chemical Pennsylvania 2,000 2016+
Formosa Point Comfort, TX 1,760 2015
LyondellBasell LaPorte, Texas 1,450 2012-2014
Dow Chemical Hahnville, LA 800 2012Q4
Williams Lake Charles, LA 600 2013Q3
Westlake Chemical Lake Charles, LA 230 2012
Ineos Chocolate Bayou, TX 230 2013
Presenter
Presentation Notes
The promise never to build another ethylene plant in the U.S. has been quickly forgotten. With margins like those, everyone would like to have an ethylene plant. All these projects won’t happen, but those that do will be accompanied by chlor-alkalai, polypropylene, and other plants. Historically, the U.S. has produced petrochemicals for domestic use, and exported opportunistically. These plants are being built for export.
Heavy construction to boom in U.S. and on Gulf Coast
• The American Chemistry Council recently counted 97 chemical project announcements with $77.1 billion in construction cost
connect new oil and gas plays to Houston • Many general manufacturing announcements
for energy, plastics, tires, iron and steel
It is an exciting time to be in Houston
• We have been growing rapidly for nearly a decade, and saw the local economy accelerate after the financial crisis
• This could last another decade – Shale, tar sands, and deep-water drilling mean we
can have a serious conversation about energy independence in the U.S.
– We will need to rework and expand energy infrastructure in pipelines and processing
– We have a new petrochemical industry to build
Presenter
Presentation Notes
Times are very good in Houston -- I think they will stay that way for the near-term, and perhaps for years to come -- We are seeing less short term stimulus in Houston this year: the U.S. economy remains sluggish, the domestic drilling sector has lost 13 percent of its rigs, and the emerging markets will accelerate only slowly -- The current catch-up phase will drive growth, and there is still stimulus from downstream. -- We may not see 100,000 jobs again this year – but 70-75,000 should be easily within reach -- Will it last another decade? Certainly it could. There is plenty of work to be done
It all depends on the price of oil?
• Upstream, yes. The collapse of natural gas prices and weaker natural gas liquids prices put the burden on oil
• But weak natural gas prices are driving downstream expansion and construction. It could cushion any blow
• But any threat to oil prices is a prices threat to Houston’s current expansion
Presenter
Presentation Notes
Over the medium term it all depends on the price of oil -- It needs to stay above $65-$70 per barrel to assure oil shale, tar sands, and deep-water drilling -- As we have seen the risks to the price of oil stem largely from the global economy
IMF says that medium-term risks to the global economy remain high
• Europe continues to stagnate or has a financial crisis
• Fiscal trouble in the U.S. or Japan • There is less slack in the advanced economies
than thought, and inflation breaks out • Unconventional monetary policy backfires • There is a sustained slowdown in key
emerging markets
Presenter
Presentation Notes
Risks to the global economy are very high right now according to the IMF latest report. They call these “medium-term” risks, meaning bad things that could happen over the next several years. -- A financial crisis in Europe -- A fiscal crisis in the U.S. or Japan with a downgrade of Treasury debt, as interest rates rise and debt burden grows -- There could be an unexpected outbreak of inflation, forcing interest rates up quickly -- Unconventional monetary policy creates unexpected financial bubbles -- Or there is a continued slowdown in emerging markets. There is a long history of promising early development that hits a middle-aged wall – and the development process simply stalls.\
Where is the price of oil going?
• Low oil prices pushed Houston into deep recessions in 1982, 1986, 1999 , and 2009
• The current expansion is again dependent on oil prices, and oil price depends on the health of the global economy
• No one knows where oil price will be next month – or how this ends. Don’t bet your business on the price of oil
Presenter
Presentation Notes
There are real risks to the global economy, to the price of oil, and to the Houston economy. -- I am often asked by people for outside Houston why we are so reluctant to use the word BOOM -- It is because the next word that comes to mind is BUST -- I don’t think we are likely to see a bust soon, but the risk is always there -- 1982-1986 saw Houston lose 1 job in 8, a massive housing bust, real estate bust, and a financial bust that saw 9 of the top 10 Texas holding companies fail. All because we thought the price of oil would go up forever. -- We have seen oil price collapse in 1999 with the Asian financial crisis and the 2009 with the American financial crisis -- No one know where the price of oil is going -- Bottom line: Yes, probably a good year for Houston with 70-75,000 jobs. Yes, probably a decade of work ahead in energy. But, let’s remember the lesson of the 1980s: Don’t bet your business on the price of oil.
Houston Job Growth Takes a Mid-Year Breather
Robert W. Gilmer Institute for Regional Forecasting
C.T. Bauer College of Business University of Houston
Presenter
Presentation Notes
- This presentation is going to be focused closely on Houston, on energy, and how energy has driven a nearly decade of local growth It is now five and a half years since the last recession began in December 2007, next month will be four years since the recovery began in June 2009. The combination of our first financial crisis since the Great Depression, and fragile recovery, has kept the public focused on the U.S. economy. I have talked a great deal about the U.S. in my public presentations in recent years, because of this intense interest. But since the U.S. recovery began, the course of the U.S. economy has not meant much to Houston. Houston has been able to reach past a slow growing U.S. economy, and to tap into rapidly expanding world trade, and to take advantage of high oil prices. I will talk about the U.S. economy today – the consensus forecast is still for it to muddle along at 2.2 percent GDP growth and 1 percent job growth – but the focus is on oil, natural gas, petrochemicals, and the Houston economy – the real drivers of recent growth in Houston.
Domestic Consumption of Oil is Stable, Production Rising through 2014
(million b/d)
8
10
12
14
16
18
20
Jan-11 Aug-11 Mar-12 Oct-12 May-13 Dec-13 Jul-14
ProductionConsumption
DOE/EIA
Presenter
Presentation Notes
U.S. oil consumption has been stable of declining for many years, and oil production in the U.S. is now on the rise – thanks to shale oil We can for the first time in many years, talk realistically about energy independence. Not just political pabulum or oil companies looking for a tax break, but a real opportunity to push foreign oil out of the U.S.
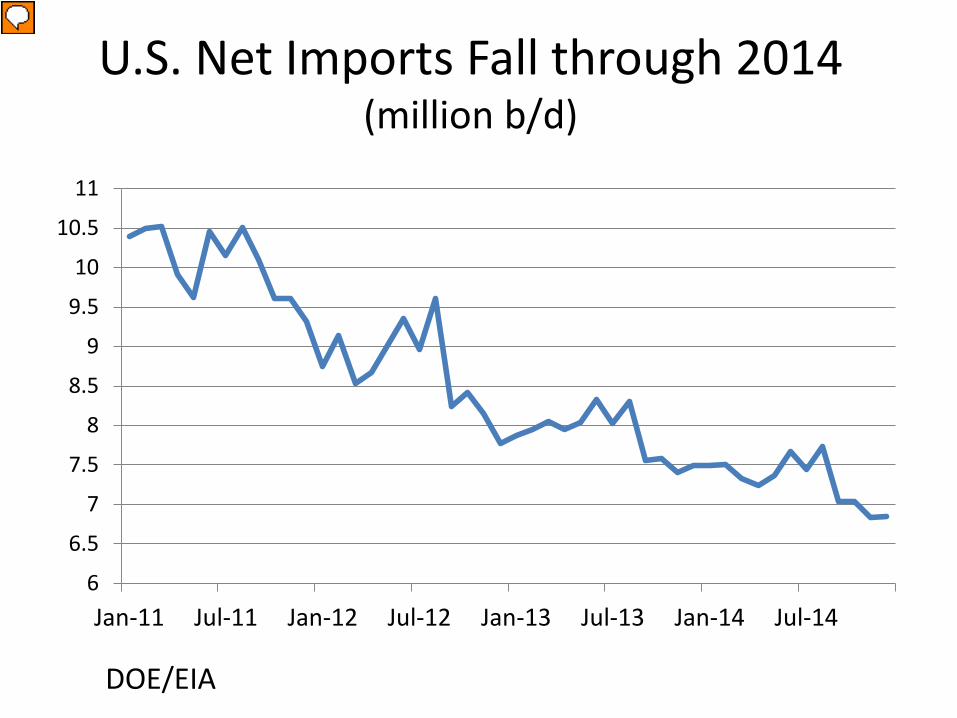
Our net U.S. imports of crude oil are already falling sharply, although it might be a decade or more before they could realistically reach zero. -- Already seeing very little light sweet crude imported into the Gulf Coast. Well supplied from eagle Ford and Permian. Most Gulf refineries handle heavier, sour crudes anyway
Good time to look to foreign markets for growth
• Barclay’s forecast year-over-year growth of nine percent outside North America
• The market is $460 billion, 2.5 times the size of the U.S. market
• The return of Iraq and 300 rigs has been the story of the last decade
• Now it is about complex geologies, and deep- water drilling
Presenter
Presentation Notes
It is a good time to be looking to foreign markets because of the weakness at home It is 2.5 times the size of the U.S. and Canada And it is expected to grow about 9 percent
Houston has largest gains in upstream oil employment in Texas, 2006-2012
6,970
15,240
21,159
33,100
0
5,000
10,000
15,000
20,000
25,000
30,000
35,000
Eagle FordBarnettPermian BasinHouston
BLS payroll employment and FRB-Dallas calculations
Presenter
Presentation Notes
That said, since 2006, Houston has had the largest employment gains in Texas. This is counting all the counties in the Barnett, Permian Basin or Eagle Ford. So all the stories you have heard about the impact of the oil boom in the small cities and counties apply to Houston – they are just less obvious in the big city.
Weekly hours surged for production workers in Houston manufacturing
30
32
34
36
38
40
42
44
46
48
50
2003 2004 2005 2006 2007 2008 2009 2010 2011 2012
HoustonDallasUS
Bureau of Labor Statistics
Presenter
Presentation Notes
The pressure on the manufacturing of these oil-field goods can be seen in the weekly hours in Houston manufacturing, which has risen to 48 hours per week. Contrast to Dallas at 43 hours, and the U.S. at less than 42 I asked a local oil service company about these numbers, and the answer I got was, “We are makin’ stuff as fast as we possibly can.”
Data from CMAI, Inc. and expressed as percent of North American Capacity
Chemical Plants Affected By Hurricane Rita
Presenter
Presentation Notes
One way to get a feel for how important this complex might be is to look at the share of North American capacity that shut down while Hurricane Rita came across the Gulf of Mexico in 2005. Ethylene about 60 percent, etc. Butadiene is for tire rubber, most of it produced near Orange Texas.