houston 2015 drinking water quality report drinking water quality report ... to be a rock solid, ......
TRANSCRIPT

City of HoustonDepartment of Public Works & Engineering
WATERHOUSTON2 2015 Drinking Water Quality Report
Special Notice for the ELDERLY, INFANTS, CANCER PATIENTS, people with HIV/AIDS or other immune problems: You may be more vulnerable than the general population to certain microbial contaminants, such as Cryptosporidium, in drinking water. Infants, some elderly, or immunocompromised persons such as those undergoing chemotherapy for cancer; those who have undergone organ transplants; those who are undergoing treatment with steroids; and people with HIV/AIDS or other immune system disorders can be particularly at risk from infections. You should seek advice about drinking water from your physician or health care provider. Additional guidelines on appropriate means to lessen the risk of infection by Cryptosporidium and other microbial contaminants are available from the Safe Drinking Water Hotline at (800) 426-4791.
En EspañolEste informe incluye información importante
sobre el agua potable. Si t iene preguntas o comentarios sobre éste
informe, favor de llamar al tel.311 para hablar con una persona bilingüe en español.
1
BelleauwoodsWillowchase
Main System
District 82
District 73
Lake Houston
Kingwood/UD5The City of Houston provides drinking water through six community public water systems, shown on the map here. Use the map and table of contents to see water quality information for your area of interest.
The City of Houston Public Water Systems
Definitions & 2 Abbreviations
Main System 3(TX1010013)
Willowchase 5(TX1011902)
Kingwood/UD 5 6(TX1010348)
District 82 7(TX1011593)
District 73 8(TX1011585)
Belleauwoods 9(TX1011594)
Contaminant 10Information
Table of Contents
About this Report
2015 Drinking Water Quality Report
This Report lists all of the federally regulated or monitored contaminants which have been found in your drinking water. The U.S. Environmental Protection Agency (EPA) requires water systems to test for more than 90 contaminants. If a contaminant was reported in a prior year’s report, but is not detected in this report year’s samples, that contaminant has been removed from the list. All drinking water may contain contaminants. When drinking water meets federal standards, there may not be any health based benefits to purchasing bottled water or point of use devices. Drinking water, including bottled water, may reasonably be expected to contain at least small amounts of some contaminants. The presence of contaminants does not necessarily indicate that water poses a health risk. More information about contaminants and potential health effects can be obtained by calling the EPA’s Safe Drinking Water Hotline (1-800-426-4791).
2015 Water Quality Report • www.houstontx.gov • call 311
-Our Mission -
“To plan, design, construct, operate and maintain Houston’s critical public infrastruc-ture systems and establish/enforce the City’s building and development codes in a
coordinated manner to provide drinking water, wastewater collection and treatment, stormwater drainage, and streets; and do so responsively, effectively, efficiently, and in
an environmentally responsible fashion to serve our customers.”
•Department of Public Works and Engineering•
AL Action Level - The concentration of a contaminant which, if exceeded, triggers treatment or other requirements that a water system must follow.
LRAALocational Running Annual Average - The average of results taken at a specific monitoring location during the previous four calendar quarters
MCLG Maximum Contaminant Level Goal - The level of a contaminant in drinking water below which there is no known or expected risk to health. MCLGs allow for a margin of safety. Since MCLGs do not consider limits of detection and available treatment technology, sometimes they are set at a level below MCLs which water systems cannot meet. MCLGs are non-enforceable public health goals.
MCLMaximum Contaminant Level - The highest level of a contaminant that is allowed in drinking water. MCLs are set as close to maximum contaminant level goals as feasible using the best available treatment technology.
MRDLG Maximum Residual Disinfectant Level Goal - The level of a drinking water disinfectant below which there is no known or expected risk to health. MRDLGs do not reflect the benefits of the use of disinfectants to control microbial contaminants.
MRDL Maximum Residual Disinfectant Level - The highest level of a disinfectant allowed in drinking water. There is convincing evidence that addition of a disinfectant is necessary for control of microbial contaminants.
N/ANot Applicable
NDNot Detected
NTUNephelometric turbidity units - a measure of turbidity, or cloudiness of water.
pCi/LPicocuries per liter - a measure of radioactivity.
ppm Parts per million, or milligrams per liter (mg/L) equivalent to one teaspoon in 1,302 gallons. ppb Parts per billion, or micrograms per liter (μg/L) equivalent to one teaspoon in 1,302,000 gallons.
TTTreatment Technique - A required process intended to reduce the level of a contaminant in drinking water.
Definitions and AbbreviationsWATER
HOUSTON2

3 2015 Water Quality Report • www.houstontx.gov • call 311
Unregulated contaminants are those for which EPA has not established drinking water standards. The purpose of unregulated con-taminant monitoring is to assist EPA in determining the occurrence of unregulated contaminants in drinking water and whether future regulation is warranted. Any unregulated contaminants detected in 2014 are reported in the table below. For additional information and data visit http://water.epa.gov/lawsregs/rulesregs/sdwa/ucmr, or call the Safe Drinking Water Hotline at (800) 426-4791.
Monitored at the Water Plants
Parameter/Substance Highest Level Allowed (EPA's MCL)
Ideal Goal(EPA’s MCLG)
Main System Detections (Sampled in 2015 unless noted otherwise)Minimum Average Maximum
Arsenic (ppb)(1) 10 0 ND 4.5 5.4
Barium (ppm) 2 2 0.05 0.1 0.4
Cyanide (ppb) 200 200 ND 24 80
Selenium (ppb) 50 50 ND 0.2 4.0
Fluoride (ppm) 4 4 ND 0.25 0.4
Nitrate (ppb) 10 10 ND 0.2 0.9
Atrazine (ppb) 3 3 ND 0.1 0.3
Simazine (ppb) 4 4 ND 0.0 0.2
Xylenes (ppm) 10 10 ND 0.0002 0.0022
Gross Alpha (pCi/L) 15 0 ND 6.0 14.0
Gross Beta (pCi/L) 50 0 ND 2.2 6.4
Combined Radium (pCi/L) 5 0 ND 1.0 2.7
Combined Uranium (ppb) 30 0 ND 1.2 7.8
Turbidity (NTU)(3) TT 95% of samples tested each month ≤ 0.3 NTU
N/A Lowest percentage ≤ 0.3 NTU: 96.1% Highest Single Measurement: 0.46 NTU
(1) Arsenic - While your drinking water meets EPA’s standard for arsenic, it does contain low levels of arsenic. EPA’s standard balances the current understanding of arsenic’s possible health effects against the costs of removing arsenic from drinking water. EPA continues to research the health effects of low levels of arsenic, which is a mineral known to cause cancer in humans at high concentrations and is linked to other health effects such as skin damage and circulatory problems.(2) Subject to reduced monitoring requirements. Detected contaminant within the past five years, in the year indicated.(3) Turbidity is a measure of the cloudiness of the water. We mointor turbidity because it is a good indicator of the effectiveness of our filtration system.
Unregulated Contaminants
Unregulated Contaminant (Units) Min Avg Max Unregulated Contaminant (Units) Min Avg Max
1,4-Dioxane (ppb) 2014(1) ND 0.0 0.1 Hexavalent Chromium (ppb) 2013(1) ND 0.7 5.1
Bromochloromethane (ppb) 2013(1) ND 0.0 0.1 Molybdenum (ppb) 2014(1) ND 1 8
Chlorate (ppm) 2013(1) ND 0.03 0.52 Perfluoroheptanoic acid (PFHpA) (ppb) 2013(1) ND 0.00 0.01
Chromium (ppb) 2014(1) ND 0.3 6 Strontium (ppb) 2014(1) ND 183 650
Cobalt (ppb) (2013) ND 0.0 2.1 Vanadium (ppb) 2013(1) ND 1.1 16
(1) Contaminant detected in the year indicated, during the 2013 - 2014 unregulated monitoring sampling period.
3
Main SystemPWS ID 1010013
In 2015 the Main System produced an average of 428 million gallons of water every day: for the City of Houston: 87% from surface water treatment plants and13% from groundwater plants. Surface water comes from the San Jacinto River through Lake Conroe and Lake Houston, and from the Trinity River, through Lake Livingston, and is treated at one of the system’s three large surface water treatment plants. The main system also has more than 100 wells that produce groundwater from the Evangeline and Chicot Aquifers at depths greater than 750 feet.
WATERHOUSTON2

2015 Water Quality Report • www.houstontx.gov • call 311
(1) The percentage of samples collected every month that detect the presence of coliform bacteria. (2) Coliforms are bacteria that are naturally present in the environment and are used as an indicator that other, potentially-harmful bac-teria may be present. Coliforms were found in more samples than allowed and this was a warning of potential problems. This system collects and analyzes more than 390 samples for coliform. According to state and federal regulations, no more than 5 percent (%) of the samples are allowed to be positive for coliform. In April 2015 7.5% of samples were coliform positive and in May 2015 14.8% of samples were coliform positive - which is more than the allowed percentage. In the area where the positive samples occurred Drinking Water Operations staff flushed water from the water lines, performed sample investigations and adjusted disinfection treatment at the water plants until we saw an improvement in the distribution test results. The system returned to compliance in June 2015.
*During the compliance period of January 1, 2013 – December 31, 2015, we completed all required monitoring and testing for lead and copper in August 2015. These monitoring and testing results are required to be submitted to Texas Commission on Environmental Qual-ity (TCEQ) within 10 days after the sampling period. The City of Houston did not submit the results of monitoring and testing to TCEQ by the deadline, and therefore, did not meet the reporting requirements set by TCEQ in Chapter 30, Section 290, Subchapter F. As our customers, you have the right to know what happened and what we did to correct the situation. We have installed a quality control in our reporting process to ensure all future reports are submitted timely. Nevertheless, the City of Houston wants you to know that all required tests were done timely and the results met the health standards. Your water is SAFE to drink.
Parameter/Substance Highest Level Allowed (EPA's MCL)
Ideal Goal(EPA’s MCLG)
Main System Detections (Sampled in 2015 unless noted otherwise)
Monitored in the Distribution SystemMinimum Average Maximum
Chloramines (Disinfectant) 4.0 (MRDL) <4.0 (MRDLG) 0.1 2.1 4.2
Total Coliform % Positive(1) 5% of monthly samples positive for Total Coliform 0 detections 0% 2.3% 7.5% April 2015 (2)
14.8% May 2015(2)
E.coliA routine sample and repeat sample are Total Coliform positive, and one is
also E.coli positive.0 detections
Detected E.coli positive results in 8 routine samples, however repeat samples were all negative for E.coli
and Total Coliform.
Haloacetic Acids (ppb) Yearly Average (LRAA) < 60 N/AHighest LRAA: 41.3 ppb
Individual sample results range from < 6.0 (not detected) to 73.1
Total Trihalomethanes (ppb) Yearly Average (LRAA) < 80 N/AHighest LRAA: 51.8 ppb
Individual sample results range from < 4.0 (not detected) to 70.4
Lead and Copper Monitoring is done at customer’s taps.
Lead (ppb) * AL = 90% below 15 ppb 0 90% below 4.0 ppb No sample above 15 ppb
Copper (ppm) * AL = 90% below 1.3 ppm 1.3 90% below 0.174 ppm No sample above 1.3 ppm
-Our Vision - To be a rock solid, responsive and respected performance organization for the City of Houston and its citizens; to be the premier public works department in the United States.
•Department of Public Works and Engineering•
4
Main System2015 Sample Results Continued WATER
HOUSTON2
5 2015 Water Quality Report • www.houstontx.gov • call 311
Parameter/Substance Highest Level Allowed (EPA's MCL)
Ideal Goal(EPA’s MCLG)
Main System Detections (Sampled in 2015 unless noted otherwise)
Monitored at the Water PlantsMinimum Average Maximum
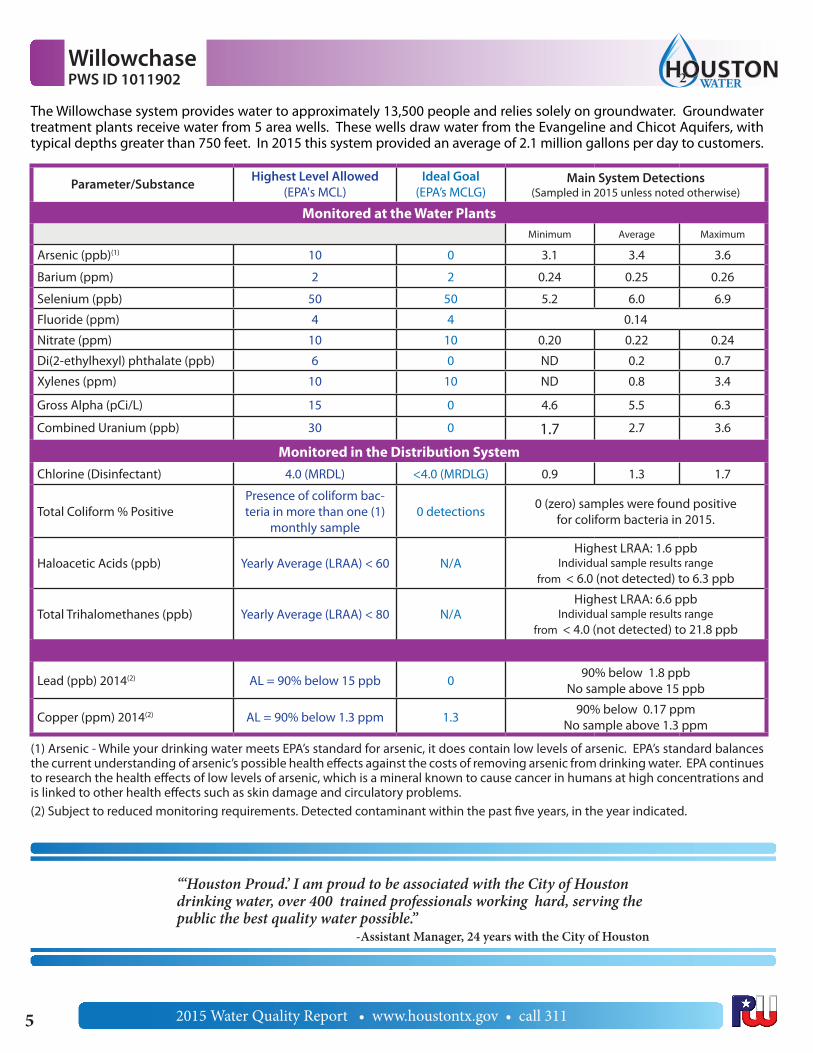
Arsenic (ppb)(1) 10 0 3.1 3.4 3.6
Barium (ppm) 2 2 0.24 0.25 0.26
Selenium (ppb) 50 50 5.2 6.0 6.9
Fluoride (ppm) 4 4 0.14
Nitrate (ppm) 10 10 0.20 0.22 0.24
Di(2-ethylhexyl) phthalate (ppb) 6 0 ND 0.2 0.7
Xylenes (ppm) 10 10 ND 0.8 3.4
Gross Alpha (pCi/L) 15 0 4.6 5.5 6.3
Combined Uranium (ppb) 30 0 1.7 2.7 3.6
Monitored in the Distribution SystemChlorine (Disinfectant) 4.0 (MRDL) <4.0 (MRDLG) 0.9 1.3 1.7
Total Coliform % PositivePresence of coliform bac-teria in more than one (1)
monthly sample0 detections 0 (zero) samples were found positive
for coliform bacteria in 2015.
Haloacetic Acids (ppb) Yearly Average (LRAA) < 60 N/AHighest LRAA: 1.6 ppb
Individual sample results range from < 6.0 (not detected) to 6.3 ppb
Total Trihalomethanes (ppb) Yearly Average (LRAA) < 80 N/AHighest LRAA: 6.6 ppb
Individual sample results range from < 4.0 (not detected) to 21.8 ppb
Lead and Copper Monitoring is done at customer’s taps.
Lead (ppb) 2014(2) AL = 90% below 15 ppb 0 90% below 1.8 ppb No sample above 15 ppb
Copper (ppm) 2014(2) AL = 90% below 1.3 ppm 1.3 90% below 0.17 ppm No sample above 1.3 ppm
(1) Arsenic - While your drinking water meets EPA’s standard for arsenic, it does contain low levels of arsenic. EPA’s standard balances the current understanding of arsenic’s possible health effects against the costs of removing arsenic from drinking water. EPA continues to research the health effects of low levels of arsenic, which is a mineral known to cause cancer in humans at high concentrations and is linked to other health effects such as skin damage and circulatory problems.(2) Subject to reduced monitoring requirements. Detected contaminant within the past five years, in the year indicated.
The Willowchase system provides water to approximately 13,500 people and relies solely on groundwater. Groundwater treatment plants receive water from 5 area wells. These wells draw water from the Evangeline and Chicot Aquifers, with typical depths greater than 750 feet. In 2015 this system provided an average of 2.1 million gallons per day to customers.
“‘Houston Proud.’ I am proud to be associated with the City of Houston drinking water, over 400 trained professionals working hard, serving the public the best quality water possible.”
-Assistant Manager, 24 years with the City of Houston
WillowchasePWS ID 1011902 WATER
HOUSTON2
2015 Water Quality Report • www.houstontx.gov • call 311
Parameter/Substance Highest Level Allowed (EPA's MCL)
Ideal Goal(EPA’s MCLG)
Main System Detections (Sampled in 2015 unless noted otherwise)
Monitored at the Water PlantsMinimum Average Maximum
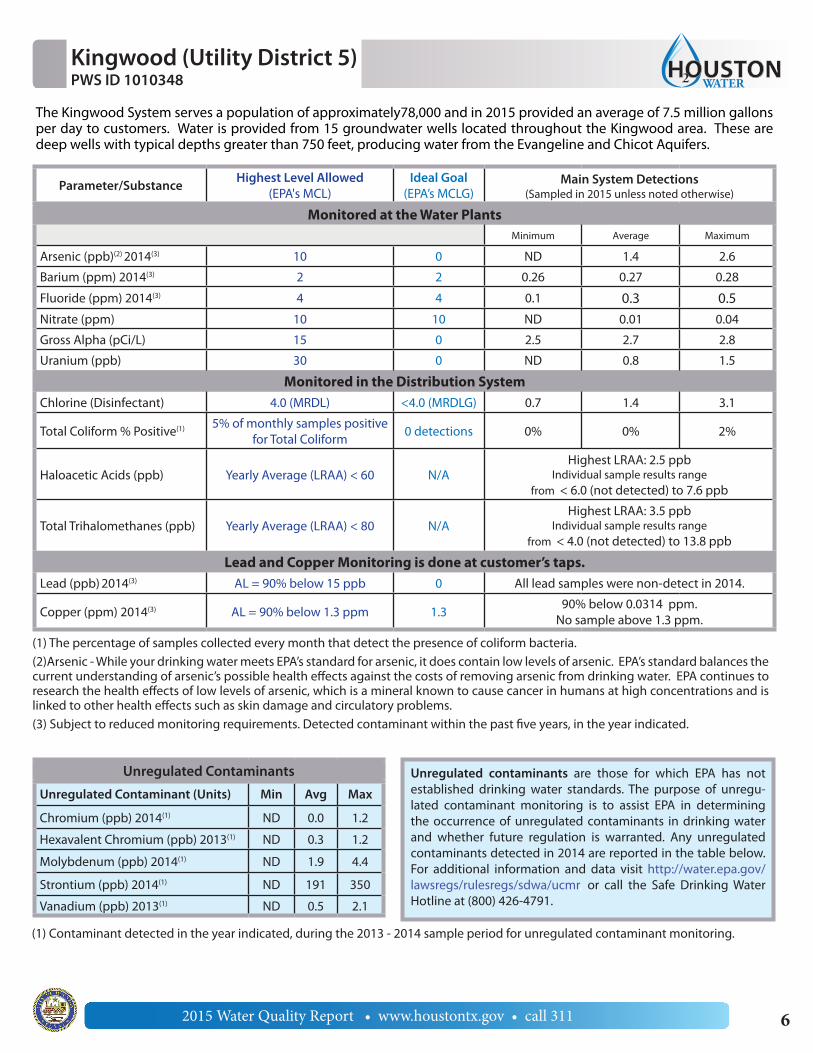
Arsenic (ppb)(2) 2014(3) 10 0 ND 1.4 2.6
Barium (ppm) 2014(3) 2 2 0.26 0.27 0.28
Fluoride (ppm) 2014(3) 4 4 0.1 0.3 0.5Nitrate (ppm) 10 10 ND 0.01 0.04
Gross Alpha (pCi/L) 15 0 2.5 2.7 2.8
Uranium (ppb) 30 0 ND 0.8 1.5
Monitored in the Distribution SystemChlorine (Disinfectant) 4.0 (MRDL) <4.0 (MRDLG) 0.7 1.4 3.1
Total Coliform % Positive(1) 5% of monthly samples positive for Total Coliform 0 detections 0% 0% 2%
Haloacetic Acids (ppb) Yearly Average (LRAA) < 60 N/AHighest LRAA: 2.5 ppb
Individual sample results range from < 6.0 (not detected) to 7.6 ppb
Total Trihalomethanes (ppb) Yearly Average (LRAA) < 80 N/AHighest LRAA: 3.5 ppb
Individual sample results range from < 4.0 (not detected) to 13.8 ppb
Lead and Copper Monitoring is done at customer’s taps. Lead (ppb) 2014(3) AL = 90% below 15 ppb 0 All lead samples were non-detect in 2014.
Copper (ppm) 2014(3) AL = 90% below 1.3 ppm 1.3 90% below 0.0314 ppm. No sample above 1.3 ppm.
(1) The percentage of samples collected every month that detect the presence of coliform bacteria. (2)Arsenic - While your drinking water meets EPA’s standard for arsenic, it does contain low levels of arsenic. EPA’s standard balances the current understanding of arsenic’s possible health effects against the costs of removing arsenic from drinking water. EPA continues to research the health effects of low levels of arsenic, which is a mineral known to cause cancer in humans at high concentrations and is linked to other health effects such as skin damage and circulatory problems.(3) Subject to reduced monitoring requirements. Detected contaminant within the past five years, in the year indicated.
The Kingwood System serves a population of approximately78,000 and in 2015 provided an average of 7.5 million gallons per day to customers. Water is provided from 15 groundwater wells located throughout the Kingwood area. These are deep wells with typical depths greater than 750 feet, producing water from the Evangeline and Chicot Aquifers.
Unregulated Contaminants
Unregulated Contaminant (Units) Min Avg Max
Chromium (ppb) 2014(1) ND 0.0 1.2
Hexavalent Chromium (ppb) 2013(1) ND 0.3 1.2
Molybdenum (ppb) 2014(1) ND 1.9 4.4
Strontium (ppb) 2014(1) ND 191 350
Vanadium (ppb) 2013(1) ND 0.5 2.1
Unregulated contaminants are those for which EPA has not established drinking water standards. The purpose of unregu-lated contaminant monitoring is to assist EPA in determining the occurrence of unregulated contaminants in drinking water and whether future regulation is warranted. Any unregulated contaminants detected in 2014 are reported in the table below. For additional information and data visit http://water.epa.gov/lawsregs/rulesregs/sdwa/ucmr, or call the Safe Drinking Water Hotline at (800) 426-4791.
(1) Contaminant detected in the year indicated, during the 2013 - 2014 sample period for unregulated contaminant monitoring.
6
Kingwood (Utility District 5)PWS ID 1010348 WATER
HOUSTON2

7 2015 Water Quality Report • www.houstontx.gov • call 311
Parameter/Substance Highest Level Allowed (EPA's MCL)
Ideal Goal(EPA’s MCLG)
Main System Detections (Sampled in 2015 unless noted otherwise)
Monitored at the Water PlantsMinimum Average Maximum
Barium (ppm) 2 2 0.2
Fluoride (ppm) 4 4 0.1
Nitrate (ppm) 10 10 0.2
Monitored in the Distribution SystemChlorine (Disinfectant) 4.0 (MRDL) <4.0 (MRDLG) 0.8 1.3 1.8
Total ColiformPresence of coliform bac-teria in more than one (1)
monthly sample0 detections 0 (zero) samples were found positive
for coliform bacteria in 2015.
Haloacetic Acids (ppb) 2013(1) Yearly Average (LRAA) < 60 N/AHighest LRAA: 1.5 ppb
Individual sample results range from 1.2 to 1.8 ppb
Total Trihalomethanes (ppb) 2013(1) Yearly Average (LRAA) < 80 N/AHighest LRAA: 5.4
Individual sample results range from 4.9 to 5.8 ppb
Lead and Copper Monitoring is done at customer’s taps.
Lead (ppb)* AL = 90% below 15 ppb 0 90% below 5.0 ppb No sample above 15 ppb
Copper (ppm)* AL = 90% below 1.3 ppm 1.3 90% below 0.081 ppm No sample above 1.3 ppm
(1) Subject to reduced monitoring requirements. Detected contaminant within the past five years, in the year indicated.
*During the compliance period of January 1, 2013 – December 31, 2015, we completed all required monitoring and testing for lead and copper in August 2015. These monitoring and testing results are required to be submitted to Texas Commission on Environmental Quality (TCEQ) within 10 days after the sampling period. The City of Houston did not submit the results of monitoring and testing to TCEQ by the deadline, and therefore, did not meet the reporting requirements set by TCEQ in Chapter 30, Section 290, Subchapter F. As our customers, you have the right to know what happened and what we did to correct the situation. We have installed a quality control in our reporting process to ensure all future reports are submitted timely. Nevertheless, the City of Houston wants you to know that all required tests were done timely and the results met the health standards. Your water is SAFE to drink.
District 82 provided an average of 40,000 gallons of water per day in 2015 This system provides water for approximately 670 people and relies solely on groundwater from the Evangeline aquifer through two wells located in the area.
-Our Values-Commitment to excellence through continuous improvement, integrity,
competence, innovation, courage and selfless service. Trustworthiness is the essential catalyst for effective teamwork.
•Department of Public Works and Engineering•
7
District 82PWS ID 1011593 WATER
HOUSTON2

2015 Water Quality Report • www.houstontx.gov • call 311
Parameter/Substance Highest Level Allowed (EPA's MCL)
Ideal Goal(EPA’s MCLG)
Main System Detections (Sampled in 2015 unless noted otherwise)
Monitored at the Water PlantsMinimum Average Maximum
Arsenic (ppb)(1) 2014(2) 10 0 2.6
Barium (ppm) 2014(2) 2 2 0.3
Fluoride (ppm) 2014(2) 4 4 0.16 0.17 0.17
Nitrate (ppm) 10 10 0.01 0.03 0.04
Gross Alpha (pCi/L) 2014(2) 15 0 6.5
Combined Radium (pCi/L) 2014(2) 5 0 0.5
Uranium (ppb) 2014(2) 30 0 3.5
Monitored in the Distribution SystemChlorine (Disinfectant) 4.0 (MRDL) <4.0 (MRDLG) 0.4 1.3 1.9
Total Coliform Presence of coliform bac-teria in more than one (1)
monthly sample0 detections 0 (zero) samples were found positive
for coliform bacteria in 2015.
Lead and Copper Monitoring is done at customer’s taps.
Lead (ppb) 2014(2) AL = 90% below 15 ppb 0 90% below 3.3 ppb
No sample above 15 ppb
Copper (ppm) 2014(2) AL = 90% below 1.3 ppm 1.390% below 0.18 ppm
No sample above 1.3 ppm
(1) Arsenic - While your drinking water meets EPA’s standard for arsenic, it does contain low levels of arsenic. EPA’s standard bal-ances the current understanding of arsenic’s possible health effects against the costs of removing arsenic from drinking water. EPA continues to research the health effects of low levels of arsenic, which is a mineral known to cause cancer in humans at high concentrations and is linked to other health effects such as skin damage and circulatory problems.(2) Subject to reduced monitoring requirements. Detected contaminant within the past five years, in the year indicated.
District 73 serves approximately 4,300 people through four groundwater wells located throughout the area. These are deep wells with typical depths greater than 750 feet, producing water from the Evangeline and Chicot aquifers. In 2015 this system provided an average of 330,000 gallons per day to customers.
8
“It’s truly special to live in a city in the world where you can drink water straight from the tap. I’m not sure everyone realizes that, and I am proud to be a part of the effort.”
-Engineer, 8 years with the City of Houston
District 73PWS ID 1011585
-Our Mission- To be the nation’s leading Public Utility, champion for the environment, providing reliable service of exceptional quality to the most satisfied customers in the nation.
•PWE Public Utilities Division•
WATERHOUSTON2
9 2015 Water Quality Report • www.houstontx.gov • call 311
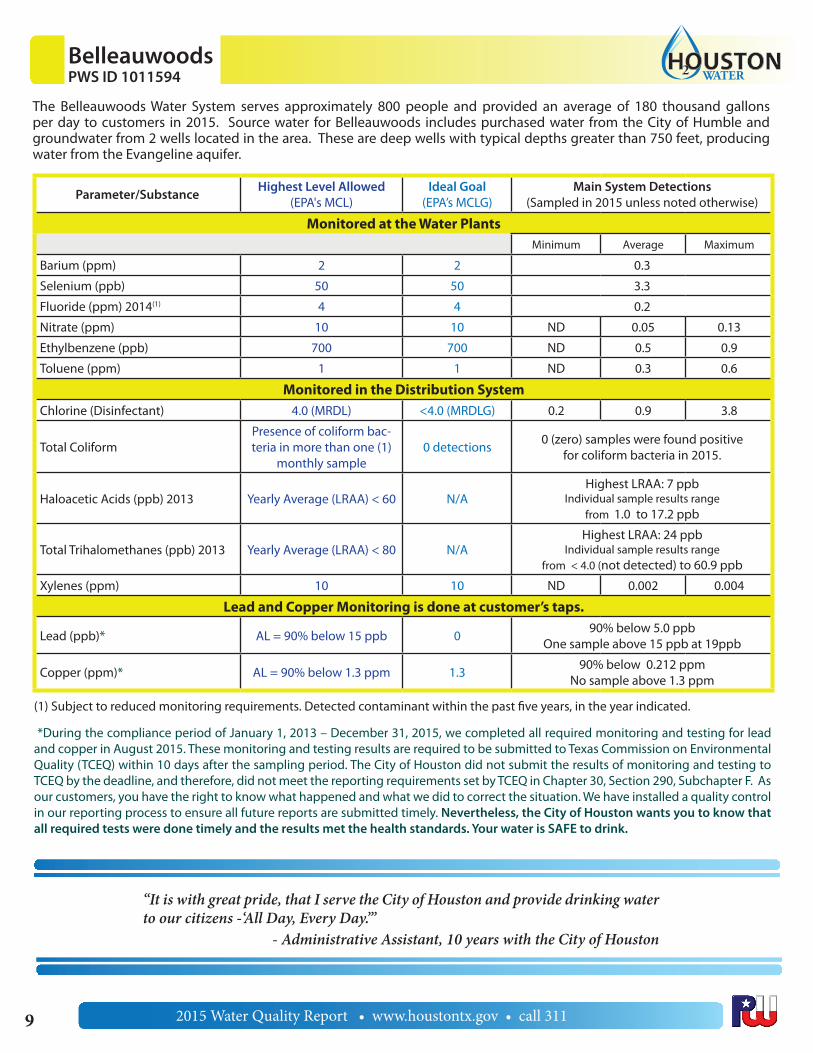
The Belleauwoods Water System serves approximately 800 people and provided an average of 180 thousand gallons per day to customers in 2015. Source water for Belleauwoods includes purchased water from the City of Humble and groundwater from 2 wells located in the area. These are deep wells with typical depths greater than 750 feet, producing water from the Evangeline aquifer.
Parameter/Substance Highest Level Allowed (EPA's MCL)
Ideal Goal(EPA’s MCLG)
Main System Detections (Sampled in 2015 unless noted otherwise)
Monitored at the Water PlantsMinimum Average Maximum
Barium (ppm) 2 2 0.3
Selenium (ppb) 50 50 3.3
Fluoride (ppm) 2014(1) 4 4 0.2
Nitrate (ppm) 10 10 ND 0.05 0.13
Ethylbenzene (ppb) 700 700 ND 0.5 0.9
Toluene (ppm) 1 1 ND 0.3 0.6
Monitored in the Distribution SystemChlorine (Disinfectant) 4.0 (MRDL) <4.0 (MRDLG) 0.2 0.9 3.8
Total ColiformPresence of coliform bac-teria in more than one (1)
monthly sample0 detections 0 (zero) samples were found positive
for coliform bacteria in 2015.
Haloacetic Acids (ppb) 2013 Yearly Average (LRAA) < 60 N/AHighest LRAA: 7 ppb
Individual sample results range from 1.0 to 17.2 ppb
Total Trihalomethanes (ppb) 2013 Yearly Average (LRAA) < 80 N/AHighest LRAA: 24 ppb
Individual sample results range from < 4.0 (not detected) to 60.9 ppb
Xylenes (ppm) 10 10 ND 0.002 0.004
Lead and Copper Monitoring is done at customer’s taps.
Lead (ppb)* AL = 90% below 15 ppb 0 90% below 5.0 ppb One sample above 15 ppb at 19ppb
Copper (ppm)* AL = 90% below 1.3 ppm 1.3 90% below 0.212 ppm No sample above 1.3 ppm
(1) Subject to reduced monitoring requirements. Detected contaminant within the past five years, in the year indicated.
*During the compliance period of January 1, 2013 – December 31, 2015, we completed all required monitoring and testing for lead and copper in August 2015. These monitoring and testing results are required to be submitted to Texas Commission on Environmental Quality (TCEQ) within 10 days after the sampling period. The City of Houston did not submit the results of monitoring and testing to TCEQ by the deadline, and therefore, did not meet the reporting requirements set by TCEQ in Chapter 30, Section 290, Subchapter F. As our customers, you have the right to know what happened and what we did to correct the situation. We have installed a quality control in our reporting process to ensure all future reports are submitted timely. Nevertheless, the City of Houston wants you to know that all required tests were done timely and the results met the health standards. Your water is SAFE to drink.
“It is with great pride, that I serve the City of Houston and provide drinking water to our citizens -‘All Day, Every Day.’”
- Administrative Assistant, 10 years with the City of Houston
BelleauwoodsPWS ID 1011594 WATER
HOUSTON2
2015 Water Quality Report • www.houstontx.gov • call 311
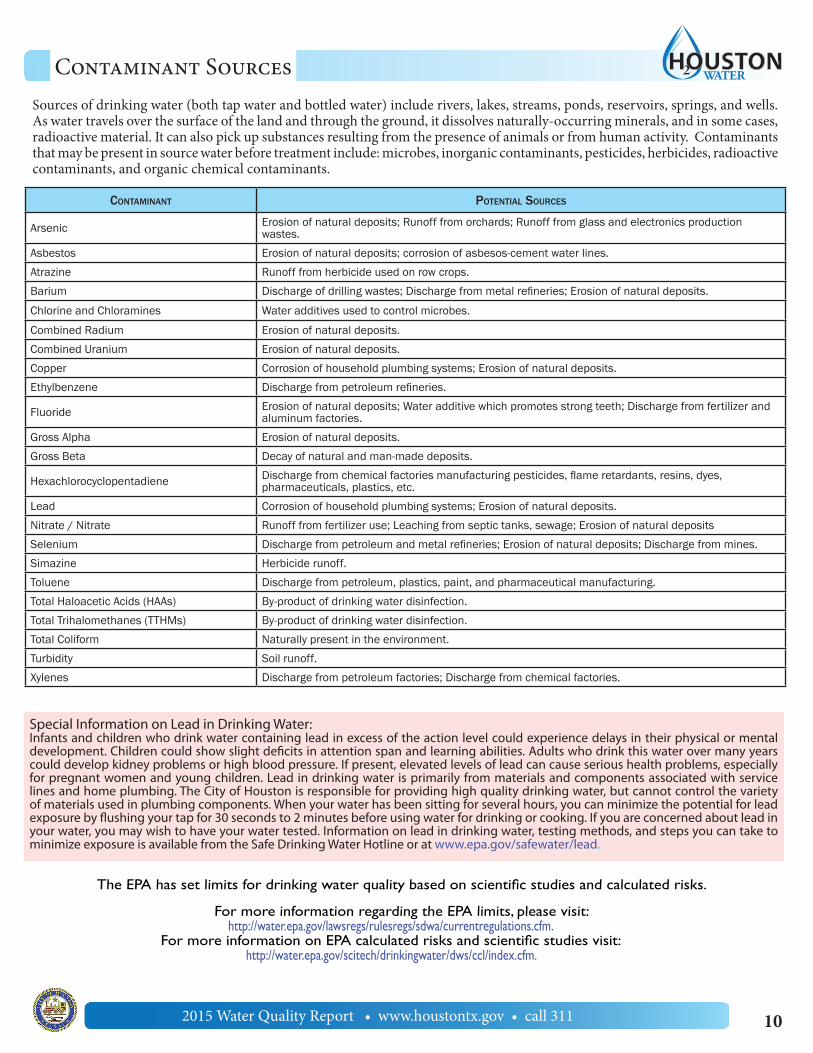
Contaminant Potential SourCeS
Arsenic Erosion of natural deposits; Runoff from orchards; Runoff from glass and electronics production wastes.
Asbestos Erosion of natural deposits; corrosion of asbesos-cement water lines.Atrazine Runoff from herbicide used on row crops.Barium Discharge of drilling wastes; Discharge from metal refineries; Erosion of natural deposits.
Chlorine and Chloramines Water additives used to control microbes.
Combined Radium Erosion of natural deposits.Combined Uranium Erosion of natural deposits.Copper Corrosion of household plumbing systems; Erosion of natural deposits.Ethylbenzene Discharge from petroleum refineries.
Fluoride Erosion of natural deposits; Water additive which promotes strong teeth; Discharge from fertilizer and aluminum factories.
Gross Alpha Erosion of natural deposits.Gross Beta Decay of natural and man-made deposits.
Hexachlorocyclopentadiene Discharge from chemical factories manufacturing pesticides, flame retardants, resins, dyes, pharmaceuticals, plastics, etc.
Lead Corrosion of household plumbing systems; Erosion of natural deposits.Nitrate / Nitrate Runoff from fertilizer use; Leaching from septic tanks, sewage; Erosion of natural depositsSelenium Discharge from petroleum and metal refineries; Erosion of natural deposits; Discharge from mines.Simazine Herbicide runoff.Toluene Discharge from petroleum, plastics, paint, and pharmaceutical manufacturing.Total Haloacetic Acids (HAAs) By-product of drinking water disinfection.Total Trihalomethanes (TTHMs) By-product of drinking water disinfection.Total Coliform Naturally present in the environment.Turbidity Soil runoff.Xylenes Discharge from petroleum factories; Discharge from chemical factories.
Special Information on Lead in Drinking Water:Infants and children who drink water containing lead in excess of the action level could experience delays in their physical or mental development. Children could show slight deficits in attention span and learning abilities. Adults who drink this water over many years could develop kidney problems or high blood pressure. If present, elevated levels of lead can cause serious health problems, especially for pregnant women and young children. Lead in drinking water is primarily from materials and components associated with service lines and home plumbing. The City of Houston is responsible for providing high quality drinking water, but cannot control the variety of materials used in plumbing components. When your water has been sitting for several hours, you can minimize the potential for lead exposure by flushing your tap for 30 seconds to 2 minutes before using water for drinking or cooking. If you are concerned about lead in your water, you may wish to have your water tested. Information on lead in drinking water, testing methods, and steps you can take to minimize exposure is available from the Safe Drinking Water Hotline or at www.epa.gov/safewater/lead.
The EPA has set limits for drinking water quality based on scientific studies and calculated risks.
For more information regarding the EPA limits, please visit: http://water.epa.gov/lawsregs/rulesregs/sdwa/currentregulations.cfm.
For more information on EPA calculated risks and scientific studies visit: http://water.epa.gov/scitech/drinkingwater/dws/ccl/index.cfm.
10
Sources of drinking water (both tap water and bottled water) include rivers, lakes, streams, ponds, reservoirs, springs, and wells. As water travels over the surface of the land and through the ground, it dissolves naturally-occurring minerals, and in some cases, radioactive material. It can also pick up substances resulting from the presence of animals or from human activity. Contaminants that may be present in source water before treatment include: microbes, inorganic contaminants, pesticides, herbicides, radioactive contaminants, and organic chemical contaminants.
Contaminant Sources WATERHOUSTON2
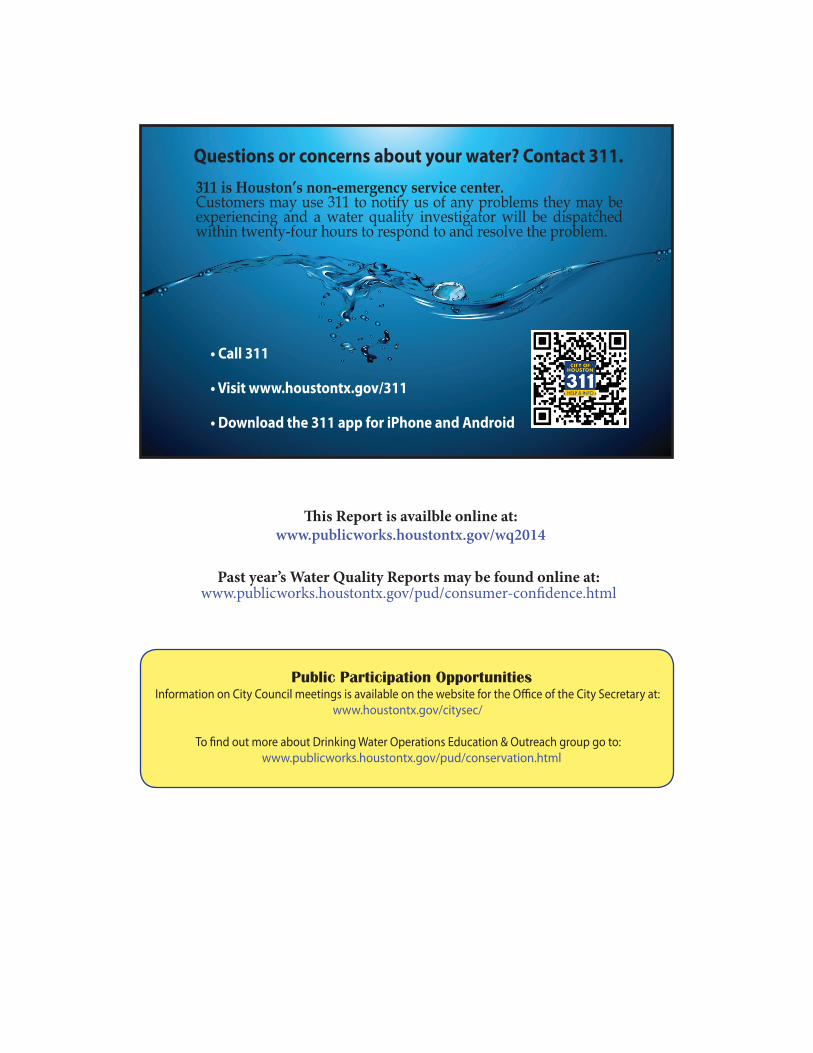
Questions or concerns about your water? Contact 311.
• Call 311
• Visit www.houstontx.gov/311
• Download the 311 app for iPhone and Android
311 is Houston’s non-emergency service center.Customers may use 311 to notify us of any problems they may be experiencing and a water quality investigator will be dispatched within twenty-four hours to respond to and resolve the problem.
This Report is availble online at:www.publicworks.houstontx.gov/wq2014
Past year’s Water Quality Reports may be found online at:www.publicworks.houstontx.gov/pud/consumer-confidence.html
Public Participation OpportunitiesInformation on City Council meetings is available on the website for the Office of the City Secretary at:
www.houstontx.gov/citysec/
To find out more about Drinking Water Operations Education & Outreach group go to: www.publicworks.houstontx.gov/pud/conservation.html