housing supply in ireland since 1990: the role of costs ... · housing supply in ireland since...
TRANSCRIPT

Housing supply in Ireland since 1990: the role of costs and regulation
Ronan C. Lyons1
Abstract Housing has been central to both global and Irish economic fortunes in the past generation and was
a major contributory factor in the Great Recession. Recently, greater attention has been paid around
the world to the economics of housing supply, including the costs imposed by regulations relating to
land use and building. In Ireland, the last few years have seen a growing shortage of
accommodation, particularly in the Greater Dublin area, as population growth is unmet by new
additions to the housing stock. This paper examines both costs and regulatory conditions relating to
Irish housing supply since 1990. It brings together a range of studies on the cost of building in Ireland
currently and relates these to both house prices and household incomes. It then derives a number of
summary statistics of regulatory conditions, based on the full dataset of over one million planning
permissions across Ireland’s 35 local authorities over the period 1990-2013. These include: the
median time-to-planning-decision; the proportion of projects approved; and the median number of
conditions imposed. The connection between these and Ireland’s extreme housing market cycle
since 1990 is then explored, before the paper concludes by noting avenues for future research.
1 Trinity College Dublin & Spatial Economics Research Centre (LSE), [email protected]. I would like to
acknowledge the support of the Irish Research Council’s New Foundations scheme (2014) in making this research possible, as well as the excellent research assistance provided by Yulia Plaksina. I am also grateful to Tom Dunne, Eithne Fitzgerald, John Fitzgerald, Fadi Hassan, Brian Lucey, Sean Lyons, Conor O’Donovan, John O’Hagan, Lorcan Sirr and Peter Stafford for comments, information, data and other forms of assistance. All errors are mine and mine alone.
1. Introduction The Global Financial Crisis has highlighted the importance of understanding macroeconomic
fluctuations. The housing market is now understood to be central to those fluctuations, with housing
the most important consumption good in developed economies. Its unique role in the economy
stems from its dual role as a good (shelter) and an asset (real estate). As macroeconomics looks to
develop models that incorporate a realistic financial sector, therefore, understanding what
determines house prices remains an important challenge.
House prices are determined by demand, which reflects factors such as income, demographics and
user cost, and two forms of supply: credit and housing. A growing literature – led by John
Muellbauer at Oxford – has examined the impact of an outward shift in credit supply on house prices
(see, for example, Fernandez-Corugedo & Muellbauer 2006 and Duca, Muellbauer & Murphy 2011).
Such shifts are now believed to be responsible for much of house price growth in economies such as
the US, the UK and Ireland in the decade to 2007. Since 2012, dramatic house price growth in
selected markets in the same economies has focused the attention of policymakers on the
importance of housing supply and obstacles to new construction. This is particularly pertinent in
Ireland, where roughly 50,000 new households were formed in Dublin 2010-2015, while fewer than
10,000 new dwellings were built in the same period.
There has been a growing interest internationally in the determinants of housing supply. Some
studies have used geographic characteristics of different parts of the US to examine how prices
respond to supply (for example, Saiz 2010). There is reason to think, however, that even controlling
for costs and revenues, supply of new homes might shift with the market cycle, reflecting among
other things changes in planning and regulatory conditions.
This paper examines how conditions in the planning system in Ireland varied with the extreme
housing market cycle in Ireland since the mid-1990s. Section 2 outlines evidence from other
economies on the relationship between land use regulation and housing market outcomes, as well
as briefly reviewing literature on the Irish housing market. Section 3 describes the data used in the
analysis, which come from planning applications made to Ireland’s 35 local authorities over the
period 1990-2013. Section 4 presents stylised facts from the data and illustrates its use by exploring
two potential determinants of whether an application was approved: the political make-up of the
local authority; and whether the application was made in a “Section 23” zone.
The apparent countercyclicality of regulatory conditions – in other words, the evidence that it
became tougher to have an application approved as the bubble reached its height – is reconciled
with economic theory in Section 5. This is done primarily through the distinction between process
regulation and output regulation, which will have different effects on the supply of and demand for
planning permits. Section 6 investigates output regulations by examining the cost of building a
dwelling over time, and relating this to prices and to incomes, before Section 7 concludes.
2. Related Literature As noted in the introduction, with housing prices determined by supply among other things, the
determinants of housing supply are the subject of growing interest. Quigley & Raphael (2005)
examine land-use regulation in California, using a sample of over 400 cities in the 1990 and 2000

Census years and a survey of land-use officials to measure the restrictiveness of land use in each city.
They find that cities with stricter land use regulations suffered from fewer new homes built and thus
higher house prices and greater house price increases 1990-2000. Ihlanfeldt (2007) found largely
similar effects in Florida, accounting for endogeneity and demand-side effects. Glaeser & Ward
(2009) focus on the Greater Boston area, also home to significant house prices increases in the run-
up to the Global Financial Crisis. They also find that land-use restrictions significantly hampered new
development.
The most comprehensive study of US housing supply is Saiz (2010). He exploits the fact that a
demand shock in housing should lead to a supply response, as well as the fact that barriers to entry
are needed to prevent supernormal profits in the long run. He identifies two sources of barrier to
entry in the housing market – geographic and regulatory – and measures them for all major
American cities (again using survey measures to capture land-use restrictions). The core of Saiz’s
research is that the change house prices in a city depends on the change in construction costs, and
the change in housing stock. As the change in housing stock is endogenous, demand is instrumented
in three ways. For the US as a whole over the period 1970-2000, a 10% increase in demand brings
about a 6.5% increase in prices – roughly half this impact is due to geography and almost all the
remainder is due to regulation. Put another way, a city with sufficient geography and no regulatory
barriers would expect to see prices rise by just 0.6% in response to a 10% increase in demand.
More recently, Hilber & Vermeulen (2015) have applied a similar model to a panel of 353 local
planning authorities in England 1974-2008. They test whether house prices respond more strongly to
growth in income where supply is tightly constrained, exploiting variation from a policy reform, vote
shares and historical density. In line with the US literature, they find regulatory constraints affect
how house prices respond to an outward shift in demand and also that the effects of supply
constraints are greater during boom than bust periods.
In relation to the Irish housing market, very little research has been carried out on the determinants
of housing supply. A wave of research in the late 1990s and early 2000s examined the house price
equation but was typically limited by excluding credit conditions and any treatment of expectations.2
More recently, research from the Central Bank of Ireland has included measures of credit conditions,
dramatically improving the explanatory power of house price models (Addison et al, 2009). Lyons &
Muellbauer (2015) examine Irish house prices in error-correction and multiple equation settings,
including both credit conditions and (adaptive) expectations. They find that the loosening of credit
conditions (as measured by the ratio of mortgage credit to deposits) explains the vast majority of
house price increases between 2002 and 2007.
A recent paper by Stevenson & Young (2014) attempts to model Irish housing completions directly,
using quarterly data for the period 1978-2008. They find that construction activity responds
relatively rapidly to disequilibrium in supply, but not to disequilibrium in prices (consistent with
extrapolative expectations). Their model also includes a price equation, although both are likely to
be misspecified as they do not include credit conditions or expectations, thus biasing the user cost
term. There remains scope, therefore, for a richer understanding of Irish housing supply, in
particularly by considering the role of regulatory conditions.
2 See, for example, Harmon & Hogan (2000), Stevenson (2003), Roche (2004) and McQuinn (2004). An
exception is Murphy (2005), although financial liberalization is treated as a categorical variable.

3. Data from Planning Permissions
3.1 Irish planning archives To measure regulatory conditions in Ireland over the period 1990-2013, the database of Irish
planning applications for this period was used. The data were gathered at local authority level via
their websites, using a Python script to convert planning permission applications into a database.
After merging the data from the 35 separate systems, only those relating to Full Permissions and
from the period 1990-2013 (inclusive) were kept. In addition to the 35 top-level local authorities,
unique identifiers were assigned to each of the 78 lowest-level granting authorities. For example,
within Kerry County Council, planning decisions were made by one of four granting authorities:
Killarney Town Council, Listowel Town Council, Tralee Town Council or Kerry County Council itself.
Using the description of the development applied for, binary variables were constructed to reflect
each of the following: building (in particular where either of the character strings ‘erect’ or
‘construct’ appears); residence (dwelling, bungalow and house were by far the three most
commonly used terms to indicate a private residence); and extension (where any of the follow
strings were matched: extension, extend, refurbish).3 Any entry which met the following three
conditions was deemed to relate to the construction of residential real estate: where the ‘build’ and
‘dwell’ variables had a value of 1 and the extension variable had a value of 0.
In addition to the application having to refer to the construction of residential real estate, to be
included in the analysis, it also had to be a full application. This means that invalid or withdrawn
applications were not counted – more specifically, three variables reflecting (unconditional)
acceptance, a conditional grant and a refusal were generated, corresponding to the recorded
decision.
Two valid datasets were then constructed. The first, narrower, dataset refers to full applications
(which were either accepted, conditionally or unconditionally, or refused) where reference is made
in the application to the construction of a dwelling (but not reference to extension or
refurbishment). The second, broader, dataset excludes the requirement that construction be
referred to. This reflects the fact that, in certain local authorities in particular, a substantial number
of applications do not refer to construction or erection, rather merely state ‘dwelling-house’ in the
application. The narrower dataset includes just over 255,000 planning applications between 1990
and 2013, while the broader dataset includes 440,000 applications.4
For the majority of valid applications, it is possible to calculate the time between application and the
planning decision. Those with a ‘time-to-planning-decision’ (ttpd) of between one working week and
two years were classified as having a valid entry, meaning a total of just under 275,000 valid
applications had information on ttpd. Some simple summary statistics of the dataset are presented
in Table 1.
3 Due to the nature of the functions within Stata, variants of these terms using upper-case or proper-noun case
were also searched for. 4 There were incomplete archives of planning applications for a number of local authorities during the 1990s.
For the period from 1995 on, almost all local authorities have complete archives available online – the only exceptions being Carlow and Wexford County Councils (to 1999 and 1998 respectively).

Table 1. Summary statistics of the Planning Permissions Database
Description Number
Total number of planning applications gathered from 35 LAs 1,113,754
Valid sample of complete applications for Full Permission (broad
definition)
440,440
Valid sample of complete applications for Full Permission
(narrow definition)
225,704
Consistent 1995-2013 sample (broad definition) 374,943
Mean time-to-planning-decision (TTPD), days (valid sample) 103
Median time-to-planning-decision (TTPD), days (valid sample) 61
LAs with full information on TTPD and number of conditions (out
of 35)
21
3.2 Section 23 reliefs Two other sets of data are used, to illustrate the potential applications of the newly formed dataset,
as well as to examine the determinants of whether a planning application is successful. Firstly,
information was collected on the geographical and temporal scope of the Section 23 relief, a term
applied to six different schemes relating to tax reliefs for rented residential property in operation for
varying periods between 1998 and 2004.5 While relating to rented properties in certain districts, two
aspects of the relief suggest a potentially larger impact. The first feature worth noting about the
Section 23 reliefs is that the restriction to rental properties referred to first-use only. Thus, builders
could enjoy lower costs of construction and, following a brief period of letting the property, could
then sell it on.
Secondly, while the reliefs covered expenditure on the purchase, construction, conversion or
refurbishment of property meeting certain conditions, the qualifying taxable income was not tied to
that property: all Irish rental income was affected, thus creating a free option, of sorts, to reduce tax
paid while potentially also generating a new income source. To reflect this downward shift in the
cost of house-building, and thus the upward shift in demand for planning permissions, a number of
“treatment” and “control” groups were designed, reflecting the three principal Section 23 schemes:
Rural Renewal, Town Renewal and Urban Renewal.
The Rural Renewal scheme was open to applications made between May 1998 and December 2004
and referring to property in Counties Leitrim and Longford, as well as specific townlands in Cavan,
Roscommon and Sligo (roughly 150 in total across all three counties). By using the date of
5 Five earlier schemes, relating predominantly to districts within Dublin and particular seaside/island resorts,
existed at various stages between 1991 and 1999.

application and by checking the address of the proposed development to see if it was in the counties
or townlands specified, it is possible to construct a binary variable for applications that were eligible
for the Rural Renewal Scheme.
Similar variables were constructed for the Town Renewal and Urban Renewal schemes. The Town
Renewal scheme was open to applications between 1 April 2000 and 31 December 2004 (although,
as with the Rural Renewal scheme, some expense reliefs continued to apply until 2008). Eligibility
was restricted to roughly 100 towns across 24 local authorities. The Urban Renewal Scheme, lastly,
was open to applications made between August 1998 and December 2002. The geographic scope of
this scheme was less precise, although this primarily relates to the five largest cities (Dublin, Cork,
Galway, Limerick and Waterford). For 36 urban areas, it was possible to construct a binary variable
reflecting their (time-bound) eligibility in the Urban Renewal Scheme.
A subset of the 440,000 valid planning applications, therefore, is in both areas and periods eligible
for each of the three schemes. Similarly, there are applications relating to areas and/or periods
similar to but not eligible for tax relief. For example, applications from counties Sligo, Roscommon
and Cavan but in townlands outside those designated for Section 23 constitute a ‘control group’ of
sorts (Rural Control vs. Rural S23).6 Likewise, applications relating to the towns covered under the
Town Renewal Scheme but made between the start of the Rural and Town schemes (May 1998 to
March 2000) constitute a control group for the Town scheme (Town Control vs. Town S23). Lastly,
the Urban Renewal Scheme covered a shorter period than the others while also only covering 73 of
Ireland’s 139 towns with a population of at least 1,500 people (in the 2002 Census). Thus, both the
other 66 towns for the period of the Urban Renewal Scheme, and the areas covered by the scheme
for the period after its end but before the end of the other schemes (January 2003 to December
2004) constitute control groups for the urban scheme. The towns not covered are split between
those outside the Commuter Counties (Urban Ctrl1) and those within the five-county Greater Dublin
area (Urban Ctrl2), given the potential for different trends in the demand for housing. The covered
towns in the 2003/2004 period forms Urban Ctrl3.
3.3 Political make-up of councils Secondly, in addition to information on Section 23, statistics on the make-up of the local authority
councils, by political party, were included. Despite the formal separation of final decisions on
planning applications from elected local representatives, it may be the case that council with a
greater fraction of Fianna Fail or Green Party representatives may create a different planning
environment than other councils, everything else being equal. Likewise, a greater fraction of
councillors coming from outside the main political parties may be associated with systematically
different behaviour. This was done by incorporating results from the 1991, 1999, 2004 and 2009
local elections in the 35 local authorities. The fraction was calculated on the basis of decision date;
i.e. where a planning application was made in April 1999 but decided on in August 1999, the 1999-
2004 Council, which was in place from June, was deemed the relevant one.
6 Strictly speaking, this assumes that assignment into a relief scheme was as good as random, which is not the
case. However, it is possible to examine pre- and post-trends to assess how similar the ‘treatment’ and ‘control’ groups are in each of the three schemes.
4. Initial Insights
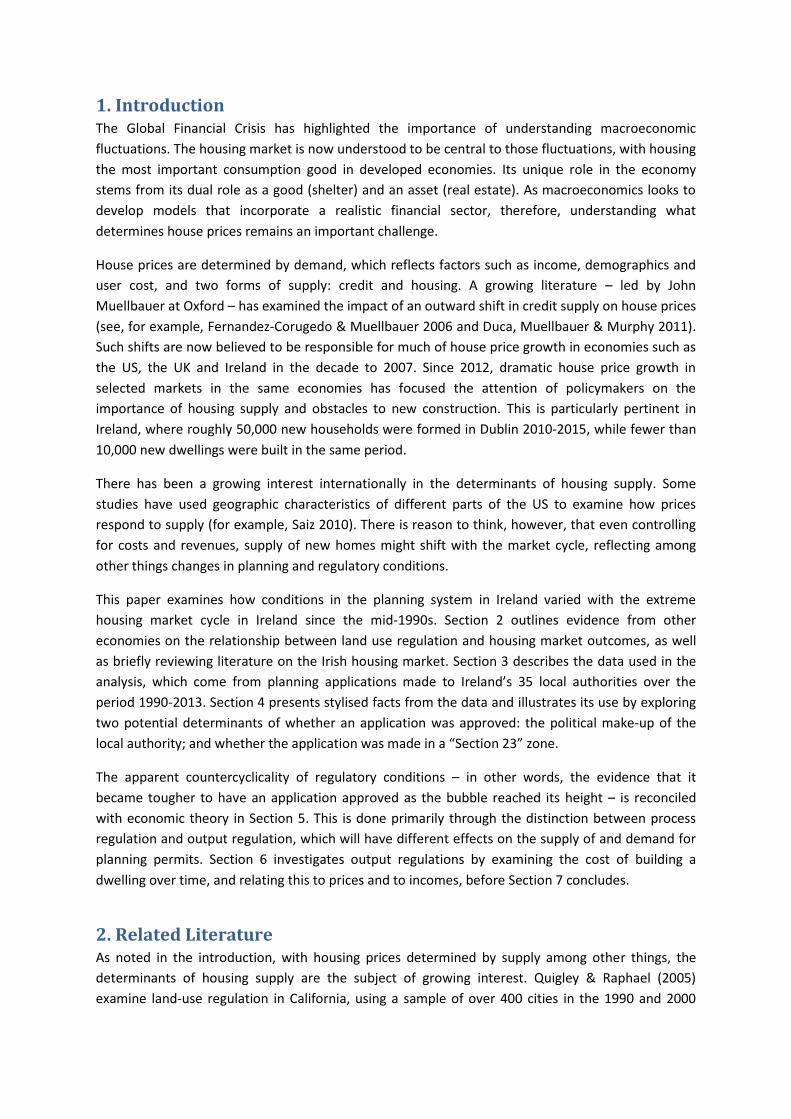
4.1 Trends over time Figure 1 shows the volume of applications for construction of residential dwellings from 1990 on,
and in a consistent way from 1995 on. The solid line shows the total number of applications, using
the broader definition of residential development, for those local authorities ever-present from
1995 on. There is a clear increase in planning applications from the mid-1990s to 2000 and then
again from 2002 to 2006. It is interesting to note that applications peaked before house prices
(which peaked in early 2007).
Figure 1. Volume of applications for residential dwellings, 1990-2013
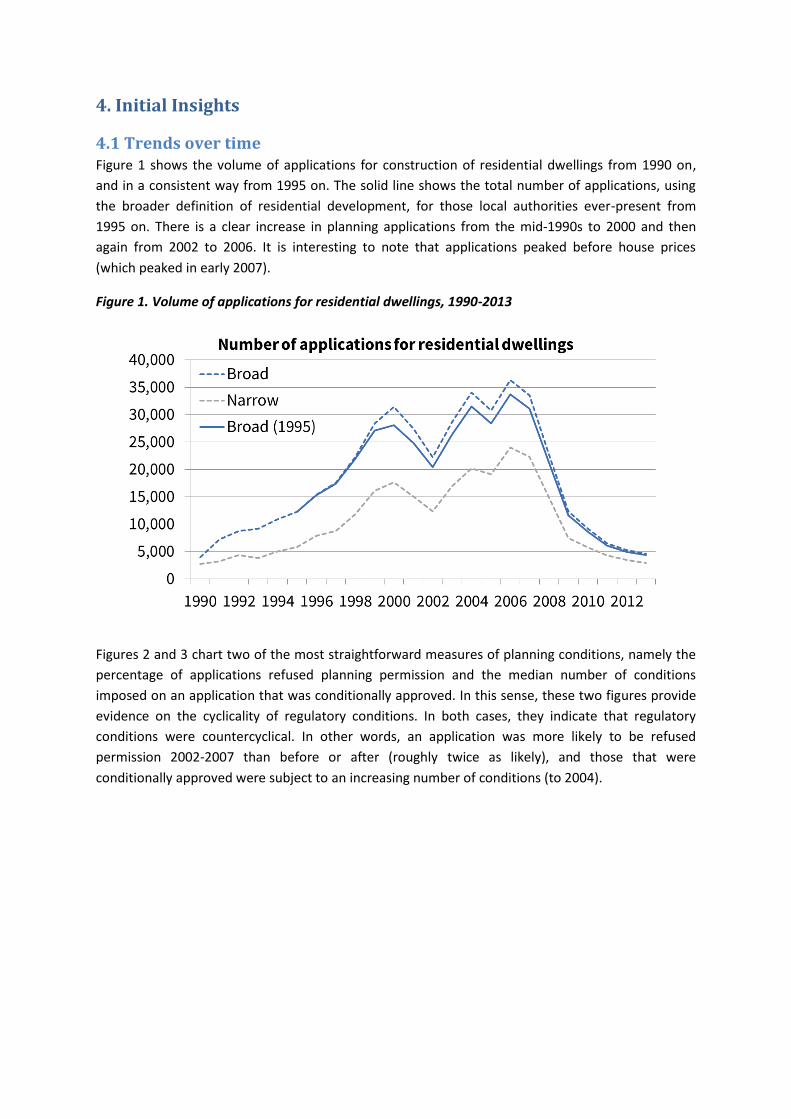
Figures 2 and 3 chart two of the most straightforward measures of planning conditions, namely the
percentage of applications refused planning permission and the median number of conditions
imposed on an application that was conditionally approved. In this sense, these two figures provide
evidence on the cyclicality of regulatory conditions. In both cases, they indicate that regulatory
conditions were countercyclical. In other words, an application was more likely to be refused
permission 2002-2007 than before or after (roughly twice as likely), and those that were
conditionally approved were subject to an increasing number of conditions (to 2004).
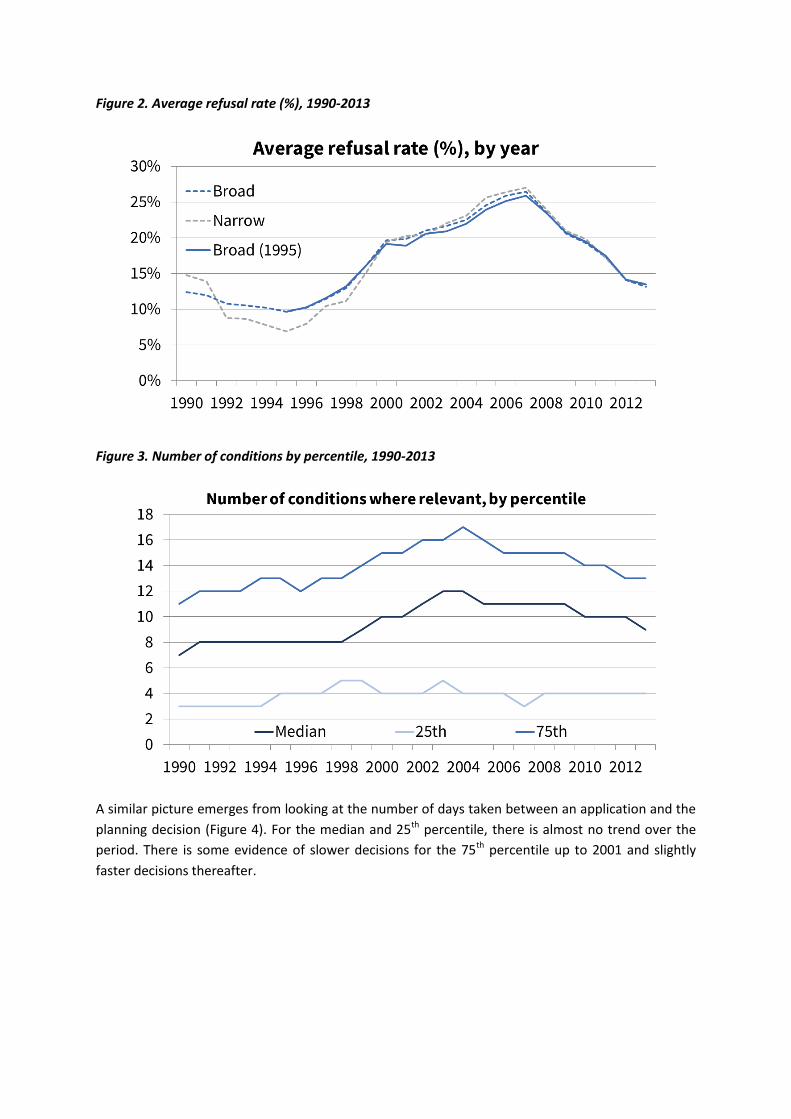
Figure 2. Average refusal rate (%), 1990-2013
Figure 3. Number of conditions by percentile, 1990-2013
A similar picture emerges from looking at the number of days taken between an application and the
planning decision (Figure 4). For the median and 25th percentile, there is almost no trend over the
period. There is some evidence of slower decisions for the 75th percentile up to 2001 and slightly
faster decisions thereafter.

Figure 4. Number of day to planning decision by percentile, 1990-2013
4.2 Trends across Local Authorities The figures presented in Section 4.1 are unconditional averages, by year. Conditional averages are
possible through the use of probit regressions. The baseline probit regression examines the
probability of a project not being rejected (in other words being approved, conditionally or
unconditionally), as a function of year-specific fixed effects and local authority-specific fixed effects.
The coefficients on local authorities indicate the differences across authorities in the likelihood of
being approved, holding time constant. These are shown, with Kerry as the control group (coefficient
of zero) in Figure 5. Local authorities in the Greater Dublin Area are highlighted in red, those in other
cities in green, and those in Rural Section 23 areas in orange.
A clear pattern emerges, with local authorities in the Greater Dublin Area significantly more likely
refuse applications than those elsewhere, on average, and those in Rural Section 23 areas among
those most likely to approve an application.
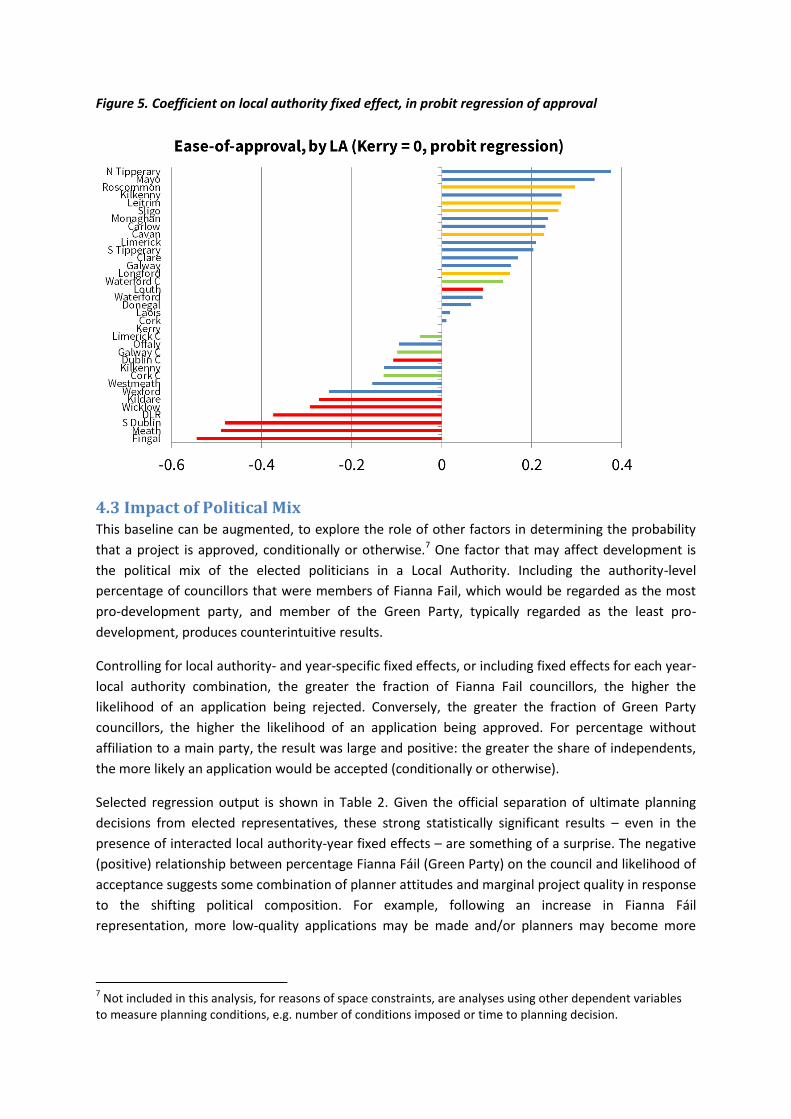
Figure 5. Coefficient on local authority fixed effect, in probit regression of approval
4.3 Impact of Political Mix This baseline can be augmented, to explore the role of other factors in determining the probability
that a project is approved, conditionally or otherwise.7 One factor that may affect development is
the political mix of the elected politicians in a Local Authority. Including the authority-level
percentage of councillors that were members of Fianna Fail, which would be regarded as the most
pro-development party, and member of the Green Party, typically regarded as the least pro-
development, produces counterintuitive results.
Controlling for local authority- and year-specific fixed effects, or including fixed effects for each year-
local authority combination, the greater the fraction of Fianna Fail councillors, the higher the
likelihood of an application being rejected. Conversely, the greater the fraction of Green Party
councillors, the higher the likelihood of an application being approved. For percentage without
affiliation to a main party, the result was large and positive: the greater the share of independents,
the more likely an application would be accepted (conditionally or otherwise).
Selected regression output is shown in Table 2. Given the official separation of ultimate planning
decisions from elected representatives, these strong statistically significant results – even in the
presence of interacted local authority-year fixed effects – are something of a surprise. The negative
(positive) relationship between percentage Fianna Fáil (Green Party) on the council and likelihood of
acceptance suggests some combination of planner attitudes and marginal project quality in response
to the shifting political composition. For example, following an increase in Fianna Fáil
representation, more low-quality applications may be made and/or planners may become more
7 Not included in this analysis, for reasons of space constraints, are analyses using other dependent variables
to measure planning conditions, e.g. number of conditions imposed or time to planning decision.

resolute in their decisions. This hints at a broader issue of self-selection in applications, which is
taken up in more detail in Section 5.
Table 2. Planning Approval, Politics and Section 23: Selected Regression Output
Model 1 Model 2 Model 3
Percent FF beta -0.593*** -1.225*** -1.226***
s.e. 0.059 0.137 0.137
Percent Green beta 0.226 1.375** 1.381**
s.e. 0.174 0.490 0.490
Percent Other beta 0.730*** 3.050*** 3.055***
s.e. 0.071 0.214 0.214
Rural S23 beta 0.115** s.e. 0.038 Rural Control beta -0.010 s.e. 0.034 Town S23 beta 0.041** s.e. 0.012 Town Control beta 0.021 s.e. 0.021 Urban S23 beta 0.188*** s.e. 0.026 Urban Ctrl1 beta -0.005 s.e. 0.020 Urban Ctrl2 beta 0.082** s.e. 0.025 Urban Ctrl3 beta 0.004 s.e. 0.029 Fixed Effects LA Yes
Year Yes
LA*Year Yes Yes
Sample size 400,607 400,197 400,197
Note: Dependent variable is the probability of a project not being refused (i.e. being accepted, either
conditionally or unconditionally). Fixed effects for local authority and year are suppressed for reasons of space.
4.4 Impact of Section 23 designation Another extension is to include information on Section 23 designation, as outlined in Section 3.2.
With an overall control group (Ex-S23), there are eight treatment and robustness checks, as
described earlier. Model 3 in Table 2 shows the results of a probit regression including year-local
authority fixed effects and political mix by local authority, as well as a categorical variable reflecting
Section 23 treatment and control groups (from 1 to 8). It produces clear results about the impact of
Section 23.
In all three cases (rural, town and urban), there is a statistically significant positive impact on
approval. These results are strong for Rural Section 23 (compared to areas within the same county
that were not included in Rural Section 23): the marginal effect for the rejection rate was 17.4% vs.
20.5%. There was a larger effect for Urban Section 23, where the rejection rate was 15.6% (vs. 18%-

20% for the controls). The effect for Town Section 23 was smaller. In almost all cases, there is a clear
distinction between the treatment areas and their proposed control groups, the one exception being
Urban Ctrl2, i.e. large towns not included in Section 23 but in the Greater Dublin area.
Figure 6. Refusal rates by Section 23 status
Thus, it seems the case that, at the margin, the political mix and the fraction of projects approved
were linked, although inferring causality requires further study. One channel is that the political mix
affected the nature of projects. By shifting out demand for housing, though, the Section 23 scheme
would have had a similar effect – and there, the sign is as per expectations. Applications in Section
23 areas – rural, town and urban – were more likely to be approved than others, holding local
authority, year and political mix constant. This would suggest some link between the housing bubble
and easy planning conditions.
Over time, though, it is clear that for the sample as a whole, planning conditions did not loosen with
the housing market bubble. Albeit off a larger base, an application was more likely to be rejected in
2005 than in 1995 or 2010. A similar conclusion applies for number of conditions applied and the
time to a planning decision, which indicate that planning conditions were between acyclical and
countercyclical. Given that credit conditions appear to have been extremely procyclical, with the
typical first-time buyer deposit falling from more than 20% to less than 5%, what might explain why
planning conditions were immune?
14.0%
15.0%
16.0%
17.0%
18.0%
19.0%
20.0%
21.0%
NonS23
RuralS23
RuralCtrl
TownS23
TownCtrl
UrbanS23
UrbCtrl1
UrbCtrl2
UrbCtrl3
Refusal rates, by Section 23 status

5. Insight from Economic Theory While there may be a popular narrative that lax planning was a contributory factor in the bubble,
there appears to be little evidence for that, based on the stylised facts outlined in Section 4. This
however is not the same as stating that regulation is unimportant for the housing market.
Considering planning permits as a market, there are important insights from considering the slopes
of the supply of and demand for permits.
Housing and housing permits are very much complementary goods, but within that, the planning
permit is very much the “dwarf” complement good. Demand for a planning permit is because it is a
means to utility/profit, not utility/profit itself. In particular, the welfare stream from the
complementary good (the dwelling) is orders of magnitude larger than any costs associated with the
permit. This leads to an important distinction between regulation of the process (the permit) and
regulation of the output (the dwelling).
Figure 7. Supply and Demand for planning permissions (stylised)
Figure 7 sketches the likely slopes of the supply and demand curves in the market for planning
permissions. Price here reflects not only the direct fees involved in applying but also other costs,
such as detailed plans, ads and time costs. Supply is similar in some respects to monetary policy by
interest rate decision: given the price, the local authority commits to supply whatever quantity is
demanded and thus supply of permits is elastic. Demand, on the other hand, is highly inelastic:
compared to the scale of the complement good, the price of the application has very little impact on
demand.
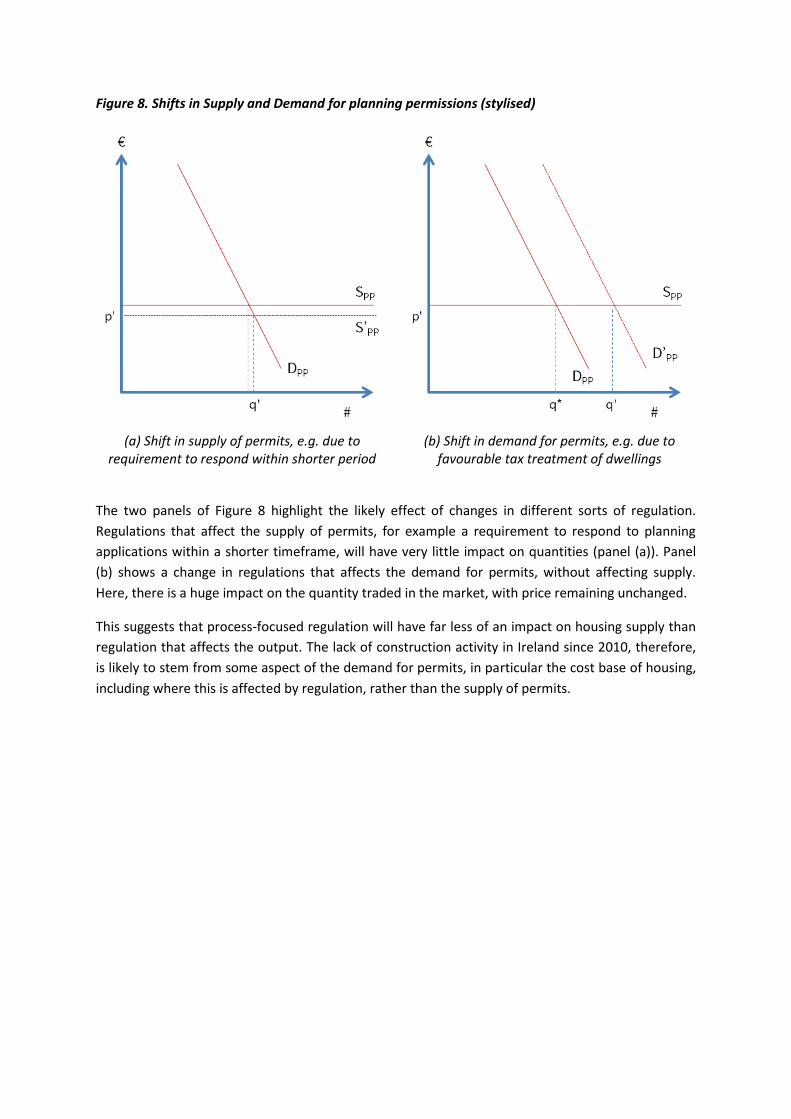
Figure 8. Shifts in Supply and Demand for planning permissions (stylised)
(a) Shift in supply of permits, e.g. due to
requirement to respond within shorter period (b) Shift in demand for permits, e.g. due to
favourable tax treatment of dwellings
The two panels of Figure 8 highlight the likely effect of changes in different sorts of regulation.
Regulations that affect the supply of permits, for example a requirement to respond to planning
applications within a shorter timeframe, will have very little impact on quantities (panel (a)). Panel
(b) shows a change in regulations that affects the demand for permits, without affecting supply.
Here, there is a huge impact on the quantity traded in the market, with price remaining unchanged.
This suggests that process-focused regulation will have far less of an impact on housing supply than
regulation that affects the output. The lack of construction activity in Ireland since 2010, therefore,
is likely to stem from some aspect of the demand for permits, in particular the cost base of housing,
including where this is affected by regulation, rather than the supply of permits.
6. Irish Construction Costs in Perspective
6.1 Measuring construction costs Between 1997 and 2014, the general price level rose by approximately 50% while Dublin house
prices rose by 125%. There are three different methods for measuring the cost of building a house.
The first, which underpins the National Housing Construction Cost Index published by the
Department of the Environment, factors in only the costs of labour and materials, using a fixed
basket of inputs. This narrow measure of costs suggests that build costs are roughly 70% higher now
than in 1997 (i.e. an increase similar in order of magnitude to that witnessed in the general price
level). This omits any change in the basket of inputs required by regulation.
The second measure, which reflects a slightly broader set of construction costs, including
professional fees, as well as regulatory standards affecting renovations and rebuilt properties, is
compiled by the Society of Chartered Surveyors of Ireland. This indicates that the cost of rebuilding a
home (in this instance, a 95 square metre three-bedroom semi-detached property in Dublin) was
more than 150% higher in 2014 than in 1997.
The final measure of construction costs reflects the full costs faced by those building new homes.
This captures the impact of changes in building standards, including minimum sizes and energy
efficiency requirements, that apply to newly built homes, while omitting direct site costs, which may
be residual, i.e. reflect the balance between costs and prevailing house prices. Unfortunately, no
time series exists of full construction costs. However, detailed figures are available from Walsh
Associates (2012, 2014) for 2012 and 2014.
These figures indicate that the construction cost of a three-bedroom semi-detached house, the most
common unit built, rose by almost €10,000 a year on average between 2009 and 2014. This
substantial increase of almost one third in construction costs, at a time of static incomes and falling
house prices, was driven by regulatory changes, with increased minimum sizes (in 2010) accounting
for 40% of the increase, greater required energy efficiency (Part L, 2011) for a further 40% and costs
relating to the 2014 Building Control (Amendment) Regulations adding 10%.8
6.2 Costs relative to prices An overview changes in these three measures of construction costs, together with changes in
general prices and in Dublin house prices, is given in Figure 1.9 It shows that using a measure of
construction costs that is too narrow – such as the CSO input cost index – dramatically understates
cost pressures in the construction industry. Whereas prices of Dublin homes were a little more than
double their 1997 level in 2014, new-build costs were four times their 1997 level.
This dramatic increase in costs is only now apparent due to two factors. Firstly, the dramatic three-
fold increase in build costs in the decade to 2007 was outstripped by a (temporary) four-fold
8 The reduction in Local Authority contributions was, in Walsh Associates’ calculations, offset by increased Part
V contributions due to increased site values. Figures prepared by Mitchell McDermott Consultants, for Property Industry Ireland, indicate a similar issue with the cost of building apartments, with Dublin City Council minimum standards having increased costs by roughly 20%. 9 For the ‘Cost of New Build’ series prior to 2007, the rate of change in the per-square-metre build costs is used
as a proxy. This may understate the increase in costs, due to the introduction of Part V contributions after 2000.

increase in prices. This means that home-building would have been more profitable in 2007 than in
1997. The second factor is that, just as Dublin prices fell by 50%, significant additional costs – almost
exclusively on newly built homes – were imposed by regulatory changes. As prices fell a half, costs
rose by a third.
Taking the typical family home, a three-bedroom semi-detached property that cost roughly
€100,000 to build in 1997 would have sold for €120,000, with a profit margin of 20%. An equivalent
home would now be worth €270,000 but, allowing for regulatory changes, would cost over €400,000
to build.
Figure 1. Changes in various housing-related indicators, 1992-2014
6.3 Costs relative to incomes The assessment of housing costs can be relative to housing values, to understand profitability and
thus new completions, but also relative to incomes, reflecting the underlying connection between
housing and the real economy. This is important not only for issues relating to international
competitiveness but also in relation to the provision of housing for all, including those on below-
average incomes.
The figures outlined above in relation to the increase in the cost of building a new home between
2009 and 2014 mean that the standard mortgage repayment associated with a newly built family
home has increased from roughly €960 a month to €1,350.10 Over the same time, the average
household’s monthly disposable income has fallen from €3,800 to roughly €3,400. In other words,
the fraction of the typical household’s disposable income that would be needed to cover the costs of
a newly built family home rose from 25% to 40% in the five years to 2014. In the event of interest
rates rising by two percentage points, as stress-tested as part of mortgage applications, half of the
average household’s disposable income would be spent on their accommodation.
10
This is based off constant mortgage terms, namely 85% LTV, 4.3% interest rate over 30 years, the following principal amounts: €228,000 in 2009 and €321,000 in 2014.
0
50
100
150
200
250
300
350
400
450
Dublin houseprices
Cost of newbuild
SCS Rebuildcosts
Dept EnvNHCCI
CSO CPI
1992
1997
2002
2007
2014

A similar picture emerges from construction costs relating to apartments. Again, setting aside site
costs, the break-even cost associated with a newly-built two-bedroom apartment is, as of early
2015, roughly €260,000 including VAT. Where land costs €2m an acre, this leaves a full cost of nearly
€340,000 including VAT. This translates into a break-even rent of €1,700 a month (where land is €2m
an acre, €1,300 a month without land costs).11 As of early 2015, the only area of the country where
the typical rent for a two-bedroom apartment exceeded €1,700 was Dublin 2. In West Dublin, the
average rent was just over €1,000 and in Limerick city, the rent was below €700.
The conclusion is stark, both for prospective homeowners and for taxpayers. There is a clear
requirement for an audit of the elements of the cost base in providing new homes, and where
regulation can be reformed to reduce these costs. Based on the economic theory outlined in Section
5, this will have a far greater impact on the supply of new homes than regulation of the planning
process.
11
These figures are based off a desired net yield of 5%, with maintenance costs of 20%. Underlying apartment costs are based off discussions with international developers active in the Irish residential market during 2014.

7. Conclusions This paper has examined how conditions in the Irish planning system varied over the course of the
housing market bubble and crash. It did this by utilising a rich micro-level dataset of planning
applications across Ireland’s 35 local authorities from 1990 to 2013. Based on two illustrations of
how this new dataset can be used, it appears there is indeed a link between political make-up of
county councils and the likelihood of approval (although this may work counter to expectations) and
also between Section 23 status on approval.
On the broader question of how planning conditions relate to the extreme housing market cycle in
Ireland from the 1990s to the 2010s, there is little evidence that process regulation in housing
market was relaxed at the height of the bubble. If anything, planning conditions appear to be
counter-cyclical or more likely acyclical. This adds to the growing consensus that credit, and credit
alone, was to blame for the severity of Ireland’s housing market bubble and underscores the
importance of macroprudential policy to avoid excessive leverage in this sector in the future. From
the policymaker’s perspective, “lean against the wind” regulatory conditions are unlikely to matter.
Economic theory suggests that supply of building permits is likely to be highly elastic, similar to
textbook models of monetary policy, with demand for permits highly inelastic due to the ‘dwarf
complement’ nature of the permit compared to the ultimate good (the dwelling). Thus, the focus
needs to be on output regulation and the cost base of building dwellings, given the growing shortage
of dwellings in the greater Dublin area in particular. Linking the cost of construction and break-even
rent with affordability and the income distribution can help tie this to issues relating to deprivation
and competitiveness. In addition to auditing the cost base, it seems obvious that Regulatory Impact
Assessments of should apply in relation to the impact of changes in minimum standards for
construction on the break-even rent.
It is hoped that the dataset constructed for this paper can start a rich vein of research. Having the
full text of the permission allows the researcher to carefully address specific questions. It may also
help identify the exact relationship between planning and house prices in Ireland. It is now
reasonably well established in other countries, such as the US and the UK, that districts with higher
land use restrictions or refusal rates suffer from higher house prices. Whether this lies at the heart of
the discrepancy between prices in the Greater Dublin area and the rest of Ireland is an obvious
follow-on question – the local authority fixed effects presented here are certainly consistent with
that story.

References Addison-Smyth, D., McQuinn, K., & O'Reilly, G. (2009). “Modelling credit in the Irish mortgage
market.” Economic and Social Review, 40(4), 371.
Duca, John V., John Muellbauer, and Anthony Murphy, 2011. "House prices and credit constraints:
Making sense of the US experience." The Economic Journal 121: 533-551.
Emilio Fernandez-Corugedo & John Muellbauer, 2006. "Consumer credit conditions in the United
Kingdom," Bank of England Working Papers #314.
Glaeser, E. L., & Ward, B. A. (2009). “The causes and consequences of land use regulation: Evidence
from Greater Boston.” Journal of Urban Economics, 65(3), 265-278.
Harmon, C. & Hogan V. (2000), “Econometric Analysis of the Housing Market and Projections of
Future Developments.” In: Bacon, P. & MacCabe, F. (Eds.) The Housing Market in Ireland: An
Economic Evaluation of Trends & Prospects, Government of Ireland Publications.
Hilber, C. A., & Vermeulen, W. (2015 forthcoming). “The impact of supply constraints on house
prices in England.” The Economic Journal (online as of 2nd June 2015: doi: 10.1111/ecoj.12213).
Ihlanfeldt, K. R., 2007. “The effect of land use regulation on housing and land prices.” Journal of
Urban Economics, 61(3), 420-435.
Lyons, R. C. & Muellbauer J. (2015 work-in-progress). “Explaining the bubble: House prices, user-cost
and credit conditions in Ireland, 1975-2012.” TCD Department of Economics working paper (mimeo).
McQuinn, K. (2004). “A Model of the Irish Housing Sector.” Central Bank of Ireland Research
Technical Papers 1/RT/04.
Murphy, A. (2005). “Modelling Irish House Prices: A Review and Some New Results.” Nuffield College
(Oxford) Working Paper.
Quigley, John M., and Steven Raphael, 2005. "Regulation and the high cost of housing in California."
American Economic Review: 323-328.
Roche, M. (2004). “Will there be a Crash in Irish House Prices?” Economic and Social Research
Institute Quarterly Economic Commentary, 1-16.
Saiz, Albert, 2010. "The geographic determinants of housing supply." The Quarterly Journal of
Economics 125(3): 1253-1296.
Stevenson, S. (2003). “Economic, Demographic & Fiscal Influences on Housing Market Dynamics.”
University College Dublin School of Economics Working Paper.