housing-related tax expenditures: robert g. dowler major ... · subsequent evaluations of the...
TRANSCRIPT

HOUSING-RELATED TAX EXPENDITURES:
AN OVERVIEW AND EVALUATION
Robert G. Dowler
Major Report No. 22
Published in co-operation with The Co-operative Housing Foundation
of Canada
Centre for Urban & Community Studies University of Toronto
February 1983
Reprinted September 1984
ISSN: 0319-4620 ISBN: 0-7727-1238-7
Price: $4.50

Text prepared by Fax, 229 College Street, Toronto
Canadian Cataloguing in Publication Data Dowler, Robert G. (Robert Gray), 1957-
Housing-related tax expenditures
(Major report / Centre for Urban and Community Studies, University of Toronto, ISSN 0319-4620 ; no. 22) Bibliography: p. ISBN 0-7727-1238-7
1. Housing - Canada - Finance. 2. Housing policy -Canada. 3. Rental housing Canada. 4. Tax expenditures - Canada. I. University of Toronto. Centre for Urban and Community Studies. II. Title. III. Series: Major report (University of Toronto. Centre for Urban and Community Studies) no. 22.
HD7305.A4D69 336.22'5 C83-094129-0

ACKNOWLEDGEMENTS
This paper was first written as a masters' degree research paper in the Urban and Regional Planning Program at the University of Toronto.
I would like to express my gratitude to my supervisors, Professors Shoukry Roweis and John Hitchcock, for their helpful comments.
I would also like to thank David Hulchanski and Judith Kjellberg of the Centre for Urban and Community Studies, University of Toronto, for their help in the revision and preparation of this paper for publication.
The research was supported financially by the Co-operative Housing Foundation of Canada and by the Canada Mortgage and Housing Corporation.

CONTENTS
INTRODUCTION
1
2
3
4
5
6
Footnotes
TAX EXPENDITURES IN GENERAL
1.1 Background and Rationale 1.2 Program Structure and Rules 1.3 Program Impacts 1.4 Summary and Conclusions
HOUSING-RELATED TAX EXPENDITURES
2.1 Historical Background 2.2 Levels of Housing-Related Expenditures
RENTAL HOUSING TAX INCENTIVES
3.1 Background and Rationale 3.2 Program Structure 3.3 Program Impacts and Performances 3.4 Summary and Conclusions
HOMEOWNERSHIP TAX INCENTIVES
4.1 Background Rationale and Program Structure 4.2 Impacts of Capital Gains and Imputed Rent Exemptions 4.3 Impacts of the RHOSP Program 4.4 Implications of Homeownership Tax Preferences
OTHER HOUSING RELATED TAX EXPENDITURES
5.1 Deductibility of Interest on Land 5.2 Sales and Excise Tax Subsidies 5.3 Deductibility of Interest to Finance Investments
GENERAL CONCLUSIONS AND SUMMARY
2
20
24
56
78
87
90

APPENDIX 1 APPENDIX 2
APPENDIX 3
Bibliography
Provisos on Interpretation of Tax Expenditure Estimates Technical Notes on Estimates of the Annual Cost of the Net Imputed Rent Exemption and the Capital Gains Exemption Rough Estimates of Federal Expenditures Related to Ownership, Rental and Social Housing
97 99
101
102

TABLES AND FIGURES
PART 1 Tax Expenditures in General
TABLE 1 Average Dollar Benefits Per Tax Filer from Federal Tax Expenditures, by Income Group, 1979
TABLE 2 Distribution of Tax Filers According to their Proportion of Income Tax Paid in Federal Tax, 1979
TABLE 3 Tax Expenditure Benefits to Various Occupations as a Percentage of Income, 1979
PART 2 Housing-Related Tax Expenditures
TABLE 4 Summary of Major Federal Housing Expenditures (1979)
PART 3 Rental Housing Tax Expenditures
FIGURE 1 CCA Tends to Provide Deductions During Early Years But Falls Below Booked Depreciation Between 15 and 20th Years
TABLE 5 List of Deductible Soft Costs
TABLE 6 Period Over Which Soft Costs May Be Deducted
TABLE 7 Example of Cashflow Forecast for Individual Owner of MURB Project
TABLE 8 Annual Federal Tax Losses Resulting from MURBs, CCA and Soft Costs
TABLE 9 Discounted Federal Tax Losses Resulting from 1981 Starts
TABLE 10 Estimated MURB Starts, Certificates Issues and Total Row and Apartment Starts, Canada, 1975-1981

TABLE 11 Comparison Between Average Market Rents and Rents Charged Per New ARP Units, July, 1977
TABLE 12 Comparison of Benefits Claimed from MURB Deductions By "High Income Individuals" and All Others, 1979
PART 4 Homeownership Tax Incentives
TABLE 13 Estimated Federal Tax Expenditures Resulting From Homeownership Tax Preferences, Canada, 19 76-1980
TABLE 14 Average Benefits from Imputed Rent and Capital Gains Tax Exemptions, Canada, 1978
TABLE 15 Estimated Federal Tax Expenditures Associated with the RHOSP, Canada, 1976-1980
TABLE 16 Annual RHO SP Contribution by Income Class as a Percentage of Total RHOSP Contributions, Canada, 1975-1978
TABLE 17 Annual RHOSP Contributions by Age Group as a Percentage of Total Income in Each Age Group, Canada, 1975-1978
TABLE 18 Comparison of Annual Federal Tax Expenditures Relating to Rental and Ownership Housing, Canada, 19 76-1981
TABLE 19 Rough Estimates of Federal Expenditures Relating to Ownership, Rental and Social Housing
PART 5 Other Housing-Related Tax Expenditures
TABLE 20 Estimated Tax Losses Due to Deductions of Carrying Charges on Residential Land, Canada, 19 79-1981
TABLE 21 Federal Tax Losses Associated with Residential Construction Under Three Sales Tax Reductions, Canada, 1976-1981

1
INTRODUCTION
As early as 1973, it was recognized that "income tax regulations may have become as important in the reshaping of our urban centres as any facets of the planning process.11 l Since 19 79, there has been increasing controversy over the efficacy of the incentives and programs implemented under Canada's Income Tax Act. In his budget speech of October, 1980, the Honourable A.J. MacEachen noted that tax expenditures "are expensive and it is incumbent on government to ensure that the incentives are effective and their cost is justified." He questioned "whether the economy might not better be served by a tax system with lower rates but with fewer and more selective incentives. 112
In addition to questions regarding the cost effectiveness of tax incentives, there is growing concern over the highly technical and esoteric nature of these programs. This has led many critics to charge that tax expenditures are "hidden subsidies," beyond the comprehension of the average voter. Harris (1979) notes that, " ••• a growing proportion of the /tax/ law consists of detailed, highly technical provisions," and "the bulk and complexity of the /Income Tax/ Act and its mathematical-type format have left the original goal of simplifying the law far behind.113
This paper, therefore, has two aims: first, to explain the workings of housing-related tax expenditure programs; second, to summarize the past impacts of these programs and to evaluate their effectiveness as policy instruments.
The study proceeds from the general level to the specific; Chapter 1 reviews the strengths and limitations of tax programs in general. Broad themes are identified in this initial discussion, which are then incorporated into the subsequent evaluations of the different housing-related tax expenditures. Each chapter is divided into four parts:
1. Background and rationale. The historical circumstances leading to the development and implementation of each program are discussed. In addition, the government's stated objectives for adopting each, program are identified.
2. Program structure. The criteria for eligibility and the general "rules of the game" associated with each tax incentive are reviewed.
3. Program impacts. The impacts of each tax subsidy are described, including: expenditure/cost; depth of subsidy; distributional factors; subsidy yield; speculative and unintended effects; administrative costs and efficiency; and accountability and disclosure.
4. Program evaluation. The extent to which each program has been successful in fulfilling its objectives is evaluated.

2
Chapter 1
TAX EXPENDITURES IN GENERAL
Before turning to a discussion focusing specifically on tax expenditures related to housing policy, it is important to understand tax programs in general. This chapter reviews the general advantages and limitations of programs implemented through the tax system.
1.1 BACKGROUND AND RATIONALE
A. Defining "Tax Expenditure"
R.S. Smith (19 79) defines "tax expenditures" as "government revenues forgone through special provisions in the tax system which are specifically designed to provide incentives or relief to certain activities or individuals.114 Tax expenditures, therefore, consist of "departures from the generally accepted tax norm, which result in revenue losses for the public sector.11 5
In order to make assumptions about "generally accepted tax norms," some normative judgements must be made about the way most Canadians view the tax system. Identification of tax expenditures is a three-stage process: "First, some 'ideal' or normative income tax system must be defined. Second, there must be a willingness to temper this ideal by what is administratively feasible. Third, certain aspects of the tax system, such as the rate structure and the size of personal exemptions, and a separate tax on corporate income, have to be accepted as part of the normal structure.116
For the purposes of this paper, the "ideal" or ''benchmark" tax system will be described as neutral and progressive. A neutral tax system is defined as one which ''provides no preferential treatment to taxpayers on the basis of demographic characteristics, sources or uses of income, geographic location, or any other special circumstances applicable only to a given taxpayer or group of taxpayers. 11 7 A progressive tax system distributes the tax burden according to each individual's ability to pay.
In addition, this definition should not be interpreted as including aspects of the tax system which confer unintended benefits to certain groups (e.g. "loopholes"). As noted above, in order for a provision to be identified as a tax

3
expenditure, it must be within the realm of administrative feasibility to abolish the provision.
Therefore, the extent to which a given provision of the Income Tax Ac~ violated either of the above general principles is the extent to which that provision will be defined as a "tax expenditure."
B. Historical Background
While tax expenditures have been used in Canada since the second World War, the Department of Finance (1979) notes that "they have been growing more rapidly in recent years than direct spending in a number of areas118; they have accounted for increasingly significant levels of federal "spending." For 1979, considering only personal income tax, and those subsidies which could be estimated, tax expenditures reduced the amount of taxable income in Canada by $4 7 billion (general provisos on interpreting Department of Finance tax expenditure data are summarized in Appendix I). This translates into a federal tax loss of $13.8 billion.9 Since many tax expenditures also automatically reduce provincial tax, the Department of Finance (1981) notes that "their true value to individuals is about 50 per cent higher. 11 10
The mid to late 1970s saw a rising criticism of tax expenditures in general.11 Major concern focused on the lack of an accounting system capable of permitting the public to scrutinize these indirect expenditures. The National Council on Welfare (1976) noted:
This /Income Tax/ Act conceals, very literally, billions of dollars in government spending -- the spending which constitutes Canada's hidden welfare system for the non-poor. It hides this spending so well that governments do not publish, in fact do not even calculate, its total amount. Ordinary citizens -- middle and lower income taxpayers -- are almost totally unaware of its existence.12
In 1979 the first Tax Expenditure Accounts were published, as part of the Conservative Government's budget; these have been updated for 1976-1980.13 In addition, over the last three years, there has been some attempt on the part of the federal government to reduce its reliance on tax expenditures in certain areas. This is best viewed as a result of public controversy over these "hidden subsidies," as well as part of the government's overall effort to control public spending. At present, however, it is unclear to what extent the government will continue its policy of reducing its reliance on tax expenditure programs. While MacEachen's November, 1981 Budget did propose a drastic reduction in the level of indirect expenditure in certain sectors, there are indications that future budget proposals

4
could incorporate a stronger reliance on employment-generating tax expenditure programs.
In summary, tax expenditures have gone through periods of ''proliferation" (characteristic of the post World War II to the later 70s period when the number of tax expenditures drastically multiplied), "reform" (during the years 1979-1981) and finally "debate" (characteristic of the current situation where the government's desire to reduce indirect spending may be in conflict with the need to introduce some short-term employment programs).
C. Rationale: Advantages of Tax Expenditures
1. Administration. In many cases, indirect programs are seen to be less costly than direct spending equivalents because they rely on the already-existing tax system for their implementation. The administrative machinery of Revenue Canada and the Department of Finance is, for some programs, well suited to the redistribution of income. In addition, indirect programs have the advantage that the provision of subsidies is a one-step process -- federal revenues are simply not collected. Direct spending programs, however, require a more cumbersome two-step process consisting of revenue-raising and then redistribution. Finally, since indirect programs rely on existing administrative structures, they tend to have lower "start up" costs than direct spending alternatives. For this reason, they are often well suited to programs which are short term in nature.
2. Delivery. Tax expenditures are open-ended subsidies; that is, any tax filer who meets the eligibility er iter ia is guaranteed a subsidy. This is in contrast to direct spending programs which involve a fixed budget, waiting lists, and tend to exclude some eligible candidates as funds run out. While the "open-ended" characteristic makes tax expenditures an administrative nightmare to budget and control (as will be discussed below), some analysts have argued that these programs are superior in terms of "horizontal equity" (i.e. ensuring that individuals with similar characteristics receive equal treatment).
Second, indirect programs are praised for their confidentiality. Individuals who receive a subsidy through their tax returns are not "stigmatized" to the extent that they would be under some types of direct programs (e.g. public housing tenants often claim that they are "labelled" as welfare families as a result of the high visibility of their subsidy). This confidentiality often ensures a higher rate of subsidy "take-up" in indirect programs (for example, in areas such as sales tax exemptions the take up rate is automatically 100 per cent).14

s
Finally, in terms of delivery, indirect programs are praised for their tendency to be far-reaching. The tax system can, in theory, deliver benefits to all those who file tax returns. In many cases, this permits the development of broad-based, aU-indusive programs.
3. Political Expediency. There are a number of factors which explain the attractiveness of tax expenditures in past years, but which do not constitute "rational" grounds for favouring these policies. These relate to the fact that the "hidden" nature of many tax expenditures has contributed to their political expediency.
In the past, for example, the indicators which have been used to measure the success of government fiscal restraint policies are direct spending and growth in government employment. Indirect programs are often favoured, therefore, since they enable government to respond to the pressures for increased spending in certain areas, while at the same time appearing (on paper) to be cutting back on public spending. While increased use of tax expenditures may appear to be inexpensive (since they are not adequately accounted for), in reality these indirect programs lead to higher tax rates, or a larger deficit.15
Second, it can be argued that the reduction of effective tax rates in certain sectors of the economy is interpreted by voters as a general reduction in the level of public sector growth and activity. This is perceived by many as a necessary policy during hard economic times since it is seen to "restore incentives and give the market portion of the economy greater scope.11 16
While an across-the-board decrease in tax rates would lead to an increase in market activity, the Department of Finance (1979) notes that "a specific or targeted tax reduction in the form of a new or expanded tax expenditure usually increases the government's involvement in the market. 1117
While these comments tend to apply more to the pre-1979 years when tax expenditures clearly were hidden, the fact that very few voters understand the full implications of indirect spending causes these programs still to have some appeal in terms of political expedience today. It should be emphasized that these characteristics are not seen to be desirable, but nevertheless do explain, to some extent, the proliferation of indirect programs in recent years.

6
1.2 PROGRAM STRUCTURE AND RULES
The recent proliferation of tax expenditures has resulted in the incorporation of over 100 diverse government programs into the Income Tax Act. Obviously, it is beyond the scope of this paper to discuss the structure of each one. Instead, this section is divided into two parts: a discussion of some very basic tax principles, since these are, in effect, the "ground rules" by which tax planners play; and a description and evaluation of four broad types of tax expenditures.
A. Basic Tax Principles
The most fundamental tenet of any progressive income tax system is that the tax burden should be distributed according to each individual's ability to pay. The use of income tax to finance a substantial proportion of government activity tends to have broad public acceptance, because the tax burden has an obvious relation to a taxpayer's ability to pay.
Harris (19 79) notes, however, that "it is exceptionally difficult to find a generally acceptable definition of the term "income.1118 For the purposes of this paper, a relatively simple concept of income can be used:
income = revenue - expenses.
An individual's taxable income, therefore, is determined by the flow of revenue received in a given year (from taxable sources only, of course) less deductions for expenses incurred in the process of earning a living. In order to calculate the tax owed, an individual is assigned a "marginal tax rate," according to a fixed schedule which increases according to income.
B. Types of Tax Expenditures
Tax expenditures generally operate so as to reduce an individual's (or corporation's) taxable income through "special" exemptions, preferential rates, deductions, credits, exclusions or deferrals (Smith, 1979). As taxable income drops, so too does the marginal tax rate. The net result of tax expenditures, therefore, is to lower the "effective tax rate" to a point below the marginal tax rate, thereby reducing the amount of tax owed. It should be noted that by reducing the tax rates for ~ taxpayers in society, the government generally must increase the tax liabilities of other individuals if revenues are to stay constant.

7
The Department of Finance (1979) refers to four main types of tax expenditures in Canada:
1. Exclusions. Certain types of income are either completely or partially excluded from tax. In 1979, these programs accounted for $6.2 billion in benefits to individuals alone (ignoring the corporate component). This represented about 45% of all federal tax expenditure benefits accruing to individuals in that year.
2. Deductions. Total taxable income is reduced by allowing the deduction of certain expenses incurred as a result of particular types of investment. These accounted for $4 billion in federal benefits to individuals in 1979, or 29% of tax expenditure benefits to individuals in that year.
3. Exemptions. Under the Income Tax Act, special exemptions are allowed for children, the elderly and married taxpayers. In 1979, these were the third most popular form of tax expenditure, accounting for $2.l billion or 15% of all federal tax expenditure benefits to individuals.
4. Tax credits. Instead of reducing the amount of income subject to tax, tax credits reduce the amount of tax otherwise payable. In 1979 these accounted for $1.3 billion, or 9.4% of all federal tax expenditure benefits to individuals. Tax credits are a relatively new form of tax expenditure.19
Runge et al. (1975) argue that tax credits are more desirable than other forms of tax expenditure for two reasons: First, non-credit tax programs tend to reduce taxable income, where credits reduce the amount of tax payable directly. For example, if Smith has a marginal tax rate of 25%, a tax exemption of $1,000 reduces his tax by $250. If Jones (a higher income earner) has a marginal tax rate of 60%, the same exemption reduces his tax by $600. Therefore, the higher the income, the greater the benefit from non-credit tax expenditures. In contrast, the tax credit ls taken off after taxes are calculated; for a tax credit of $250, Smith would receive $250 and Jones would receive $250. Runge et al. (1975) also note that tax credits are much better than other tax expenditures for directing benefits to lower income groups. While a tax exemption is useless to someone who pays no tax, a tax credit, on the other hand, enables such a tax-filer to obtain a tax refund representing the full benefits of the tax expenditure.20

8
1.3 PROGRAM IMPACTS
It is useful to summarize the advantages attributed to tax expenditure programs in section 1.1 above:
Administration
l. Tax expenditures are often less costly than direct spending alternatives since the administrative machinery is already in place.
2. Tax expenditures, therefore, have low "start-up costs," making them well suited to short term programs.
3. Tax expenditures can in many cases deliver subsidies simply by not collecting revenues in key sectors. This is cheaper than direct spending programs which require complex revenue-raising and distribution functions.
Delivery
4. Tax expenditures are open-ended and, therefore, contribute to horizontal equity.
5. Delivery is confidential, eliminating "stigma" effects and encouraging high rates of take-up.
6. The tax system is broad-based and far reaching. This enables delivery of benefits to a large segment of the population.
Political Expediency
7. Tax expenditures tend to be less open to scrutiny than direct spending programs. In the past, this has made them easier for politicians to introduce, albeit at a cost of poorly representing the electorate.
It will be shown below that while each of these factors, to some extent, holds true, they must be heavily qualified by a variety of other limitations attributed to tax expenditures.
A. Expenditure/Cost
As noted above, federal tax expenditures in 1979 for individuals alone resulted in $13.8 billion in forgone federal revenues. This estimate is conservative, representing only individual benefits (not corporations) and only those provisions which the Department of Finance was able to quantify. It should also be noted that if impacts on provincial revenues were also considered, the estimate would be about 50% higher.21 Despite the conservative nature of this estimate, it still represents a 45% reduction in the total amount of personal income received in Canada in that year.

9
TABLE 1
Average Dollar Benefits Per Tax Filer from Federal Tax Expenditures by Income Group, 1979
Type of tax expenditure
All tax expenditures
Exclu-Total ding Income
income Including hou- Exclus- Deduct- Exempt-group1 1l housing sing ions ions ions
(dollars)
Under 5,000 195 163 1 3 1 5,000- 10,000 460 289 4 117 80
10,000- 15,000 771 457 17 233 163 15,000- 20,000 1,296 677 42 341 257 20,000 25,000 1,910 946 75 479 334 25,000 30,000 2,704 1,392 158 704 436 30,000 50,000 4,429 2,435 537 1, 198 564 50,000-100,000 9,928 6,258 3,007 2,542 628
100,000 and over 46,076 39,323 23,592 15,629 576
Total All Groups 1,089 631 113 274 151
Tax credits
157 64 40 31 37 49
116 344 965
88
(1\ Total income 1s before any Income Exclusions. Deductions or Exemption tax expenditures. Average benefits are total benefits divided by the number of tax filers in the income group.
Source: Department of Finance, Analysis of Federal Tax Expenditures for Individuals, Ottawa, 1981, p. 12.

10
The proliferation of tax programs in the mid 70s has led to drastically increasing rates of growth in indirect expenditures. The National Council on Welfare (1979) estimates that between 1975 and 1976 direct spending increased I 0.4 96, while a group of twenty tax expenditures increased, on average, 17 .996 (some programs accounted for as much as a 7096 increase).22 In addition, Harris (1979) notes that few tax expenditures have been subjected to periodic reviews or "sunset clauses." The result is that 11
••• a provision that was designed to further a particular short-term objective remains in the Act long after the objective has ceased to be important or desirable. 1123 A number of programs in the Act are products of an earlier time and should be reviewed as to their current utility.
B. Depth of Subsidy
Two levels of subsidy can be considered in an evaluation of any tax expenditure program. These are: the "primary" level (relating to benefits accruing to the initial recipient of the tax subsidy) and the "secondary" level (relating to benefits which "spin off" from the added investment in key sectors as a result of primary-level subsidies, e.g. employment, reductions in prices, etc.). While data on the amount and distribution of "secondary" benefits resulting from tax programs are limited, the amounts of primary-level subsidies are more easily obtained. Table 1 shows the average amount of primary-level subsidy received by individual tax-filers in 1979. Two conclusions can be drawn:
* Average subsidy levels are high, ranging from $195-$46,000 and averaging over $1,000 per tax-filer.
* Benefits tend to be concentrated in u er income rou s. This trend is particularly striking for deductions and exclusions since, as noted above, tax savings are directly related to income levels for these types of tax expenditures).
When interpreting these data, it is important to consider that the deep subsidies necessitate higher than normal tax rates.
C. Distributional Factors
The distributional impacts of tax expenditures can be discussed with respect to "vertical and horizontal equity." Vertical equity refers to the distribution of resources between various different income groups. Horizontal equity refers to distributions among individuals with similar incomes. A benchmark tax system would be generally progressive and would be "neutral"; that is, individuals with similar characteristics would pay similar levels of tax.

11
TABLE 2
Distribution of Tax Filers According to Their Proportion of Income Paid in Federal Tax, 1979
Number of filers in
Total income1 1i groups Per cent of income paid in federal tax
0 0-1 1-5 5-10 10-15 15-20 20-30 30+ -- --($) ('000) (thousands of tax filers)
Block w11
Under 5,000 4,505 4,422 58 20 3 1 1 0 0 5,000 10,000 3,233 980 207 954 1,089 3 0 0 0
10,000 15,000 2,644 67 29 298 1,404 845 1 0 0 15,000 20,000 1,903 23 6 43 562 1.262 6 1 0 20,000- 25,000 1. 123 13 2 17 119 850 122 0 0
000- 30,000 569 7 2 8 34 364 154 0 0
Block N 2l
30.000 50,000 553 9 3 11 35 182 282 31 0 50,000- 100,000 123 2 1 5 10 15 30 60 0 Over 100.000 29 1 3 11 5
Total 14,682 5,524 309 1,359 3,259 3,524 599 103 5
·" Total income is income before any exclusions. exemptions or tax expenditure deductions. •01 Some 283.000 individuals had incomes above $30.000 but had effective 1ax rates below 15 per cent (the tax filers in
Block A) 3' A0other 285.000 had i0comes beiow $30.000 but had ettective tax rates above 15 per cent (the tax tilers :n Block 8)
Source: Department of Finance, Analysis of Federal Tax Expenditures for Individuals, Ottawa, 1981, p. 8.

12
Vertical Equity. As Table 1 points out, primary benefits from tax expenditures are concentrated in upper income groups. This is further evidenced by the fact that in 1979, 3,467 individuals with incomes over $50,000 paid no tax. In addition, in 1979, 23% of primary benefits to individuals from federal tax expenditures went to individuals in the over $100,000 income group. This compares with only 6.296 of benefits to the $5,000-10,000 income group.24
These trends tend to bear out the assertions raised above regarding tax expenditure's inability (with the exception of tax credits and, to a lesser extent, exemptions) effectively to deliver benefits to low income groups. These are the characteristics which make these programs inherently regressive:
*
*
Benefits from exclusions and deductions increase with income. These types of tax expenditures are most common and have the most dramatic effect on concentrating benefits in the upper end of the income scale. Since low income groups pay less tax, they receive fewer benefits under these types of programs.
Complexity of tax law favours wealthier groups. As noted above, the Income Tax Act is complex and difficult for the individual to understand without professional assistance. Since wealthier individuals are in a better position to afford tax planners, accountants, etc., they tend to be better-equipped to take advantage of tax programs.
Horizontal Equity. Since tax expenditures, by their very nature, are intended to favour certain activities over others, it can be concluded that they necessarily detract from a "neutral" system. This in itself is not undesirable -- the government may wish to make certain sectors more attractive, as part of its fiscal policy. The problem, however, arises from the recent proliferation of tax expenditures. While a limited number of tax programs could be very effective in stimulating certain sectors with only a minimal departure from the general principal of neutrality, a proliferation of programs tends to be self-cancelling in impact (no longer does one sector receive a competitive advantage, since a large number of other sectors also receive subsidies), with strong negative effects on horizontal equity:
* Tax expenditures result in wide variations in tax paid by individuals with similar income levels. As Table 2 shows, effective tax rates for individuals in 1979 varied between 0 and over 3096 for the over $100,000 gross income group and between 0 and 20% for the less than $5,000 group. The table also shows that upper income groups often have lower effective tax rates than lower income groups.

13
TABLE 3
Tax Expenditure Benefits to Various Occupations as a Percentage of Income, 1979
Type of tax expenditures
Occupation Number of Income Tax Group Individuals A11<1> Exclusions Deductions Exemptions credits
('000) (per cent)
Employees 9,847.1 4.0 0.2 2.1 1.2 0.4 Farmers and
Fishermen 319.2 9.9 1.5 3.1 1.8 2.4 Professionals 118.7 7.4 2.7 4.3 1. 1 0.3
Salesmen and Business
Proprietors 532.3 6.8 1.3 2.6 1.9 0.8 Investors 887.0 13.3 7.4 3.8 1.0 0.8
Property Owners 104.6 12.8 9.6 3.9 1.1 0.6 Pensioners 1, 100.9 4.9 0.2 2.5 1. 7 0.1
All Groups(2 > 14,682.2 5.4 1.0 2.3 1.3 0.7
P> All excludes housing tax preferences for capital gains and imputed rental income. 12i Individuals have been classified to occupational groups on the basis of their major source of income. The total of all
groups includes a number of occupational groups that have not been specifically identified in the table.
Source: Department of Finance, Analysis of Federal Tax Expenditures for Individuals, Ottawa, 1981, P. 9.

14
* Tax expenditures favour certain occupational groups over others. Table 3 shows that investors and property owners tend to benefit from tax expenditures much more than employees or professionals.
* Tax expenditures have resulted in a shift of the tax burden away from corporations, toward individuals. In 1950, 23% of all federal revenue came from corporate income tax, and 20% came from personal income tax. By 1979 the corporate contribution dropped to 10.3% and the amount contributed by individuals rose to 37%. Today, the corporate tax rate is supposed to be 46%. On average, however, most corporations pay at a rate of 25%, the larger ones paying less.25
The large number of tax expenditures currently incorporated into the Income Tax Act have resulted in a tax system which tends to be based on a significant departure from general tax principles of neutrality and progressiveness. In terms of vertical equity, tax expenditures have tended to undermine the progressiveness of the system by delivering substantial benefits to high income earners. With respect to horizontal equity, tax expenditures have resulted in preferential treatment being given to corporations, certain individuals within income groups, as well as certain occupational categories.
D. Subsidy Yield
"Subsidy yield" refers to the amount and nature of secondary benefits or intended effects which result from tax incentives. The types of intended effects attributed to tax expenditures are wide-ranging. Tax programs have been introduced in an attempt to stimulate investment and employment in certain sectors, as well as attempting to encourage certain "desirable" social activities (e.g. charitable donations, homeownership, etc.).
While any detailed evaluation of indirect programs must take these secondary benefits into account, the number and diversity of tax programs, as well as the absence of any comprehensive estimates, precludes a detailed discussion in this section.
E. Speculative/Unintended Effects
Tax expenditures have been widely criticized for their impacts on investor behaviour. It has been argued that the effect of these programs has been to lead investors to make investment decisions purely on the basis of how their tax position will be affected, rather than on the basis of underlying profitability. The Department of Finance (1981) notes that:

15
At current marginal tax rates, tax expenditure provisions can reduce the after-tax cost of each dollar of tax shelter investment to as little as 30 cents. Given this situation, it is not surprising that many taxpayers have concentrated on the search for tax shelters with the result that investments are being undertaken which are simply uneconomic.26
In addition, tax law is structured so as to encourage high income earners to devote significant amounts of energy to tax planning and searching for new tax avoidance loopholes. This is seen by many analysts to be undesirable since it causes "taxpayers and their advisors to divert large amounts of scarce resources ••• into finding new and unintended ways to use tax expenditures.1127 Loopholes tend also to result in certain high income earners incurring substantial windfall tax savings, and they make the takeup and use of tax programs unpredictable. Administrators generally have to implement a program and then see how it is used. This tends to make tax policy planning a reactive, hindsight-oriented process.
F. Administrative Cost and Expediency
As noted earlier, the main advantages attributed to tax expenditures are related to administration and delivery. Each of these positive features is, however, subject to a large number of limitations.
Administrative Cost. Many analysts see tax expenditures as less expensive than direct spending alternatives since the far-reaching tax system is already in place. Tax programs, however, are imperfect substitutes for direct spending programs due to the limitations of the delivery system:
*
*
*
Eligibility must be determined on an annual basis, according to the previous year's tax return. Unlike direct spending programs, tax expenditures can only be developed or modified once a year, and must identify eligible recipients on the basis of characteristics pertaining to the previous year. Tax expenditures, therefore, are not well suited to programs requiring frequent modifications to eligibility criteria.
Delivery of benefits is necessarily restricted to a once-a-year tax reduction. Many programs require benefits to be distributed throughout the year, on a varying basis according to changing needs. This is not possible through the tax system which can only distribute benefits annually, in a lump sum fashion.
Tar et rou s must be eas to identif on the basis of information contained in a tax return e.g. income, demographics, etc •• Programs which are directed toward groups which are less readily identified, therefore, are not well suited to a tax expenditure format.

16
* Eligibility criteria and program structure must be kept simple to facilitate self-assessment. Unlike direct spending programs, tax expenditures must rely on the recipient to assess his or her degree of eligibility. Complex program rules would place significant burdens on recipients and the need for professional tax advice would rise. As noted above, complex tax programs are not suitable for delivering benefits directly to low income groups.
* Eligibility criteria and program structure must be black and white and well codified. Unlike direct spending programs which can incorporate fairly wide margins of administrator-discretion, tax expenditures must be highly codified and inflexible since they operate under a system of tightly-worded statutes and specific legislative constraints.
While the administrative costs of tax expenditure programs are often relatively inexpensive, they also tend to be fairly ''blunt" policy instruments. They are suited only to programs where target groups are readily identified, where benefits can be calculated simply and dispersed on an annual basis, and where program rules can be codified in a simple and clear fashion. While tax expenditures have the advantage of being less costly to administer than direct spending alternatives, they are necessarily limited in the types of programs they can handle.
Delivery. As noted above, some analysts have argued that indirect programs tend to contribute to horizontal equity, since they are open-ended (thereby guaranteeing equal benefits to individuals with similar characteristics). The discussion on distributional effects of tax expenditures, however, has clearly indicated that these programs, when allowed to proliferate, tend to severely detract from horizontal equity and the criterion of "neutrality."
In addition, it should be pointed out that open-ended subsidies tend to be unwieldly when it comes to budgeting and control. This is due largely to the fact that the cost of open-ended tax subsidies is extremely difficult to predict, since the amount of benefits taken up varies widely between individuals (depending on the tax filer's tax bracket and tax planning strategy). With direct spending programs, the government simply sets up a program budget and pays benefits until the fund is depleted (albeit at the cost of horizontal equity).
The second delivery advantage attributed by some analysts to tax expenditures relates to "confidentiality." It is argued that tax expenditures do not stigmatize the recipients of benefits as do some direct spending programs (although significant degrees of "confidentiality" are possible within the limits of direct spending programs, albeit at a somewhat higher cost). As noted above, however, tax expenditures have not been used to deliver large amounts of benefits to low and moderate income earners. With the exception of tax credits, it has been argued that tax programs are not well suited to this purpose (due to their

17
inherently regressive impacts). Given the fact that very few upper income earners would feel "stigmatized" if it were to be known that they were using tax expenditures to reduce their effective tax rates, it seems that the advantages associated with "confidentiality" are few. In addition, the fact that tax expenditures are confidential and ''hidden," tends to undermine the level of public accountability and disclosure possible within the programs. This issue will be discussed in more detail below.
Finally, as R.S. Smith (1979) points out, tax expenditures are often developed and administered by the Department of Finance and Revenue Canada, in isolation from the Ministries responsible for the corresponding functional area:
Under existing budgetary procedures, it is quite likely that programs carried out through the tax system are not adequately analysed by ministries responsible for direct expenditure programs in the same areas •••• It is unrealistic to expect tax experts to be as fully aware of the needs of various sectors of the economy or to compare tax exRenditures programs with other programs requiring direct expenditures.28
1.4 SUMMARY AND CONCLUSIONS
"Tax Expenditures" are often defined as prov1s1ons in the Income Tax Act, which are designed to confer benefits to certain activities or individuals through forgone tax revenues. For the purposes of this paper, tax expenditures are identified as any explicitly-intended departure from two benchmark tax norms: neutrality and progressiv ity.
A neutral tax system is defined as one which provides no preferential treatment to any one sector of the economy or individual investor. A progressive system distributes the revenue burden according to each individual's ability to pay.
The advantages commonly attributed to indirect, or tax expenditure programs, are threefold:
1. Tax expenditures have lower administrative costs than direct-spending alternatives.
2. They deliver benefits in an equitable, confidential, far-reaching manner.
3. Tax expenditures, in the past, have tended to be politically expedient because of their "hidden" nature. This aspect has been diminished in recent years as a result of improved accounting and a higher level of public scrutiny of indirect spending.

18
While tax expenditure programs do offer certain attractions, 1he negative features attributed by many analysts to these programs must also be considered:
1. Levels of indirect expenditure are high, having increased dramatically through the 70s. In addition, indirect programs are seldom subject to periodic review or "sunset clauses." As a result, a number of obsolete programs are still present in the Income Tax Act.
2. Average subsidy levels from tax expenditures are high and benefits tend to be concentrated in upper income groups.
3. Tax expenditures, by their very nature, are regressive. As such (with the possible exception of tax credits), they are best suited to programs intended to deliver benefits to upper income groups.
4. Indirect programs have, in the past, had a number of impacts on horizontal equity. They have: (i) resulted in wide variations in amounts of tax paid by individuals with similar income levels; (ii) favoured certain occupational groups over others; and (iii) shifted the tax burden from corporations to individuals.
5. Tax expenditures have been criticized for their impacts on investor behaviour. It has been argued that tax programs (i) result in investors evaluating investments on the basis of tax implications rather than underlying profitability; (ii) encourage high income earners to devote substantial time and resources to the search for tax avoidance loopholes; (iii) of ten have substantial unintended effects which confer windfall profits on non-targeted groups.
6. While costs of administration are relatively low for indirect programs, they tend to be limited as to the degree of flexibility and precision which can be built into the program. Tax expenditures, therefore, are suited only to programs where benefits can be calculated simply and dispersed on an annual basis, and where program rules can be codified in a simple and clear fashion.
7. While the open-ended nature of tax expenditures contributes to horizontal equity, this factor detracts from the ability of administrators effectively to budget and control these programs.
8. Given the fact that tax expenditures have been used to deliver benefits primarily to upper income earners, the fact that subsidies are confidential and do not stigmatize the recipients cannot be viewed as an important positive attribute.
9. Tax expenditures are often developed and administered by the Department of Finance/Revenue Canada, in isolation from the ministries responsible for the same areas.
Tax expenditures are, therefore, best viewed as ''blunt" policy instruments in comparison with their direct spending counterparts. Benefits are delivered, albeit with low costs of administration, to crude target groups, on the basis of characteristics contained on a tax return. Targeting to specific groups or local

19
areas, on the basis of individual needs, is not as feasible with indirect, as with direct programs.
In addition, tax programs are not well suited to delivering benefits to low and moderate income groups. They are limited to programs which provide primary-level subsidies to upper income earners, in the hopes that secondary-level benefits will eventually trickle down to lower income groups.

20
Chapter 2
HOUSING-RELATED TAX EXPENDITURES
This chapter provides a link between the previous general discussion and the specifically housing-related chapters which follow. It describes (1) historical background, and (2) relative levels of indirect federal expenditure on housing.
2.1 HISTORICAL BACKGROUND
As with the other types of indirect expenditure in Canada, housing related tax expenditures have gone through periods of "proliferation, reform and debate."
A. Proliferation of Tax Expenditures
Prior to 1972, a number of "implicit" tax subsidies had been enjoyed by investors in the housing market. These included: the non-taxation of "imputed rent" and "capital gains" for ownership housing, and the ability to use capital cost allowances to shelter other sources of income for investors in rental housing. (These programs are discussed in more detail below.) While it was generally accepted that these provisions offered substantial incentives for individuals and corporations to invest in housing, many arose as a result of administrative convenience, rather than from any explicitly-intended government policy.
Capital cost allowances (CCA), for example, enabled the rental investor to deduct depreciation expenses at a faster rate than they were actually incurred (see section 3.1 below). This resulted more from the fact that few empirical data were available on actual rates of building depreciation, rather than any explicitly-intended government subsidy. It can, therefore, best be viewed as a "loophole" rather than an explicit program.
The proliferation of housing-related tax expenditures continued through the 1970s with the introduction of the Multiple Unit Residential Building (MURB) and Registered Home Ownership Savings Programs (RHOSP) in 19 74. These tended to be unlike the pre-1972 provisions in that they were explicitly aimed at alleviating the housing shortage which had developed during the period 1972-1974.

21
B. Taxation Reform
In 1962, the Royal Commission on Taxation, the "Carter Commission," was established. It was instructed to "enquire into and report upon the incidence and effects of taxation imposed by Parliament ••• and to make recommendations for improvements in the tax laws.1129 While these recommendations were only partially implemented in 1972, the Commission did have major impacts on housing.
First, the provision enabling investors in rental housing to deduct capital cost allowances from other non-rental sources of income was repealed. In addition, rental investors were no longer allowed to defer taxes further on excess CCA claimed by, upon disposition, pooling the recapture with CCA deductions on other properties. Finally, a capital gains tax was introduced (applicable to any asset which appreciated in value during the period in which it was held) for all assets except an individual's principle residence. The details of these provisions will be discussed below; it is only important at this point to understand that the main impact of these "reforms" was to decrease the after-tax yield of real estate as an investment, and to reduce the liquidity of these projects (since capital gains and recapture of excess depreciation reduced the benefits of sale).
A second effect of the Carter Commission's reform proposals was to formalize, or "make explicit," the existing tax subsidies directed toward ownership housing. Recognition was given to the fact that the capital gains exemption and exclusion of imputed rent on ownership housing constituted significant tax expenditures. While the Commission realized that taxation of imputed rent was beyond the realm of administrative feasibility, it did recommend that the capital gains received by a homeowner upon sale of his/her house should be taxable.30 The government, however, did not implement this latter recommendation, arguing that the subsidy was desirable since "Homeownership is part of the Canadian way of life ••• " and therefore should be encouraged.31
The end results of the Carter Commission's reforms were twofold: the level of tax subsidy for rental housing was drastically reduced with the elimination of the CCA tax shelter provision in 1972; and previously "implicit" homeowner tax subsidies were publicized and made "explicit."
Attempts to reform indirect federal spending programs continued into the mid to late 1970s. A number of critics attacked the lack of accountability and "hidden" nature of tax expenditures, which were not accounted for until 1979.32 In response to this criticism, and in an attempt to reduce overall levels of federal spending, the Department of Finance released the first Tax Expenditure Accounts in 1979 (subsequently updated for 1976-1980), and has since dismantled a large number of indirect incentive programs. The MacEachen budget proposals of November 1981 were most significant in their effect on housing. The MURB provision was

,.,
TABLE 4
Summary of Major Federal Housing Expenditures (1979) Reveals Importance of Tax Expenditures ($ million)
Annual Expenditures
CMHC grants, contributions, and subsidies1
social housing (public housing, non-profit housing, co-operative housing, etc.)
market housing (AHOP, ARP, interest forgiveness)
land assembly and municipal infrastructure
other
$ 288
52
133 237
Implicit interest subsidies on oustanding loans2
Implicit subsidies in NHA insurance fees3
Federal tax expenditures4
non-taxation of imputed net rent non-taxation of capital gains RHOSPs MURBs
Rent control costs5
Total non-capital items
CMHC commitments for loans and investments6
TOTAL FEDERAL HOUSING ASSISTANCE EXPENDITURES
Sources:
1, 750 3,000
95 221
$
1. 2.
CMHC (1980: 60-61). In 1980 this item was $997. Smith ( 1981).
3. 4. 5. 6. *
Task Force on CMHC (1979: 79). Based on estimates from Table 18 infra. Smith and Tomlinson (1981). CMHC (1980: 58-59). In 1980 this item was $327. May not add due to roundings.
840
100
15
5,066
225
6,246
350
6,596
% of Total
1.5
0.2
76.8
5.3
99. 9*
Source: modified after L.B. Smith, "Housing Assistance: A Re-evaluation,n Canadian Public Policy, 7(3) Summer, 1981, p.455.

23
removed along with a variety of other reductions in indirect housing expenditure, particularly in the rental sector.
At present, however, there is widespread debate over the extent to which the government should rely on housing-related tax expenditures. Many of MacEachen's November 1981 proposals were strongly opposed and never actually became law (although they did apply as "interim measures"). The June 28, 1982 federal budget left unchanged the government's November decision to remove rental housing MURB -- CCA -- soft costs tax subsidies, and direct spending assistance to homeowners was increased. The government's desire to reduce its reliance on tax expenditures in housing, therefore, is still in evidence.
2.2 LEVELS OF HOUSING-RELATED TAX EXPENDITURE
Table 4 shows major federal housing expenditures by type for 19 79. As shown, housing-related tax expenditures accounted for over 76% of the total federal housing expenditure in that year. While the November 1981 budget proposals did reduce indirect spending somewhat (by discontinuing the MURB program and introducing the Canada Rental Supply Plan and direct homeowner assistance programs), the government still relies, for the most part, on indirect programs as a means of implementing its housing policies.
It can also be concluded from Table 4 that the vast majority of federal assistance has been directed toward ownership programs (in particular the non-taxation of imputed rent and capital gains exemptions). This point will be discussed in more detail in later sections.

24
Chapter 3
RENT AL HOUSING TAX EXPENDITURES
3.1 BACKGROUND AND RATIONALE
In the past, three main types of rental housing tax subsidies have existed: Capital Cost Allowance (CCA), Multiple Unit Residential Buildings (MURBs), and Soft Cost Deductibility. While these programs tend to be highly interrelated, for the purposes of description each one can be dealt with in turn.
A. Capital Cost Allowance
It will be recalled from Section 1.2 above that the tax system is structured to tax an individual according to "net worth" or income. "Income," as noted, can best be conceived as "revenue less deductible expenses."
Capital cost allowance is a particular type of deductible expense which enables an individual to subtract losses incurred as a result of the "depreciation" of the assets which make up his/her net worth. Depreciation losses "can be attributed to physical wear and tear, weathering, or obsolescence which an asset encounters during its service life. 1133
The first depreciation allowance in Canada was introduced in 1917 as part of the Income War Act. The ability of taxpayers to claim depreciation, however, was not a statutory right and claims were subject to ministerial discretion. In 1940, provisions were made for the claiming of "abnormal depreciation" on plant and equipment used for the war effort. In an attempt to make these deductions less discretionary (and, therefore, more predictable and less costly to administer) the government made the claiming of depreciation losses (estimated according to an asset's book value) a statutory right. "Book value" refers to the cost of an asset less the depreciation recorded on a taxpayer's book of accounts. In 1954, this method of calculating the depreciation allowance was abandoned, since "it seemed to increase business depreciation charges, thus leading to the problem of tax considerations dictating accounting principles. 1134 In 1954, therefore, CCA was introduced in the form in which we know it today. The depreciation allowance is calculated, not according to the ''book value" of an asset, but rather on a declining balance basis (see Section 3.2) according to a pre-determined rate which varies according to the class into which the asset is said to fall.

25
Capital cost allowances apply only to rental housing. In and of themselves these provisions do not constitute "tax expenditures," since they do not result in a deviation from the benchmark criteria of neutrality and progressivity. Ideally, CCAs should apply equally to all forms of investment, and should enable the individual to deduct from his/her income actual losses incurred as a result of depreciation. In reality, however, it is generally accepted that the rates allowed under CCA for rental housing tend to be higher than the depreciation losses an investor actually incurs. Second, taxpayers who acquire an asset at the end of a year were allowed to deduct a full year's CCA even though little, if any, depreciation has been incurred. This "accelerated depreciation" feature of CCA accounts for its identification as a tax expenditure since it violates the benchmark criteria of neutrality (the attractiveness of rental housing as an investment is increased relative to other sectors) and progressivity (individuals claim losses in excess of those actually incurred, resulting in an artificial reduction in taxable income).
CCA, however, is not a permanent reduction. Upon sale or disposition of an asset, the individual becomes liable for "recapture" of the excess CCA claimed over the life of the property. While, in the past, a number of strategies have been available to investors to reduce or further defer taxes after disposition, in general CCA should be viewed as a tax deferral, not a permanent exemption.
As noted above, CCAs are best viewed as "implicit" tax subsidies. The fact that allowed rates of depreciation exceed actual levels was due more to the lack of empirical data pertaining to building depreciation, than to explicit government policy. In 1977, as a result of increased study of actual rates of depreciation,35 all CCA rates for rental housing were reduced to 5% (previously, wood frame buildings were eligible for a rate of 10%, while steel and concrete frame structures received 5%).
The November 1981 Budget Proposals reduce the attractiveness of the CCA provision. For buildings acquired after November 12, 1981, in the first year of investment, "a taxpayer is only entitled to deduct one half of the CCA that is normally available to be deducted.1136 The portion of the first year CCA disallowed, however, can be written off over future years. This change does not apply to MURBs acquired before December 31, 1981. Neither does it apply where: (1) the taxpayer was obliged to acquire a building as a result of an agreement dated prior to November 13, 1981; (2) where construction commenced before November 13, 1981; (3) where arrangements for construction were advanced before November 13, 1981 and construction commenced before May 13, 1982; (4) where the taxpayer was obliged to acquire the building as the result of an agreement advanced before November 13, 1981.3 7

26
B. MURB Tax Shelters
Rental markets began to tighten during the 19n-1974 period in response to a variety of factors including increased demand, high interest rates, inflated building costs, and the l 9n reduction of federal tax incentives.38 In response to increased pressures for federal rental incentives, the Honourable John Turner announced in his supplement to the May 1974 budget that:
I am particularly anxious to provide a quick and strong incentive to the construction of new rental units. Therefore, I propose to relax for a period the rule whereby capital cost allowances on rental construction could not be charged against income from other sources •••• I am confident that this measure will attract a significant amount of capital into the construction of rental housing.39
In essence, therefore, MURBs were the reincarnation of the pre-19n CCA tax shelter. The rationale behind MURBs was straightforward and explicit: they were intended to increase the level of investment in rental housing in a "quick and strong" fashion. While the MURB provision was intended to be short term, it lasted from November 1974 to December 1979, until the provision was discontinued by the Conservative Government's Budget. The Liberals reintroduced MURBs in October of 1980 and the provision was allowed to run until December 1981, when it was discontinued in the MacEachen budget. The June 1982 Budget Proposals did not renew the MURB provision. As a result, all MURBs must have had their footings installed by December 31, 1981 and construction must proceed without undue delay after December 31, 1981.
C. Soft Cost Deductibility
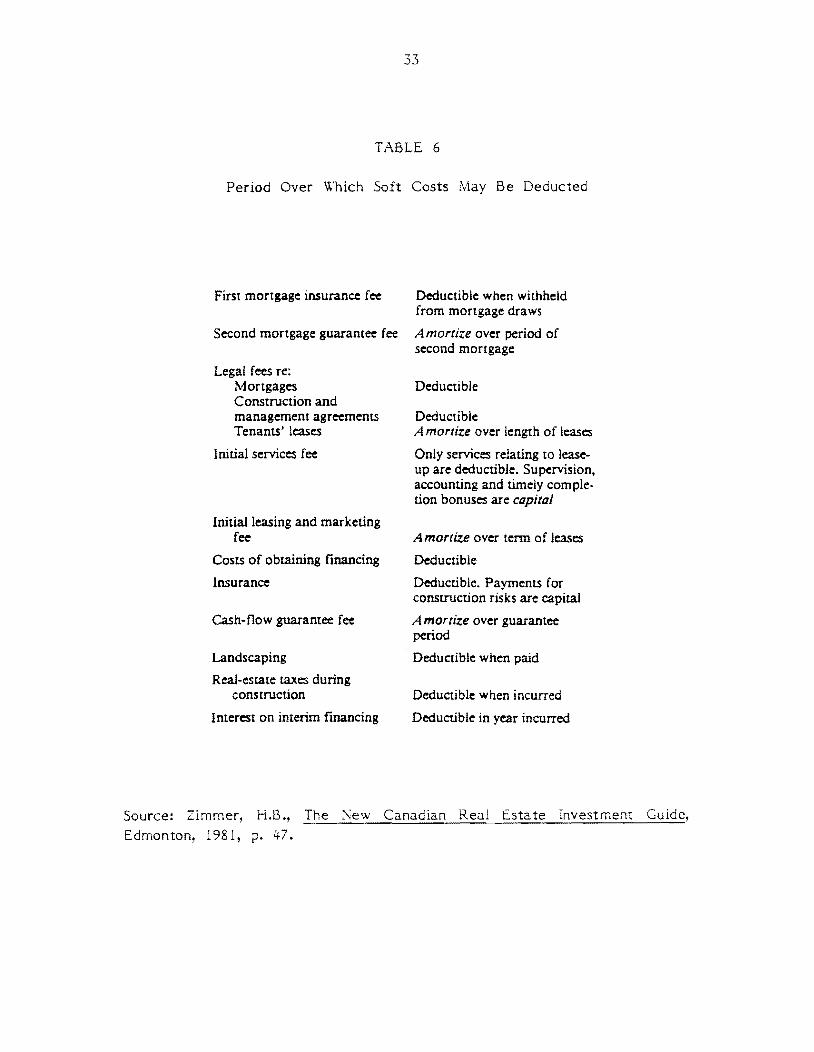
Prior to the November 1981 Budget Proposals, investors in rental or commercial real estate developments have been able to obtain an immediate write-off of all "soft costs" incurred prior to construction. These include expenses such as ''promotion expenses, legal and accounting fees, mortgage fees, interest expense during construction and property taxes related to real property.1140 Soft costs generally account for between 20 and 25% of project cost, although buildings have been marketed with up to a 55% soft cost component.41
Like CCA, "soft costs had never been introduced as a tax incentive but exist as a result of the general deduction sections in the Income Tax Act.1142 These sections permit the deduction of "current expenses" (relating to ongoing business) as they are incurred, as opposed to "capital expenses" (relating to property), which must be capitalized into the value of the property and written off over longer periods through CCA. Current costs have the added advantage that they are not

27
recaptured upon sale of the property (although, to some extent, the capital gains tax an individual pays on recaptured depreciation upon disposition does include the value of the soft costs). In addition, soft cost write-offs can be ''passed forward" from developers to investors in syndicated MURB buildings* as long as they are the beneficial owners of the property when the expense is incurred. 43
There is some controversy regarding the extent to which these write-offs constitute tax expenditures. While the general provision enabling taxpayers to deduct current expenses as incurred does not, in itself, constitute a tax subsidy (since it applies equally to all industries, thereby upholding the criterion of neutrality, and does not violate the second benchmark criterion of progressiveness), there are a number of real estate factors which make the deductibility of soft costs questionable:
*
*
*
Real estate soft costs are inte reted as "current ex enses" but are actually "capital" in nature. Zimmer 1981 notes that, "from an accounting standpoint soft costs contribute to the total value of any project under construction. Also one could not construct a replacement building without incurring these same costs. Thus, they are treated as long-term assets (capitalized) on financial statements, and are only written off through normal depreciation over the lifespan of a building. However, for tax purposes, soft costs are subject to an immediate write-off because of specific legislation.1144
Real estate soft costs constitute high proportions of total project cost compared to other industries. As noted, developers have structured their projects so as to sink as much money into soft costs as possible (as much as 55% of project value). This results in a violation of the benchmark criterion of neutrality since real estate developers are able to reduce taxes through a deduction of current expenses, at a faster rate than other industries.
Soft cost deductibilit can be assed forward to s ndicated investors. Clayton 1981 notes that "certainly the transferability of this deduction is a tax expenditure in any case. The investor is, in effect, purchasing an asset in which all costs have been capitalized in the final price; the only difference between the syndicated investor and someone purchasing an existing building is one of timing - the investor does not incur the soft costs., the developer does, and these costs are reflected in the price.11 4.J .
The potential for soft cost deductibility has always existed in the Income Tax Act. Zimmer (1981) notes, however, that "ironicaJJy, the opportunity to claim soft costs could have been 'discovered' many years ago. It appears coincidental that the
* "Syndicated investors" are private individuals (doctors, lawyers, etc.) who purchase units in MURB projects from developers and, in turn, rent the units out for tax shelters and rental income.

28
existence of these tax advantages was only realized around the same time as the MURB program was introduced.1146
Between 1979 and 1981, the attitude of Revenue Canada toward soft cost deductibility tightened somewhat. As noted, certain expenditures previously deductible "up front" were required to be amortized over a reasonable length of time (e.g. advertising costs and rental guarantees). In addition, the April 1980 Budget "introduced special legislation dealing with prepaid expenses, presumably to strengthen Revenue's position.1147 The November 1981 Budget ended deductibility of soft costs as incurred, by proposing that "such costs incurred after November 12, 1981 to the extent that they relate to the real property or the acquisition of real property, be added to the capital cost of the land or building.1148 This does not apply, however, to corporations whose principal business is real estate development. Nor does it apply: (1) to buildings which began construction before November 12, 19 81; (2) where arrangements for construction were made before November 13, 1981 and where construction started before June 1, 1982; (3) where the taxpayer was obligated by agreements advanced prior to November 13, 1982 and where agreements for construction were made before June 1, 1982 and footings installed before December 31, 1982. In all cases, construction must proceed without undue delay.49
In summary, rental housing tax expenditures can be divided into two classes: "implicit subsidies" (which arose as a result of the interpretation of provisions in the Act, rather than as a result of any intended policy goal) and "explicit subsidies" (which were introduced with the specific intention of favouring the rental housing industry). Implicit subsidies include CCA and Soft Cost Deductibility, while MURBs are a more explicit policy aimed at providing a "strong and quick," short term stimulus to the rental housing industry.
The controversy over tax expenditures through the 1970s (resulting from "reform" pressures) exposed the implicit subsidies to a great deal of public scrutiny. This had the effect of forcing the government to formalize or "make explicit" the intentions of these programs. Each program can, therefore, be viewed as an attempt on the part of the government to increase investment in the rental housing industry.
The next section explains in more detail how the MURB, CCA and Soft Cost Deductibility provisions worked together to create an incentive package for investors and developer/promoters.

29
3.2 PROGRAM STRUCTURE
It is useful to summarize the definitions of the three rental provisions:
*
*
*
Capital Cost Allowance. Owners of rental housing can claim a yearly tax deduction (5% of a project's capital cost, on a declining balance basis), against rental income for depreciation expenses. The rates allowed under CCA exceed actual depreciation, resulting in the delivery of a tax subsidy. This subsidy (the net difference between actual and CCA depreciation) should be paid back upon disposition of the project. It can, therefore, be viewed as an interest-free loan or tax deferral.
Multiple Unit Residential Buildings (MURBs) are a special provision enabling investors to deduct CCA from non-rental sources of income. MURB benefits are transferable and remain with a building over its functional life.
Soft Cost Deductibility. This provision enables developers and investors in all forms of rental or commercial real estate to deduct certain capital expenses as they are incurred (at the front end of a development). These deductions can be used against non-rental income and are not subject to recapture upon disposition of the asset.
A. Capital Cost Allowance
Capital cost allowance is perhaps the most straightforward of the three provisions. Assets are grouped into classes or "pools," and the CCA is calculated on a diminishing balance basis according to a simple formula:
CCA = (rate of depreciation x undepreciated capital cost)
As an example, assume a non-MURB building is purchased at a capital cost of $100,000. The allowed rate of depreciation is 5% (unless the building is a "class 32 asset" -- a wood frame building constructed before 1978 -- in which case the rate is 10%). At the end of year 1, the CCA is calculated as 5 per cent of $100,000, or $5,000. The undepreciated capital cost (UCC) for year 2, is therefore reduced by the $5,000 in claimed depreciation; therefore, the year 2 UCC is $95,000 (or $100,000 less $5,000). For year 3, the CCA is 5 per cent of the UCC (or 5% of $95,000 = $4,750).
There is, however, one catch: without the MURB provision, the amount of CCA deduction claimed cannot exceed the revenues obtained from the project (this limitation, however, does not apply to "life insurance companies or corporations whose principal business is leasing, rental, development or sale of the real property1150). A project with a negative cashflow, therefore, cannot benefit

275
250
225
200
175
150
30
FIGURE 1
CCA Tends to Provide Deductions During Early Years But Falls Below Booked Value Between 15th and 20th Years*
sink i no fund (booked}
0 125 0 0 {./)-
-100
75
50
25
1985 1
1990 5
1995 10
Year
2000 15
2005 20
2010 25
* Based on sample project using 596 I 50-year sinking fund schedule and 596 CCA schedule. Source: Clayton Research Associates, Tax Exoenditures CMHC, 1981, p. B35.
housing, Ottawa,

31
from CCA (unless the project is a MURB).
The difference between CCA and actual or ''book" depreciation is illustrated in Figure 1. The graph shows that while CCA exceeds actual depreciation in the first 15-20 years of a project's life, after this point CCA enables the investor to claim less depreciation than is actually incurred. The effects of the accelerated depreciation provision are, therefore, twofold:
* CCA enables investors to defer some tax until disposition of the property. By allowing the claiming of higher-than-normal depreciation expenses during the early years of an investment, the government allows investors to put off paying some proportion of their tax bill until the time when the property is disposed of. To some extent, this is offset by the fact that rental revenues tend to be low during the early years of the investment, and the fact that during the later years actual levels of depreciation tend to exceed CCA.
* CCA minimizes taxes during the unprofitable front end of the investment. Since the difference between CCA and actual depreciation is greatest during the early years of an investment, this is the time when the investor receives the greatest level of subsidy. This factor provides a substantial benefit to investors who tend to be cash poor during this phase of the project.
As noted, excess depreciation expenses claimed under CCA are subject to tax upon disposition of a property. The amount of excess depreciation subject to tax is calculated by subtracting the unclaimed capital cost from the proceeds an individual receives upon sale. This amount is subject to some combination of capital gains and personal (or corporate) income tax. Individuals tend to structure their affairs so as to maximize the proportion of excess depreciation taxable as capital gains, since this is calculated at half the normal rate.
In addition, it should be noted that a wide range of manoeuvres has been available to individuals, enabling them to avoid or defer paying tax on excess CCA upon disposition. These have included (1) timing the ultimate sale so that it falls in a year of low income, or offsetting losses from other sources when the investor's marginal tax rate is low; (2) spreading the income from sale across several periods using an Income Averaging Annuity Certificate (IAAC) (this move was ruled out as a result of the November 1981 Budget Proposals); (3) taking back a second mortgage from the purchaser so as to, again, spread the income out over several periods; (4) demolishing the building; (5) selling the corporation holding the building; or (5) demolishing the building and claiming a "terminal loss.1151
This latter manoeuvre has received considerable attention in recent years, particularly from advocates of heritage preservation. These analysts have argued that the CCA provision encourages developers to demolish their buildings

TABLE 5
List of Allowable Soft Cost Deductions
J. CMHC mortgage insurance fee: A fee ;:iaid to obtain a guarantee by the Canadian Mong;::.ge and Housing Corporation of payments with respect to the first mortgage {usually 1.5% of the first mortgage).
2. Second mortgage guarantee fee: A fee paid to the project manager (usually the developer or general contractor) to guarantee payments of the investors on account of their second mortgages. This is sometimes a fee for providing a second mortgage at low interest {first mortgage) rates.
3. Legal fees re: •First and second mortgage documentation. • Construction and management agreements. • Tenants' leases.
4. Initial services fee (administration and supervision): • Charges for off-site administration and management of project. • Providing accounting services and reporting to investors. • Guarantee of timeJy completion. • Undertaking to pay net operating costs including maintenance~ taxes and interest due to construction delays after scheduted date of completion.
5. Initial leasing and marketing fee: • Undertaking of the project manager to develop, prepare and review policies and procedures with respect to the marketing of rental units during the initial rent-up period. including advertising for tenants. •Commissions paid to rental agents.
6. Costs of obtaining financing: • Standby charges. •Appraisal costs. • Commitment fees. • Commissions paid to brokers to obtain financing (after November 16, 1978).
7. Insurance on the project during construction. 8. Ca'.sh-flow guarantee fee: A fee to compensate the
project manager for undertaking to guarantee at least a break-even cash flow for a certain period (e.g., two years) after substantial completion of the project.
9. Landscaping costs (deductible when paid). 10. Rt~tate taxes during construction. 11. Interest on mortgages (interim financing) during the
construction period (at actual costs).
Source: Zimmer, H.B., The :\ew Canadian Real Estate Investment Guide, Edmonton, 1981, pp. 39-40.
33
TABLE 6
Period Over Which Soft Costs May Be Deducted
First mortgage insurance: fee Deductible when withheld from mortgage draws
Second mortgage guarantee fee Amortize over period of second mortgage
Legal fees re: Mortgages Deductible Construction and management agreements Deductible Tenants' leases Amortize over length of leases
Initial services fee Only services relating to leaseup are deductible. Supervision, accounting and timely completion bonuses are capital
Initial leasing and marketing fee Amortize over term of leases
Costs of obtaining financing Deductible
Insurance: Deductible. Payments for construction risks are capital
Cash-flow guarantee fee Amortize over guarantee period
Landscaping Deductible when paid
Real-estate taxes during construction
Interest on interim financing
Deductible when incurred
Deductible in year incurred
Source: Zimmer, H.B., The ~ew Canadian Real Estate Investment Guide,
Edmonton, 1981, p. 1+7.

34
prematurely as a means to aviod paying deferred tax. Denhez 0978) refers to two ways in which CCA has encouraged premature demolition. A developer may decide to demolish his building in an attempt to avoid exposure to capital gains tax on the excess depreciation claimed through CCA in previous years:
if the owner has been overdeprecia ting the building (and thus claiming too much in tax deductions), he can no longer be detected if the building has been demolished; the reason is as follows: ... The prospect of a big tax bill on disposition of the property is avoided by demolition: if the building has been "lost" there is no way for the Department of National Revenue to tell whether it has been overdepreciated.52
Denhez' second advantage relates to the "terminal loss" provision:
Certain business losses are tax deductible. As mentioned earlier, a demolished building has been "lost", according to the Act; when the building happens to be a revenue producing building, then the loss is called a "terminal loss"~ and a tax deduction is claimed for the entire book value of the building • .J3
The November 1981 Budget modified the terminal loss provision in a number of ways to discourage premature demolition. The new provisions come into play in two situations: ( 1) when a building and the land on which it sits are sold at the same time; and (2) when the land on which the building is situated is not disposed of in the same year. In the former case, if a building is torn down (or sold at a loss), the loss on the building must be claimed against any gains on the land. In the second case the value of the building will be defined as its actual sale price plus half of the difference between the building's market value and the actual proceeds from sale. The effect of this rule is to treat the loss on the sale or demolition of the building as a capital loss, only one-half of which is deductible (rather than as an ordinary loss which is 100% deductible).54
B. Soft Cost Deductibility
As noted above, between 1979 and 1981 Revenue Canada became increasingly strict with respect to its definition and eligibility criteria for soft costs. Table 5 provides a fairly comprehensive list of soft cost write-offs available to real estate investors in 1981. Table 6 shows the prescribed periods over which these expenses were to be written off (as of 1981).
Soft cost deductibility provides a number of benefits to investors and developers: they offset negative cashflows during the unprofitable front end period, and they provide reduction in an investor's taxable income from other sources. In addition, there is no recapture of these deductions upon disposition of the property. For these reasons, developers attempt to structure their projects to make maximum use of these deductions. Clayton (1981) tends to agree with this

35
point, noting that "it would be preferable to allocate as many disbursements as possible, rather than to the capital cost of the building so as to achieve an immediate write-off with no recapture rather than a relatively slow 5 per cent depreciation with recapture.1155
C. Multiple Unit Residential Buildings
A building qualifies as a MURB if it fulfills the following criteria:
* It contains not less than two dwelling units;
* Construction was started (installation of footings) between November 18, 1974 and the end of 1979 or between October 28, 1980 and the end of 1981 (and where construction proceeded by December 31, 1982);
* Not less than 80% of floor space is used for self-contained domestic establishments and related areas; and,
* The owner or operator is in possession of CMHC certification of the above.56
In addition, while a MURB building does not need to contain rental units, only those units which are rented receive MURB tax shelter status. While a unit can switch between ownership and rental tenure, and between owners, it can only generate tax shelter benefits when it is being used for rental purposes.
Investors in MURB projects, life insurance companies or corporations whose principal business is the leasing, rental, development or sale of real property are the only taxpayers who can use CCA to shelter income in excess of that generated by the asset or pool. An investor can buy a 2% interest in a $600,000 MURB, and in the first year reduce his/her taxes by 2% of the allowed CCA (or 2% of 5% of $600,000 = $600). Added to this deductible amount would be 2% of the soft costs and other deductions allowed during the period of ownership.
Like CCA, MURBs do not represent a tax exemption. Rather, they allow the investor to temporarily offset his/her taxable income by claiming CCA. The recapture provision of the CCA, however, stipulates that, upon disposition, the difference between the sale price and the undepreciated capital cost (UCC) of the project must be included in income and taxed at the appropriate rate. Thus, any claimed excess depreciation should (in theory at least) eventually be paid back to the government. MURBs, like CCA, can best be viewed as a tax deferral; the investor obtains the use of the government's tax revenue interest free during the deferral period, and pays the excess CCA back in inflated dollars. As noted above, however, a variety of manoeuvres have been available to investors to defer or reduce their liability for CCA recapture upon disposition.

Table 7: EXAMPLE OF CASHFLOW FORECAST FOR INDIVIDUAL OWNER OF MURB PROJECT
1 2 3 4 5 6 7 8 9 10 Income Tax
Cash Flow Mortgage Appliance Soft Loss Reduction Cash Cash Cumulative After Debt Principal Replacement Cost for Tax (at 50% Return Contributions Net Cash
Year Service ReEalment Reserve CCA Deductions Pur2oses Tax Rate) to Owner b;t: Owner Position +(-) +(-) +(-) +(-)
1 C 0 N S T R U C T I 0 N $ 20,000 $160,845 $180,845 $ 90,423 $ 90,423 $700,000 $(609,577)
2 AN D S T A R T u p P H A S E 252,874 313,000 565,874 282,937 282,032 -- (326,640)
3 $ (68,651) $ 13,000 $ 17,333 288,024 243,000 589,342 294,671 206,020 -- ( 120 ,620)
4 ( 106' 444) 16,000 26,000 268' 182 -- 332,626 166,313 59,869 -- ( 60,751)
5 ( 78,585) 20,000 26,000 250,398 -- 282,983 141.492 62,907 -- 2,156
6 ( 49,333) 25,000 26,000 234,357 -- 232,690 116,345 67.012 -- 69' 168
7 ( 18,618) 30,000 26,000 219 ,802 -- 182,420 91,210 72,592 -- 141'760
~ 8 13,633 35,000 26,000 206,525 -- 131,892 65,946 79.579 -- 221,339
9 47,496 38,ooo 26,000 194,352 -- 82,856 41,428 88,924 -- 310,263
10 83,052 42,000 26,000 183,142 -- 32,090 16,045 99,097 409' 360
11 120,386 47,000 26,000 172,777 -- ( 20,609) ( 10,305) 110,081 -- 519,441
12 159,587 52,000 26,000 163,159 -- ( 74,428) ( 37 ,214) 122,373 -- 641,814
Total $ 82,523 $318,0QO $251,333 $2,453,59? _ $116_,§45 $2,518_,281 $1,259,291 $1_, 3~,814_ .. _$7QO_JQO_Q _$Q_41.i:814
Notes: Column 1 = Project revenue less expenses (including interest).
6 = CCA + Soft Cost Deductions less (Col. 2 + Col. 3). 7 = Net Tax Savings (assuming 50% marginal tax rate). 8 = Income Tax Reduction (7) + Cashflow (1); if cashflow is negative it should be subtracted
rather than added. 9 = Individual's equity share.
10 =Individual's Net Revenue (8) less Project Cost (9) (cumulative).
Source: E.D. Marchant, "MURBs," CA Magazine (Sept., 1977), Table 5.

37
Examining a Sample MURB. It is useful to look at the projected cashflow of a sample MURB project in order to see how the three provisions discussed above work together to make rental investment more attractive to the developer/investor. Table 7 shows a proforma cashflow for a 267 unit MURB development in 1977. The cost of the project was $7 million, with a 10 per cent, or $700,000 equity share. The table assumes a single owner in the 50 per cent tax bracket, providing all of the equity.
During the initial two years, the permitted tax losses are relatively small and mainly attributable to soft cost deductions. The low CCA is due to the fact that this period is the "construction and start up phase" of the development and capital cost outlays tend to be small. While soft costs provide an important source of deductions in the first three years, after year 4 they cease to exist (soft costs on some newer projects may be deducted over longer periods as a result of Revenue Canada's stricter interpretation of the provision).
Table 7 also shows that tax deductions (i.e. CCA, soft costs, etc.) tend to approach zero after about year 10 (see column 6). This is due primarily to the increased revenues generated by the project (offsetting any tax losses) and the declining CCA balance. The diminishing importance of tax losses as a source of benefit to the investor illustrates an important point: that a MURB investor must consider tax planning aspects as well as the long term real estate characteristics of the venture (vacancy levels, interest rates, changes in zoning, etc.). As noted by Fulton (1981), "after the benefits of deferred taxes and any other subsidies have been exhausted, the real estate project must still amortize the remaining debt and generate an adequate return on the investor's capital.1157
Since the mid-70s, rents have risen more slowly than costs in many Canadian centres. As a result, the majority of analysts argue that very few projects could have been built with the MURB-CCA-Soft Cost subsidies alone. Goring and Norbrega note that the subsidies alone did not " ••• provide sufficient incentive to stimulate construction of a substantial number of rental units in the private sector.1158 This fact partly explains the government's introduction of the Assisted Rental and Graduated Payment Mortgage Programs -- direct-spending subsidies which were intended to be used in conjunction with MURBs.59 In addition, a variety of complementary, direct-spending provincial programs were "piggybacked" on to MURBs in the mid to late 70s.

38
3.3 PROGRAM IMPACTS AND PERFORMANCES
It was pointed out above that the MURB-CCA-Soft Costs tax subsidies (referred to hereafter as the "MURB subsidies") will have two basic effects: First, they tend to make investment in real estate more attractive to the private individual who wishes to reduce his/her effective tax rate. Second, they tend to concentrate tax savings in the front end of the project -- normally the time when cashflows are extremely low. It is useful to consider the impacts which simple market forces would tend to have on these tax shelters over time.
As noted by the Ontario Economic Council (1976), in the short run, the introduction of tax incentives should tend to increase the after-tax returns to MURB investors, leading to greater levels of investment in the rental market and an increased supply of housing. This should lead to a decline in the rents paid by all renters as the amount of available stock rises. Over the long run, as more capital is attracted into the rental sector, output presumably will rise and the after-tax rate of return in all areas of investment will equalize.60 At this point, investors in MURBs should pay no more (or no less) for these projects than the present value of the future stream of income they expect to receive.
In theory, therefore, MURBs should have five effects: (1) increase the level of equity participation in rental housing from private investors seeking tax reductions; (2) increase the supply of rental units (as producers' costs fall); (3) in the short run, generate increased profits for investors and producers of MURB buildings; (4) over the long run, generate profits equal to those attainable in alternative investments; and (5) reduce rents and thereby confer direct benefits on all tenants, and indirect benefits on owners (as the demand for ownership housing falls in response to a substitution towards rental).
This is a fairly simple theory but it nevertheless provides a framework for evaluating the actual impacts of MURBs on the housing market. Eight impact variables are used here to examine the extent to which the above effects are actually attained:
*
*
*
*
Expenditure/cost levels attributed to the MURB-CCA-Soft Costs provisions on an annual and discounted present value basis.
Supply. The extent to which the tax provisions led to an increase in the rental stock.
Affordability. Did MURBs help to reduce rental levels?
Quality. Factors such as: structure type, materials, durability, livability, maintenance, etc.

39
TABLE 8
Annual Federal Tax Losses Resulting from MURBs, CCA and Soft Costs, 1976-1981
1976 1977 1978 1979 1980 1981
MURB provision* n/a n/a 49 61 65 67
Use of CCA rather than Actual Depreciation** 95 95 95 95 95 95
Deductibility of Soft Costs* MURBs n/a n/a n/a 54 78 67 Other private rental n/a n/a n/a 11 32 49
Total n/a n/a n/a 65 110 116
MURB and Soft Cost Provisions n/a n/a n/a 115 143 134
* Assuming a federal marginal tax rate of 36%. ** This tax expenditure relates to the total stock of rental dwellings which are being depreciated (not just MURBs). Source: Clayton Research Associates, Tax Expenditures -- Housing, Ottawa: CMHC, 1981, p. v.

TABLE 9 Discounted Federal Tax Losses Resulting From 1981 Rental Starts3
Tax Subsidy Discount Program(s} Period
MURB 1 1981-2010
CCA 1 1981-2010
Soft Cost Deductibility 1981-1986
MURB + Soft Costs Together2
Notes:
1981-1986
10
49
120
163
140
Interest Rate 15
($ million}
60
99
141
141
1. Assuming average federal marginal tax rate of 36%. 2. Assuming average federal marginal tax rate of 40%. 3. Figures include both personal and corporate deductions.
20
79
83
127
181
Direct Spending Equivalent (lump sum capita_!_grant in 1981}
$2,000-3,200 per unit
$2, 100 per unit
$2,800 per unit for non-MURBs; $3,200 per unit for MURBs.
$5,600-$7,250 per unit, or a 15-20% capital grant
After: Clayton Research Associates, Tax Expenditures.::.:. Housing {CMHC: Ottawa, 1981},

41
* Targeting &: delivery. The degree of sensitivity to local and individual needs possible under the MURB program.
* Distribution of benefits. Who benefits from the MURB tax subsidy?
* Administration &: control. MURB program, compared the problems inherent in program.
The relative cost of administering the to that of direct spending alternatives; budgeting and controlling the MURB
* Accountability &: disclosure. How well have the impacts of the MURB program been communicated to the average voter? Is there a potential for building sufficient levels of accountability into the program?
A. Expenditure/Cost of MURB Program
Two sets of estimates are required in order to obtain an accurate picture of how much these tax subsidies have cost the federal government in recent years. First, estimates of annual cost, to show the relative magnitude of past expenditures on the programs; second, estimates of the discounted present value of future subsidies required for previously built MURBs, in order to evaluate future costs of MURB projects to the federal government.
The annual cost of MURBs built between 1976 and 1981 is shown in Table 8. In 1980 and 1981, the deductibility of soft costs accounted for the highest amount of federal revenue loss. In 1979, however, soft costs accounted for lower losses than CCA. Clayton (1981) attributes this trend to the change in the soft cost rules introduced in 1979 (requiring that expenses be deducted as incurred, rather than at the front end of the investment). This change in the rules "would have resulted in a relatively low level of soft cost claims in 1979, followed by a build-up in 1980 and 1981.1161
Second, it should be noted that in 1981 the MURB-Soft Cost provisions together accounted for a revenue loss of $134 million (the effect of the CCA accelerated depreciation provision cannot be included in this total since this would result in double-counting).
Table 9 presents estimates of the present value of tax expenditures to be incurred in future years as a result of projects started in 1981. Present value is a superior indicator over annual cost because it takes into consideration both the future losses which result from 1981 starts, and the fact that a "dollar tomorrow is not worth as much as a dollar today." Regardless of which interest rate is chosen, soft cost deductibility leads to a larger discounted tax loss than CCA or MURBs. (In addition, as noted, the period over which these costs are incurred is much shorter than the other provisions.)

42
Considering MURBs and soft cost deductibility together, it is shown that discounted tax losses resulting from 1981 starts are in the order of $140-180 million, or a direct spending equivalent of between $5,600 and $ 7,250 per unit, delivered in 1981 as a lump sum capital grant.
Clayton (1981) estimates that all of the MURB projects started between 1976 and 1981 (estimated at about 195,000 units) account for a discounted tax loss of between $560 and $ n5 million, not considering the complementary effects of soft cost deductibility.62 Soft cost deductions, CCA and MURBs account for a direct spending equivalent of between 15 and 20% of project cost (Clayton 1981). This estimate is slightly lower than that supplied by the Canadian Institute of Public Real Estate Companies (CIPREC), who estimate the net equivalent value of MURB income tax incentives to an interest-free loan to be as follows:63
Unlimited deduction of CCA Soft Cost deductions Total
B. Impacts on Rental Supply
Project cost
8-10% 12-14% 25-30%
As noted, the primary goal of the MURB program was to provide a "quick and strong" incentive for increasing the supply of rental housing. To assess the extent of the program's success, two questions must be answered: (1) how many MURBs were built? (2) of these, how many would not have been built without the tax incentives?
One is immediately faced with an extreme lack of useful data, the only hard information available being the number of MURB certificates issued. This is not a reliable measure of the number of operating MURBs, however, due to several factors: first, many developers have taken the precaution of obtaining a MURB certificate even if the project was to be used as a condominium (this allows future owners the option of renting their unit and realizing the tax shelter benefits, thereby enhancing the project's marketability). Second, a number of certified MURBs, because of high interest rates or changing federal policy, will never actually be built.64 It has been noted that the "lack of adequate information could be defended on the grounds that the program did not have any permanence because it had been renewed on a yearly basis since its inception. 11 65

43
TABLE 10
Estimated MURB Starts, Certificates Issued and Total Row and Apartment Starts, Canada, 19 7 5-1981
MURB MURB Certificates Total Row & starts Issued Apt. Starts
1975-1978 120,000 206,090 431,778
1979-1980 50,000 76,550 131,367
1981 Forecast 25,000 n/a 72,000
Total 195,000 n/a 635' 145
Source: Clayton Research Associates (1981), Tax Expenditures -- Housing, Ottawa: CMHC, 1982, p. 17.

44
For the sake of consistency, the estimates of the number of existing MURBs prepared by Clayton (1981) are used here (see Table 10). Using a forecasted 25,000 starts in 1981, Clayton estimates the total stock of MURBs to be roughly 195,000 units. This equates to over 30% of all row and apartment starts in the 1975-1981 period. One cannot conclude from this, however, that 195,000 units were caused by the MURB program.
"How many rental units would have been built with or without the MURB incentives?" Clayton (1981) agrees with the simple theoretical discussion of the effects of MURBs on supply; that is, over the short term, the subsidies should cut front end costs for developers, attract investment capital to rental housing, and lead to increased supply. Clayton also notes, however, that the MURB-CCA-Soft Cost provisions by themselves were not enough to cause significant expansions in the stock. The availability of the complementary Assisted Rental Program, and Provincial programs combined with MURBs, led to the increase in rental starts in the 1975-1979 period.
Li th wick (19 78) provides a fairly detailed evaluation of the Assisted Rental Program (ARP). Since about 70% of all ARP units were MURBs, and the programs were designed to be used together, his findings have some bearing on the MURB program. Based on an econometric evaluation, Lithwick concludes that about 60% of the units built under ARP in 1976 would not have been built without the MURB/ ARP subsidies, although he adds that the estimate should be interpreted "with a substantial degree of caution. 11 66
A recent study of the effect of MURBs on the Vancouver market argues that the added rental supply that can be attributed to past tax incentives is limited at best. Gau (1982) notes that in Vancouver (and many other Canadian centres) the supply of multifamily residential land has been extremely limited as a result of provincial and municipal controls. This tight land market results in a departure from the hypothesized effects of MURBs, outlined at the beginning of this section.
Instead of the MURB subsidy being passed on from investors to land owners and eventually to renters, the inelastic supply of land enables land owners to raise prices high enough to capitalize the full value of the subsidy into land prices. The end result, therefore, is that land owners reap windfall profits and levels of supply and rents remain unchanged. Based on empirical research, Gau concludes that "the MURB program has probably had little impact on rents and the long-run supply of apartment units. 116 7
It must be kept in mind that Gau's arguments are based on limited evidence and his hard data pertain only to a 1980 sample of Vancouver-based units. Nevertheless, his argument does seem plausible and probably holds true to some extent for municipalities with limited reserves of multiple-zoned land.

45
Clayton (1981) provides some evidence which tends partially to contradict Gau's argument: An examination of syndicated MURB packages indicated that developer/promoters were making "very large profits through the pricing of their product considerably above the price of non-MURB rental accommodation. 1168 This would not be possible if land owners were not passing at least a portion of the subsidy forward to developers/promoters and investors. The only exception to this rule would be if investors were extremely naive and willing to pay prices in excess of the present value of future tax benefits. As will be pointed out below, investor naivety may actually be a factor in some MURB transactions.
Two other characteristics of the MURB buyer tend to damage its net impact on rental supply: It should be noted that construction of a MURB project often necessitates demolition of existing rental accommodation. In Vancouver, for example, it was estimated that, as a result of this demolition factor, construction of two ARP/MURB units resulted in a net gain in the City's housing stock of only one unit.69 Secondly, a large proportion of MURB units were strata-titled prior to rental. McAfee notes that:
There is some question as to how long the units will remain rental once various taxation incentives are reduced. Possible sale to owner occupants could reduce substantially the City's stock of rental housing. 70
While it is difficult to put a number on the proportion of MURBs which would have been built with or without the subsidy, there are indications that two arguments hold true:
*
*
*
Municipalities with limited reserves of land zoned for multiple dwellings will not tend to benefit from the MURB subsidy. All other factors held constant, inelastic supplies of MURB land will result in the realization of windfall profits by landowners and the absence of any supply or affordability impacts as a result of the MURB program. (Gau, 1982)
A significant proportion of past MURB projects would have gone ahead without the subsidy. While it is difficult to estimate the proportion of MURBs not requiring the subsidy, it is generally accepted that in the past, this has accounted for a large number of projects. 71 The MURB ro ram's net im act on su 1 is much less than the total number of certified units. This is due to three factors: 1 many certified MURBs never went ahead; (2) construction of MURBs often resulted in demolition of existing affordable rental housing; and (3) a large proportion of MURBs will revert to condominium tenure once the tax benefits run out.
It would seem that MURBs have contributed somewhat to increased rental supply in some municipalities. There are indications, however, that a significant proportion of MURB subsidies were paid out (particularly in tight land markets in

46
TABLE 11
Comparison Between Average Market Rents and Rents Charged per New ARP Units, July, 1977
Average Average % Market Rents 1 ARP Rents2 Difference
Montreal $152 $298 96
Saint John 141 231 64
Toronto 243 320 32
Vancouver 233 264 13
l. Statistics Canada, July, 19 77. 2. CMHC Mortgage approval file, as at July, 1977.
Source: CMHC, Market Forecasts and Analysis Division, An Analysis of the Market Factors Behind the High ARP Default Experience, Ottawa, 1980, p. 7.

47
recent years), but provided only limited impact on the supply of rental housing.
C. Impacts on Affordability
It is difficult to separate the effects of MURB on supply and affordability. Some analysts argue that affordability programs are unnecessary since by increasing supply, all rents will automatically fall. Given the proliferation of "market imperfections" in the housing sector, however, this does not necessarily follow. Discussion of the impacts of MURB on rent levels can be structured around two themes: (1) which end of the market have MURB units tended to cater to? and (2) to what extent do renters in non-MURB units benefit from the tax subsidy?
As with data on supply, there is very little in the way of hard numbers on average rent levels charged by owners of MURB buildings. Some data are provided by CMHC (1980), again with respect to ARP units. As shown in Table 11, ARP rents in 1977 were between 13 and 9696 higher than average market rents for the sample municipalities. It should be noted that ARP units, unlike straight MURBs, had some (albeit ineffective) government-imposed controls over rent levels. MURBs, therefore, could rent out at higher levels still. Goring and Norbrega (1977) argue that "in most markets, even with assistance, rentals for ARP/MURBs are at the top end or above rentals from comparable existing rental properties.11 72
Janosik and Glassman (1978) note with respect to MURBs that "because the investment's attractiveness is based upon the ability to write off losses resulting from the application of the capital cost allowances against other income, the tendency has been for developments to be of a more expensive nature than they might otherwise be -- the greater the capital cost, the greater the depreciation." 73
Finally, it has been argued that (due to a number of factors) the most profitable segment of the rental market has been the luxury or upper end. Since MURBs are not targeted toward any specific income group, developers tend to gear their projects toward that segment of the market with the highest potential absorption and cashflow. Therefore, the vast majority of MURB projects cater to the high end of the rental market. What effects does this factor have on non-MURB, lower income renters?
Clayton argues that all tenants, whether in MURB or other projects, tend to benefit from the tax programs, since by increasing the supply of units in the upper end of the market, demand for lower end units is reduced (as higher income individuals substitute toward the now-cheaper MURB units) and rents fall. In addition, over time, MURBs will depreciate and "filter down" to lower income groups. This "filtering argument" is hotly debated in the housing literature. Generally, it is accepted or rejected on grounds of faith, rather than hard

48
evidence. It should be pointed out, however, that in tight rental markets where there is an excess of demand relative to supply, the injection of a subsidy into the high end of the market will not "filter down" to low income renters. This is due to the fact that, since supply is limited landlords can reap monopolistic returns and are not forced to reduce rents when a proportion of their market moves toward higher end stock (since they are guaranteed that a new group of tenants will be forced to pay similar levels of rent for the scarce housing units).
Two conclusions can be offered: it is impossible to support or refute the "filtering down" hypothesis (an integral part of the MURB program's rationale) on the basis of hard facts or evidence; if it is accepted, it must also be granted that in tight markets, benefits do not tend to "filter down" to low income households. At a minimum, therefore, it can be stated that:
*
*
*
MURB units are concentrated in the hi h end of the rental market. This results from two factors: 1 the CCA deduction encourages high end production; (2) in past years the greatest market potential has existed in the luxury end of the rental market.
The only way MURBs can be seen to benefit renters is if the analyst accepts the "filtering down hypothesis." This argument is largely untestable and must be accepted or rejected on grounds of faith.
In tight markets, MURB benefits do not get passed on to tenants. If supply is tight landlords can reap monopolistic profits and avoid passing on the MURB benefits to tenants.
D. Impacts on Housing Quality
Housing is not a "homogeneous good." While the above discussion has been focused at the level of "units," it is necessary to examine the qualitative aspects of the housing produced under the MURB program -- variables such as structure type, levels of maintenance, construction materials and marketability. Again, the data on these aspects of MURB projects are extremely limited.
With respect to structure type, A.E. LePage (1978) notes:
MURBs can be townhouses, semi-detached, high-rise or low-rise. The type of unit purchased will create differences in the prices paid. Price per unit depends on location, design, construction and size. Also prices vary if the unit is a condominium, rental or freehold. Normally condominium status or freehold status will mean larger units, more amenities and therefore higher costs than in strictly rental units. 74
MURBs have received criticism in the past because they tend to encourage "absentee landlordism." Syndicated investors, generally not skilled (or interested) in real estate matters are forced to hire third-party managers. Often this leads to

49
TABLE 12
Comparison of Benefits Claimed from MURB Deductions By "High Income Individuals" and All Others, 19 79
Per cent of Group Average amount for those Share of Item Reporting the Item Reporting the Item Reported by
High-Income High income All High income All Group Individuals Others Individuals Others
65.8% 5.3% 0.1% $12,795. $5,282
*"High income individuals" are those with total incomes over $50,000 in 1979.
Source: Canada, Department of Finance, Analysis of Federal Tax Expenditures for
Individuals, Ottawa, 1981, p. 19.

so
higher costs (which must be passed on to renters) and low standards of maintenance and management.75 In a brief discussing MURB-type tax shelters, the U.S. Joint Committee on Internal Revenue Taxation (1975) notes that "the owners have incentives ••• to invest, since the tax benefits are proportional to capital investment, but little incentive to manage the projects efficiently and maintain them." 76
E. Targeting and Delivery of MURB Subsidies
As noted in Chapter 1, tax expenditures are not suited to programs which require highly specific targeting mechanisms. MURBs, therefore, tend to be directed in a haphazard fashion to all municipalities (regardless of need) and all types of rental projects. This lack of targeting means that MURBs are incapable of being used as policy instruments intended to provide housing directly to special needs groups (e.g. seniors, the handicapped) or to direct municipal policy (e.g. encourage low income family housing in the core area). MURBs rely on the market to "filter down" benefits to these groups.
With respect to delivery, MURBs have the advantage that they are open-ended subsidies. This should result in relatively high levels of horizontal equity and certainty among investors. In effect, however, the on again-off again nature of the MURB program has done very little to instill investor confidence or provide stability in rental housing markets. Instead they have caused erratic fluctuations in the building cycle as investors try to get footings in before year end. Eger (1982) argues that the market confusion created by the constant changes in the MURB program made it extremely difficult for bureaucrats (CMHC, banks, appraisers, etc.) to assess fair market value. He also notes that:
If the technocrats had difficulty in estimating market rate of return, the problem for the tenant was magnified several hundred fold. The consumer of rental space (tenant) was supposed to be aided by lower rents as a result of these CCA write-offs. Charge abetted charge, costs followed non-comparable costs and the tenant paid for the complexity of regulation in higher rents, because of the inability of the regulatory boards to measure these changes. 77
F. Distribution of MURB Benefits
While the distribution of benefits from MURB subsidies has, to some extent, been discussed above, it is useful to summarize the various gains and losses incurred by each actor: broadly, the investor in the MURB, the developer/promoter, and the renter.

51
MURB Investors. In a perfect market, when MURB subsidies are first introduced there will be some initial profit-taking by the first series of investors. Over the long haul, however, more investors will enter the market until the after tax rates of return on MURBs equal those of other alternative investments. Two questions must be asked: (1) what is the extent of tax benefit claimed by MURB investors? and (2) to what extent do these benefits reflect the cost and risks assumed by investors?
Table 12 provides an answer to the first question. Based on the Department of Finance Tax Expenditure Accounts, the table shows that almost 66% of all MURB benefits were taken up by individuals with incomes over $50,000. In addition, the average tax benefit claimed by this group in 1979 was $12,795. This shows that the average MURB investor is in the upper end of the income range, and is receiving a sizeable government subsidy. This, however, is not the whole story; to examine the extent to which the investor benefits from the subsidy we must look at the cost of the investment.
Gau (1982) notes that, based on a 1980 sample of Vancouver MURBs, investors are not reaping high net rates of profit from their tax shelters. Instead, "MURB investors in this sample paid an average premium of $63,526 to acquire these investments, an amount equal to the present value of the future tax shelter benefits. 11 78 Not only is there evidence that MURBs did not provide greater returns than other investments, but the literature is also replete with arguments as to the high-risk nature of these tax shelters. 79 Whitelaw (1979) argues that the majority of syndicated MURBs are structured so as to force most of the risk on to the naive investor, and most of the subsidy on to the developer/promoter.80
It would seem, therefore, that many MURB investors do not obtain substantial benefits from the tax subsidy. Often, in fact, investors get stuck with failing MURB projects as a result of their inability to assess accurately either the tax or real estate risks inherent in the venture.
MURB Developer/Promoter. Fiber (1981) notes that "for many developers stuck with medium- to high-density land holdings, the (MURB) program brought not only immediate relief but a bonanza that was to last to the end of the decade. 1181 Clayton (1981) also notes that developer/promoters have, in the past, made considerable profits on the sale of MURB packages. This observation is based on two pieces of evidence: an examination of the asking prices in a sample of syndicated MURB prospectuses, and "the clamour from various industry lobbies for the reinstatement of the MURB provision in the 1980 Budget. 1182
Gau's arguments from above, however, must be recalled: If land markets are characterized by tight supply, then it is doubtful that developer/ promoters will benefit much from the MURB program, since the subsidy will be fully capitalized

52
into the prices charged by landowners.
One final point should be made. It seems logical that the MURB program would be of most benefit to large, vertically integrated development firms, since these are best able to absorb the fixed costs of setting up investment pools and syndicates. Large firms, with their in-house accounting, legal and administrative expertise, can supply the creative financial planning required to deal with the complexity of the MURB provisions.
Renters of MURB Units. Ideally, the MURB subsidy should result in increased supply which should ease the pressure on rents for tenants in MURB and non-MURB projects. As noted above, however, the extent to which this actually occurs is dependent on the degree of imperfection in the housing market. The observations provided by Gau (1982) on the Vancouver market indicate that, in some municipalities at least, the amount of subsidy which eventually reaches renters is limited at best. Given the tight land and rental housing markets characteristic of many municipalities, it seems fair to conclude that the MURB program may be less effective in delivering benefits to renters than is commonly supposed.
G. Administration of the MURB Program
As noted by a CMHC official: "the MURB program is ridiculously cheap and simple to administer ••• all we do is certify plans according to five or six simple criteria. The problem is not in administering -- the problem is control.11 83
The low administrative cost associated with the MURB program relates to the fact that: (1) no monitoring, budgeting or program appraisal is carried out; (2) no complex redistribution of funds is required -- government revenues are simply forgone and; (3) eligibility criteria are simple and require minimal amounts of interpretation (soft cost deductibility is a minor exception: Revenue Canada has been fairly active in interpreting and codifying the definition and rules for this provision84). It can be argued, therefore, that the MURB program, in terms of administration, was less expensive than a direct spending equivalent such as ARP.
When one considers the effectiveness of the MURB administrators, however, it is not surprising that this component of the program's cost was minimal. As noted above, no program monitoring function is carried out. The only available data consist of the annual number of MURB certificates issued by region. Information on the rents, structure type, tenure and location of these projects is simply not available.
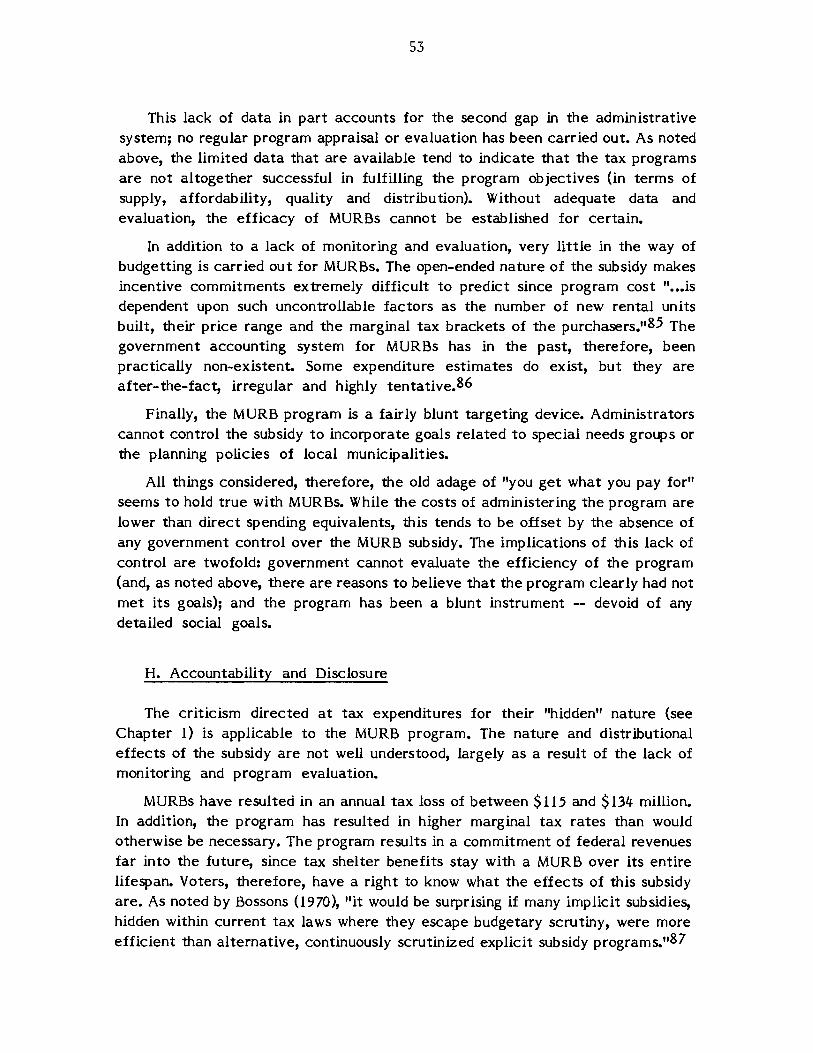
53
This lack of data in part accounts for the second gap in the administrative system; no regular program appraisal or evaluation has been carried out. As noted above, the limited data that are available tend to indicate that the tax programs are not altogether successful in fulfilling the program objectives (in terms of supply, affordability, quality and distribution). Without adequate data and evaluation, the efficacy of MURBs cannot be established for certain.
In addition to a lack of monitoring and evaluation, very little in the way of budgetting is carried out for MURBs. The open-ended nature of the subsidy makes incentive commitments extremely difficult to predict since program cost " ••• is dependent upon such uncontrollable factors as the number of new rental units built, their price range and the marginal tax brackets of the purchasers.11 85 The government accounting system for MURBs has in the past, therefore, been practically non-existent. Some expenditure estimates do exist, but they are after-the-fact, irregular and highly tentative.86
Finally, the MURB program is a fairly blunt targeting device. Administrators cannot control the subsidy to incorporate goals related to special needs groups or the planning policies of local municipalities.
All things considered, therefore, the old adage of "you get what you pay for" seems to hold true with MURBs. While the costs of administering the program are lower than direct spending equivalents, this tends to be offset by the absence of any government control over the MURB subsidy. The implications of this lack of control are twofold: government cannot evaluate the efficiency of the program (and, as noted above, there are reasons to believe that the program clearly had not met its goals); and the program has been a blunt instrument -- devoid of any detailed social goals.
H. Accountability and Disclosure
The criticism directed at tax expenditures for their "hidden" nature (see Chapter 1) is applicable to the MURB program. The nature and distributional effects of the subsidy are not well understood, largely as a result of the lack of monitoring and program evaluation.
MURBs have resulted in an annual tax loss of between $115 and $134 million. In addition, the program has resulted in higher marginal tax rates than would otherwise be necessary. The program results in a commitment of federal revenues far into the future, since tax shelter benefits stay with a MURB over its entire lifespan. Voters, therefore, have a right to know what the effects of this subsidy are. As noted by Bossons (1970), "it would be surprising if many implicit subsidies, hidden within current tax laws where they escape budgetary scrutiny, were more efficient than alternative, continuously scrutinized explicit subsidy programs. 1187
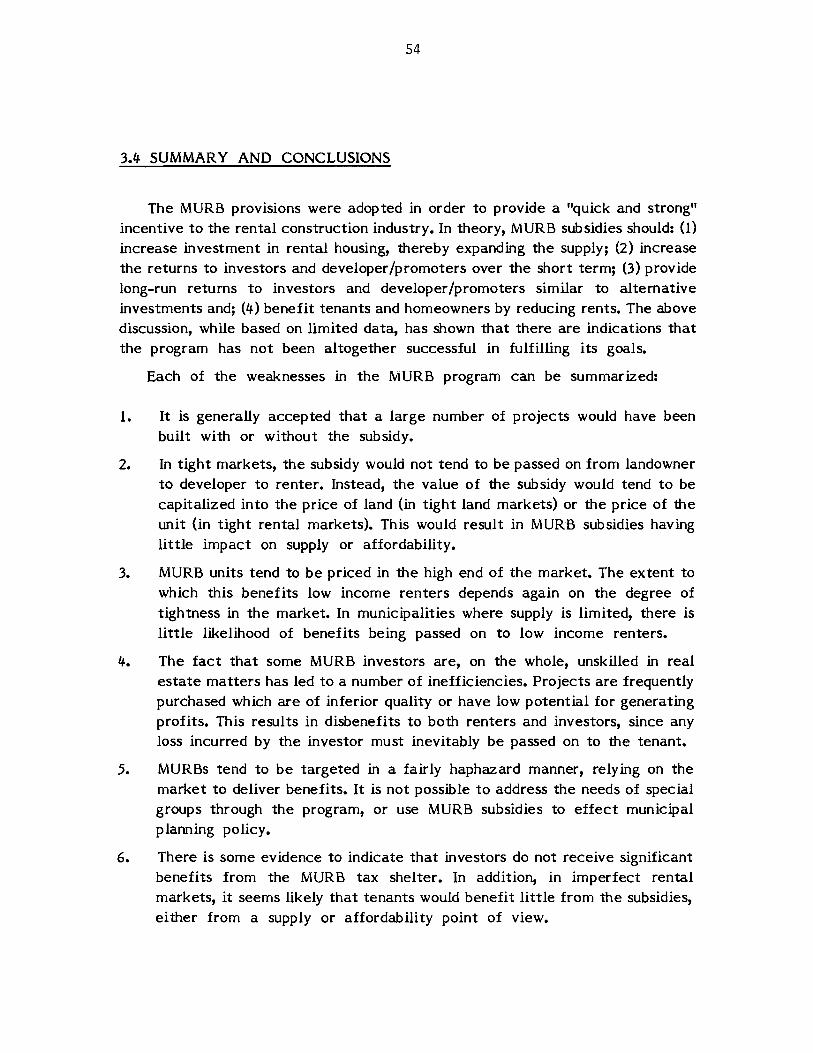
54
3.4 SUMMARY AND CONCLUSIONS
The MURB provisions were adopted in order to provide a "quick and strong" incentive to the rental construction industry. In theory, MURB subsidies should: (1)
increase investment in rental housing, thereby expanding the supply; (2) increase the returns to investors and developer/promoters over the short term; (3) provide long-run returns to investors and developer /promoters similar to alternative investments and; (4) benefit tenants and homeowners by reducing rents. The above discussion, while based on limited data, has shown that there are indications that the program has not been altogether successful in fulfilling its goals.
Each of the weaknesses in the MURB program can be summarized:
1. It is generally accepted that a large number of projects would have been built with or without the subsidy.
2. In tight markets, the subsidy would not tend to be passed on from landowner to developer to renter. Instead, the value of the subsidy would tend to be capitalized into the price of land (in tight land markets) or the price of the unit (in tight rental markets). This would result in MURB subsidies having little impact on supply or affordability.
3. MURB units tend to be priced in the high end of the market. The extent to which this benefits low income renters depends again on the degree of tightness in the market. In municipalities where supply is limited, there is little likelihood of benefits being passed on to low income renters.
4. The fact that some MURB investors are, on the whole, unskilled in real estate matters has led to a number of inefficiencies. Projects are frequently purchased which are of inferior quality or have low potential for generating profits. This results in disbenefits to both renters and investors, since any loss incurred by the investor must inevitably be passed on to the tenant.
5. MURBs tend to be targeted in a fairly haphazard manner, relying on the market to deliver benefits. It is not possible to address the needs of special groups through the program, or use MURB subsidies to effect municipal planning policy.
6. There is some evidence to indicate that investors do not receive significant benefits from the MURB tax shelter. In addition, in imperfect rental markets, it seems likely that tenants would benefit little from the subsidies, either from a supply or affordability point of view.

55
7. MURBs tend to be cheap to administer but offer extremely low levels of government control. The difficulties inherent in estimating the magnitude and impacts of MURBs would make the implementation of a monitoring-evaluation-budgeting and accounting system an expensive proposition. Building a significant amount of "control" into a MURB program, therefore, would tend to offset the cost advantages of the instrument.
8. As a result of the poor system of evaluation and control, MURBs tend to have relatively low levels of accountability associated with them. This factor detracts from voter awareness and program efficiency.
The degree of success attributed to the MURB program depends on the extent to which the benefits from the program were passed forward between producers and "filtered down" among renters and owners. In tight land markets, it seems unlikely that the MURB subsidy will be of much benefit to the housing industry. This is due to the fact that vendors of MURB land will fully or partially capitalize the value of the subsidy into the price they charge to the developers. In tight housing markets, developers and investors will tend to keep the full subsidy benefits, rather than passing them on to tenants.

56
Chapter 4
HOMEOWNERSHIP TAX INCENTIVES
4.1 BACKGROUND, RATIONALE AND PROGRAM STRUCTURE
The partial implementation of the Carter Commission's recommendations in 1972 resulted in the imposition of a capital gains tax, although the exemption of a taxpayer's principal residence resulted in two benefits to the homeowner.
Upon sale of the house, any profits or "capital gains" would be tax-free. This exemption can be regarded as a tax expenditure since it constitutes a departure from the benchmark criteria of neutrality and progressivity. Neutrality is violated since the exemption tends to favour investors in ownership housing over all others; progressivity, since housing accounts for a substantial proportion of an individual's net worth, and this amount is not taxed. Higher income individuals, with more expensive houses, benefit more from the provision than low income homeowners and renters. There can be no arguing, therefore, that the exemption of capital gains tax on principal residences constitutes a tax subsidy.
The second major homeownership tax expenditure is commonly referred to as the "exclusion of net imputed rental income." To illustrate this concept, it is necessary to consider the purchase of a home as an investment. An individual pays a certain amount in mortgage and maintenance charges to live in his home, in return receiving a roof over his head, or (to use the economists' terms) "a flow of housing services." According to the principles outlined in section 1.2, individuals should be taxed on that portion of their revenue which exceeds expenses. An investor in the stocks and bonds market is taxed on the dividends received. For housing, however, the imputed revenue (equal to the market rental value of the property minus the expenses of ownership) is tax free. There is, however, some discussion in the taxation literature as to whether this exemption constitutes a tax expenditure.
Analysts who are in favour of this identification tend to see the exemption as a clear violation of the benchmark principles of neutrality and progressivity since: (1) it differentiates between individuals on the basis of whether they invest in ownership or rental housing; and (2) the tax benefit tends to favour upper income earners, since this group is characterized by a higher incidence of home ownership, and since the tax benefits from the exemption tend to increase as an individual's marginal tax rate increases.

57
Proponents of omitting the exemption from the accounts tend to put foward a number of arguments. Most common is the view that homeownership is best seen as a ''personal expense," which has always been beyond the realm of taxation in Canada. R.S. Smith (1979) summarizes the rationale behind this:
Tax expenditures are to be a deviation from some normative tax structure. Income under a normative income tax structure is generally taken to be consumption plus any change in net worth over a period of time. Yet it has long been recognized that income differs from ability to pay, and any normative structure must allow for basic living costs of the taxpayer and his dependents. More specifically, it might be viewed as appropriate to allow for that which is required to maintain a family in housing, nourishment, and for certain other amenities which are compatible with reasonable health for the family and educational opportunities for the children.88
This argument is, in principle at least, a sound one; taxing the benefits arising from putting a roof over one's head clearly constitutes a violation of generally accepted conventions. Ideally, therefore, there would be no taxation of net imputed rent for homeowners, and measures would be taken to ensure that renters receive similar treatment. In reality, however, this is beyond the realm of administrative feasibility.
A second argument is often made against the classification of this exemption as a tax expenditure. As noted by L.B. Smith (1981) the costs to government of allowing the exemption may not be substantially greater than adopting a more "neutral" practice whereby homeowners would be taxed on imputed rent less all expenses incurred in the acquisition and upkeep of their residence:
To be equivalent with other investments, all expenses incurred in obtaining imputed gross rent, including capital cost allowance, should be deductible in determining net rent. Once this is recognized ••• the case for taxing imputed rent is not as clear.89
In order to address this legitimate comment, the estimates used in this paper consider only the equity component of homeownership (thereby assuming deductibility of mortgage interest).
Another, final, argument against inclusion relates to the administrative feasibility of imposing a tax upon net imputed rent, many analysts arguing that this would not be feasible due to problems of definition and measurement. The Carter Commission recommended that, ''because of the administrative difficulty of properly and equitably determining the amount of net gain, we suggest that imputed rent continue to be omitted from the tax base. 1190 In his detailed study of Canadian tax expenditures, however, R.S. Smith (1979) argues that these administrative obstacles are by no means insurmountable. Strong arguments can be made, therefore, to include the non-taxation of net imputed rent in the tax expenditure accounts.

58
TABLE 13
Estimated Federal Tax Expenditures Resulting From Homeownership Tax Preferences, Canada, 1976-1980*
Estimated value (millions) Provision 1976 1977 1978 1979
1. Non-taxation of capital gains on principal residence (assuming full taxation) 3, 150 3, 100 2,950 3,000
2. Non-taxation of capital gains (assuming taxation of 50%) 1'575 1,550 1,475 1, 500
3. Non-taxation of imputed rent on owner-occupied dwellings 1,203 1, 236 1, 466 1, 750
Total (1 + 3) 4,353 4,336 4,056 4,750
1980
3,500
1, 750
2,188
5,688
Source: modified after: Canada, Department of Finance, Government of Canada Tax Expenditure Account (Ottawa: December, 1980), 22 (see Appendix II).
* For explanation of these estimates, see Appendix II.

59
The official rationale behind the implementation of these two homeownership exemptions is contained in the 1969 Federal Government's white paper, Proposal for Tax Reform:
If a Canadian sells his home for more than he paid for it, he has realized a capital gain. As a result he is better off than a neighbour who has been a tenant. Nevertheless, the government does not feel that it would be appropriate to treat the homeowner's tax gain as ordinary income. Homeownership is part of the Canadian way of life, and within reasonable limits the profits on the sale of a principal residence should be treated as a recovery of personal expenses of the homeowner.91
This granting of a privileged status to homeownership is widely recognized in the literature. Wragge and Bartel (1981) note that: "homeownership is a Canadian tradition. What started from a basic desire for homesteading by early settlers has gradually evolved to a point where it is viewed by many as a basic right. Indeed society's perception ••• has shifted from viewing housing as a normal consumption good constrained by the usual income and price considerations, to being virtually a public good to be made available to one and all. 1192 The other factor explaining the Government's introduction of these homeownership subsidies is that homeowners constitute a large and effective block of voters (accounting for about 60% of all Canadians).
The November 1981 Budget Proposals had only one significant impact on these provisions: the opportunity for married couples to arrange a double principal residence capital gains exemption was repealed for dispositions after 1981. Starting in 1982, only one residence per family will qualify for the exemption.
A third type of tax subsidy for homeowners was introduced in 19 74: the Registered Home Ownership Savings Plan (RHOSP). RHOSPs were introduced during a period of high inflation in housing prices (between 1970 and 1974, consumer prices increased on average 28.7%, while average house prices rose by 75.6%93). The May 1974 Budget recognized the impact of inflation on "the cost of housing and the ability of the average Canadian, particularly young people and people of modest income, to meet their housing needs. 1194 RHOSP was, therefore, introduced "to ease both supply and cost aspects of the problem," and offset "the formidable difficulties facing our young people in accumulating the savings required for a down payment on a home and its initial furnishing. 1195 In addition, the RHOSP was intended to encourage young homebuyers to defer the purchase of a home, thereby temporarily "helping to reduce current pressures on housing prices. 1196 RHOSP was:

60
* Targeted toward young, first time homebuyers with "modest incomes."
* Intended to defer housing demand, thereby reducing speculative pressure on the market.
* Aimed at increasing the supply and affordability of ownership housing.
RHOSPs were developed by the Department of Finance and modelled after the Registered Retirement Savings Plan. The program enables any taxpayer over eighteen years of age, who does not currently own a home, to contribute a maximum of $1,000 per year to a RHOSP fund. The fund can contain a maximum of $10,000 and can be kept open for twenty years. If the fund is used to purchase a home, the withdrawal is tax free. If, upon withdrawal, the fund is not used to purchase a house within sixty days, the money becomes taxable (although there have been a number of manoeuvres available to investors to defer exposure to tax upon withdrawal -- see below). An individual cannot assign his/her plan to another party, may have only one RHOSP per lifetime and must collapse the fund within 20 years. No partial withdrawal of funds is permitted.
4.2 IMPACTS OF CAPITAL GAINS AND IMPUTED RENT EXEMPTIONS
A. Expenditure/Cost of Homeownership Exemptions
Fulton (1981) notes that estimating the revenue losses ansmg from homeowner tax incentives (particularly the imputed rent exemption) is an arduous task. As a result, the literature contains a fairly wide range of these estimates.97 For consistency, however, Table 13 provides data based on modified Department of Finance figures. These exemptions account for extremely substantial federal revenue losses ($5.7 billion in 1980). \\-ith respect to federal expenditure on housing policy, these two exemptions accounted for about 78 per cent of the 1980 Federal expenditure on housing (see Appendix III for data). Subsidies of this magnitude necessarily require an across-the-board increase in marginal tax rates or increased federal borrowing to make up for lost revenues.
B. Impacts on Housing Markets
The substantial subsidies provided to homeowners by capital gains tax and imputed rent exemptions should, over the short term, increase the attractiveness of ownership over rental housing. Over the long run, as more renters substitute toward the cheaper ownership stock, pr ices should rise as demand quickens. The

61
net long-run effect of the subsidies, therefore, should be to cause an increase in the number of homeowners and a decrease in the number of renters. The resultant slackening of demand for rental tenure should cause rents to fall over the short run and over the long run adjust so that they equalize with the after-tax costs of ownership. In a perfect market, therefore, tax concessions for homeownership would benefit both owners and renters. In the real world, however, where there is often a tight supply of rental housing, there will be no long-run equalization of costs between ownership and rental markets.
One more piece of information must be added to this simple theory; both the capital gains and imputed rent exemptions tend to be inherently regressive, since benefits increase with the level of housing "consumed." Given this fact, it can be argued that higher subsidies will be granted to purchasers of "high end," or luxury stock.
Finally, the relationship between homeownership and inflation should be considered. Homeownership has traditionally been used as a "hedge" against inflation; this factor is pointed out by Zimmer (1981):
Possibly the best investment that any of us can make is to buy our own home •••• If nothing else, high inflation has created a tremendous increase in residential property values in many parts of the country.98
Bossons (1981) has argued that the capital gains exemption has been a partial causal factor in the inflation of real house prices which occurred during the 1970s. Since other assets are subject to capital gains tax, the attractiveness of housing as an investment increases, particularly during periods of inflation (since when inflation rises, higher nominal gains on assets held by investors are subject to capital gains tax). Therefor.e, demand rises and house prices increase as investors seek to avoid the rising margin of capital gains tax on other investments. Existing homeowners experience substantial capital gains and potential homebuyers find the opportunity of purchasing moving out of reach.99
No detailed evaluation of the effects of these tax subsidies on housing markets is presently available. The discussion below, therefore, must be carried out at a fairly general, descriptive level. The expected impacts on supply, affordability and quality will be summarized below.
Supply. Homeowner tax preferences should cause an increased demand for ownership housing (in response to the subsidy). This should result in an expanded supply of ownership stock, and a slower rate of growth in rental stock. There are exceptions to this theory, however. In ownership markets where supply is limited (and, therefore, inelastic), vendors will tend to fully capitalize the subsidy value into their selling prices, and not pass it on to home buyers. This will result in the

62
tax subsidy having limited impact, with the exception of providing windfall profits to anyone selling a home who does not have to buy back into the market (e.g. developers of new housing).
Affordability. As noted above, in the absence of market imperfections, tax preferences should provide a substantial subsidy to homeowners. Fulton (1980) has estimated that the imputed rent and capital gains exemptions resulted in an effective 20% price reduction for the average homeowner, when they were introduced in 1971.100 Clayton (1974) estimates that, for a taxpayer in the 31% marginal tax rate, the implicit price reduction caused by the exemption of imputed rent alone was 18%.101 For individuals with higher tax rates, this subsidy would be much higher.
Synopsis: Supply and Affordability. While no estimates are currently available on the number of housing units produced as a direct result of the subsidies, a number of general inferences can be made: First, as noted above, the exemptions tend dramatically to increase the attractiveness of homeownership over rental and other investments (e.g. stocks and bonds), particularly during periods of high inflation. This factor should result in a substantially higher number of ownership units being produced (assuming supply is somewhat inelastic).
Secondly, in "pure" housing markets (i.e. where there is perfect substitutability between ownership and rental housing, and where markets are in a state of "clearance" when the subsidy comes into effect; that is, where supply equals demand for each submarket), benefits from the subsidies will be felt by tenants as demand for rental units falls off and rents fall. I 02 In the real wor Id, however, tight rental markets often prevent any transfer of subsidy benefits to renters.
The main effects of the subsidies, therefore, should be to decrease the cost of homeownership in the short run, and (if sufficient demand exists) result in a long-run increase in the production and consumption of ownership housing. This trend will be particularly noticeable in the luxury or high end stock, since benefits accruing to upper income earners are greatest.
A similar argument can be made with respect to the quality of housing produced. The exemptions tend to increase the amount of housing which individuals can afford to "consume." As a result, taxpayers will tend to upgrade their accommodation either by purchasing a larger unit or a higher quality unit (or reducing their debt on current dwellings). Again, the largest amount of subsidy benefit is enjoyed by upper income groups. It can be inferred that this group will tend to increase its demand for better quality housing the most, particularly during periods of high inflation.

63
Table 14
Average Benefits from Imputed Rent and Capital Gains Tax Exemptions, Canada, 1978
% of Total Tax Filers Average Benefits Benefits as % Income Group 1 in Group per Tax Filer ($) of Total Income
Under 5,000 31 32 1. 7
5,000- 10,000 22 171 2.3
10,000- 15,000 18 314 2.6
15,000- 20,000 13 619 3.6
20,000- 25,000 8 964 4.4
25,000- 30,000 4 1,312 4.8
30,000- 50,000 4 1,994 5.5
50,000-100,000 3,670 5.6
100,000 and over 2 6 '753 3.4
All Groups (average) 458 3.9
1. Refers to total income before deductions.
Source: Canada, Department of Finance, Analysis of Federal Tax Expenditures for Individuals, Nov. 1981, pp. 12-13.

64
C. Targeting and Delivery
Both exemptions tend to be very crude in terms of targetting and delivery: The eligible group is extremely broad (anyone who owns a house) and the benefits are not calculated according to individual needs.
Some analysts have argued that these exemptions are inefficient, since they are regressive and do not provide the majority of benefits to those most in need.103 In light of the programs' broad goals, however ("to increase homeownership"), this cannot, on strictly objective grounds, be termed a weakness.
D. Distribution of Benefits
Some work has been done in evaluating the redistributive effects of these programs on income and age groups. In addition, some general remarks can be made about the distribution of benefits between owners and renters.
With respect to income, the regressive nature of these exclusions has already been pointed out as due to the fact that benefits tend to increase as income rises.
Table 14 shows the general regressiveness of the exemptions by the fact that the average benefit received by a taxpayer earning over $100,000 is over two hundred times that of the average benefit accruing to a taxpayer in the under $5,000 group. Second, it can be seen that average benefits as a percentage of income tend to taper off for those earning over $100,000. It can be assumed that this is due to these taxpayers' "diminishing marginal utility" for housing; that is, over a certain income limit, individuals tend to "consume" similar levels of housing.
With respect to age, Fallis (1981), in an analysis of 1971 Ontario tax expenditures, concludes that the exemptions benefit older taxpayers at the expense of the young.104 Smith (1981) attributes this trend to the fact that the imputed rent exemption tends to favour taxpayers with the greatest amounts of equity in a house, and who have owned the dwelling for the longest time.105
As noted, during periods of heavy inflation, the effects of the exemptions in favouring older, upper income homeowners tend to be multiplied. Fulton (1981) notes that homeownership tax subsidies were partially to blame for the dramatic rise in house prices which occurred during the early seventies.106 It should be pointed out again, however, that many analysts have argued that lower income renters should also be the eventual beneficiaries of homeowner tax preferences, through the subsidy benefits eventually "filtering down" to all households. This, of course, will only occur in "perfect" housing markets.

65
TABLE 15
Estimated Federal Tax Expenditures Associated with the RHOSP (Canada, 1976-1980)
1976 1977 1978 1979 1980
105 94 92 95 95
Source: Canada, Department of Finance, Government of Canada Tax Expenditure Account, December, 1980, p. 22.

66
E. Administration and Control
Most of the comments made with respect to administration and control of tax expenditures in general tend to apply to the homeowner exemptions, which also require extremely small proportions of administrative overhead. Subsidy benefits, therefore, tend to be large relative to the costs of administration.
As with other tax expenditures, however, these exemptions suffer from a serious lack of control. Targeting tends to be blunt and incapable of delivering benefits on the basis of individual needs. Monitoring and budgeting is not carried out on a regular basis. In addition, any attempt to build in program control functions would tend to dramatically increase the costs of administration, since the exemptions are extremely difficult to estimate and predict.107
F. Accountability and Disclosure
Again, the homeowner exemptions tend to be characterized by low levels of accountability. Since about 60 per cent of Canadian taxpayers are homeowners (Fulton, 1981), the majority of voters tend to benefit somewhat from these subsidies. As Runge, et al. (1975) point out, however, the majority of voters do not comprehend the full redistributive impact of these tax preferences:
Tax exemptions ••• act to reduce the progressivity of the income tax in general. The ordinary taxpayer, not realizing this effect, is happy to see the tax reduced, and therefore tax exemptions are a popular form -- even though the remaining tax burden is redistributed over the whole taxpaying population, to the disadvantage of lower-income tax payers.I 08
There is clearly a need, therefore, for regular accounting of these programs in combination with an analysis of their redistributive impacts.
4.3 IMPACTS OF THE RHOSP PROGRAM
A. Expenditure/Cost of RHOSP Program
Estimates of federal tax expenditures associated with the RHOSP program are presented in Table 15. Real expenditures tend to fall off after 1977, which can be attributed to falling rates of take-up after eligibility criteria were tightened in 1977, and as inflation/interest rates rose through the late 70s. These factors will be discussed below.

67
B. Impact on Housing Markets
The RHOSP program had three related aims: (1) to benefit young, first time homebuyers with modest incomes; (2) to increase the supply of ownership housing; and (3) to defer housing demand into the future when there is, hopefully, less inflationary pressure on the market.
Fulton (1981) summarizes the impacts which the Plan has had on housing markets: "If anything, it will have increased the demand for housing services, but the timing of the increase is not obvious. 11 109 Wragge and Bartel (1981) tend to agree that RHOSP has been successful in increasing the effective demand for ownership housing, but has had negligible impact on encouraging homebuyers to defer their purchase.
In past years, potential home buyers have been able to obtain significant subsidies through the RHOSP. If the maximum contribution is used and the taxpayer has a marginal tax rate of 25%, the annual tax reduction is $250. This can be viewed as a grant if used to purchase a home. Over the lifetime of the plan the grant portion can total over $3,200, assuming an interest rate of only 5% (Fallis, 1980). The subsidy can be used by individuals to either purchase a higher priced home, or reduce the mortgage-to-value ratio. The RHOSP, therefore, can be seen as providing increased purchasing power to beneficiaries, which should result in heightened demand for ownership housing. Unless supply is tight (and therefore, inelastic), this should translate into a net increase in supply and/or quality of the housing stock. In theory then, RHOSP should result in an increased incidence of homeownership among beneficiaries, increased supply and more affordable housing. Two factors, however, tend to limit the effectiveness of the Plan in achieving its goals.
First, as noted by Wragge and Bartel (1981), high inflation and interest rates have tended to undermine the effectiveness of the subsidy. Between 1975 and 1980, house prices have increased by 4 7-56%. Incomes, at the same time, have increased only 21 %.110 RHOSP contributions, therefore, each year can make a proportionately smaller contribution towards savings for homeownership. For example, in absolute terms, "the nominal per capita contributions in 19 78 would only be worth $748 in 1975 dollars. 11 111 Fulton (1981) notes that RHOSP "may actually end up penalizing potential homeowners instead of benef itting them if, while they defer a house purchase to gain the tax savings, the rate of house price inflation outstrips the rate of growth of tax savings. 11 112 The effects of inflation, therefore, have tended to reduce the effectiveness of RHOSPs in increasing effective levels of demand for ownership housing.

68
A second factor which has tended to undermine the efficiency of the Plan is the relatively high proportion of speculative or unintended effects associated with RHOSPs before the 19 78 amendments. Prior to this time RHOSPs were characterized by an unusually high level of takeup among individuals in upper income brackets and older age groups. Upper income groups were attracted to RHOSPs since benefits tend to increase with the individual's marginal tax rate. While this group should have been "screened out" of RHOSP benefits by the fact that most upper income taxpayers already own a home, a number of loopholes enabled them to take advantage of the program:
*
*
*
RHOSP could be used as a retirement savings program. Since, prior to 1978, RHOSPs could be kept open indefinitely and rolled over into a Registered Retirement Savings Plan individuals could use the program to accumulate a $10,000 tax free fund to be used upon retirement. This loophole attracted both older and higher income groups to the plan.
RHOSP could be used by a spouse. Married individuals could circumvent the "first time homebuyer" criterion by putting the home in the spouse's name so that the other member could contribute to a RHOSP. When the fund matured, the contributor could then use the tax free fund to "purchase" the family home back from the spouse. In this way, a family could increase their equity in a home with the government-subsidized fund.
Other investment manoeuvres. RHOSPs could be built up, then rolled over into an Income Averaging Annuity Certificate (IAAC) which spread the taxable proceeds of the fund farther into the future (this provision was removed in the November 1981 Budget); RHOSPs could be used to defer tax into future years when an individual's income (and marginal tax rate) is lower. This strategy would only be. available to individuals who are twenty years away from retirement, who do not own a home.113
The 19 77 Budget enacted amendments to the RHOSP which effectively closed the majority of these loopholes. This move reduced the take-up rates among higher income groups and older age cohorts, and therefore constituted "a significant improvement ••• in retargetting the program towards those that it was intended for. 11 114
In summary, the desired impacts of the RHOSP on housing markets have been, to some extent, reduced by high rates of inflation and (prior to 1978), significant utilization of the Plan as a tax avoidance tool by higher income and older individuals.
The second goal of the RHOSP program was to take some of the speculative pressure off housing markets in the early 70s by encouraging first time homebuyers to defer their purchases into future years. It was assumed that high rates of house price inflation were to be a short-run phenomenon, and that it

69
TABLE 16
Annual RHOSP Contribution by Income Class As a Percentage of Total RHOSP Contributions, Canada, 197.5-1978
% Change Income Classes 1975 1976 1977 1978 1978/75
5,000 5.0 3.5 2.9 2.8 -45. 1
5,000 -10,000 29.8 23.7 14.7 16.8 -43.4
10,000-15,000 34.9 33.6 31. 1 28.1 -19.6
15,000-20,000 16.2 21.5 24.6 27.8 +71.8
20,000-25,000 6.6 8.4 11 • 1 13. 4 +103.3
25 ,000-30 '000 2.9 4.0 4.9 5.7 +94.4
30, 000-40' 000 2.2 2.5 3.4 3.6 +66.5
40,000-50,000 1. 0 1. 2 1.0 1. 0
50,000+ 1. 5 1. 6 1. 4 0.9 -61.9
Total $ ('000) 384,186 487,957 475 '736 478,405
Source: Revenue Canada, Taxation Statistics, in Wragge and Bartel, An Evaluation of the Registered Home Ownership Savings Plan, Ottawa, 1981, pl4.

70
would be beneficial to individuals to defer their purchases to a later date when demand (and prices) were lower.
Inflation, however, has continued to be a factor in most Canadian housing markets. The effects of the RHOSP, therefore, has been to cause a deferral of demand into a new period of inflation. In addition, the subsidy tends to fuel inflation since, over the long run, it encourages individuals to spend more on housing.
In addition, Wragge and Bartel (1981) note that the actual extent to which RHOSPs did cause individuals to defer their housing purchases may, in fact, be limited:
Over the long-run ••• the program will not only cause individuals to defer homeownership, but will actually bring the purchase decision forward in time. This is explained simply by the fact that, given that individuals are target savers, they will achieve their savings goal in less time through the use of an RHOSP) 15
C. Distributional Factors
Having discussed the extent to which RHOSPs deferred housing demand and increased the supply and affordability of ownership housing, this section addresses the program's capability to deliver benefits to "young, first time homeowners with modest incomes."
Table 16 shows the annual contributions to the Plan by income group. Care must be taken when interpreting the table since individuals' nominal incomes may rise due to inflation (thereby artificially moving lower income groups into higher classes). Two trends can be observed:
* The majority of RHOSP contributors are in the under $25,000 income ~· In every year shown, this group constitutes the majority of contributions, ranging from about 93% in 1975 down to 89% in 1978.
* Nevertheless a si nificant ro ortion of contributions are made b individuals earnin over 30 000. The incidence of homeownership in this group tends to be as high as 90%. It seems odd, therefore, that 5-6% of all contributions came from this group. Wragge and Bartel (1981) conclude that "this evidence suggests that not all RHOSP savings were destined to be invested in homeownership, rather some of the savings were being used for tax avoidance purposes." An examination of take-up rates shows that, while higher income groups tend to participate less in the Plan after the 1977 reforms, the tax avoidance element is still present.116

Age Groups
20
20 - 24
25 29
30 34
35 - 39
40 - 44
45 - 49
50 - 54
55 - 59
60 - 64
65+
71
TABLE 17
Annual RHOSP Contribution by Age Group As a Percentage of Total Income in Each Age Group,
Canada, 1975-1978
1975 1976 1977 1978
0.20 0.24 0.22 0.18
0.71 0.89 0.80 0.80
0.82 0.93 o.88 o.84
o.4o o.45 o.42 0.37
0.24 0.29 0.22 0.20
o. 15 0.18 o. 15 o. 10
0.14 0.16 0.12 0.09
0.14 o. 14 0.10 0.08
0.15 0.15 o. 12 0.01
0.13 0. 14 0.09 0.01
0.04 0.05 0.05 0.03
% Change 1978/75
- 9.7
+12.2
- 1.8
- 8.0
-18.0
-29.2
-34.3
-39.3
-48.7
-48 .9
-36. 3
Source: Revenue Canada, Taxation Statistics, in Wragge and Bartel, An Evaluation of the Registered Home Ownership Savings Plan, Ottawa, 1981, p. 13.

72
* Low income individuals do not receive as great benefits as middle income earners. As shown in the table, the proportion of contributions made by individuals earning less than $10,000 is low and constantly decreasing. Frazer (1979) attributes this trend to the fact that the average low income earner must spend up to 96% of their income on current consumption and taxes. Members of this group cannot afford to set aside any portion of their income for long-term savings.117
In terms of income, therefore, three conclusions can be drawn: (1) RHOSPs tend to concentrate the majority of benefits in the middle income (less than $25,000) range; (2) evidence indicates that a significant number of upper income earners use the Plan for tax avoidance purposes, even after the 1978 reforms and; (3) low income earners do not benefit from the Plan.
Table 17 shows that the majority of participants in the RHOSP program ( 79% in 1978) are in the 20-34 age groups. The Plan has, therefore, fulfilled one of its objectives; that is, to assist young potential homeowners during periods of high inflation.
Similar to the discussion on income, however, a second trend can be observed. In 1978 individuals aged 40 and over made almost 13% of all contributions.118 Given the high incidence of homeownership in this cohort, it would seem likely that this group is using RHOSPs for tax avoidance purposes.
In terms of age and income, therefore, it can be concluded that the majority of RHOSP benefits tend to be targeted toward young, middle income homebuyers. Secondly, it can be argued that RHOSPs are of little benefit to low income groups, since they are unable to accumulate sufficient savings and since their tax rates are lower, thereby offering them lower tax subsidies. Finally, it would seem that, in spite of the 1977 reforms, a significant number of older, high income groups continue to use the program for unintended, tax avoidance purposes.
The previous discussion regarding the effects of inflation on RHOSP subsidies should be recalled in order to gain a full appreciation of the benefits resulting from the Plan. While in the past the program has had a strong take-up (about 385,000 individuals contributed in 1975 and about 505,000 in 1978),119 there are indications that it is declining in popularity. This can be interpreted as largely a result of fixed contribution ceilings and high rates of inflation (which tend to continually erode the "real" value of the subsidy). The RHOSP program is inherently regressive, although since the Plan is restricted to individuals not owning a home, it tends to be geared primarily toward young, middle income first time homebuyers. RHOSPs are of little benefit to lower income groups and of only limited benefit to older and upper income taxpayers.

73
D. Targeting and Delivery
The post-1978 version of the RHOSP tends to be fairly efficient in delivering benefits to the target group. Taxpayers are fairly effectively "screened" on the basis of age (since most first time homebuyers are under 34), income (high income groups tend already to be homeowners and low income groups cannot substantially benefit from tax savings since their tax rates are lower), and use of the subsidy (the fund is specifically "earmarked" for use on ownership housing).
E. Administration and Control
RHOSP provides a good example of the administrative difficulties inherent in any tax expenditure. The unpredictable nature of the program resulted in a significant amount of ''hindsight evaluation"; that is, the program was implemented, then Revenue Canada observed how it was being used and proceeded to "iron out the wrinkles." The problem with this type of program administration is that it requires a significant trial period during which time substantial government revenue losses are incurred as a result of unintended effects. The ways in which RHOSP has been used for tax avoidance purposes by upper income individuals provides an example of the inefficiencies which arise while a tax subsidy is being "broken in."
A second weakness is also illustrated in the RHOSP: The plan was developed almost entirely by the Department of Finance in the early 70s. This raises some questions about the role of tax planners versus housing analysts. CMHC was hardly informed about the Plan until it was announced in the 1974 Budget. At a minimum, it would seem that any proposed tax expenditure should be developed jointly by the Department of Finance and the responsible Ministry or Crown Corporation. This would ensure that tax policies are well integrated into existing housing policies.
F. Accountability and Disclosure
Some estimates have been carried out as to the level of government expenditure associated with RHOSPsl20 and the rough redistributive effects.121 In general, however, the comments pertaining to the relatively low levels of administration, control, accountability and disclosure involved in tax expenditures tend to apply to the RHOSP program.

74
TABLE 18
Comparison of Annual Federal Tax Expenditures Relating to Rental and Ownership Housing, Canada, 1976-1981
($ million) 1976 1977 1978 1979 1980
Rental
MURE provision1 n/a n/a 49 61 65
CCA Accelerated Depreciation1 95 95 95 95 95
Soft Cost Deductibility1 n/a n/a n/a 65 110
1981
67
95
116
Total 221 270 278
Ownership
Capital Gains Exemption2 3, 150 3, 100 2,950 3,000 3,500
Imputed Rent Exemption2 1, 203 1, 236 1, 466 1,750 2, 183
RHOSP2 105 94 92 95 95
Total 4,458 4,430 4,508 4,845 5,783
Sources:
1. Clayton Research Associates, Tax Expenditures -- Housing, Ottawa: CMHC, 1981, p. v. 2. Canada, Department of Finance, Government of Canada Tax Expenditures Account, December, 1980, p. 22.

75
TABLE 19
Rough Estimates of Federal Expenditures Relating to Ownership, Rental and Social Housing
$ million % total
Ownership 5,840.7 80. 0
Rental 318.0 4.4
Social Housing 395.9 5.4
Other 742.4 10.2
Total 7,297.0 100.0
Source: Based on data from Appendix III.

76
4.4 IMPLICATIONS OF HOMEOWNERSHIP TAX PREFERENCES
The above discussion has identified levels of annual expenditure on ownership and rental housing tax subsidies, summarized in Table 18. In 1979 and 1980, the Federal Government spent over twenty times as much on ownership-related tax expenditures as on rental tax subsidies. When direct spending and regulation (i.e. rent-control) is also considered the difference becomes even more pronounced.
Table 19 shows the breakdown of 1980 Federal housing expenditures by tenure type. As can be observed, homeownership programs (of which the tax exemptions on capital gains and imputed rent constitute the largest part) account for over 80% of the total 1980 annual federal housing expenditure. As noted above, the long-run effect of these programs should be to cause an increase in the number of households owning their home. However, since by far the majority of tax expenditure direct benefits tend to be taken up by upper income individuals, the question must be asked: "To what extent do low income renters benefit from ownership related tax subsidies?"
Some analysts have argued that low income households do benefit from the addition of subsidized housing to the "high end" of the housing stock. Proponents of this view see benefits being transmitted to lower income groups through the "filtering process."
Stated simply, the filtering process views the housing market as analogous to a ladder. The addition of stock at the higher value levels, for middle and upper income groups, causes these groups to climb up a rung and occupy the new stock. The rung/stock that is left vacant is then occupied by lower income groups who move up and also leave a rung/unit vacant. The addition of cheaper housing at the top end of the ladder is seen to allow everyone to move up a rung, and thereby improve their housing condition. Advocates of "filtering" policies argue, therefore, that as long as the rate at which existing stock is filtering down (or depreciating) is lower than the rate of new construction, then lower income households' housing situations will improve.
A review of the debate over whether the "filtering process" actually occurs is beyond the scope of this paper. It is useful, however, to identify three common criticisms of the concept:
* Housing does not filter down. Bourne (1981) notes that "the principal criticism of filtering in housing, from a normative point of view, is precisely that housing, at least housing of reasonable quality does not filter-down to those of lower income. Either it is not available, because it is still occupied by middle- and upper-income households, or it may be converted to other uses (such as offices) or some other forms of tenure (multi-family rental) for investment purposes. In

77
some cases it is demolished for roads, commercial redevelopment or parking. Or, even if it becomes available, restrictions on access to housing, in terms of the lack of mortgage availability, high rents or discrimination, may prevent the household from occupying such units.122
* If housing does filter down it is of low quality. Some analysts have argued that for housing to filter down, it must be of low quality or in a neighbourhood which has become undesirable. Lowry (1960) notes that the decline in housing quality through filtering burdens low-income occupants with long-overdue maintenance costs which they often cannot afford.123
* The spinoff benefits from construction of low income housing are not much different from upper income housing. Some authors argue that it is more efficient to provide housing at the high end of the market since these projects tend to offer the greatest multiplier effects to the local economy (e.g. employment, etc.). Downs (19 75), however, argues that there is minimal difference between the spinoffs from low income projects and upper income projects.124
The extent to which lower income groups benefit from subsidized housing at the high end of the market, therefore, is debatable. In tight markets (characterized by inelastic supply), advocates for and against "filtering-down policies" would agree that benefits do not reach lower income households.

78
Chapter 5
OTHER HOUSING-RELATED TAX EXPENDITURES
This study has been primarily concerned with tax expenditures which relate to either ownership or rental housing. In order to be comprehensive, this chapter reviews a number of tax subsidies which apply to housing developments in general:
1. Deductibility of interest charges on land 2. Sales and excise tax subsidies 3. Deductibility of interest used for investment purposes 4-. Other tax expenditures.
5.1 DEDUCTIBILITY OF INTEREST ON LAND
A. Background and Rationale
Prior to 19 74-, developers had been allowed to deduct interest payments on funds borrowed to acquire or develop land and property taxes, from income from other sources. In the May 1974- Budget, the provision was repealed. The Minister of Finance argued that "this sheltering of income has lowered the financial cost of carrying undeveloped land and, therefore, reduced the pressure for early use." 125 It was concluded that ending the deductibility of land carrying charges would "assist in bringing land for housing onto the market more quickly. 11 126 The provision was officially dismantled in the November 1974- Budget.
In November of 1978, however, the measure was reintroduced in order to " .•• provide developers an opportunity for planning more projects in Canada. 11 12 7 Clayton (1981) notes that this reversal was, at least in part, due to intense lobbying by the development industry.128
B. Program Structure
Under this provision, which has remained unchanged since 19 78, developers "are allowed to deduct from their income for tax purposes any interest costs, property taxes or other interest costs, property taxes or other expenses incurred in respect of holding undeveloped land." 129 There is some debate in the literature as to whether this constitutes a tax expenditure. The Department of Finance

79
TABLE 20
Estimated Tax Losses Due to Deductions of Carrying Charges on Residential Land, Canada, 19 79-1981
Estimated Carrying Federal Tax
Charges Corporate Tax Losses* Year ($ million) Rate ($ million)
1979 170 • 36 31
1980 244 .36 44
1981 280 .36 51
* This incorporates the assumption that 50% of developers pay no tax. Both Clayton (1981) and the Department of Finance (1980) see this as reasonable.
Source: Clayton Research Associates, Tax Expenditures -- Housing, August, 1981, p. 48.

80
(1979) argues that the deductibility of land carrying costs is a tax subsidy since it enables the developer to deduct costs before revenues from sales are received. It is concluded that "the current tax treatment therefore allows a tax deferral insofar as costs are recognized before the associated revenue. 11 130 Clayton (1981) argues that, while the provision does constitute a departure from general accounting principles, (i.e. that costs should be deducted during the same period that revenues are incurred), it does not favour the development industry over other sectors. It is noted that ''businesses which have to hold inventories for long periods can deduct such carrying charges. 11 131
In terms of neutrality, the provision does not give preferential treatment to the development industry. It could be argued, however, that in terms of progressivity, allowing the immediate deduction of carrying charges against income from other sources does constitute a tax expenditure, for reasons similar to those associated with soft cost deductibility above. Deductibility of land carrying charges enables the developer to reduce taxable income before revenues are incurred. However, the principle of progressivity implies that costs should be deductible from the revenues with which they are associated. While it is difficult to build a persuasive argument either for or against the identification of this deduction as a tax expenditure, for the purposes of this study it will be assumed that they are a departure from the benchmark principle of progressivity, which implies adherence to general accounting principles.
C. Expenditure and Cost
Table 20 presents Clayton's (1981) estimates of the annual tax losses associated with the deductibility of carrying charges on residential land. This provision accounted for about $51 million in forgone revenue in 1981.
D. Program Impacts
The Report of the Federal/Provincial Task Force On The Supply and Price of Serviced Residential Land ("The Greenspan Report") examined the effect of the deductibility of land carrying charges on the housing market. While there were no significant impacts on land supply, a number of minor effects were noted. The provision:
* Increases the ability of smaller developers to compete, by reducing the amount of cash requirements during the unprofitable "front end" of the project.

81
* Results in developers holding land for longer periods, since the expenses involved during this period can be used to offset revenue from other sources.
* May result in slight increases in the price of raw land, since purchasers are better able to afford the front end land expense.
* Causes some reduction in the amount of serviced land brought on stream by the development industry; this results from the increased attractiveness of holding long term land.132
Clayton (1981) concludes that "deductibility should be a permanent feature of the tax system both on the grounds of equity and as an encouragement for large-scale integrated developments which are costly and require many years to complete. 11 133
5.2 SALES AND EXCISE TAX SUBSIDIES
A. Background and Rationale
Three similar housing-related tax expenditures can be discussed in this section: (1) the reduced federal sales tax on building materials (5% compared to 9% on most other manufactured products); (2) the exemption of construction equipment from the federal sales tax and; (3) the exemption of "goods in competition with on-site construction" (e.g. ready mix concrete, pre-cast concrete structures, concrete blocks, etc.) from federal sales tax.
There has been controversy over the taxation of building materials since the Carter Commission's 1966 recommendation that "all goods and services used to produce or distribute goods and services for final use should be exempt from sales tax. 11 134 This recommendation was based on the principle that sales tax should be applied to finished products, not to inputs at various stages of the production process, which was seen to be at once administratively unwieldly and unfair, since it resulted in a "tax-upon-tax" situation.
The Carter Commission's recommendation was not implemented by the Government on grounds that it would be too costly and would "overstimulate an already overstrong demand. 11 135 In the November 1974 Budget, however, the rate of sales tax on building and construction materials was cut to 5% and sales tax on all major classes of construction equipment was abolished. In 19 75 and 19 78, energy-related building products (insulation, storm windows, etc.), were added to the list of exemptions.

82
The November 1981 Budget Proposals contained two changes in the sales tax which indirectly will affect housing: First, the level at which taxes are levied has been changed from the manufacturer to the retailer or consumer of the product. It is unclear whether contractors will be counted as wholesalers or retailers. It has been argued that "the likely and more reasonable view is that materials suppliers should be regarded as wholesalers and that the suppliers (of lumber, heating, plumbing and electrical supplies, etc.) will be required to pay the tax, rather than the individual contractors. 11 136
The second effect of the November 1981 Budget is to decrease the gap between sales tax on building materials (levied at 5%, as noted), and sales tax on other goods, by reducing the rate of tax for most goods to 8%. The June 1982 Budget Proposals did not affect these changes.
Clayton (1981) notes that, in the past, there have been three reasons for construction industry sales tax reductions:
*
*
*
Avoidance of double taxation. As noted above, the Carter Commission recommended that only final goods and services be subject to sales tax. Taxes imposed at a number of levels in the production process were seen to be inequitable since the end result was a situation of "pyramiding taxation." Construction materials are seen as intermediate goods since they are inputs into the production of buildings, which themselves house the processes of production and reproduction.
Reduction in regressiv ity for necessities. Since higher income groups tend to spend lower proportions of their incomes on consumption expenditures, they tend to pay lower proportions of sales tax. For necessities such as food and shelter many analysts have argued that sales tax should be reduced or removed to off set the burdens placed on lower income households.
Reduction in housing costs through stimulus to the construction industry. As noted, the sales tax reduction were first proposed in the 1974 Budget, the same budget which introduced a variety of measures to assist the housing industry, including MURBs and RHOSPs. While the sales tax measures were aimed at all construction activities, the goal of stimulating the housing industry was explicitly stated.
B. Program Structure
The structure of each of the three provisions is fairly straightforward:
* Reduced sales tax on building materials. As noted, building materials are taxed at 5%, while the normal rate, as of January 1982 is 8%. This applies to raw materials (bricks, lumber, etc.), finished products (elevators, cabinet work, etc.) but not consumer durables (appliances,

83
TABLE 21
Federal Tax Losses Associated with Residential Construction Under Three Sales Tax Reductions, Canada, 1976-1981
Tax Revenue Losses ($ million) Item 1976 1977 1978 1979 1980
Reduction of Sales Tax on Building Materials 188 203 233 142 147
Exemption of Construction Equipment from Sales Tax 26 27 28 22 21
Exemption of Goods in Competition with On-Site Construction from Sales Tax 47 46 49 36 35
Source: Clayton Research Associates, Tax Expenditures -- Housing, Ottawa: CMHC: Ottawa, p. v.
1981
162
23
38

*
*
84
etc.). In addition, materials used in engineering projects (oil and gas pipelines, transmission lines, etc.) are eligible. Energy conservation products (insulation, etc.) have been granted a complete exemption since 1975-1978, although their cost is minimal.
Exemption of construction equipment. Tractors, cranes, trenchers, etc. are all exempt from the 9% tax.
Exemption of goods in competition with on-site construction from federal sales tax. Examples of these kinds of goods include concrete blocks, ready mix concrete, etc. While they are not subject to any tax themselves, the inputs, until July 1982, have been subject to the reduced sales tax on building materials.
Since each of the above provisions favours investors in the construction industry, it can be concluded that they each constitute departures from the benchmark criterion of neutrality and can, therefore, be considered as tax expenditures.
C. Expenditure/Cost of Program
Clayton (1981) provides estimates of the tax losses associated with these prov1s1ons (Table 21). Reduction in sales tax for building materials alone accounted for $162 million in forgone federal revenue in 1981.
D. Impacts of Program
The effects of these measures can be discussed with respect to the three rationales outlined above: reduction of housing costs through stimulus to the construction industry; offsetting the regressivity of the sales tax; avoiding double taxation.
The main effect of the sales tax exemption for goods in competition with on-site construction, is to put these products "on par" with on-site construction, which also is exempt from tax. Without this provision, there would be a shift away from manufacturing off-site, in some marginal cases, toward on-site production. This would result in less efficient production techniques.
With respect to reducing the costs of construction, Clayton (1981) argues that the impact of the exemption has tended to be difficult to estimate precisely but, nevertheless, is small in magnitude. Similarly, the impact of the program on reducing housing costs and regressivity would be minimal. The main strengths of this provision, therefore, are to promote equity (through avoidance of double taxation), and efficiency (by putting on-site and off-site production "on par").

85
Clayton argues that since construction machinery and equipment purchases comprise less than 2% of the total value of new housing, the impacts of this tax exemption are minimal. The ineffectivenes~ of this provision, notes Clayton, is evidenced by steady increases in the price of construction equipment since the exemption's introduction.137
The situation with respect to the tax reduction of building materials is less clear cut. In 1975, following the introduction of this measure, the construction price index did drop significantly. Clayton argues that this was mainly attributable to "the slump in housing starts in 1974 and 1975 which would have dampened materials manufacturers' ability to pass on cost increases to builders and ultimately to consumers.11 138
In addition, it is argued that since only 50-70% of materials used in residential construction are subject to tax, "a 6 percentage point reduction in the cost of those materials would have resulted in a decline of only 3 and 4%.11 139 While the provision does have some impact on reducing construction costs and housing prices, the magnitude is small. Clayton notes that "while it is difficult to assess the size of the effect it is unlikely to be more than perhaps 2-3 per cent. 11 140 The main justification for these programs, therefore, is their effect on reducing the regressivity of the sales tax on necessities, and the fact that they avoid double taxation for intermediate goods.
5.3 DEDUCTIBILITY OF INVESTMENT INTEREST
A. Background and Rationale
Prior to the November 1981 Budget Proposals, interest expenses incurred to earn income were deductible even if the revenue that they were to generate was deferred. While this provision is not limited solely to housing, it did tend to be widely used by investors in syndicated MURBs. The rationale behind the deductible interest expense was to attract investment in Canadian industries by offering a tax deduction during the unprofitable front end of the venture. Whether or not this provision constitutes a tax expenditure is debatable; the same arguments applied to the deductibility of interest charges on land and soft costs apply here and do not need to be restated. Clayton (1981) does not consider the provision to be a tax subsidy.
The importance to MURB investors has been noted:

86
••• most MURB investors borrow much of the capital to purchase their MURB unit and virtually all rental investors incur interest costs in excess of revenues less operating costs in the early years of the project.141
While the November 1981 budget originally proposed that all investors be subject to a "restricted interest expense," this was later dropped.142 No figures are available on the foregone revenues which result from this provision as it applies to the housing industry.
The number of provisions in the Income Tax Act make it difficult to present a detailed description and evaluation of every housing-related tax expenditure. While this paper has dealt with the major provisions, a few minor tax expenditures have been omitted (due to data and space limitations) and -- for the sake of completeness -- deserve mention here:
* Non-profit housing corporations. The Department of Finance (1979) notes that "certain non-profit corporations providing low cost housing ••• are exempt from tax, whether or not they have taxable income in a given year. This constitutes a preferential treatment for a certain type of taxpayer. 11 143 In addition, charitable donations to these corporations are deductible, which also counts as a tax preference. The revenue loss attributable to these provisions has not been estimated but it would certainly be relatively minor.
* First-time home-buyer grants. In certain years, the federal government offered grants which were not included in income for tax purposes. This accounted for an $8 million revenue loss in 19 76 and a $3 million loss in 1977)44
* Reduced rate of federal sales tax on travel trailers used as homes. Before 19 78, trailers used as homes were permitted a sales tax reduction amounting to 3%. With the lowering of the federal sales tax in 1978, however, trailer homes became taxable at the normal rate. This accounted for an annual revenue loss of $3 million between 1976 and 1978.145

87
Chapter 6
GENERAL CONCLUSIONS AND SUMMARY
This paper has provided a basic description and evaluation of federal tax expenditures, as they apply to housing. A recapitulation follows of some of the main themes and findings which have been developed.
Advantages of Tax Expenditures
Indirect programs have one main advantage over direct spending equivalents: administrative costs tend to be relatively low. This is due largely to two factors. Tax expenditures rely on the tax system which is already in place and well suited to handling redistributions of income. This characteristic causes tax subsidies to be cheaper in terms of program start- up. Secondly, tax expenditures tend to be cheaper to administer than direct spending programs since they rely on a one-step process of subsidy delivery (revenues are simply forgone), whereas direct spending programs require a more complex two-step process consisting of revenue-raising and redistribution.
Limitations of Tax Expenditures
While tax programs tend to be less costly to administer than direct spending alternatives, they are subject to a number of inherent constraints or limitations as to what policy goals they can accomplish. These can be summarized:
Low Income Groups. For each of the housing-related tax expenditures examined, program benefits tend to be concentrated in upper income groups. This is due to the inherent regressiveness of non-credit tax expenditures (since program benefits tend to rise with taxable income). Housing programs which are intended to deliver benefits directly to low and moderate income groups are therefore better suited to direct spending than are tax expenditure formats.
Accountability and Disclosure. Tax expenditures tend to be less visible to the average voter than direct spending programs (due largely to the complexity of tax law). In addition, the institutional structures (e.g. budgeting and expenditure accounts) affecting the accountability of tax programs have been, in past years, inadequate. While tax expenditure accounts have been released in recent years,

88
they are not a regular publication and often must be based on fairly crude estimates. In contrast with direct-spending alternatives, therefore (which have fixed budgets and annual audits), tax expenditures tend to have lower levels of public accountability.
Negative Effects of Proliferation. If the numbers of tax programs are allowed to proliferate, a variety of negative effects must be considered. First, an economy which is replete with tax incentives must necessarily have relatively high marginal tax rates (or borrowing) to make up for lost revenue. This tends to discourage investment in the economy and can erode the political legitimacy of government.
Second, by allowing tax programs to proliferate, a "self-cancelling effect" arises; as more and more sectors receive subsidies, the differential advantages incurred by each tend to be necessarily reduced.
Third, investor behaviour is often negatively affected by a proliferation of tax breaks. This trend results in higher levels of unproductive investment in tax avoidance/planning behaviour. In addition, it makes any purchasing decision more complex by requiring the individual to consider the tax implications of each investment.
Budgeting and Control Nightmares. The open-ended nature of tax expenditures, as well as the unpredictable nature of subsidy take-up levels, combine to make the indirect programs extremely difficult to budget and control. This factor was associated with each of the housing programs discussed above and it explains the lack of program evaluation or monitoring which has been carried out in connection with these subsidies. While systems of budgeting and control similar to those employed in direct spending programs could be built in to tax subsidies, the costs would be much higher and would seriously erode the advantage of low administrative overhead.
Blunt Instruments. Finally, in comparison with direct programs, tax expenditures tend to be relatively "blunt" and limited in scope. Tax programs, as noted, deliver benefits in large, pre-determined blocks, on the basis of tax return data, rather than highly discretionary interviews. While the tax system distributes benefits cheaply, it cannot be used to target subsidies according to highly individual needs of specific groups or regions.
Certain housing policy goals, therefore, are unattainable through the use of tax programs. For example, delivering adequate amounts and types of housing to the handicapped or other special needs groups (where the recipients' subsidy requirements are highly individual and change over time), would probably be better suited to a direct-spending format where interviews and administrator discretion can be used to determine the amount and timing of subsidies. Similarly,

89
urban planning policies, such as encouraging family housing in the core area, cannot be implemented through tax expenditures. In fact, the centralized nature of indirect programs raises a number of questions about the appropriate government level for administration and implementation of housing policy.
Local Control. The impacts of each of the housing policies discussed are contingent on the characteristics of the local housing market. Tax expenditures, however, are not targeted to specific municipalities or areas, but they tend to be applied uniformly across the country. This results in a fairly predictable and intentional distribution of the subsidy in markets which are operating smoothly, and a haphazard and ineffective subsidy impact in tight or imperfect markets. Unlike direct spending programs, therefore, tax expenditures tend to be relatively blunt and unresponsive to local areas' needs.

90
FOOTNOTES
Introduction
1. The Globe and Mail (1973), in G. Galt, "Saving Grace," Saturday Night (June, 1982), 9.
2. Honourable A.J. MacEachen, Minister of Finance, The Budget, Oct. 28, 1980, 15.
3. E.C. Harris, Canadian Income Taxation (Toronto, 1979), 81 and 11.
1. Tax Expenditures in General
4. R.S. Smith, "Tax Expenditures: An Examination of Tax Incentives and Tax Preferences in the Canadian Federal Income Tax System," Canada Tax Foundation (Toronto, 1979), 1 (emphasis added).
5. Ibid., 4 (emphasis added).
6. Ibid., 5.
7. Canada, Department of Finance, Government of Canada Tax Expenditure Account (Ottawa, 1979), 4.
8. Ibid., 30.
9. Canada, Department of Finance, Analysis of Federal Tax Expenditures for Individuals (Ottawa, 1981), 1.
10. Ibid., 1.
11. See for example: National Council on Welfare, The Hidden Welfare System (Ottawa, 1976), and The Hidden Welfare System Revisited (Ottawa, 1979).
12. Ibid. (19 76), 2.
13. See: Canada, Department of Finance, Government of Canada Tax Expenditure Account (Ottawa, Dec. 1980).
14. Department of Finance, op. cit. (1979), 31.
15. Ibid., 30.
16. Ibid.
17. Ibid.

91
18. Harris, op. cit., 2.
19. Department of Finance (1981), op. cit., 5.
20. D. Runge et al., A Comprehensive Social Housing Policy for British Columbia (Victoria, 1975), 194-95.
21. Department of Finance, op. cit. (1981), 1.
22. National Council on Welfare, op. cit. (1979), 2.
23. Harris, op. cit., 82-83.
24. Department of Finance, op. cit. (1981),
25. P. Surguy, "The Tax Dodgers," Today (May, 1982), 9.
26. Department of Finance, op. cit. (1981), 28.
27. Ibid., 2.
28. R.S. Smith, op. cit., 11.
2. Housing-Related Tax Expenditures
29. Recommendations of the Royal Commission on Taxation (Toronto, 1967), 11.
30. Studies of the Royal Commission on Taxation, Number 19, "The Taxation of Capital Gains," (Ottawa, 1967), pp. 1-35.
31. Canada, Department of Finance, Proposal for Tax Reform: White Paper on Taxation, Ottawa, 1969, p. 33.
32. See: National Council on Welfare (1976) and (1978), op. cit.; and D. Lewis, The Louder Voices: The Corporate Welfare Bums(Toronto, 1972).
3. Rental Housing Tax Expenditures
33. D. Frazer, "Who Benefits from Tax Shelters?" (Ottawa: Canadian Council on Social Development, 1979), 31.
34. Carswell and Methuen, Canadian Tax News, 11(6), 70; in ibid., 46.
35. See: Canada, Department of Finance, Budget Paper C, Capital Cost Allowances (Ottawa, 1976), 7.
36. Alberta, Ministry of Housing and Public Works, "Budget Items with Significant Effect on the Housing Industry" (March, 1982), 4.
37. Canada, Department of Finance, Release, 83-63 (May 31, 1982), pp. 4-5.

92
38. Clayton Research Associates, Tax Expenditures -- Housing (CMHC, 1981), 5.
39. Hon. J. Turner, Federal Budget Speech (Ottawa, 1974) (emphasis added).
40. Canada, Department of Finance, "Supplementary Information and Notice of Ways and Means Motions on the Budget," Budget Papers (Ottawa, Nov. 12, 1981), 27-28.
41. Clayton Research Associates, op. cit. (August, 1981), 11.
42. H.B. Zimmer, The New Canadian Real Estate Investment Guide (Edmonton, 1981 ), 36.
43.
44.
45.
46.
Clayton Research
Zimmer, op. cit.,
Clayton Research
Zimmer, op. cit.,
47. Ibid., 41.
Associates,
36.
Associates,
42.
op. cit. (August, 1981), 12.
op. cit. (1981), 15.
48. Canada, Department of Finance, Budget Papers (November 12, 1981), 28.
49. Canada, House of Commons, Bill C-139 (December 7, 1982), 38a.
50. Clayton, op. cit. (August, 1981), 4.
51. For a more complete discussion, see D.I. Beach, "Disposition of Real Property Held for Investment," in Canadian Tax Foundation, Corporate Management Tax Conference, 1977 (Toronto, 1978), 168-180.
52. M. Denhez, Protecting the Built Environment, Part I (Ottawa: Heritage Canada, 1978), 18.
53. Ibid, 18.
54. Canada, Department of Finance, Explanatory Notes to a Bill Amending the Income Tax Act (Ottawa, 1982), 14.
55. Clayton, op. cit. (August, 1981), 11.
56. Ibid., 8.
57. P. Fulton, "Tax Preferences for Housing: Is There a Case for Reform?" in W. Thirsk and J. Whalley (eds.), Tax Policy Options in the 1980s (Canadian Tax Foundation: Toronto, 1981), 86.
58. P. Goring and M. Norbrega, "Tax Shelter Real Estate: an overview of AR P's and MURB's" (Canmort Consultants: Toronto, 1977), 4.
59. For more information of the relationship between ARP and MURB, see I. Lithwick, An Evaluation of the Federal Assisted Rental Program (1967-77)

93
(CMHC: Ottawa, 1978), 46-56.
60. Ontario Economic Council, Issues and Alternatives: 1976: Housing (Toronto, 1976), 32.
61. Clayton, op. cit. (August, 1981), 25.
62. Ibid., 21.
63. Canadian Institute of Public Real Estate Companies, "Shortage of Rental Housing: Overview and Recommendations" (April 28, 1982), 3.
64. P. Lush, "Only 20% of MURBs seen as being finished," Globe and Mail (May 5, 1982), B4.
65. B. Fiber, "MURBs may be missed, but value in doubt," Globe and Mail (Nov. 16, 1981).
66. I. Lithwick, op. cit., 23-29.
67. G.W. Gau, "Impact of the ARP and MURB Programs on the Vancouver Housing Market" (CMHC: Ottawa, 1982),
68. Clayton, op. cit. (1981), 34.
69. Letter from A. McAfee, Housing Planner, City of Vancouver Planning Department, to D. Hulchanski, University of Toronto, October 12, 1982.
70. Ibid.
71. Lithwick, op. cit., 23-29.
72. Goring and Norbrega, op. cit., 20.
73. M. Glassman and A. Janosik, "Social Costs and Lost Revenue: The Tax Shelter Game," Housing and People, 8(3) (Spring, 1978), 7.
74. A.E. LePage, "Questions Re: The Acquiring of a MURB," Real Estate Investment Bulletin (October, 19 78), 1.
75. D. Frazer, op. cit., 54-55.
76. United States, Joint Committee on Internal Revenue Taxation, Overview of Tax Shelters (House of Representatives, Ways and Means Committee: Washington, 19 75).
77. A.F. Eger, "Effects of Tax Benefits and Incentives to Stimulate Construction of Modest Priced Rental Housing," paper presented to symposium on Rental Housing Market and Housing Allowances (CCSD: Winnipeg, 1982), 8.
78. Gau, op. cit., 11.
79. See: A.E. LePage, op. cit., 3-4; Goring and Norbrega, op. cit., 20; Frazer,

94
op. cit., 55; on the risks incurred by the MURB investor.
80. J. Whitelaw, "MURBs: Early Results are Unpromising," Bimonthly Reports, No. 1 (19 79 ), 3.
81. Fiber, op. cit.
82. Clayton, op. cit. (1981), 33.
83. CMHC, interview (Ottawa: June, 1982).
84. Zimmer, op cit., 35.
85. Clayton, op. cit. (1981), 43.
86. See: Clayton, op. cit. (1981), 43; Department of Finance, op. cit. (1980), 22.
87. Bossons, op. cit. (1970), 335.
4. Homeownership Tax Incentives
88. R.S. Smith, op. cit., 25-26.
89. L.B. Smith, in Frazer, op. cit., 98.
90. Royal Commission on Taxation, Report, v. III, 49; in R.S. Smith. op. cit.
91. Canada, Proposal for Tax Reform: White Paper on Taxation (Ottawa, 1969), 33; in Frazer, op. cit., 25-26.
92. P. Wragge and H. Bartel, An Evaluation of the Registered Home Ownership Savings Plan (RHOSP) (CMHC: Ottawa, 1981), 1.
93. Wragge and Bartel, op. cit., 2.
94. Commons Debates, April/May, 1974, The Budget, 2083-4; in Wragge and Baste!, op. cit., 2.
95. Ibid., 2083-4.
96. Ibid.
97. See for example: Smith, op. cit.; P. Fulton, "Homeowner Imputed Rent and Capital Gains: Implications for Equity Within the Tax System" (Ph.D. dissertation, University of Western Ontario, 1980); H. Kitchen, "Imputed Rent and Owner-Occupied Dwellings," Canadian Tax Journal, 15 (Sept.-Oct., 1967), 482.
98. Zimmer, op. cit., 153.
99. J. Bossons, "The Effect of Inflation-reduced Hidden Wealth Taxes," in Canadian Tax Foundation, Report of the Proceedings of the Thirty-Second

95
Tax Conference (Toronto, 1981), 16.
100. Fulton, op. cit. (1980).
101. Clayton, op. cit. (1974), in Fallis, op. cit., 113.
102. L.B. Smith, "Comment," in Fulton, op. cit. (1981), 98.
103. See Frazer, op. cit., 27.
104. G. Fallis, Housing Programs and Income Distribution in Ontario (Toronto, 1981), 114; it should be noted that Fallis' analysis is based on 1971 Ontario data.
105. L.B. Smith, "Comment," in Fulton, op. cit. (1981), 99.
106. Fulton, op. cit. (1981), 83.
107. As noted by Fulton, op. cit. (1981), 82.
108. Runge et al. (1975), 194.
109. Fulton, op. cit. (1981), 88.
110. Wragge and Bartel, op. cit., 30.
111. Ibid., 12.
112. Fulton, op. cit. (1981), 88.
113. For a fuller discussion, see Frazer, op. cit., 4.
114. Wragge and Bartel, op. cit., 10.
115. Ibid., 30.
116. Ibid., 8.
117. Frazer, op. cit., 17.
118. Wragge and Bartel, op. cit., 8.
119. Ibid.
120. Canada, Department of Finance, op. cit. (1980), 22.
121. See Revenue Canada, Taxation Statistics (1976-1978 editions), Table 15.
122. L.S. Bourne, The Geography of Housing (London, 1981), 153.
123. I. Lowry, "Filtering and Housing Standards: A Conceptual Analysis," Land Economics, 36, 362-370, in Bourne, op. cit., 154.
124. A. Downs, Urban Problems and Prospects (Chicago, 1975), in Bourne, ~ cit., 154.

96
5. Other Housing-Related Tax Expenditures
125. Hon. J.N. Turner, Minister of Finance, Budget Speech, May 6, 1974, 19.
126. Ibid.
127. Department of Finance, Budget Papers, November 16, 1978, 36.
128. Clayton Research Associates, op. cit. (1981), 45.
129. Ibid.
130. Canada, Department of Finance, Government of Canada Tax Expenditure Account (Ottawa, 1979), 3.
131. Clayton Research Associates, op. cit. (1981), iii.
132. Federal/Provincial Task Force on the Supply and Price of Serviced Residential Land, Down to Earth, Vol. 2: Synthesis and Summary of Technical Research (1977), 160-164.
133. Clayton Research Associates, op. cit. (1981), 53.
134. Report of the Royal Commission on Taxation, vol. 5 (1966), 74-77, in Clayton, op. cit., 55.
135. Hon. J.N. Turner, op. cit.
136. Alberta, Ministry of Housing and Public Works, op. cit.
137. Clayton Research Associates, op. cit. (1981), 72.
138. Ibid., 69.
139. Ibid.
140. Ibid., iii.
141. Clayton Research Associates, Prospects for the Rental Housing Market in Canada, 1981-1986 (Toronto Home Builders' Association: Toronto, 1981), 14.
142. Canada, Department of Finance, News Release, 82-145 (Ottawa, December 7, 1982), 2.
143. Department of Finance, op. cit. (1979), 84.
144. Department of Finance, op. cit. (1980), 23.
145. Ibid., 23.

97
Appendix I
PROVISOS ON THE INTERPRETATION OF DEPARTMENT OF FINANCE TAX EXPENDITURE ESTIMATES
In each of the federal tax expenditure accounts, the Department of Finance has included a number of qualifications with its estimates. These are included here to assist the reader in interpreting the data included throughout this study. The qualifications, or "provisos" can be summarized:
*
*
*
*
*
Adding together a number of tax expenditure items can produce a significant bias, because of the interaction among individual tax provisions. For example, the elimination of two provisions would have a greater effect on increasing revenues than the sum of the two items' cost. This is due to the fact that elimination of two deductions would tend to push many more individuals into higher tax brackets than if just one deduction were eliminated. This factor, therefore, leads to a conservative estimation of the revenue impact of combined tax expenditures.
Department of Finance estimates are incomplete, since many tax expenditures were impossible to quantify. This factor also makes the estimates conservative.
One dollar of tax expenditure is often worth more to beneficiaries than one dollar of direct spending. This arises from the fact that while tax expenditures act to reduce taxable income, direct spending grants are often included in taxable income and, therefore, do not offer the same degree of benefits per dollar of subsidy as tax programs. This factor, therefore, also tends to make the tax expenditure estimates conservative in relation to direct spending estimates.
Significant margins of error are attributed to some tax expenditure estimates. The Department of Finance notes that this is due to the inherent difficulties encountered in evaluating these types of programs, as well as "resource constraints and data limitations." The direction and magnitude of the error which this factor imposes on the figures cannot be estimated.
The revenue effect of dismantling any tax expenditure would be offset by changes in taxpayer behaviour. Elimination of any provision would cause taxpayers to rearrange their affairs to minimize the impact of the change. This factor would tend to make the value of additional revenue obtainable from dismantling any tax program less than that implied by annual expenditure estimates. This factor, therefore, would tend to make the tax expenditure estimates somewhat liberal when interpreted as forgone revenues.
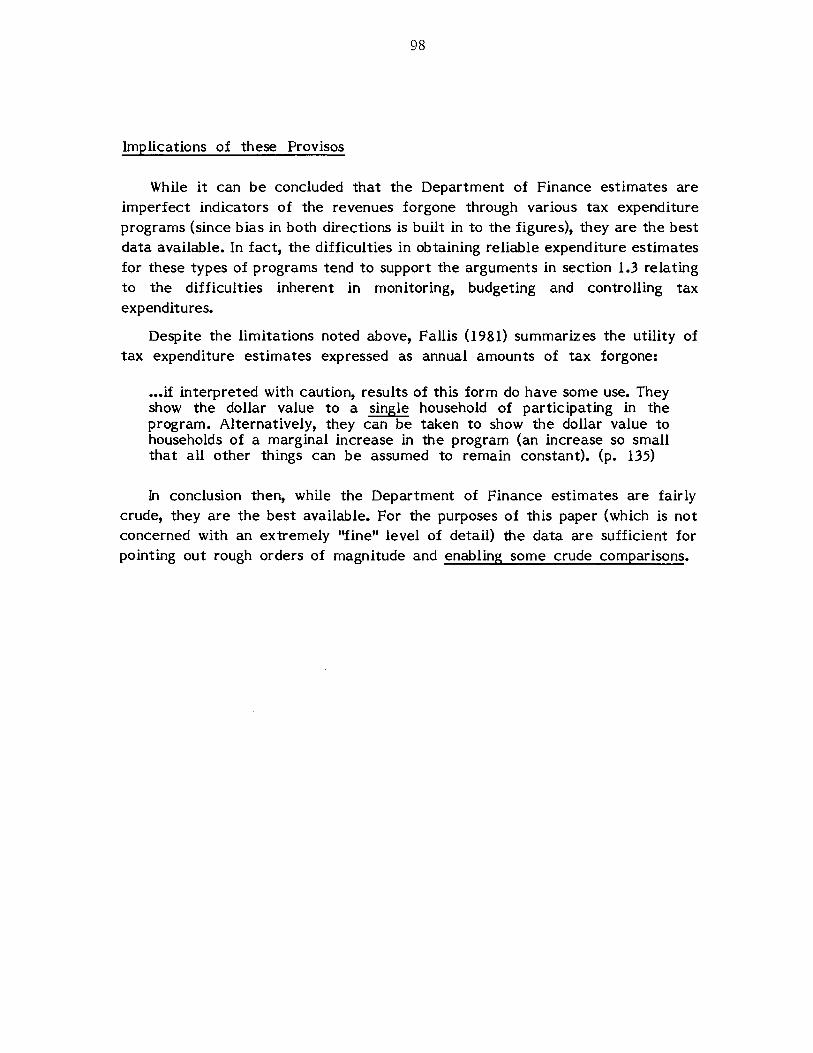
98
Implications of these Provisos
While it can be concluded that the Department of Finance estimates are imperfect indicators of the revenues forgone through various tax expenditure programs (since bias in both directions is built in to the figures), they are the best data available. In fact, the difficulties in obtaining reliable expenditure estimates for these types of programs tend to support the arguments in section 1.3 relating to the difficulties inherent in monitoring, budgeting and controlling tax expenditures.
Despite the limitations noted above, Fallis (1981) summarizes the utility of tax expenditure estimates expressed as annual amounts of tax forgone:
••• if interpreted with caution, results of this form do have some use. They show the dollar value to a single household of participating in the program. Alternatively, they can be taken to show the dollar value to households of a marginal increase in the program (an increase so small that all other things can be assumed to remain constant). (p. 135)
In conclusion then, while the Department of Finance estimates are fairly crude, they are the best available. For the purposes of this paper (which is not concerned with an extremely "fine" level of detail) the data are sufficient for pointing out rough orders of magnitude and enabling some crude comparisons.

99
Appendix II TECHNICAL NOTES ON ESTIMATES OF THE ANNUAL COST
OF THE NET IMPUTED RENT EXEMPTION AND CAPITAL GAINS EXEMPTION
a) Net Imputed Rent Exemption Estimates
Fulton (1981) refers to the difficulties inherent in developing any estimates of the costs of the exemption of net imputed rent. Two methods can be used to obtain these figures.
*
*
Equity Approach. Using this methodology, the analyst assumes a rate of return on equity which most homeowners would expect to incur. This is then applied to the total equity value in houses across Canada (equal to the market value of all houses less the total mortgage debt outstanding), to yield an estimate of income subject to tax. An average marginal tax rate is then applied to this to yield an estimate of the annual cost of the exemption. This approach ignores the fact that homeowners pay different rates of mortgage interest.
Market Rent Approach. Under this methodology the analyst obtains an estimate of the market rent which the average homeowner could obtain for his/her housing, subtracts all operating and interest expenses, and multiplies this figure by the average marginal tax rate to yield an estimate of the annual cost of the exemption.
While the Market Rent Approach is generally considered to be more accurate than the Equity Approach, it depends much more heavily on the availability of reliable data, aggregated at the national level. For the sake of consistency, this paper utilizes Department of Finance estimates for this exemption, which are based on the Equity Approach. Unfortunately, the Department of Finance (1980) estimates contain some unrealistic assumptions, and had to be adjusted. The assumptions can be summarized:
* Under equilibrium conditions, homeowners will expect to earn the same return on equity in a house that they would in the "next best alternative" investment.
* The "next best alternative" investment would tend to be a fairly riskless venture such as a bond, which would yield 8% return on equity.
* The cost of the net imputed rent exemption, therefore, would equate to 20% (the average marginal tax rate for this income source) of 8% of the total equity in houses.
The error in these assumptions occurs in the second step. Homeowners could

100
be expected to earn 8% on equity but this would comprise returns accruing from net imputed rent and capital gains. The Department of Finance (1980) estimates, therefore, tend to drastically overstate the cost of the imputed rent exemption.
While the more recent Department of Finance (1981) estimates use a 5% return on equity, interviews with knowledgeable sources have indicated that a 3-4% return would be more reasonable. For the purposes of this paper, therefore, the 1980 Tax Expenditure Accounts estimates were adjusted down to incorporate a 3.5% return on equity in the net imputed rent exemption cost estimates. No attempt is made in this estimate to consider maintenance and property tax expenses.
b) Capital Gains Exemption Estimates
In Canada, capital gains are taxed at only one-half an individual's marginal tax rate. The rationale behind this preferential treatment is this: "the government believed that this struck a balance between the case for fully taxing gains and the need for incentives for economic growth and risk taking, and taxpayer aceptance."* This treatment can be seen to constitute a tax expenditure since it favours certain kinds of income over others; as well, it tends to be inherently regressive (since the majority of capital gains are incurred by upper income earners: in 1978 tax filers with incomes over $50,000 -- only 0.8% of all tax filers
accounted for almost 43% of reported capital gains**).
As a result, the Department of Finance (1980) estimates of the cost of the capital gains exemption used in this paper assume taxation at full marginal tax rates (rather than one-half, as is current practice). In order to show the comparative advantage accruing to homeowners over investors in other areas, Table 13 also shows the cost of the capital gains exemption assuming taxation at half the marginal tax rate.
*
**
Canada, Department of Finance, A Review of the Taxation of Capital Gains in Canada: Summary (Ottawa: November, 1980), 3. Ibid, 2.

101
Appendix III
ROUGH ESTIMATES OF FEDERAL EXPENDITURES RELATED TO
OWNERSHIP, RENTAL AND SOCIAL HOUSING, 1980*
Ownership AHOP 1
RRAP 1
Interest & Loan Losses
RHOSP 2
($ million)
Non-taxation of capital gains2
Non-taxation of net imputed rent2
Social Housing Rural & Native RRAP 1
Public Housing Subsidies 1
Non-profit & Co-op Assistance1
Community Resource Grou~s 1
Non-profit & Co-op RRAP Interest & Loan losses
Market Rental Housing Private Rental RRAP 1
Assisted Rental Programs 1
Interest & Loan Losses 1
MURB 2
Soft Cost Deductibility2
CCA Accelerated Depreciation2
Other Community Services1
Research, Development, etc. 1
General Administration1
Rehabilitation (insulation & repair)
Deductibility of carrying charge on land2
Sales Tax Reductions2
Deductibility of investment interest
Total Direct Expenditure Total Indirect Expenditure
GRAND TOTAL
29.0 20.0 8.7
95.0 3,500.0 2' 188. 0
49.2 262.7
34.8 8.2
22. 1 18.9
15.5 25.0
7.5
65.0 110.0 95.0
203.2 16.7 59.7
215.8
44.0 203.0 n/a
997.0 6,300.0
Total % Grand Total
5,840.7 80.0
395.9 5.4
318.0 4.4
742.4 10.2
7,297.0
13.7 86.3
100.0
1. Based on data in: CMHC, "Grants, Contributions and Subsidies on Behalf of the Minister," Annual Report (Ottawa, 1980), 56.
2. Based on estimates presented infra. * All direct estimates are subject to the provisos in Appendix I.

102
BIBLIOGRAPHY
Alberta. Ministry of Housing and Public Works, "Budget Items with Significant Effect on the Housing Industry" (March, 1982).
Beach, D.I. "Disposition of Real Property Held for Investment," in Canadian Tax Foundation, Corporate Management Tax Conference, 1977 (Toronto, 1978), 168-180.
Bossons, J. "The Effect of Inflation-Reduced Hidden Wealth Taxes," in Canadian Tax Foundation, Report of the Proceedings of the Thirty-Second Tax Conference (Toronto, 1981).
Bourne, L.S. The Geography of Housing (London, 1981).
Canada. Department of Finance. Analysis of Federal Tax Expenditures for Individuals (Ottawa, 1981).
-----. Budget Paper C, Capital Cost Allowance (Ottawa, 1976).
-----. Government of Canada Tax Expenditure Account (Ottawa, 1980).
-----. Government of Canada Tax Expenditure Account (Ottawa, 1979).
-----. Proposal for a Tax Reform: White Paper on Taxation (Ottawa, 1969).
-----. "Supplementary Information and Notice of Ways and Means Motions on the Budget," Budget Papers (Ottawa, Nov. 12, 1981).
Canada. Royal Commission on Taxation. Recommendations of the Royal Commission on Taxation (Toronto, 1967).
-----. "The Taxation of Capital Gains," Studies of the Royal Commission on Taxation No. 19 (Ottawa, 1967).
Canada Mortgage and Housing Corporation. Annual Report (Ottawa: 1980).
Canadian Institute of Public Real Estate Companies. "Shortage of Rental Housing: Overview and Recommendations" (April 28, 1982).
Clayton, F. "Income Taxes and Subsidies to Homeowners and Renters: A Comparison of U.S. and Canadian Experience," Canadian Tax Journal, Vol. 33, No. 3 (May-June, 1974).
Clayton Research Associates. Prospects for the Rental Housing Market in Canada, 1981-1986 (Toronto: Toronto Home Builders' Association, 1981).

103
-----. Tax Expenditures -- Housing (Ottawa: CMHC, 1981).
Denhez, M. Protecting the Built Environment, Part I. (Ottawa: Heritage Canaa, 1978).
Downs, A. Urban Problems and Prospects (Chicago, 1975).
Eger, A.F. "Effects of Tax Benefits and Incentives to Stimulate Construction of Modest Priced Housing," paper presented to Canadian Council of Social Development Symposium on Rental Housing Market and Housing Allowances, Winnipeg, 1982.
Fallis, G. Housing Programs and Income Distribution in Ontario (Toronto: Ontario Economic Council, 1981).
Fiker, B. "MURBs may be missed, but value in doubt," Globe and Mail (May 5, 1982).
Fulton, P. "Tax Preferences for Housing: Is there a case for Reform?'' in Thirsk and Whalley (eds.), Tax Policies and Options in the 1980s (Toronto: Canadian Tax Foundation, 1981).
Gau, G. W. "Impact of the ARP and M URB Programs on the Vancouver Housing Market" (Ottawa: CMHC, 1982).
Glassman, M. and Janosik, A. "Social Costs and Lost Revenue: The Tax Shelter Game," Housing and People, 8(3) (Spring, 19 78).
Goring, P. and Norbrega, M. "Tax Shelter Real Estate: an overview of ARP's and MURB's" (Toronto: Canmert Consultants, 1977).
Harris, E.C. Canadian Income Taxation (Toronto, 1979).
Kitchen, H. "Imputed Rent and Owner-Occupied Dwellings," Canadian Tax Journal, 15 (Sept-Oct, 196 7).
Lewis, D. The Louder Voices. The Corporate Welfare Bums, (Toronto, 1972).
Lithwick, I. An Evaluation of the Federal Assisted Rental Program (1967-77) (Ottawa: CMHC, 1978).
Lowry, I. "Filtering and Housing Standards: A Conceptual Analysis," Land Economics, 36, 362-3 70.
Lush, P. "Only 20% of MURBs seen as being finished," Globe & Mail (Nov. 16, 1981).
LePage, A.E. "Questions Re: The Acquiring of a MURB," Real Estate Investment Bulletin (October, 1978).

104
MacEachen, Hon. A.J., Minister of Finance. The Budget, Oct. 28, 1980.
Marchant, E.D. "MURBs," CA Magazine, September 1977.
Munch, J. "New home tax rumour causes flood of protest," Toronto Star (March 16, 1982).
National Council on Welfare. The Hidden Welfare System (Ottawa, 1976).
-----. The Hidden Welfare System Revisited (Ottawa, 1979).
Ontario Economic Council. Issues and Alternatives: 1976: Housing (Toronto, 1976).
Revenue Canada. Taxation Statistics (1976-1978 editions).
Runge, D., et al. A Comprehensive Social Housing Policy for British Columbia (Victoria: Interdepartmental Study Team on Housing and Rents, 1975).
Smith, L.B. "Housing Assistance: A Re-evaluation," Canadian Public Policy (Summer, 1981), 7(3).
Smith, L.B. and Tomlinson, P. "Rent control in Ontario: Roofs or Ceilings?", AREUEA Journal 9(2), 1981.
Smith, R.S. "Tax Expenditures: An Examination of Tax Incentives and Tax Preferences in the Canadian Federal Income Tax System," Canadian Tax Foundation (Toronto, 19 79).
Surguy, P. "The Tax Dodgers," Today (May, 1982).
Task Force on CMHC. Report on Canada Mortgage and Housing Corporation (Ottawa, 1979).
Turner, Hon. J., Minister of Finance. Federal Budget Speech (Ottawa, 1974).
United States, Joint Committee on Internal Revenue Taxation, Overview of Tax Shelters (Washington, D.C.: House of Representatives, Ways and Means Committee, 1975).
Whitelaw, J. "MURBs: Early Results are Unpromising," Bimonthly Reports No. 11 (1979).
Wragge, P. and Bartel, H. An Evaluation of the Registered Home Ownership Savings Plan (RHOSP) (Ottawa: CMHC, 1981).
Zimmer, H.B. The New Canadian Real Estate Investment Guide (Edmonton, 1981).