housing market gap analysis - county of sonoma
TRANSCRIPT

HOUSING MARKET GAP ANALYSIS
Prepared for the County of Sonoma by Focus Strategies
10 • 08 • 2020

TABLE OF CONTENTS
Background and Purpose............................................................................................... 3
Overview and Local Context of Housing Market Gap Analysis ..................................... 3
Sonoma County General Population and Unit Production Growth ............................... 5
Estimating the Housing Gap .......................................................................................... 6
The Sonoma Complex Fires ........................................................................................... 6
Housing Affordability .................................................................................................... 7
Racial/Ethnic Disparities ................................................................................................ 9
COVID-19 ..................................................................................................................... 10
Conclusion ................................................................................................................... 11
Background and Purpose
The Sonoma County Community Development Commission (CDC) engaged Focus Strategies
to assist community leadership and key stakeholders to evaluate, align, and improve the
countywide response to the local crisis of homelessness. In the first phase of the project,
Focus Strategies conducted a qualitative Baseline System Assessment, completed in August
2020. The Baseline Assessment identified strengths and challenges in the community’s
current response to homelessness and identified preliminary recommendations for system
improvement.
The second phase was comprised of two parts. First, Focus Strategies conducted a series of
data analyses designed to complement the qualitative analysis completed in Phase One and
assessed the community’s response to homelessness by analyzing project and system
performance. That report described our approach to the quantitative analysis, the
methodology used, and the system performance results. We also provided
recommendations for system improvement informed by both the data analysis and findings
from the Baseline Assessment.
This report presents the second product from the second phase; it is an analysis of affordable
housing inventory, with a particular focus on housing for people with extremely low incomes.
The report also considers racial and ethnic disparities in the need for housing for people with
extremely low incomes. Taken together, the three reports produced in Phase One and Two
provide a contextual and analytic foundation that community leaders and key stakeholders
can use to develop a new Strategic Plan to reduce homelessness in Sonoma County.
Overview and Local Context of Housing Market Gap Analysis
This analysis provides an overview of the current affordable housing market in Sonoma
County and provides estimates on the balance between the demand for and supply of
affordable rentals for extremely low-income (ELI) households over the next several years (FY
2023/2024). We begin with an overall analysis of housing available in Sonoma County and
then focus on units that are affordable for households at 30% or less of the Area Median
Income (AMI); these are the units that people experiencing or at risk of homelessness are
most likely to be able to afford and that are most urgently needed as part of an overall
communitywide strategy to reduce homelessness.
A variety of sources – including data from the American Community Survey, the Census Pulse
Survey, and information published by the California Housing Partnership, the National Low-
Income Housing Coalition, and Beacon Economics – are used to paint a picture of affordable
housing market conditions. Several factors should be noted to place this analysis in context:
• At the end of September 2020, Sonoma and Napa counties were in the midst of a
growing wildfire known as the Glass Fire. Evacuations were currently underway in the
vicinity of the fire, and as of this writing more than 8,500 structures are threatened by
the 11,000-acre fire.1 Any loss of housing stock will need to be accounted for in future
housing market analysis work undertaken.
• There is substantial current uncertainty surrounding the local economy and housing
due to the COVID-19 pandemic. The incidence of COVID-19 is higher amongst low-
income populations and there is also more extensive job loss in that population;
subsequent loss of stable housing becomes more likely. Again, the impact of the
pandemic, changes to housing stock and affordability will need to be included in
future housing market analysis work.
Regardless of the contextual factors noted above, findings presented are relevant to gauging
trends and identifying gaps in the availability of low-income housing, especially for ELI
households.
Overall, we find that:
• Aggregate housing unit production in Sonoma County has not kept pace with
demand
o Existing aggregate shortage of several thousand units are expected to increase
based on current trends2
• A substantial gap exists in affordable housing available to ELI households
o Estimated gap of 7,500-11,000 units
• Hispanic households are more likely than non-Hispanic households to be ELI
o 12% of Hispanic households were ELI, compared with 7% non-Hispanic
households
1 https://www.pressdemocrat.com/article/news/live-updates-more-fire-evacuation-orders-issued-for-east-santa-rosa/ 2Using aggregate population and housing inventory data from the American Community Survey, our analysis suggests that the shortage is the in the area of 5,500 units; Beacon Economics estimated the shortage to closer to 13,000 units based on housing, growth, and employment trends. Results from both are discussed in the report.

Sonoma County General Population and Unit Production Growth
The next table presents Census data from 2010-2018.3 The cells with bolded, italicized font
indicate estimates generated by Focus Strategies using the compound annual growth rate.
As the data indicate, between 2010 and 2016, population growth outpaced the production of
new housing in Sonoma County, contributing to a backlog of the number of units available
for a growing population. In 2017, the number of units produced was essentially equal to the
number of people added to the population. However, 2017 also marks the year the Sonoma
County Complex Fires (the collective name of Nuns, Tubbs, and Pocket Fires) swept through
the county, resulting in a significant loss to housing stock. This matter is discussed in more
detail later in the analysis. The resultant drop in population and housing units available is
evident in the 2018 data; consequently, we only use 2010-2017 to project future trends for
this analysis.
Estimating Growth in Population and Unit Production
General Population Units
Year Estimate
Net
Change in
Population
% Increase
from
Previous
Year
Estimate
Net
Change in
Units
% Increase
from
Previous
Year
2010 485,120 NA NA 204,595 NA NA
2011 488,116 2,996 0.62% 205,383 788 0.39%
2012 491,829 3,713 0.76% 204,760 -623 -0.30%
2013 495,025 3,196 0.65% 205,684 924 0.45%
2014 500,292 5,267 1.06% 207,220 1,536 0.75%
2015 502,146 1,854 0.37% 207,891 671 0.32%
2016 503,070 924 0.18% 208,153 262 0.13%
2017 504,217 1,147 0.23% 209,308 1,155 0.55%
2018 499,942 -4,275 -0.85% 205,247 -4,061 -1.94%
2019 502,707 2,765 0.55% 205,916 669 0.33%
2020 505,487 2,780 0.55% 206,587 671 0.33%
2021 508,283 2,796 0.55% 207,260 673 0.33%
2022 511,094 2,811 0.55% 207,935 675 0.33%
2023 513,921 2,827 0.55% 208,613 678 0.33%
2024 516,764 2,843 0.55% 209,293 680 0.33%
3 American Community Survey.

Estimating the Housing Gap
Using the data presented thus far, an approximation can be generated to indicate the overall
current and future housing gap in Sonoma County. The table below presents this estimate.4
First, the estimate suggests that there is a current housing gap that existed historically and
was exacerbated due to growth rate in unit production not keeping up with population
growth. The estimated total deficit is 5,443 units.
The population continues to grow at a rate somewhat more than the growth rate in unit
production (.55% vs. .33% respectively). Combining the current backlog and the continued
outpacing of population over unit growth, the community may be short more than 7,400 units
in 2024.
Estimated Aggregate Housing Gap in Sonoma County
Time Period General Population
New People
New Households
(People/2.6) New Units
Surplus (Deficit)
Units
Backlog (2010-2019) 17,587 6,764 1,321 (5,443)
Projected 2020-2024 14,507 5,407 3,377 (2,030)
Total through 2024 31,644 12,171 4,698 (7,473)
The Sonoma Complex Fires
The Sonoma Complex fires in October 2017 destroyed approximately 5,300 homes in
Sonoma County (2.5% of residential housing stock). In an analysis of the fiscal and housing
impact of the fires, Beacon Economics estimated that an additional 8,143 housing units
(including 3,130 rentals) were needed between 2016-2020 to keep pace with employment
growth in the county prior to the fires; when factoring in the fires this number increased to
more than 13,000 new units.5 Further, the February 2019 floods in Sonoma County caused
considerable damage to housing; an estimated 1,900 homes were affected, 1,760 of which
suffered major damage. The authors noted that new housing starts had averaged less than
4 The assumption is that the Census population data do not include those experiencing homelessness, but the units produced include all units, including those produced for homelessness. 5 Thornberg, Christopher, Kleinhenz, R, Meux, E.,”Sonoma County Complex Fires: Housing and Fiscal Impact Report”, 2018, http://sonomaedb.org/WorkArea/DownloadAsset.aspx?id=2147564944

1,000 in the county for the previous several years, indicating that a scarcity of housing was
likely to continue without substantial increases in housing development.
The Beacon Economics analysis confirms our estimates that the deficit in housing in Sonoma
is likely to grow in the near term, with our projections being more conservative than those
offered by Beacon.
Housing Affordability
The preceding analysis uses aggregate estimates of housing supply and need. A critical
component of reducing the number of households experiencing homelessness in a
community is an adequate supply of housing that is affordable and available to those with
low incomes.
As evident in the chart below, trends in vacancy rates in Sonoma signal a tight housing
market overall, in line with the overall trend for the State.
Source: American Community Survey
Data compiled by the California Housing Partnership6 reveal that rents for a two-bedroom
home in Sonoma were flat in 2019 after rising by an annual average of 4.7% between 2013-
2018. Furthermore, in 2020 renters needed to earn 2.3 times the minimum wage to afford the
average asking two-bedroom rent in Sonoma County.
6 California Housing Partnership, “Housing Market Dashboard”, 2020, https://chpc.net/housingneeds/
0.0%
1.0%
2.0%
3.0%
4.0%
5.0%
6.0%
7.0%
2010 2011 2012 2013 2014 2015 2016 2017 2018
Rental Vacancy Rates 2010-2018
CA Sonoma

An analysis by Focus Strategies indicates that there is an acute shortage of housing that is
available and affordable to low income households in Sonoma County.7 As shown in the table
below, for every 100 households below 30% AMI, there were only 26 units that were
affordable (defined as equaling 30% or less of household income) and available in Sonoma
County; for every 100 households below 50% AMI, there were only 33 units affordable and
available.
Sonoma County Affordable Housing Gap Estimates
ELI
(0-30%,
incl. 0 inc,
or
Poverty)
Very Low
Income
(31-50%)
Low
Income
(51-80%)
Median
Income
(81-100%)
Above
Median
Income
(>100%)
Total
Across
all
Income
Levels
Rental Households within AMI
Category 14,681 10,513 14,824 8,234 23,285 71,537
All Rental Households at or below
Threshold Income 14,681 25,194 40,018 48,252 71,537 71,537
Units "Affordable and Available
and Adequate" at Threshold 3,806 8,423 28,122 43,909 73,290 73,290
Surplus (Deficit) of Aff. And Avail
Adequate Units (10,875) (16,771) (11,896) (4,343) 1,753 1,753
Aff. and Avail. Adequate units per
100 tenants at or below Threshold 26 33 70 91 102 102
Using Public Use Microdata Sample (PUMS) data from the Census, we analyzed the
distribution of ELI households and units with rents affordable to ELI households by County
region, as defined by Public Use Microdata Area (PUMA) codes. The results are provided in
the table below. Overall, we note a significant shortage of affordable units in each PUMA
code, with the highest gap found in the Santa Rosa region.8
7 Our estimate of the gap is based on the methodology used by the NLIHC in its Annual Gap Report (Aurand et al., “The Gap: A Shortage of Affordable Homes”,2020, https://reports.nlihc.org/sites/default/files/gap/Gap-Report_2020.pdf. 8 This analysis does not factor in availability (i.e., if the unit is vacant/is being rented to an ELI household); as such it represents the minimum estimate of need for ELI affordable units, by assuming that all existing ELI affordable units are rented to ELI households only).

ELI Housing Gap by PUMA Region
ELI
Units
ELI
Households ELI Gap
SC - North 3,000 4,580 (1,580)
SC - South (incl. Petaluma) 1,530 2,790 (1,260)
SC - Central (incl. Santa Rosa) 2,697 7,311 (4,614)
Total 7,227 14,681 (7,454)
Data from the California Housing Partnership9 show that Sonoma modestly boosted supply of
Low-Income Housing Tax Credit housing by 8% between 2016 and 2019 primarily through
new construction. However, the 423 units produced in 2019 are insufficient to meet the
existing and growing demand for affordable housing among low income households; they
represent just less than 4% of the needed number of units.
Racial/Ethnic Disparities
Racial and ethnic disparities in the likelihood of experiencing homelessness are linked with
over-representation among ELI households. The recent GAP report10 notes that disparities
exist in the likelihood of different racial and ethnic groups being classified as extremely low-
income renters. Specifically, Black, Native American and Hispanic households nationally are
more likely than White households to be ELI renters (20% Black population is ELI, as is 17% of
American Indian/Alaskan Native, and 15% of Hispanic, compared to 6% of non-Hispanic
White households).
For Sonoma, the data are slightly different for race compared with national data. For
example, when looking at race alone, 3.9% of Black-only households in the county and none
of the Native American-only households are ELI renters, compared with 6.8% of White
households. Asian households were only slightly more likely (7.9%) to be ELI renters than
White households. In contrast households reporting a different race (16.5%) or multiple races
(13.5%) were considerably more likely than White households to be ELI renters.
Disparities in the ethnicity of Sonoma ELI renters are in line with national estimates:
approximately 12% of Hispanic households were ELI renters, compared with 7% of non-
Hispanic households. Combining race and ethnicity into a single variable, our analysis
9 California Housing Partnership, “Housing Market Dashboard”, 2020, https://chpc.net/housingneeds/. 10 Aurand, Andrew, et al., 2020.

showed that White-only non-Hispanic households had a much lower likelihood of being ELI
renters (6.7%) than non-White and/or Hispanic households (10.8%).
COVID-19
The unprecedented drop in employment and economic activity due to COVID-19 has made
paying rent a tenuous prospect for many households. Using data from the Census Pulse
Survey, one firm has estimated that up to 42% of all rental households could face eviction
over the next four months due to inability to pay rent.11 The timing of increased evictions is
uncertain due to the California eviction moratorium, and has been a reprieve for many low-
income renter households. The eviction moratorium will not prevent or solve the issue,
however, unless there are funds available for rent relief to pay back-rent when the
moratorium lifts.
The Pulse data also show racial/ethnic disparities in confidence to pay the next month’s rent,
with a higher proportion of White rental households expressing high or moderate confidence
compared to African American, Hispanic, and multi-racial households. Current evidence also
indicates that African Americans, Native Americans, Asian-Americans, and Hispanics are
more likely to be hospitalized and die from COVID compared with White non-Hispanic
individuals at the national level.12 In Sonoma County, the disparities in the distribution of
cases by race/ethnicity are particularly salient for Hispanic residents, compared with White,
non-Hispanic residents, as evidenced in the next table.
11 Stout Consulting, 2020, https://www.stout.com/en/services/transformative-change-consulting/eviction-right-to-counsel-resources). 12 (CDC, n.d.) Retrieved on 8/23/2020 from https://www.cdc.gov/coronavirus/2019-ncov/covid-data/investigations-discovery/hospitalization-death-by-race-ethnicity.html.
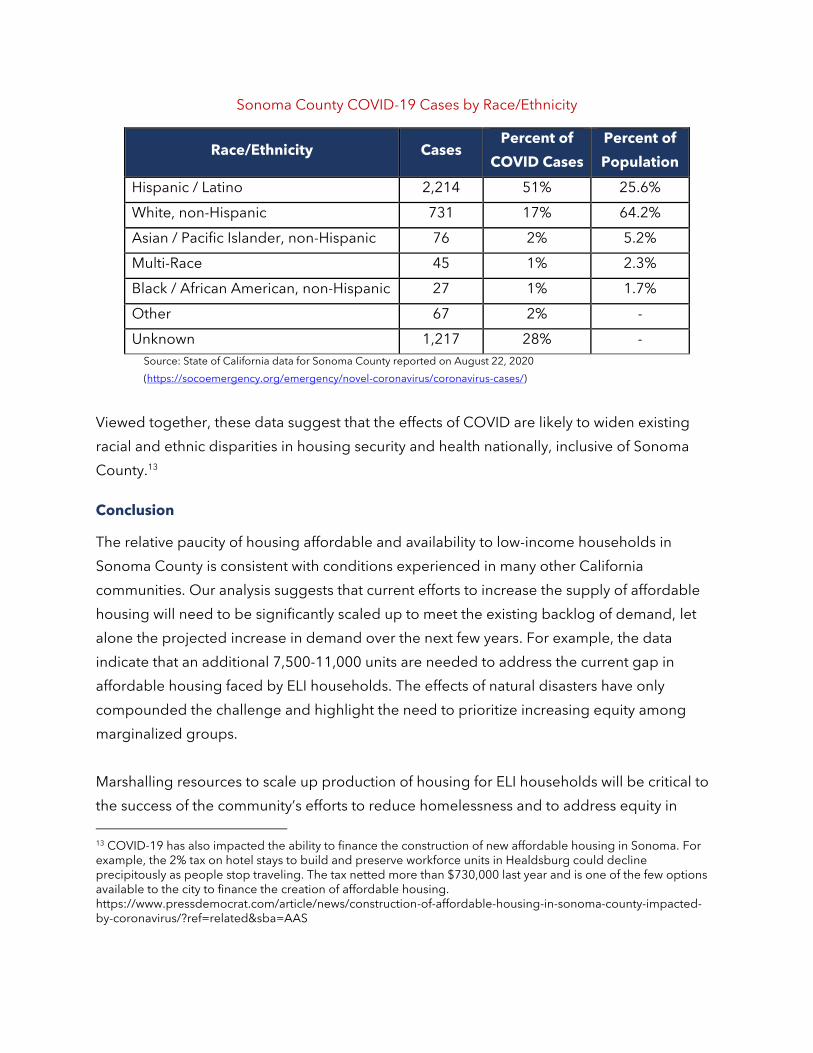
Sonoma County COVID-19 Cases by Race/Ethnicity
Race/Ethnicity Cases Percent of
COVID Cases
Percent of
Population
Hispanic / Latino 2,214 51% 25.6%
White, non-Hispanic 731 17% 64.2%
Asian / Pacific Islander, non-Hispanic 76 2% 5.2%
Multi-Race 45 1% 2.3%
Black / African American, non-Hispanic 27 1% 1.7%
Other 67 2% -
Unknown 1,217 28% -
Source: State of California data for Sonoma County reported on August 22, 2020
(https://socoemergency.org/emergency/novel-coronavirus/coronavirus-cases/)
Viewed together, these data suggest that the effects of COVID are likely to widen existing
racial and ethnic disparities in housing security and health nationally, inclusive of Sonoma
County.13
Conclusion
The relative paucity of housing affordable and availability to low-income households in
Sonoma County is consistent with conditions experienced in many other California
communities. Our analysis suggests that current efforts to increase the supply of affordable
housing will need to be significantly scaled up to meet the existing backlog of demand, let
alone the projected increase in demand over the next few years. For example, the data
indicate that an additional 7,500-11,000 units are needed to address the current gap in
affordable housing faced by ELI households. The effects of natural disasters have only
compounded the challenge and highlight the need to prioritize increasing equity among
marginalized groups.
Marshalling resources to scale up production of housing for ELI households will be critical to
the success of the community’s efforts to reduce homelessness and to address equity in
13 COVID-19 has also impacted the ability to finance the construction of new affordable housing in Sonoma. For example, the 2% tax on hotel stays to build and preserve workforce units in Healdsburg could decline precipitously as people stop traveling. The tax netted more than $730,000 last year and is one of the few options available to the city to finance the creation of affordable housing. https://www.pressdemocrat.com/article/news/construction-of-affordable-housing-in-sonoma-county-impacted-by-coronavirus/?ref=related&sba=AAS
access to affordable housing. As noted in our System Performance Report, data analysis
shows that temporary programs (emergency shelter, transitional housing) are not achieving
high rates of success in assisting households to secure housing upon exit. While some
performance improvement can be achieved through the provision of expanded rental
assistance, as well as case management, housing navigation and other services to help
households secure housing in the existing market, significant and sustained improvement will
require an expansion of housing supply.