housing finance mechanisms in brazil
DESCRIPTION
The real estate credit system used in Brazil for residential housing (known as the Housing Finance System-SFH), was created in 1964. Previously, there was no organized system for housing financing in Brazil. Its structure has changed since then (1964-2009), on matters of formal guarantees, limits and definition of the adjustment of payments.TRANSCRIPT

HOUSING FINANCE
BRAZILMECHANISMS IN
Sec1:i
United Nations Human Settlements ProgrammeNairobi 2010
HOUSING FINANCE MECHANISMS IN BRAZIL

ii
The Human Settlements Finance Systems Series
Housing Finance Mechanisms in Brazil
First published in Nairobi in 2010 by UN-HABITAT.
Copyright © United Nations Human Settlements Programme 2010
All rights reserved
United Nations Human Settlements Programme (UN-HABITAT)
P. O. Box 30030, 00100 Nairobi GPO KENYA
Tel: 254-020-7623120 (Central Office)
www.unhabitat.org
HS/115/10E
ISBN: 978-92-1-132225-5 (Volume)
ISBN: 987-92-1-132027-5 (Series)
Disclaimer
The designations employed and the presentation of the material in this publication do
not imply the expression of any opinion whatsoever on the part of the Secretariat of
the United Nations concerning the legal status of any country, territory, city or area
or of its authorities, or concerning the delimitation of its frontiers of boundaries.
Views expressed in this publication do not necessarily reflect those of the United
Nations Human Settlements Programme, the United Nations, or its Member States.
Excerpts may be reproduced without authorization, on condition that the source is indicated.
Cover photo: Celso Pupo/Shutterstock
Acknowledgements:
Director: Oyebanji Oyeyinka
Principal Editor and Manager: Xing Quan Zhang
Principal Author: João da Rocha Lima Jr.
Contributor: Claudio Acioly
English Editor: Tom Osanjo
Design and Layout: Andrew Ondoo

At the dawn of this
At the dawn of this
new urban era,
UN-HABITAT
research shows
that by 2030,
two-thirds of
humanity will be
living in towns
and cities. We
thus live at a time
of unprecedented, rapid, irreversible
urbanisation. The cities growing fastest are
those of the developing world. And the fastest
growing neighbourhoods are the slums.
Indeed, the global number of slum dwellers
is now at or close to the 1 billion mark.
Excessive levels of urbanization in relation to
the economic growth have resulted in high
levels of urban poverty and rapid expansion
of unplanned urban settlements and slums,
which are characterized by a lack of basic
infrastructure and services, overcrowding and
substandard housing conditions.
Yet housing and the services that should be
provided with it are one of the most basic
human needs. It is enshrined in various
international instruments, including the
Habitat Agenda. And reducing the number of
slum dwellers around the world is a cornerstone
of the Millennium Development Goals set to
fight poverty around the world. So if we fail to
achieve the Goals in towns and cities, we will
simply fail to achieve them at all.
It was with this crisis in mind that the United
Nations General Assembly decided in its
resolution of 26 February 2002 to transform
United Nations Commission on Human
Settlements into a fully pledged programme.
The General Assembly in its resolution called on
UN-HABITAT to take “urgent steps to ensure
a better mobilization of financial resources at
all levels, to enhance the implementation of
the Habitat Agenda, particularly in developing
countries.” It also stressed “the commitments
of member states to promote broad access to
appropriate housing financing, increasing the
supply of affordable housing and creating
an enabling environment for sustainable
development that will attract investment”.
The Habitat Agenda recognizes that housing
finance systems do not always respond
adequately to the different needs of large
segments of the population, particularly the
vulnerable and disadvantaged groups living in
poverty and low income people. It calls UN-
HABITAT to assist member states to improve
the effectiveness, efficiency and accessibility of
the existing housing finance systems and to
create and devise innovative housing finance
mechanisms and instruments and to promote
equal and affordable access to housing finance
for all people.
In our quest to reach as many people as
possible, a cornerstone of our agency’s new
Medium-term Strategic and Institutional Plan
is partnerships. We have no choice but to
catalyze new partnerships between government
and the private sector. This is the only way
to finance housing and infrastructure at the
required scale – the scale needed to stabilize
the rate of slum formation, and subsequently
reduce and ultimately reverse the number
of people living in life-threatening slum
conditions.
It is clear that in the coming 20 years,
conventional sources of funds will simply be
unavailable for investment at the scale required
to meet the projected demand for housing and
urban infrastructure. Many countries around
the world continue to face deficits in public
budgets and weak financial sectors. Local
governments have started to seek finance in
national and global markets, but this is only
in its initial phase.
FOREWORD
New mortgage providers have emerged,
including commercial financial institutions
and mortgage companies. But only middle
and upper income households have access
to such finance, while the poor are generally
excluded. Although social housing is becoming
less important in Europe and in countries with
economies in transition, the need to provide
shelter that is affordable to low income
households still exists, including in developing
countries.
This is why the exchange of information and
knowledge on human settlements finance
systems is so important. It is why it receives
increased recognition in facilitating the
development of human settlements finance
systems and in turning knowledge into action
for developing practical human settlements
finance methods and systems for these pressing
problems.
Our Human Settlements Finance Systems
series documents the state, evolution and
trends of human settlements finance in
member states, and examines the factors and
forces which drive the development of human
settlements finance systems and the roles of
different institutions and actors in shaping
the systems and trends, and reviews human
settlements finance systems. It presents an
interesting review of policies, instruments,
processes and practices. It examines the
strengths and weakness of these systems and
practices, their relations to the housing sector
and the broad economic and social sectors,
and lessons learned from practices.
Indeed, the country review studies we present
are a valuable resource for member States
because it is a body of work that also shows
how human settlements finance systems and
models can be applied to local use and thus
provide a wider range of options for human
settlements finance. The series also serves as
guidebooks for policy makers, practitioners
and researchers who have to grapple daily with
human settlements finance systems, policies
and strategies.
Anna Tibaijuka, Under-Secretary-General, United Nations
Executive Director, UN-HABITAT
v
CONTENTS
FOREWORD III
CONTENTS V
ABBREVIATIONS AND ACRONYMS VI
LIST OF TABLES AND FIGURE VII
PART I THE CURRENT HOUSING FINANCE SYSTEM: STRUCTURE 1
Introduction 1
Sistema Financeiro da Habitação-SFH Funding 2
Guarantee Fund for Length of Service - Retirement Institutional Fund 6
Leverage in the Sistema Financeiro da Habitação-SFH 6
Sistema Financeiro Imobiliário-SFI Funding 8
The Currency of the Systems 9
PART II LOW INCOME HOUSING 15
Introduction 15
The Federal Government Support Program 16
PART III HOUSING FINANCE IN BRAZIL 21
Macroeconomic Issues and the Sistema Brasileiro de
Poupança e Empréstimo SBPE 21
Main SBPE Players 28
Financing Systems in Numbers 29

vi
ABBREVIATIONS AND ACRONYMS
BCB -Banco Central do Brasil – Brazilian Central Bank
Bacen-Banco Central do Brasil – Brazilian Central Bank
BRL-Reais – Brazilian Reais
CDB-Certificado de Depósito Bancário - Bank Certificate of Deposit
CEF-Caixa Econômica Federal – CEF Public Bank for Savings and Real Estate Finance
CP-Caderneta de Poupança –Savings Account
CRI-Certificado de Recebíveis Imobiliários - Certificate of Real Estate Receivables
CVM -Comissão de Valores Mobiliários – Brazilian Securities Commission
FCVS -Fundo de Compensação de Variações Salariais - Salary Variations Compensation Fund
FGTS - Fundo de Garantia por Tempo de Serviço - Guarantee Fund for Length of Service - Retirement Institutional Fund
FGV -Fundação Getúlio Vargas - Getúlio Vargas Foundation
IBGE -Instituto Brasileiro de Geografia e Estatística - Brazilian Institute of Geography and Statistics
IGP-M-Índice Geral de Preços-Mercado - General Price Index
INCC-Índice Nacional da Construção Civil - National Construction Costs Index
IPCA -Índice de Preços ao Consumidor - Consumer Price Index
LH-Letras Hipotecárias – CDs dedicated to real estate, anchored in real estate mortgages
LI-Letras de Crédito Imobiliário – Real Estate Securities - Bank CDs, which funds are real estate finance dedicated
MW -Salário Mínimo – Brazilian Legal Minimum Wage
PNH-Plano Nacional de Habitação - Federal programme to promote the production and acquisition of houses
RDB -Recibo de Depósito bancário - Bank Receipt of Deposit (Bank CD)
SBPE -Sistema Brasileiro de Poupança e Empréstimos - Brazilian Savings and Loans System
SFH-Sistema Financeiro da Habitação – Brazilian Housing Finance System
SFI-Sistema de Financiamento Imobiliário – Brazilian Real Estate Financing System
TR-Taxa Referencial - Referential (basic) interest rate utilized on the Brazilian real estate financing system
USD -Dólares americanos – U.S. Dollars
vii
LIST OF TABLES AND FIGURES
Table 1: CP and LI Fund Raising on SFH system 3
Table 2: Taxa Referencial (TR of the SFH) and the CPI (IPCA-IBGE) 10
Table 3: Classes of Income and Subventions of PFH - I 18
Table 4: Classes of Income and Subventions of PFH - II 19
Table 5: Number of Households in Brazil and the Annual Increase Rate 27
Table 6: Housing Financing Level, According to the Funds Provider Source 29
Table 7: Number of Units Financed by SFH (SBPE+FGTS) 31
Table 8: Amount Financed from SBPE for Construction and Acquisition of Residences 32 Table 9: Financed Volume SFH (SBPE) and SFI (CRI) 33
Figures
Figure 1: Flow of Funds for Construction Finance on the Real Estate Finance Area of the Brazilian Private Banks 4
Figure 2: Flow of Funds for Mortgage Generation on the Real Estate Finance area of the Brazilian Private Banks 5
Figure 3: Funding System of SFH and FGTS Funds Applications 7
Figure 4: Inflation Indexes and TR Significance Against Inflation 11
Figure 5: Inflation Indexes, TR and Exchange Rate USD for 1 BRL 13
Figure 6: The Brazilian GDP Along the Last Years 23
Figure 7: The Brazilian GDP Per Capita Along the Las Years (BRL of 2008) 24
Figure 8: The Brazilian GDP Per Capita Along the Las Years (in USD) 24
Figure 9: The Brazilian Housing Financing System, as s Proportion of the GDP 26
Figure 10: Households in Brazil: Total and Increase Rate 27
Figure 11: Numbers of Units Financed by the SFH (SBPE+FGTS) 30
Figure 12: Amount Financed From SBPE for Construction and Acquisition of Residences 32
Figure 13: Financed Volume SFH (SBPE) and SFI (CRI) 33
Figure 14: Savings (CP) Volume and Annual Net balance of Deposits and Withdraws3 4
Figure 15: Housing Loans x Savings Volume in CP 35
Figure 16: Brazilian Regions 36
Figure 17: Number of Residential Units Financed (SBPE) According the Region 37

SOCIAL INVESTMENT FUNDSA TOOL FOR POVERTY REDUCTION AND AFFORDABLE HOUSING

1
PART I THE CURRENT HOUSING FINANCE SYSTEM: STRUCTURE
INTRODUCTIONThe real estate credit system used in Brazil for
residential housing (known as the Housing
Finance System-SFH), was created in 1964.
Previously, there was no organized system for
housing financing in Brazil. Its structure has
changed since then (1964-2009), on matters
of formal guarantees, limits and definition of
the adjustment of payments. However, the
core of the system has not changed and there is
no perception of movement, whether from the
State or private agents, so that sensitive changes
occur in its structure. This system, when in
conjunction with market fundraising systems,
via targeted instruments to raise conservative
savings funds in the market, is known as the
Brazilian Savings and Loans System - SBPE.
The SFH was complemented over time with
topical rules, and a new parallel system, the
SFI, was established in 1997, including rules
that facilitate foreclosure in the event of default,
and the creation of a differentiated structure
of fundraising for the funding of the system,
constituting mechanisms, which together are
called the Real Estate Financing System-SFI.
The SFI has served more like a supplement of
the SFH than a system that could replace it
in the medium-long term, being used more
extensively for commercial real estate, rather
than residential.
The SFH is established on a predominant
action of the State, and it is acknowledged
that the SFI can operate as a fully private
system, similar to what is practiced in the
USA. The SFH resources, although private,
are administered by the State, either by direct
and indirect action, this being represented by
the systemic function of the Caixa Econômica
Federal (CEF).
The transaction of SFI funds occurs fully
into the environment of the agents of the
private financial system, representing only the
normative function undertaken by the Central
Bank (BCB) and the Securities Commission
(CVM). CEF is a commercial bank,
controlled by the State, which has ancillary
functions as the managing agent of certain
functions in the SFH.
The Central Bank is the manager of Treasury
funds, the disciplinary agent and controller
of the currency and the manager of all the
Brazilian financial system. The Securities
Commission has the control and regulative
functions on the Brazilian capital market, and
has the authority of issuing and circulation of
private securities in the market.
SFH and SFI have different funding
structures, with different means for adjusting
the payments of housing financing in the long
term. While the legislation created a "specific
currency" to the SFH, SFI operates within the
parameters of the financial and capital markets.
This condition should be the premise for the
SFI to find easier funding, but the weakness of
the secondary market for investment vehicles
designed in it makes the system not to achieve
proper relevance. Therefore, the market
focused mainly on the SFH.
The SFH funds its operation in private savings
resources in Cadernetas de Poupança (CP),
which are savings private accounts, used by
medium income families to preserve their
savings and are fully Federal Government
PART I. THE CURRENT HOUSING FINANCE SYSTEM: STRUCTURE
2
HOUSING FINANCE MECHANISMS IN BRAZIL
guaranteed. The system, for low income
housing, uses funds deposited monthly in
private accounts of all employees by the
employers, constituting the Fundo de Garantia
por Tempo de Serviço (FGTS), designated
to be a retirement fund under government
administration.
Generally, the construction finance is done by
using the CP funds, the mortgages for medium
and high income uses the CP resources, and
the FGTS funds have the destination of low
income mortgage funding.
The SFI is funded trough investment
instruments that securitize mortgages, called
Certificados de Recebíveis Imobiliários (CRI).
In this system, which is very inexpressive,
when compared to SFH, for construction,
the banks use regular funds to finance and the
proceedings of CRIs placement with investors
(pension funds in majority) to finance the
acquisition of the homes.
SISTEMA FINANCEIRO DA HABITAÇÃO-SFH FUNDING
Fundraising InstrumentsIn order to raise funds in the SFH system, its
operators, which are banks with real estate
finance and credit portfolio, mostly private, rely
on two sources of conservative savings funds-
i). deposits in savings accounts (Cadernetas
de Poupança - CP), and ii). Letras de Crédito
Imobiliário (LI), being savings, by far, the most
important instrument for fundraising. The
Brazilian banking system favors the concept
of multiple banks that operate portfolios, for
which specific licenses are obtained from the
Central Bank: commercial banking, investment
banking and housing finance banking. Thus,
for a bank to integrate the SFH, it must obtain
specific authorization to operate its portfolio
of housing finance banking and authorization
that extends from the uptake in CP or LI to
financing the production and purchase of
residential and commercial properties using
the resources raised. Among the biggest
players in Brazil SFH are banks controlled by
the Federal Government: Caixa Econômica
Federal, Banco do Brasil e Nossa Caixa. There
are also several private banks operating in the
SFH.
Savings Accounts (Cadernetas de poupança - CP)The savings accounts (CP) are savings
instruments with free deposit and withdrawal,
unlimited scope and bearing an important
incentive in the market - their income is
exempt from income tax. CP represents the
easier access to financial markets and are used
by the majority of the population able to make
savings, especially the middle-income strata.
The balances of the CP are guaranteed by
the Federal Government, without limitation.
The CP pay interests that are ruled by law.
Therefore, there is no competitiveness to be
pursued by banks to increase their fundraising
level. The interest rate paid for CP savers has
always been 0.5% month, plus an “index” that
represents the inflation, which means that CP
pays an effective 0.5% month of interest.
Real Estate Securities (Letras de Crédito Imobiliário -LI)The LI are debt securities with fixed-term,
monthly income and free depreciation system
issued by financial institutions and intended
to capture savings as a regular CD. These
are not instruments used in large amounts,
because they collide with the CP market,
which has a simpler structure of operation.
LI is used to raise funds for qualified investors
who, according to the instructions of the
Brazilian capital market, have a significant
portfolio of investments in the market for
which investment products are designed, being
the minimum unit value 300,000 BRL (USD
166.667)1 . LIs can be used for fundraising by
banks that do not have a widespread network
of agencies, because they can pay free interest,
1 Exchange rate:1.00 BRL (Brazilian Real) – 1.80 USD (U.S. dollars)

3
PART I THE CURRENT HOUSING FINANCE SYSTEM: STRUCTURE
allowing reaching qualified investors, with
greater savings potential. However, given
the knowledge that the market already have of
the CP and that the housing finance business
is operated primarily by major Brazilian
banks, which holds a high penetration branch
network, the LIs are used moderately and do
not represent a significant vector of funding
for the system.
TABLE 1: SAVINGS ACCOUNTS (CP) AND LETRAS DE CRÉDITO IMOBILIÁRIO (LI)
Year Saving Volume in CP LI Issuing CP in Total Fund Raising
BRL Million BRL Million %
1996 59,419 6,131 90.6%
1997 80,250 7,666 91.3%
1998 88,538 8,627 91.1%
1999 90,438 7,126 92.7%
2000 91,430 8,131 91.8%
2001 97,146, 9,967 90.7%
2002 112,423 10,005 91.8%
2003 115,258 12,671 90.1%
2004 126,853 12,320 91.1%
2005 135,412 10,911 92.5%
2006 150,413 9,585 94.0%
2007 187,827 8,851 95.5%
2008 215,400 9,991 95.6%
Sources: SBPF-SFH, BACEN
The Application of Sistema Financeiro da Habitação-SFH Resources The housing financing banks in Brazil finance
the construction and acquisition of houses
using a particular source of funding of the
CP associated with the revenue stream of
returning acquisition funds that are already
in repayment. The return flow of housing
finance represents a stable contribution to
the funding of the system, but deferred in the
end. Any procedure with the securitization
of mortgages would advance this contribution,
which would use resources from outside the
SBPE, gaining volume in the medium term.
Through securitization of mortgages, one can
access domestic savings in pension funds, for
example, as is the strategy of market systems to
spread throughout more developed economies.
Working, however, with the mortgages
internalized in the portfolio of banks, the
housing finance system in Brazil operates with
zero leverage.
Funding for purchase of the residence follows
the construction and does not need to be
done within the same agent. The rules of
the system allow some banks to specialize in
financing the construction and others to deal
with mortgages only. What is perceived as the
main intention in this industry is to finance
mortgages, not the construction, being noted
that private banks do finance production
without desire, but only as a mechanism for
generating mortgages.
4
HOUSING FINANCE MECHANISMS IN BRAZIL
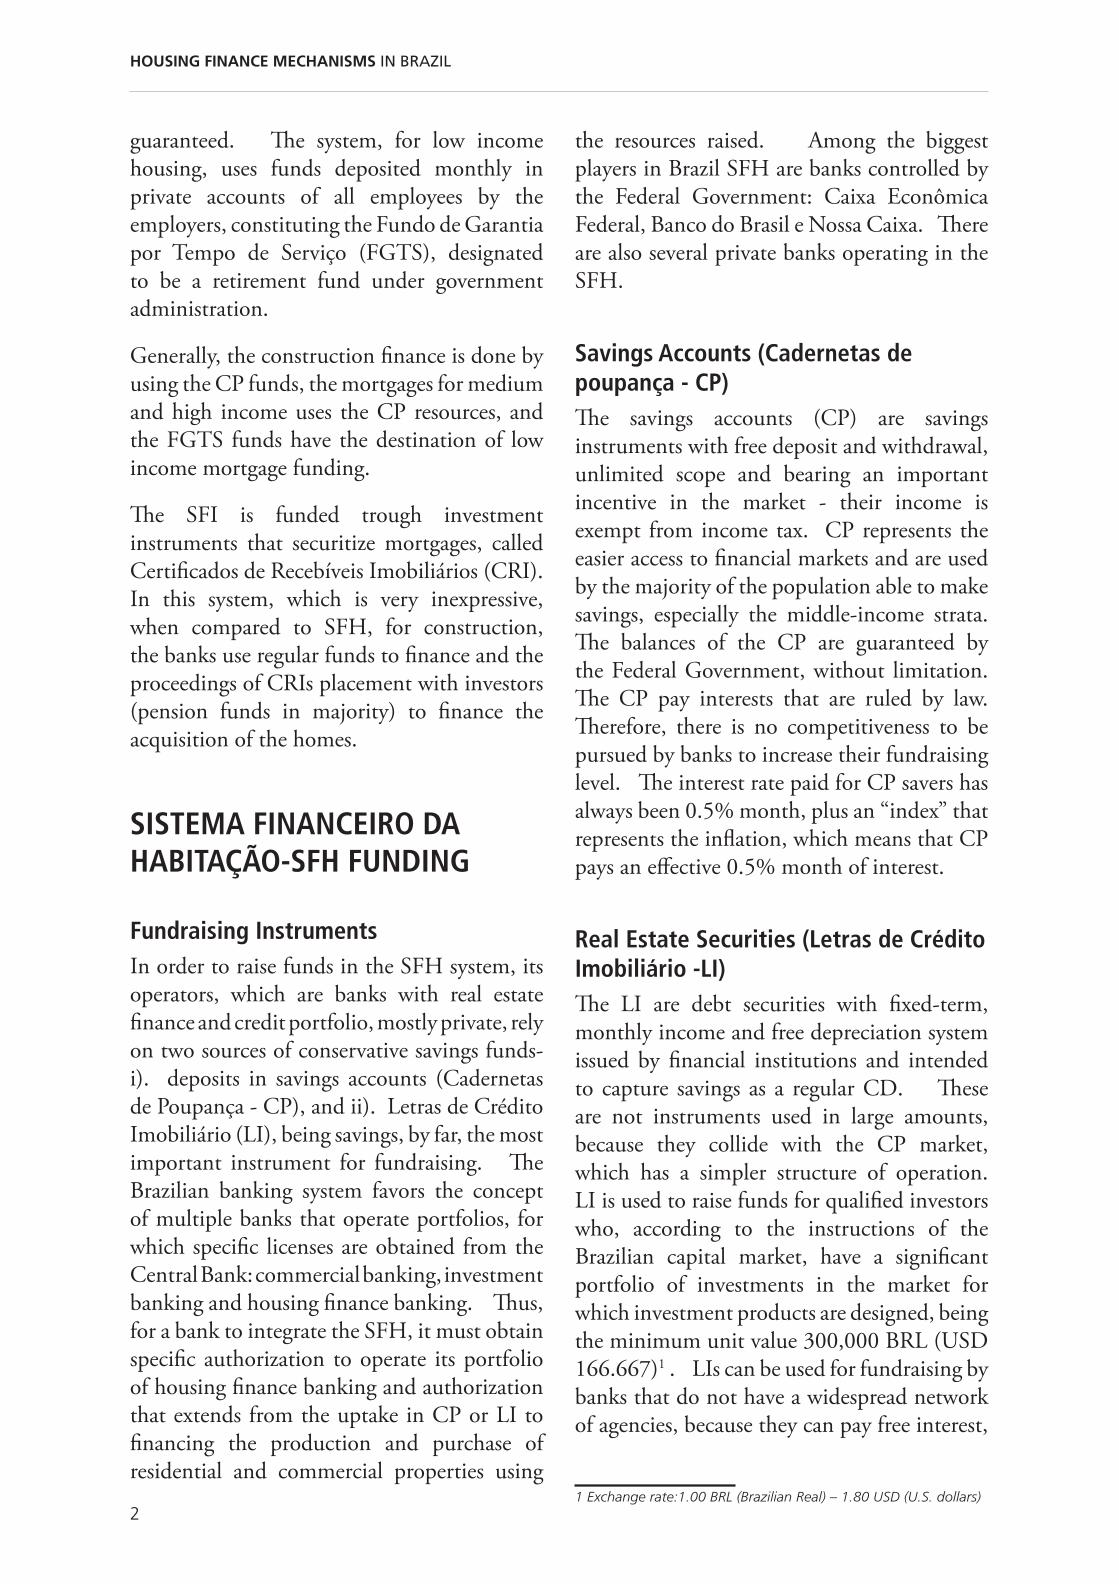
The regulatory mechanisms of the SFH-system
commands to collect, from the values raised:
to the Central Bank a compulsory 20
percent. Central Bank pays to the banks
the same interest rate that is paid to the
savings accounts, meaning that, for
the banks, that part has is a zero profit
operation;
65 percent has to be directed to housing
finance. From this part, the application of
52 percent is normalized by SFH for low
and middle income housing (interests, loan
to value and length) being the remaining
13 percent free (unregulated as interests,
loan to value and length) to be used either
in production or acquisition, for medium
or high income;
that leaves the remaining 15 percent of
funding free to apply the operating banks,
but targeted at companies in the real estate,
credit derivatives or investment derivatives
in the sector, or even in government
securities. It is noteworthy that, due to
high interest rates practiced in Brazil, in
the remuneration of public bonds (rate),
the arbitration between the yields paid
to CP against income from bonds would
tend to cause a passive implementation of
this part of the raised funds.
Figure1 shows the flow of funds for
construction finance on the real estate finance
of the Brazilian private banks.
In Figure 1 it is noted the movements in
financing the construction, highlighting the
temporal asymmetry between the two flows
of resources. The CP depositary is free to
redeem each month and the construction
finance, where the funds are allocated, has a
higher length of liquidity cycle, considering
that the construction finance is paid with the
issuing and placing of mortgages.
As for the imbalance that might occur there is
no mechanism to hedge the bank and should
be supported with other resources from the
bank cash flow, which can cause asymmetry of
yield, generating operating losses. In the case
of funding with the issuing of LI, even though
this is an insignificant stratum of the market
that banks tend to ignore, the asymmetry could
be lower, given the possibility of issuing LI in
conjunction with construction financing.
MULTIPLE BANKReal Estate Finance
authorized
Savings on the CP depositaryretention of funds =at least 1 month mandatoryto receive interests
20% to Bacensame yield as
CP savings
65% +15% on construction financeretention of funds =-12 to 18 month average to build and receive the return via mandatoryplacement
asymmetric
FIGURE1: FLOW OF FUNDS FOR CONSTRUCTION FINANCE ON THE REAL ESTATE FINANCE OF THE BRAZILIAN PRIVATE BANKS
Source: Author
5
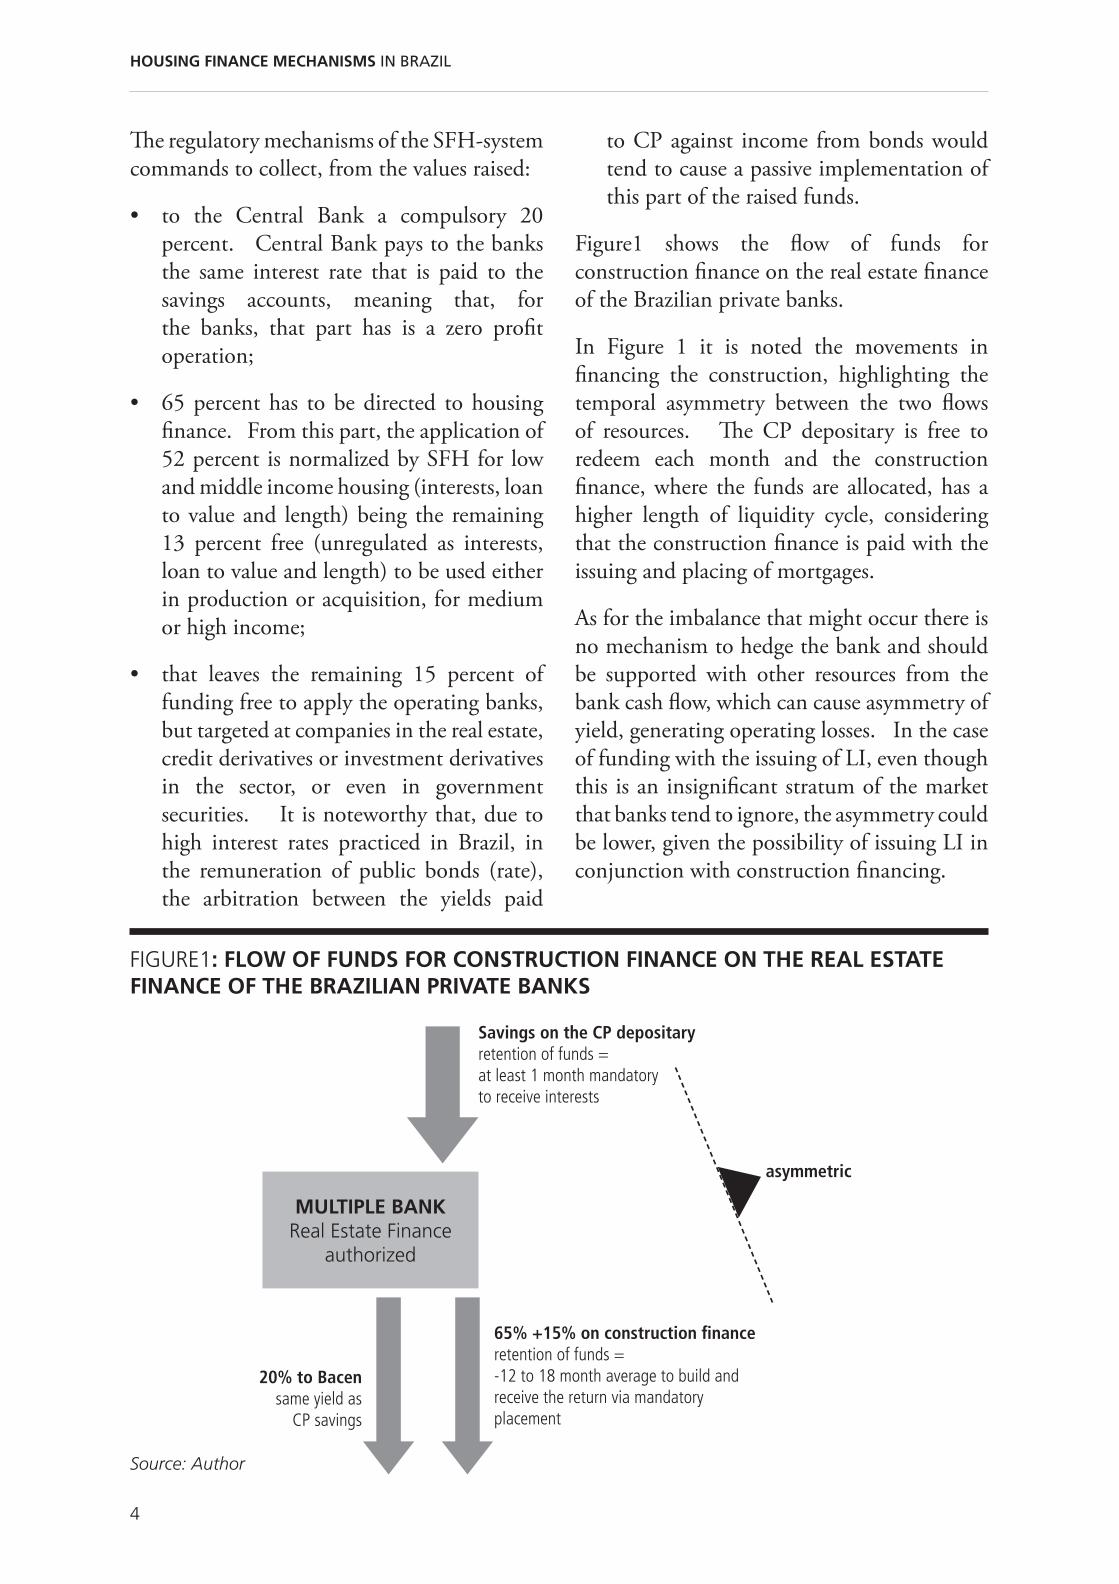
PART I THE CURRENT HOUSING FINANCE SYSTEM: STRUCTURE
HOUSE BUYERSReal Estate DEVELOPER
MULTIPLE BANK Real Estate authorized
Savings on the CP depositaryretention of funds =at least 1 month mandatoryto receive interests
20% to Bacensame yield as
CP savings
house acquisition finance retention of funds=
monthly payments on 20/30 years cycle
construction finance
repayment of construction finance with the mortgages
highly asymmetric
FIGURE 2: FLOW OF FUNDS FOR MORTGAGE GENERATION ON THE REAL ESTATE FINANCE OF THE BRAZILIAN PRIVATE BANKS
Source: João da Rocha Lima Jr. (2010)
A Multiple Bank showed in this Figure 1
regards the banks structure in Brazil. The
Central Bank gives particular operations
authorization for the different banks operations
as commercial banking, investment banking,
real estate finance, leasing, international
trade, etc. A multiple bank is a bank that
has multiple activities, in this Figure including
real estate.
In Figure 2, it is shown the full construction
financing circuit, with the creation of
mortgages, highlighting the pronounced
temporal asymmetry that can be hedged
via securitization instruments or mortgages
transfers to the system administered by CEF.
It should be noted, however, that mortgages
securitization instruments in Brazil are used
scarcely due to almost non-existent secondary
market liquidity.
The contracts of construction finance are
assigned at interest rates that vary between 11%
and 15% year, plus the inflation adjustment.
The funds are liberated monthly, according
to the completion of the construction phases,
should be paid in full (principal and interests)
at the end of the construction, what is made
by the placement of the mortgages generated
trough the acquisition finance. The guaranties
required for the construction finance are the
land and construction as collateral.
6
HOUSING FINANCE MECHANISMS IN BRAZIL
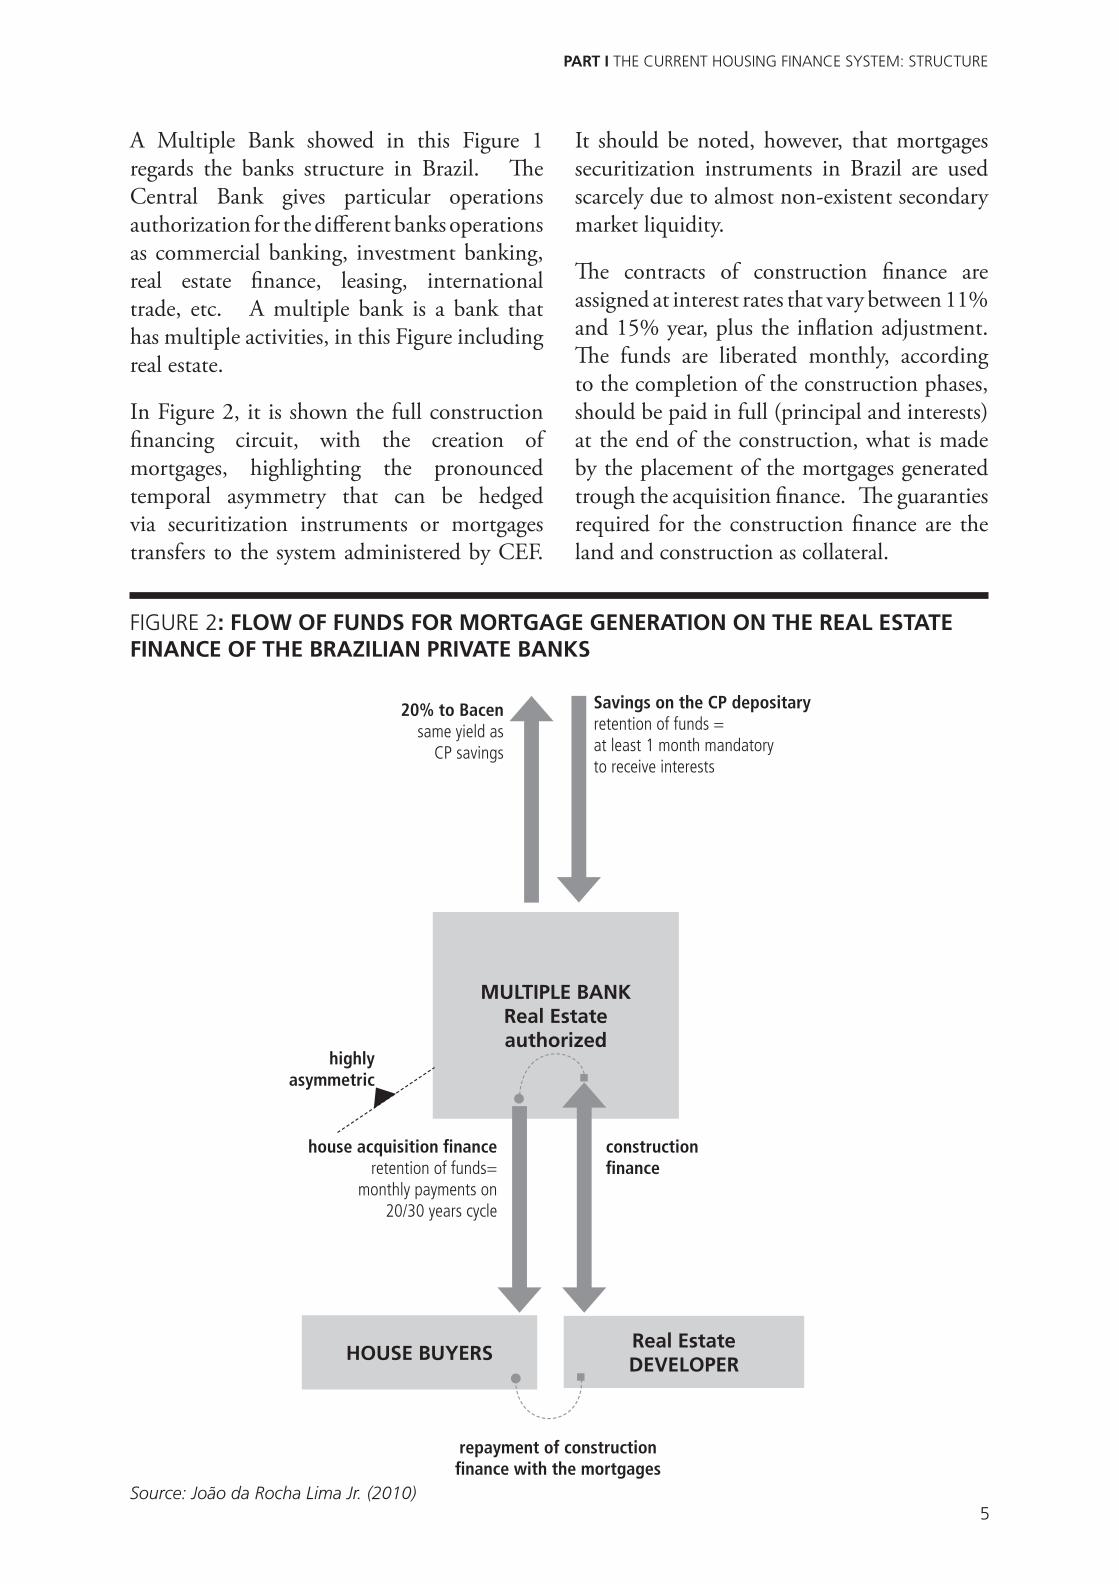
GUARANTEE FUND FOR LENGTH OF SERVICE-FGTS (RETIREMENT INSTITUTIONAL FUND)CEF has, almost alone in the market, the role
of housing finance for the classes of lower
middle to low income, and compete with the
private financing for middle-income classes.
For the funding for low-income and urban
infrastructure, CEF can use the resources
managed by itself in connection with the
payments to the Guarantee Fund for Length
of Service – Fundo de Garantia por Tempo de
Serviço (FGTS).
The FGTS was created at the origin of the SFH,
as an instrument of employment policy, but
linked to the housing finance system, involving
the urban infrastructure and housing.
Employers in the whole country should
collect 8 percent of monthly salary paid
to each employee to a private employee’s
account with the FGTS. This fund builds,
then, a compulsory savings for the employee,
anchored by his employer and resources of
each individual account are blocked until
retirement (30 years) and can be accessed in
exceptional circumstances, for example, for
housing acquisition, or early retirement due
to health conditions. The employee does not
collect any amount from his monthly wage to
his FGTS account.
The FGTS is administered by CEF and can
provide resources, as a second-tier bank, in
the purchase of mortgages generated by first-
tier banks in the financing of housing whose
income levels the council fund manager
regularly sets. The Federal Government,
being the driver of CEF and controller of the
board of the fund, ends up directing resources
to meet their policies for housing, especially
for families with lower incomes.
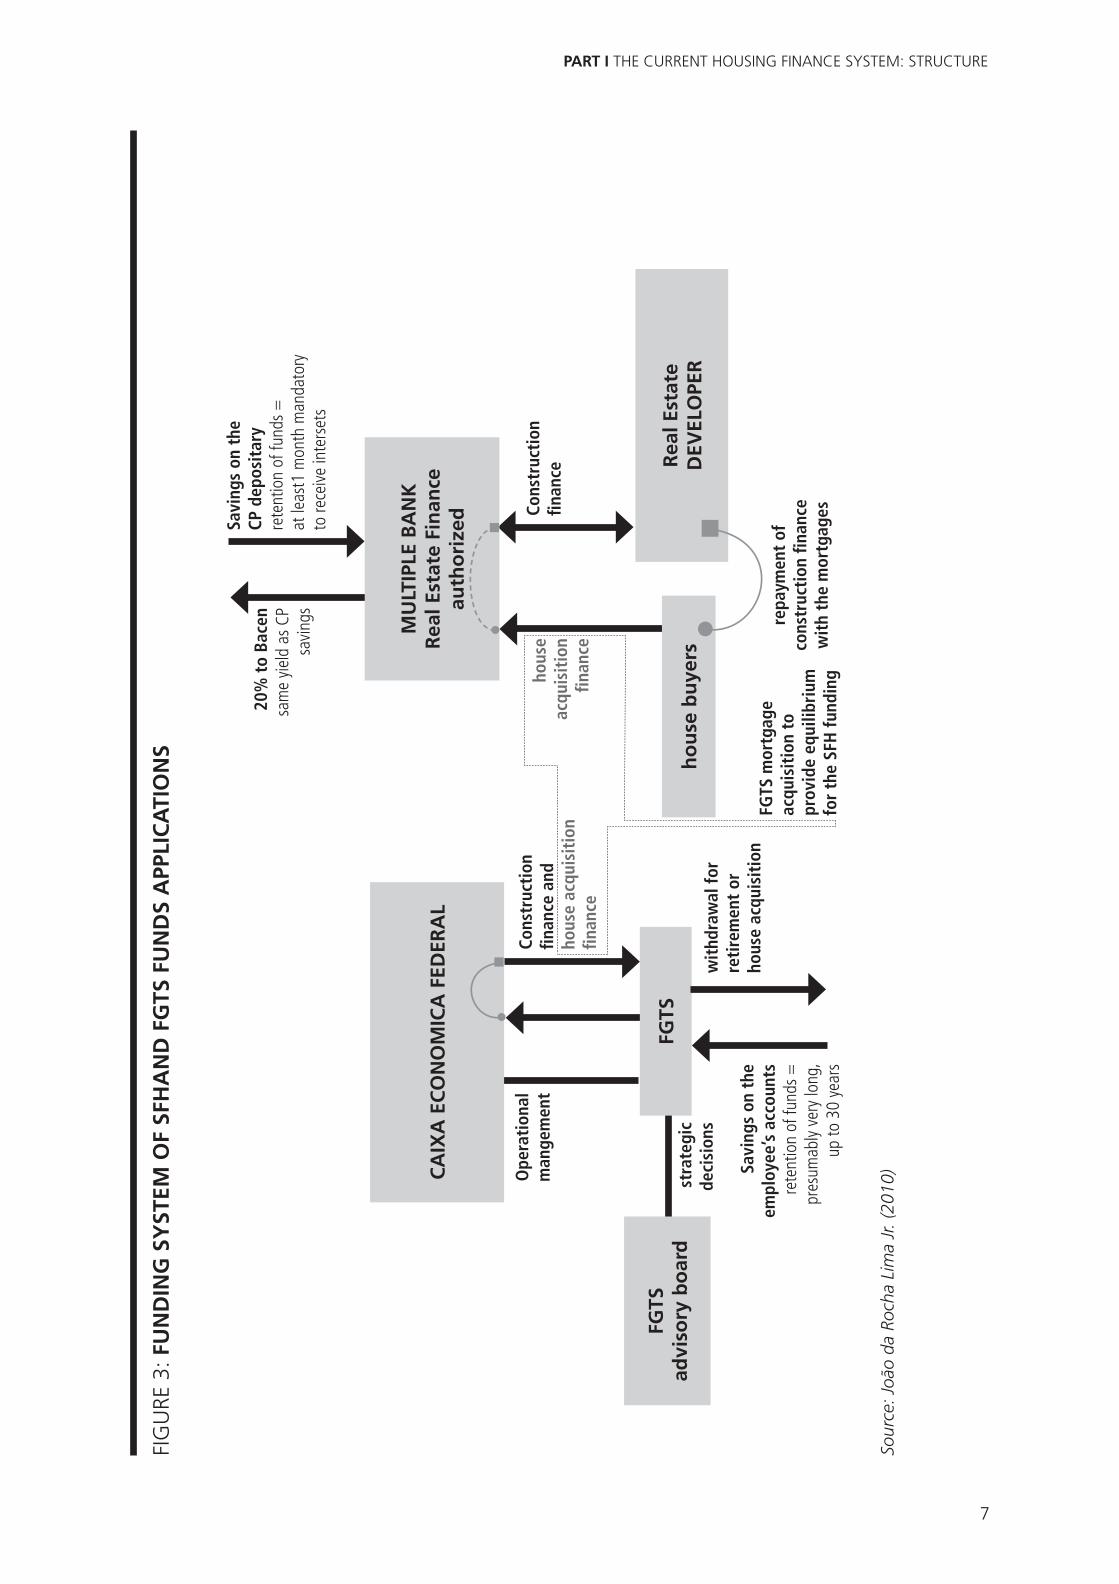
Figure 3 shows the overall funding structure
of the SFH in Brazil, at the production and
acquisition, noting that the system can only
maintain a certain degree of balance when
one takes into account the reallocation of
resources collected by FGTS to tackle falls in
savings balances, whose resources are tied up
in buildings or mortgages.
LEVERAGE IN THE SISTEMA FINANCEIRO DA HABITAÇÃO-SFHAs can be seen, the SFH system is locked and
has no leverage, in the sense that the returns
of the payment of house financing restore
funding to run the system. In housing finance
systems found in most advanced economies,
mortgages are the subject of securitization,
which advances receivables to re-fit the system
of financing the construction and purchase of
houses with the intrinsic benefits and risks of
this routine.
In Brazil, the SFH funds the production
system providing a moderate rate of growth,
to maintain a structure of the organic stream.
This is done with compulsory collection
of resources in the voluntary fund and CP,
which tends to increase following virtuous
movements of the economy, but is stabilized
in its potential, or even goes in critical cycles of
decline of the economy. The SFH of course,
recycles their finances with the flow of loan
payments internalized in mortgages, but in its
natural speed of cash flow origination (20 to
30 years), the flow can be directly impacted
by defaults.
7
PART I THE CURRENT HOUSING FINANCE SYSTEM: STRUCTURE
FGTS
advi
sory
bo
ard
Rea
l Est
ate
D
EVEL
OPE
R
CA
IXA
EC
ON
OM
ICA
FED
ERA
L
FGTS
MU
LTIP
LE B
AN
KR
eal E
stat
e Fi
nan
ce
auth
ori
zed
ho
use
bu
yers
Savi
ngs
on t
he
CP d
epos
itar
yre
tent
ion
of fu
nds
=at
leas
t1 m
onth
man
dato
ry
to re
ceiv
e in
ters
ets
20%
to
Bace
nsa
me
yield
as
CP
savi
ngs
Savi
ngs
on t
he
empl
oyee
’s a
ccou
nts
rete
ntio
n of
fund
s =
pres
umab
ly ve
ry lo
ng,
up to
30
year
s
stra
tegi
c de
cisi
ons
Cons
truc
tion
fin
ance
and
ho
use
acqu
isit
ion
finan
ce
hous
e ac
quis
itio
n fin
ance
wit
hdra
wal
for
reti
rem
ent
or
hous
e ac
quis
itio
nFG
TS m
ortg
age
acqu
isit
ion
to
prov
ide
equi
libri
um
for
the
SFH
fund
ing
repa
ymen
t of
co
nstr
ucti
on fi
nanc
e w
ith
the
mor
tgag
esCons
truc
tion
fin
ance
Ope
rati
onal
m
ange
men
t
FIG
URE
3: F
UN
DIN
G S
YST
EM O
F SF
HA
ND
FG
TS F
UN
DS
APP
LIC
ATI
ON
S
Sour
ce: J
oão
da R
ocha
Lim
a Jr.
(201
0)

8
HOUSING FINANCE MECHANISMS IN BRAZIL
SISTEMA FINANCEIRO IMOBILIÁRIO-SFI FUNDING In 1997, there was an attempt to reverse the
SFH to a system relying solely on capital market
mechanisms, having been established in Brazil
the SFI (Real Estate Financial System). The
most important attribute of the system is that
the SFI unlocks legal problems of foreclosures
in Brazil, which is slow and unwieldy, because
foreclosures are done within the judiciary.
The SFI is designed to operate as liens on
property, making it easier to foreclose on the
defaults, thereby serving to transfer lower risk
instruments for securitization of mortgages
generated based on the rules of SFI.
Funding for ProductionThe funding for production is not ruled by
means of its own instruments, i.e. mortgage
companies and securitization companies.
Together with the commercial banks in their
lending to companies, comprises all the
financial agents, which will use the funding
market, using the instruments utilized in the
regular funding of business (e.g. debentures)
and banks (certificates of deposit, for
example), and the financing to build granted
at market interest rate. It should be noted
that in SFH, in view of the fund raising cost
(income of CP), 52 percent of applications
are mandatory for financing housing for low-
income families. Mortgage companies,
authorized by the Central Bank to operate
only in real estate lending by the SFI, can
raise funds from qualified investors through
Letras Hipotecárias (LH), which are mortgage
securitization instruments.
Housing Acquisition MechanismFunding for acquisition of housing might be
done directly by the entrepreneur, without
mortgage, but with the concept of fiduciary
disaffection. The flow of receivables
(installments) derived from this contract is
sold to the securitization companies, asset
against which these companies may issue
Certificates of Real Estate Receivables (CRI),
which in turn work like any instrument of
mortgage securitization in the international
market (CMO, for example). It is intended
that the CRI have a market with institutional
investors, but, in view of an almost non-
existent secondary market, such investments
must remain within the portfolio of investors
by the time of funding (20 to 30 years), which
restricts its placement.
For enterprises for higher income classes, whose
funding may be made at shorter intervals (5 to
7 years), the CRI has a greater chance of use,
but this represents a small market segment. In
another sense, this legislation which authorizes
a certain amount of CRI that has been issued,
is bound to flow from rentals (usually 5 to
7 years) in commercial investment in the
model build-to-suit. There are CRIs issued
to securitize future flow of locations in
shopping centers, but these instruments are
very specific and niche markets. Since they
are being used in very specific strata markets
(high income, build to suit and shopping
centers), the investment vehicles that would
serve to leverage the CRI did not acquire the
necessary strength, so that the large residential
market continues to operate without leverage,
anchored especially in the SFH.
9
PART I THE CURRENT HOUSING FINANCE SYSTEM: STRUCTURE
THE CURRENCY OF THE SYSTEMLong-term debt in Brazil has been structured
with the support of virtual currencies. The
high inflation periods suffered by the
Brazilian economy, which is still mindful of
the financial and capital market and led to
nominal currency swaps in the past until the
sedimentation of the Real in 1994, has not
added confidence to investments in long-term
financial instruments, which balances are not
adjusted for any inflation-tied index. Since its
inception until 1991, SFH had worked with
its own currencies (UPC, OTN, ORTN and
BTN), all of them with adjustments arbitrated
by the Federal Government, tied with inflation
rates but differentiating from there, with the
creation of a short-term indexing currency,
linked with the interest offered for fixed-
income from financial markets.
The systems structured with virtual currencies
along this period (1964-now) converts the
real applications (savings) or the real debts
(finance) in a certain virtual currency and
applies interests in the balances considering the
virtual currency. Each payment or investment
redeem is converted in reais at the transaction
moment. All the transactions are based in reais,
but all the accounting is based on the virtual
currency. The conversion rate of the virtual
currency and the real is regularly (monthly or
even daily in certain critical moments in the
past) defined by the Government, based on a
certain inflation index, or an inflation based
index how it is today.
The Experience of the Fundo de Compensação de Variações Salariais-FCVS on the Sistema Financeiro da Habitação-SFH SFH had always suffered from the issue of
inflation adjustment, especially in the 1964-
1994 cycle, in which it seemed to crumble
completely when an insurance system for
inflationary adjustments was created, through
the Salary Variations Compensation Fund
(FCVS) whose risk was supported by the
Federal Government. It was always understood
that the primary sources of funding (CP and
FGTS) should first be protected from the losses
caused by inflation and then remunerated (3
percent per year in the FGTS and 0.5 percent
per month on CP). Therefore, funding for
the acquisition of residences should undergo
adjustment of the balance through the same
rates applied to sources of funding, to impose
the required symmetry of the SFH system.
It was evident that in times of inflation crisis,
the wages of borrowers of housing loans
did not keep with the curves of monthly
inflation, which boosted the default. Federal
government then decided to counter the
symmetry, by adjusting the debit balances
of contracts through the same inflation rates
that adjusted the sources of funding (CP and
FGTS), monthly, but not the installments
and the payments of buyers that was adjusted
through indexes that reflected the adjustments
of salaries, every six months.
A fund, the FCVS, was created, and its
resources should cover the debit balances
outstanding funding agreements, recorded
at the end of the payment due to the lack of
symmetry of inflation adjustment. Buyers
had to contribute to the formation of FCVS,
following a set fee applied on the value of the
monthly payment. This insurance plan was
ill defined and calibrated, resulting in a debt
of the Federal Government, which has been
settled gradually, but that was in default for a
few years and which amount exceeded USD
100,000 million.
The SFH had even been through a period of
inaction, caused by this default of the FCVS,
with the banks that held the mortgages with
outstanding balances and any benefits already
paid. Banks had an uneven balance between
its obligations to the CP and the perceived
benefits of the financing contracts, whose
stability was only recomposed with the release
of claims against accounting FCVS,
10
HOUSING FINANCE MECHANISMS IN BRAZIL
but that does not reflect cash flow, if there were
any strong pressure of looting in CP, or the
obligations to the FGTS. This cycle ended in
the transition to the twenty-first century, with
the assumption by the Federal Government
of a program for settlement of claims against
FCVS and enhancing the SFH, the CP and
the FGTS.
The Recasting of the Sistema Financeiro da Habitação-SFH, with the Introduction of Taxa Referencial-TRIn 1991 which was a period of high inflation in
Brazil, where economic plans succeeded often
by looking at the change of currency, it had
already withdrawn the correction for inflation
of two action lines of the SFH (funding and
debt financing). It introduced the concept
of the TR (a basic rate defined specially for
the system – fund-raising and lending are
TR referenced), which brings closer to the
financial market system, in monthly regimen.
This concept is sustainable for the uptake in CP,
but maintains the same instability previously
found with respect to the balance between the
setting of wages and the provision of funding
for the purchase of houses. Through the
TR, the most new currency of the SFH was
created, based on resource revenues in time
deposits (bank certificates of deposit CBD
and bank receipt of deposit RDB) offered by
commercial banks, and no longer in inflation
rates.
The TR is calculated daily by the Brazilian
Central Bank, is valid for a month and is
based on the average of a basket of returns
offered by CDB and RDB market, applied a
reducer (deflator), which seeks to deduct the
inflationary component and the differential
taxation of tax income from a financial
investment in those instruments and the
application in CP.
As this virtual currency (TR index) is selected
in short-term applications, the long-term debt
and investments of SFH end up functioning
as a chain of short-term applications and debt,
which in the macroeconomic sense means an
asymmetry, because it perpetuates the short
term, that should move following higher
interest rates than those attributed to long-
term and conservative applications, as are
the CP for savers and as is the mortgage for
banks.
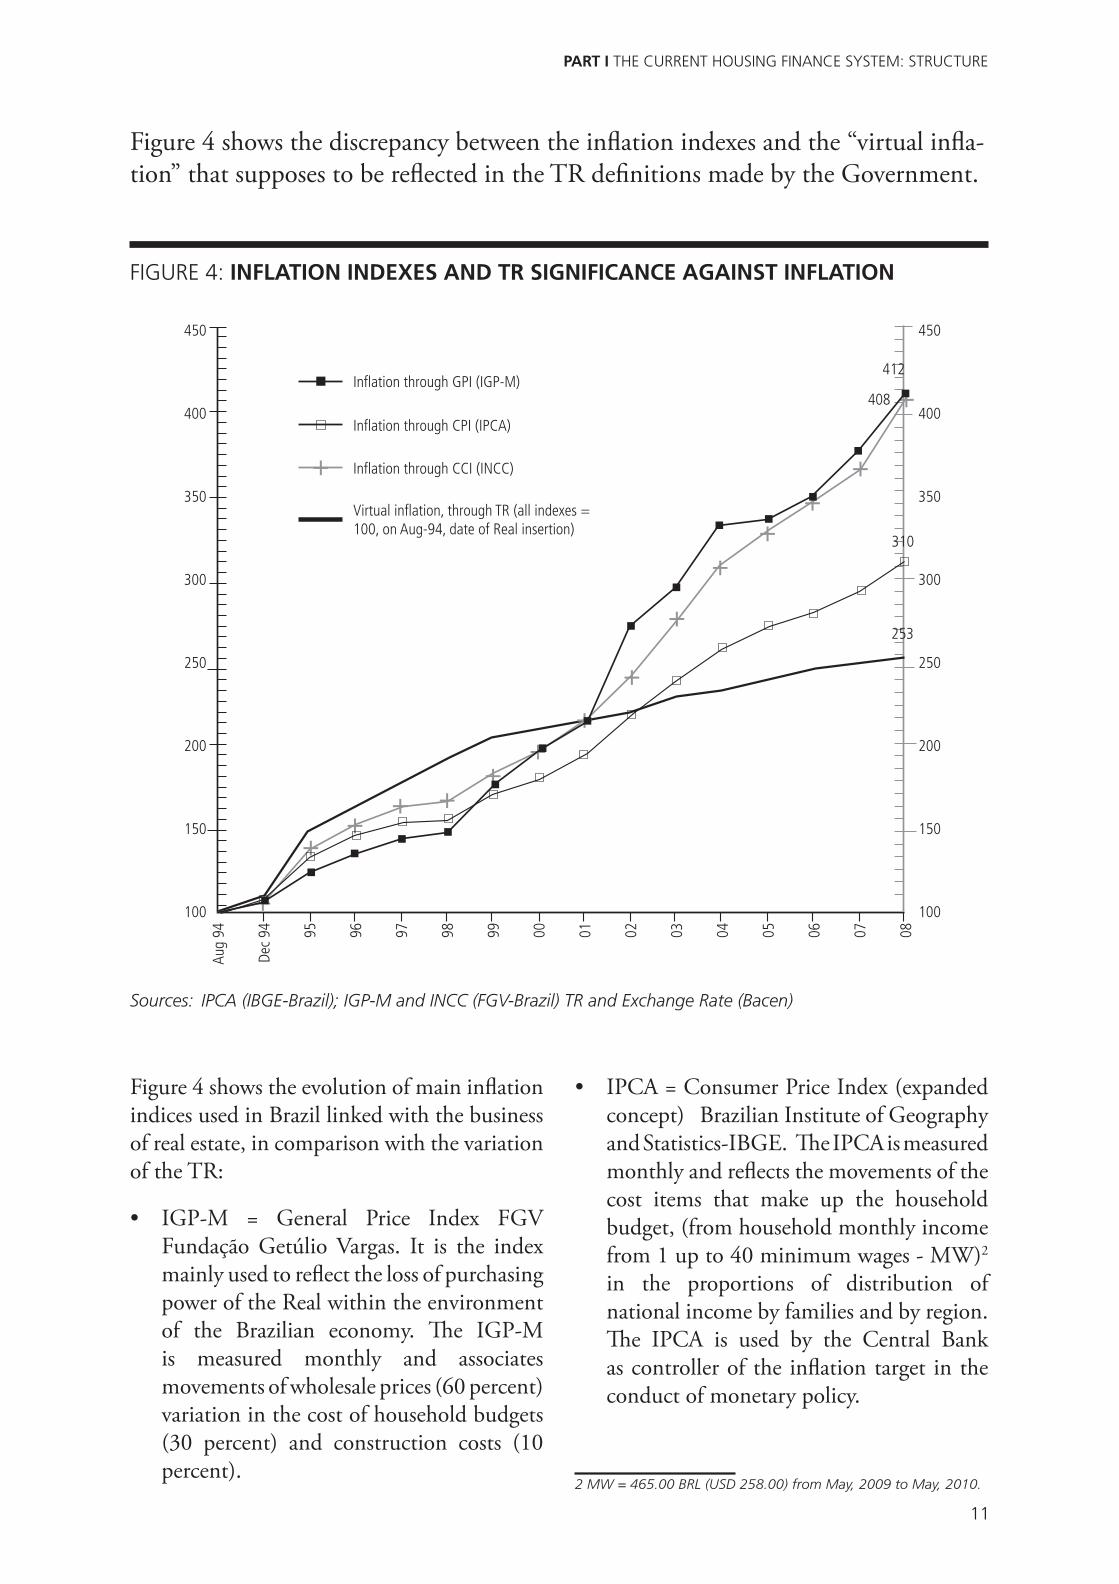
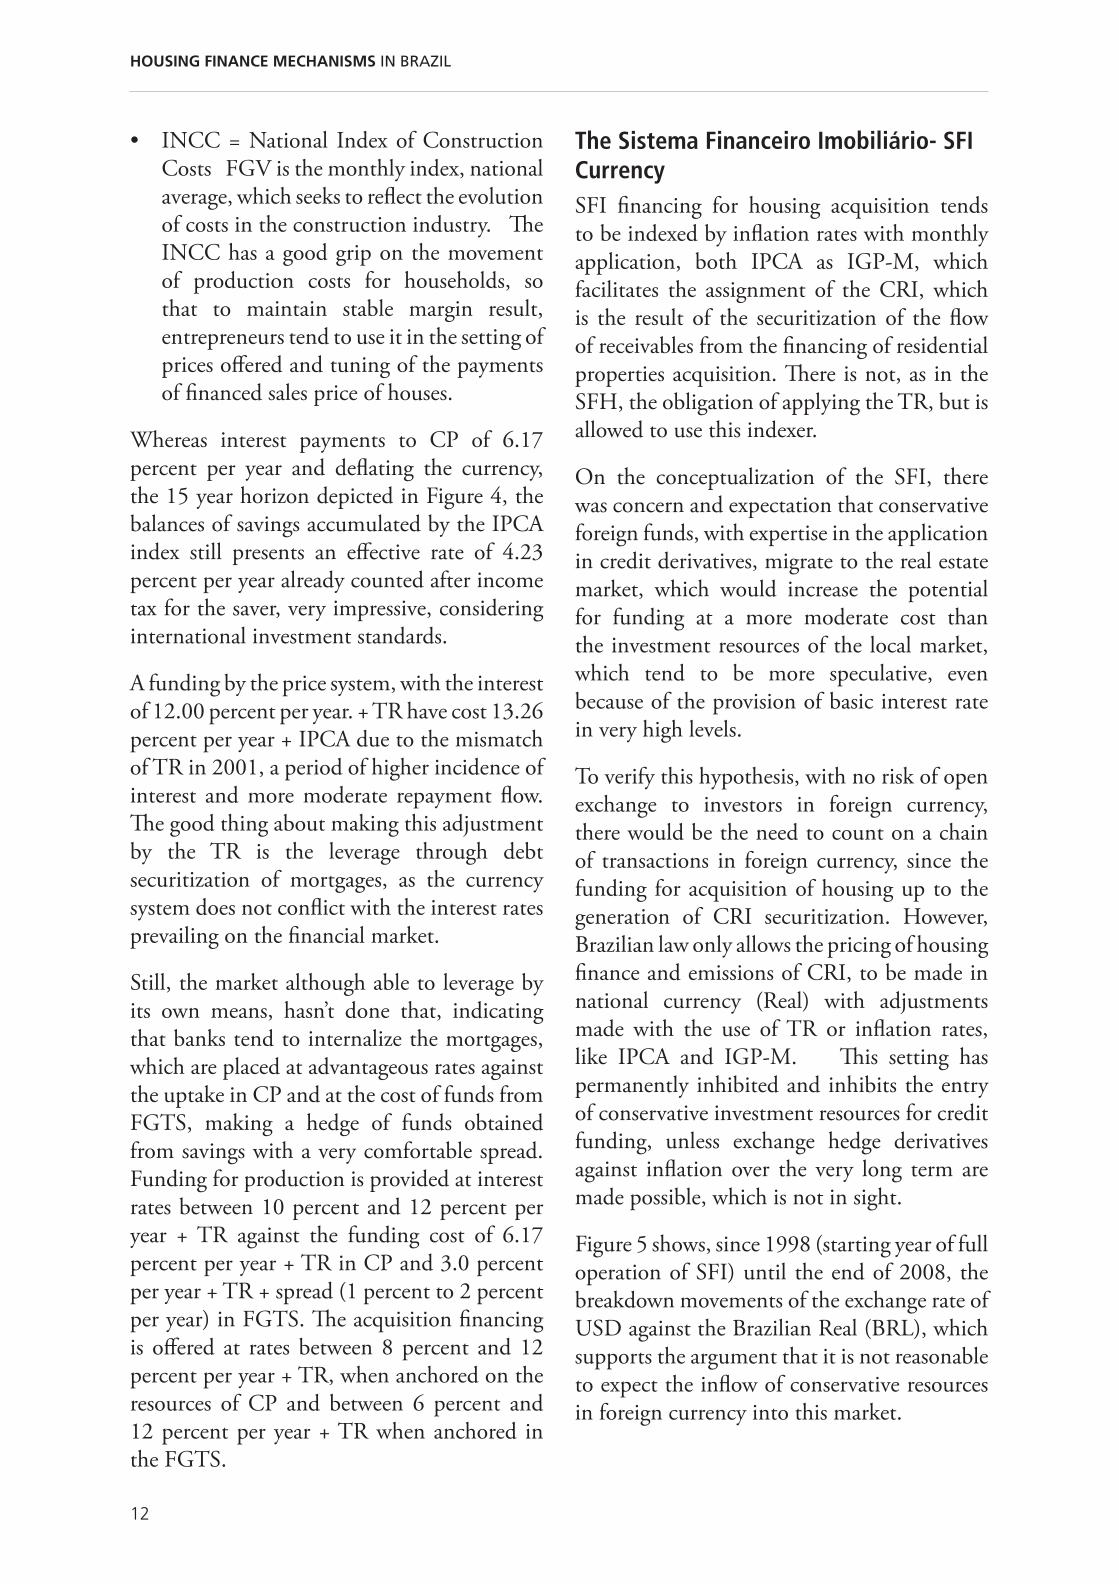
The non-significance of TR with respect
to inflation is evident in Figure 4, showing
that the TR in the long run, as a marker of
savings and conservative cycle of funding for
housing, has been losing its reference against
inflation since 2001. In this Figure 4, GPI
– gross prices index is the IGP M (general
prices index), CPI – consumer prices index
is the IPCA (consumer prices index) and the
CCI – construction costs index is the INCC(
national construction costs index).
% %
Per year Per year
1996 9.6% 22%
1997 9.8% 9.6%
1998 7.8% 5.2%
1999 5.7% 1.7%
2000 2.1% 8.9%
2001 2.3% 6.0%
2002 2.8% 7.7%
2003 4.6% 12.5%
2004 1.8% 9.3%
2005 2.8% 7.6%
2006 2.0% 5.7%
2007 1.4% 3.1%
2008 1.6 4.5%
Table 2: shows the TR variation and the CPI (IPCA) variation in the last years.
Sources : SBPE, SFH/BACEN,IBGE
11
PART I THE CURRENT HOUSING FINANCE SYSTEM: STRUCTURE
Figure 4 shows the discrepancy between the inflation indexes and the “virtual infla-
tion” that supposes to be reflected in the TR definitions made by the Government.
450
400
350
300
250
200
150
100
450
400
350
300
250
200
150
100
412
Aug
94
Dec
94 95 96 97 98 99 00 01 02 03 04 05 06 07 08
253
310
408
Virtual inflation, through TR (all indexes = 100, on Aug-94, date of Real insertion)
Inflation through GPI (IGP-M)
Inflation through CCI (INCC)
Inflation through CPI (IPCA)
FIGURE 4: INFLATION INDEXES AND TR SIGNIFICANCE AGAINST INFLATION
Sources: IPCA (IBGE-Brazil); IGP-M and INCC (FGV-Brazil) TR and Exchange Rate (Bacen)
Figure 4 shows the evolution of main inflation
indices used in Brazil linked with the business
of real estate, in comparison with the variation
of the TR:
IGP-M = General Price Index FGV
Fundação Getúlio Vargas. It is the index
mainly used to reflect the loss of purchasing
power of the Real within the environment
of the Brazilian economy. The IGP-M
is measured monthly and associates
movements of wholesale prices (60 percent)
variation in the cost of household budgets
(30 percent) and construction costs (10
percent).
IPCA = Consumer Price Index (expanded
concept) Brazilian Institute of Geography
and Statistics-IBGE. The IPCA is measured
monthly and reflects the movements of the
cost items that make up the household
budget, (from household monthly income
from 1 up to 40 minimum wages - MW)2
in the proportions of distribution of
national income by families and by region.
The IPCA is used by the Central Bank
as controller of the inflation target in the
conduct of monetary policy.
2 MW = 465.00 BRL (USD 258.00) from May, 2009 to May, 2010.
12
HOUSING FINANCE MECHANISMS IN BRAZIL
INCC = National Index of Construction
Costs FGV is the monthly index, national
average, which seeks to reflect the evolution
of costs in the construction industry. The
INCC has a good grip on the movement
of production costs for households, so
that to maintain stable margin result,
entrepreneurs tend to use it in the setting of
prices offered and tuning of the payments
of financed sales price of houses.
Whereas interest payments to CP of 6.17
percent per year and deflating the currency,
the 15 year horizon depicted in Figure 4, the
balances of savings accumulated by the IPCA
index still presents an effective rate of 4.23
percent per year already counted after income
tax for the saver, very impressive, considering
international investment standards.
A funding by the price system, with the interest
of 12.00 percent per year. + TR have cost 13.26
percent per year + IPCA due to the mismatch
of TR in 2001, a period of higher incidence of
interest and more moderate repayment flow.
The good thing about making this adjustment
by the TR is the leverage through debt
securitization of mortgages, as the currency
system does not conflict with the interest rates
prevailing on the financial market.
Still, the market although able to leverage by
its own means, hasn’t done that, indicating
that banks tend to internalize the mortgages,
which are placed at advantageous rates against
the uptake in CP and at the cost of funds from
FGTS, making a hedge of funds obtained
from savings with a very comfortable spread.
Funding for production is provided at interest
rates between 10 percent and 12 percent per
year + TR against the funding cost of 6.17
percent per year + TR in CP and 3.0 percent
per year + TR + spread (1 percent to 2 percent
per year) in FGTS. The acquisition financing
is offered at rates between 8 percent and 12
percent per year + TR, when anchored on the
resources of CP and between 6 percent and
12 percent per year + TR when anchored in
the FGTS.
The Sistema Financeiro Imobiliário- SFI CurrencySFI financing for housing acquisition tends
to be indexed by inflation rates with monthly
application, both IPCA as IGP-M, which
facilitates the assignment of the CRI, which
is the result of the securitization of the flow
of receivables from the financing of residential
properties acquisition. There is not, as in the
SFH, the obligation of applying the TR, but is
allowed to use this indexer.
On the conceptualization of the SFI, there
was concern and expectation that conservative
foreign funds, with expertise in the application
in credit derivatives, migrate to the real estate
market, which would increase the potential
for funding at a more moderate cost than
the investment resources of the local market,
which tend to be more speculative, even
because of the provision of basic interest rate
in very high levels.
To verify this hypothesis, with no risk of open
exchange to investors in foreign currency,
there would be the need to count on a chain
of transactions in foreign currency, since the
funding for acquisition of housing up to the
generation of CRI securitization. However,
Brazilian law only allows the pricing of housing
finance and emissions of CRI, to be made in
national currency (Real) with adjustments
made with the use of TR or inflation rates,
like IPCA and IGP-M. This setting has
permanently inhibited and inhibits the entry
of conservative investment resources for credit
funding, unless exchange hedge derivatives
against inflation over the very long term are
made possible, which is not in sight.
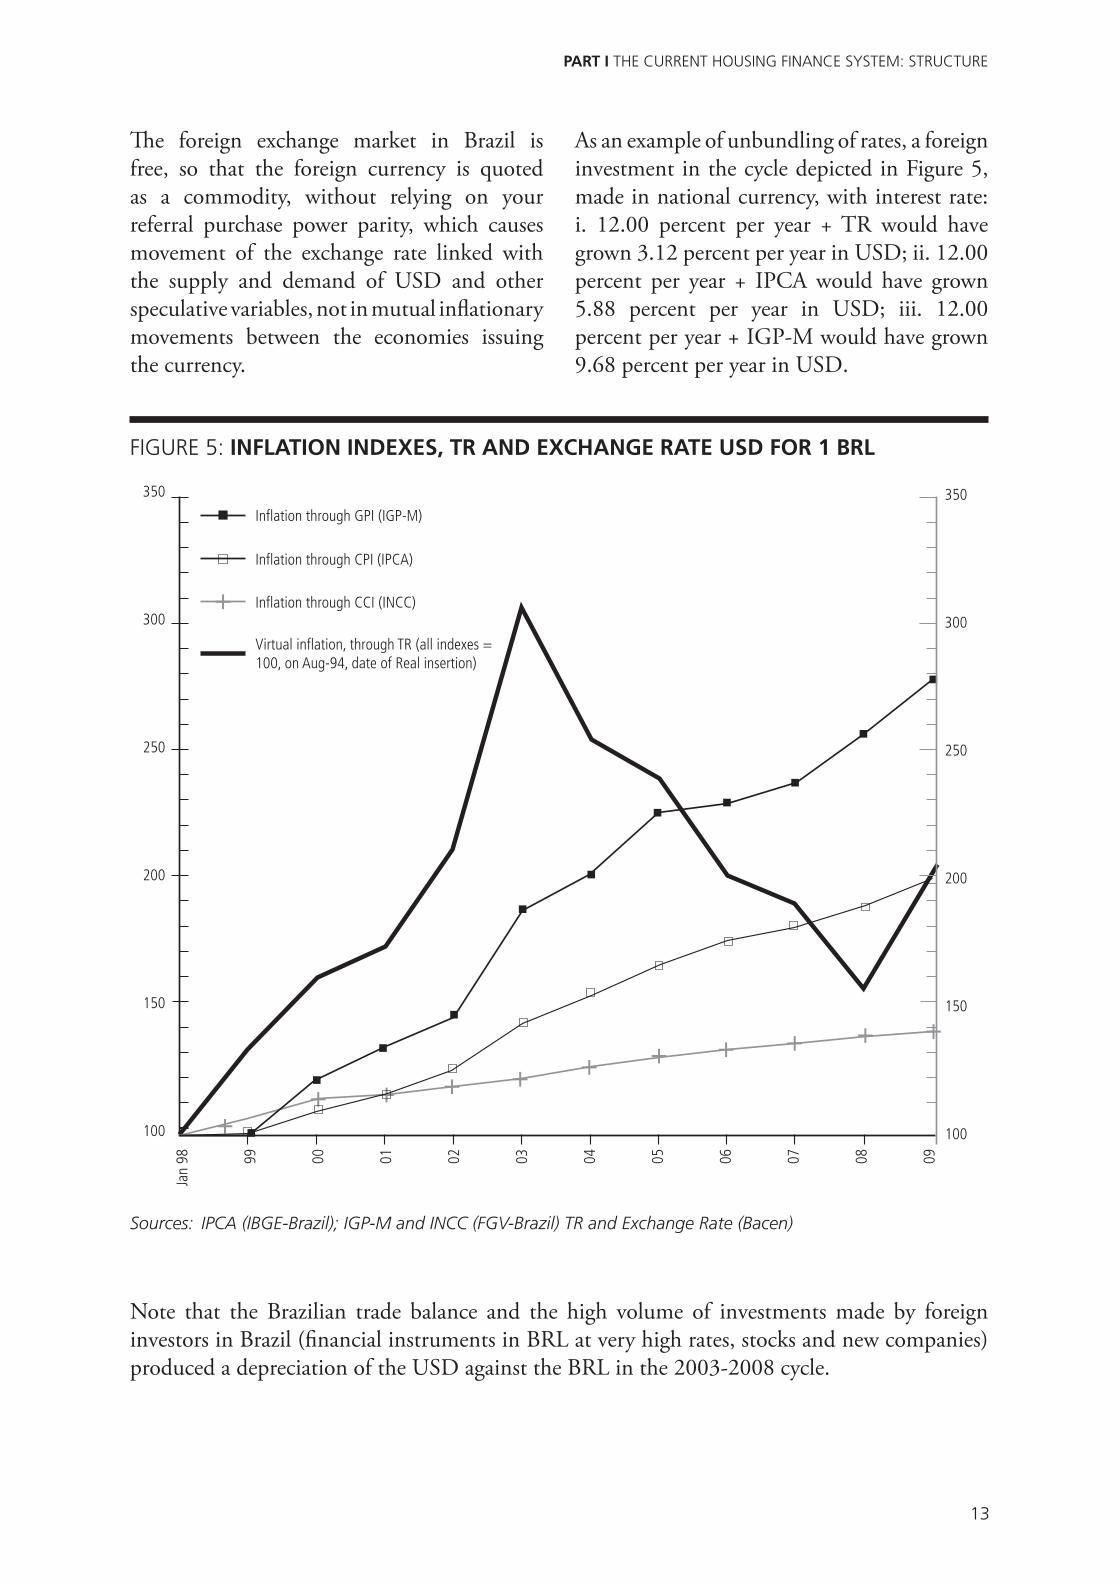
Figure 5 shows, since 1998 (starting year of full
operation of SFI) until the end of 2008, the
breakdown movements of the exchange rate of
USD against the Brazilian Real (BRL), which
supports the argument that it is not reasonable
to expect the inflow of conservative resources
in foreign currency into this market.
13
PART I THE CURRENT HOUSING FINANCE SYSTEM: STRUCTURE
The foreign exchange market in Brazil is
free, so that the foreign currency is quoted
as a commodity, without relying on your
referral purchase power parity, which causes
movement of the exchange rate linked with
the supply and demand of USD and other
speculative variables, not in mutual inflationary
movements between the economies issuing
the currency.
As an example of unbundling of rates, a foreign
investment in the cycle depicted in Figure 5,
made in national currency, with interest rate:
i. 12.00 percent per year + TR would have
grown 3.12 percent per year in USD; ii. 12.00
percent per year + IPCA would have grown
5.88 percent per year in USD; iii. 12.00
percent per year + IGP-M would have grown
9.68 percent per year in USD.
Note that the Brazilian trade balance and the high volume of investments made by foreign
investors in Brazil (financial instruments in BRL at very high rates, stocks and new companies)
produced a depreciation of the USD against the BRL in the 2003-2008 cycle.
FIGURE 5: INFLATION INDEXES, TR AND EXCHANGE RATE USD FOR 1 BRL
350
300
250
200
150
100
Jan
98 99 00 01 02 03 04 05 06 07 08 09
Virtual inflation, through TR (all indexes = 100, on Aug-94, date of Real insertion)
Inflation through GPI (IGP-M)
Inflation through CCI (INCC)
Inflation through CPI (IPCA)
350
300
250
200
150
100
Sources: IPCA (IBGE-Brazil); IGP-M and INCC (FGV-Brazil) TR and Exchange Rate (Bacen)

14

15
PART II LOW INCOME HOUSING
PART II. LOW INCOME HOUSING
INTRODUCTIONThe residential properties that the market
denominates “economic” or “popular”,
designed for the strata of the lower middle and
low-income families in Brazil, sums up a deficit
estimated by the Federal Government of around
7.2 million units. It should be noted that
this estimate is the result of a methodological
adjustment to the measurement of the housing
deficit. The João Pinheiro Foundation holds
the most respected studies in Brazil on issues
related to the housing deficit. While revising
their studies, building estimates for 2007,
based on census data from Brazil (Brazilian
Institute of Geography and Statistics - Federal
Government) they set the deficit at 6.4 million
units by changing the method of calculation,
discounting from the deficit secondary
cohabiting families (families housed under
one roof ), computed before on the calculation
of the Brazilian housing deficit.
The estimated deficit for 2007 is composed
of 1.5 million poor households, 2.5 million
family in cohabitation, 2.0 million houses
with excessive rent and 0.4 million houses in
excessive density (over occupied regarding its
size). The real estate market traditionally
offers products only for the higher segment of
the public, in volume that does not meet the
vegetative growth demand, so the deficit has
grown significantly and it focuses wantonly in
big metropolitan cities and their surroundings,
causing growth of the occupations of land for
sub-housing in slums. Examples of some of
the major Brazilian cities like Sao Paulo, Rio
de Janeiro and Recife are noticeable.
Government Programmes (Federal, State and
Municipal) to meet the lower income levels,
whose housing products are not viable from
a business point of view, requiring subsidized
costs, use resources from FGTS. These funds
are applied at the lower interest rates of the
system and generate impressive default rates,
which are not officially released, but end up
being known in part. This constitutes a
passive cycle, which has been rolled and it
only does not cause serious impacts on the
economy of the FGTS, because the fund has a
curve evolution of organic growing, given that
the wages in Brazil is growing.
With the economy growing, even at moderate
rates, in comparison with developing countries,
large numbers of jobs are generated; causing
the cash flow is positive FGTS. However, no
information is available to support the claim
that the economic condition of FGTS is healthy
and it is necessary to measure the degree of the
present default and the corresponding value
of the collateral of mortgage, plus the deficits
caused by funding infrastructure granted to
state bodies and unpaid.
In order to organize the housing programs,
federal government stratifies the low-income
classes, with monthly household income
ranges of [i. up to 3 MW], [ii. 3 MW to 6
MW], [iii 6 MW to 10 MW]. MW stands for
minimum wage, adjusted by means of specific
legislation, usually near the IPCA inflation
in May of each year. From May 2009 until
April 2010 1 MW equals 465.00 BRL (USD
258.00), so the intervals are equivalent to:
[i. up to 775 USD], [ii. from 775 to 1,550
USD], [iii. in 1,550 to USD 2,583].
16
HOUSING FINANCE MECHANISMS IN BRAZIL
Studies developed by the Real Estate Research
Group at the Polytechnic School of USP
show that it is not possible to validate new
developments in the low income range [i] using
the current market parameters, costs, interest,
taxes, even considering compressed return
margins. The Brazilian government has been
busy building houses for this market segment,
which has appeared ineffective, in view of the
bureaucracy that dominates the procedures
needed to develop real estate projects through
entities operating into the locks of the state.
There is a number of entrepreneurs in Brazil
that produce housing for the [iii] segment,
with some modest inserts in the [ii] range. It
is clear that the housing deficit is concentrated
more “bottom up” and in view of the action
in business ventures for low-income focus
“top down” and do not penetrate the full [i]
range, we see no means to meet the deficit, or
even stop their growth, giving coverage to the
organic growth of demand.
In this sense, this is a theme of urban policy,
housing and income distribution, traditionally
treated lightly in Brazil, and with no guidelines
for medium and long term. The actions have
been topical and uneven; between what is
needed in the three hierarchies of pubic power
(Federal, State and Municipal) and what each
government included in its action plans.
Recently (April-June 2009) the Federal
Government enacted a legislation, already
approved by Congress and signed into law
(Law 11.977/09), setting up a housing plan,
with no target date, but with commitment
of resources advertised as able to meet the
production of 1 million houses, being 400,000
for the interval [i], 400,000 for the [ii] and
200,000 for the [iii].
THE FEDERAL GOVERNMENT SUPPORT PROGRAMThe Federal program to promote the
production and acquisition of housing for
low-income (PFH) includes a goal of building
1.0 million residences in the country, to a
deficit estimated by the Federal Government
of 6.4 million. The goal is timeless, in the
sense that there is no deadline to achieve it,
but linked to the resources provided by the
PFH, which ends when the allocated resources
are exhausted.
Using the IBGE indicators, one can conclude
that the demand for new housing in Brazil
is around 580,000 per year in income range
of up to 3 MW and 83,000 per year in the
range of 3 MW to 10 MW, only to cover
expected population growth. Thus, the PFH
is not able to cover the vegetative growth of
a single year in the lower income segment,
having no practical effect in reducing the
recorded deficit, which will actually grow
in the absence of complementary actions in
housing provision. In the segment [3 MW
to 10 MW] its contribution to reducing the
deficit is a little more evident, although the
incentive to purchase houses in this range is
much more modest in the PFH.
Several Brazilian States and some municipalities
build housing for low income through Urban
Development companies or Residential
Construction companies, mainly using
funding resources directed from FGTS. The
PFH is complementary to this action, seeking
to encourage entrepreneurs to operate in this
market segment, which they had never done
before..

17
PART II LOW INCOME HOUSING
If the PFH program is shy in its scale, the
promotion through direct subsidies on the
payment of the price of the houses, made
available to purchasers is more effective than
the alternative of tax waivers, which has
been used in Brazil as policy development in
different segments of economy. The PFH
establishes that part of the price is paid directly
by the Government (see Table 4).
Especially at this critical juncture in the global
economy of which Brazil is not isolated and
suffering significant impacts on employment
and income, the Federal Government has
been practicing tax waiver policy on the
automotive and appliances, realizing that the
reduced tax serves to improve the margins of
industries, not fully reflecting the fall in prices.
In the past, Brazil, at different times, sought
to encourage construction of housing for low-
income offering tax benefits on the sale of raw
materials for construction, procedures that
would never have produced striking effects,
representing palliative movements, lightly
reflecting on marginal issues in the sector, as
the reform of housing and self-construction.
The development program that is being
implemented also cuts taxes for entrepreneurs,
as well as relieving the costs on some
construction materials and other marginal
costs to buyers, such as insurance and real
estate registry. The perception is that: i. the
PFH focuses comprehensively on the issue of
production costs for low-income housing and ii.
the option to promote the acquisition through
grants to pay the price ensures efficiency in
the transfer of state resources to the market
that should benefit from this. What is vague
in PFH is the land and infrastructure costs,
seen here provided with utilities (electricity,
water, sewer, communication), but also the
integration of urban developments to be built
on the basis of PFH.
Development projects, whose unit price is small,
are validated for entrepreneurs when presented
in large-scale, able to carry the solutions to the
periphery of the large metropolitan centers,
where the low-income housing shortage is
most aggressive. The cost of the adequacy of
land to receive new developments (physical
infrastructure), the existence of adequate
transportation to work and the insertion of
urban equipments (education, health, services
and leisure) are factors that will indicate the
feasibility of each development. There is no
doubt that there are no land, at adequate cost
for low-income housing, in the periphery of
the large metropolitan areas in Brazil, like
São Paulo, Rio de Janeiro, Belo Horizonte
and Recife. Therefore, it is possible that the
program will spread out the medium and
small cities in Brazil, maintaining the actual
unsolved situation in the large metropolitan
areas.
The price limits for houses into the PFH
and the level of subsidies that the PFH
offers are enough evidence that these land
attributes cannot be considered as cost of the
entrepreneur. Thus, in order that PFH does
not result in the proliferation of small-scale
enterprises in small cities in Brazil, abandoning
the whole idea of treating the acute problem of
sub-housing in major metropolitan cities, the
supply of land should be a contribution of the
State for projects, representing an additional
indirect subsidy as important as the financial
subsidies provided for in PFH.
The land issue, however, is not directly tackled
in the PFH, figuring only as incentives to
target subsidized resources for municipalities
that contribute to the land for the projects
directed to the lower income range [up to 3
MW].
18
HOUSING FINANCE MECHANISMS IN BRAZIL
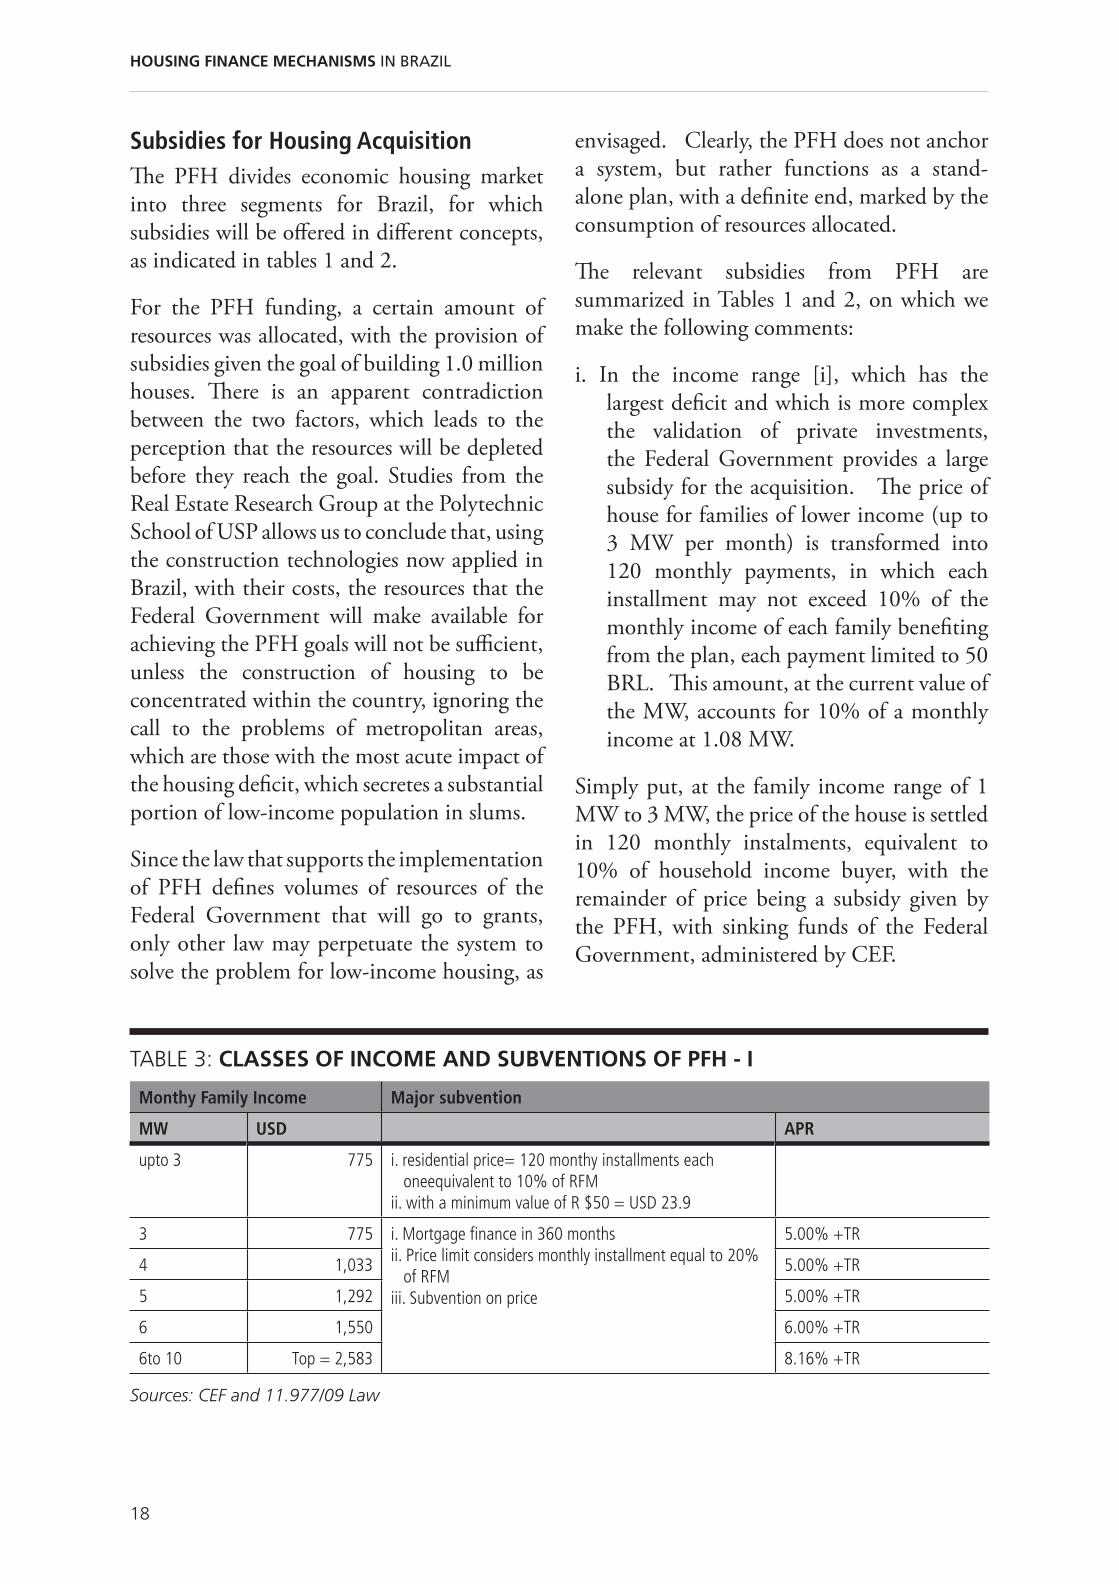
Subsidies for Housing AcquisitionThe PFH divides economic housing market
into three segments for Brazil, for which
subsidies will be offered in different concepts,
as indicated in tables 1 and 2.
For the PFH funding, a certain amount of
resources was allocated, with the provision of
subsidies given the goal of building 1.0 million
houses. There is an apparent contradiction
between the two factors, which leads to the
perception that the resources will be depleted
before they reach the goal. Studies from the
Real Estate Research Group at the Polytechnic
School of USP allows us to conclude that, using
the construction technologies now applied in
Brazil, with their costs, the resources that the
Federal Government will make available for
achieving the PFH goals will not be sufficient,
unless the construction of housing to be
concentrated within the country, ignoring the
call to the problems of metropolitan areas,
which are those with the most acute impact of
the housing deficit, which secretes a substantial
portion of low-income population in slums.
Since the law that supports the implementation
of PFH defines volumes of resources of the
Federal Government that will go to grants,
only other law may perpetuate the system to
solve the problem for low-income housing, as
envisaged. Clearly, the PFH does not anchor
a system, but rather functions as a stand-
alone plan, with a definite end, marked by the
consumption of resources allocated.
The relevant subsidies from PFH are
summarized in Tables 1 and 2, on which we
make the following comments:
i. In the income range [i], which has the
largest deficit and which is more complex
the validation of private investments,
the Federal Government provides a large
subsidy for the acquisition. The price of
house for families of lower income (up to
3 MW per month) is transformed into
120 monthly payments, in which each
installment may not exceed 10% of the
monthly income of each family benefiting
from the plan, each payment limited to 50
BRL. This amount, at the current value of
the MW, accounts for 10% of a monthly
income at 1.08 MW.
Simply put, at the family income range of 1
MW to 3 MW, the price of the house is settled
in 120 monthly instalments, equivalent to
10% of household income buyer, with the
remainder of price being a subsidy given by
the PFH, with sinking funds of the Federal
Government, administered by CEF.
Monthy Family Income Major subvention
MW USD APR
upto 3 775 i. residential price= 120 monthy installments each oneequivalent to 10% of RFM
ii. with a minimum value of R $50 = USD 23.9
3 775 i. Mortgage finance in 360 monthsii. Price limit considers monthly installment equal to 20%
of RFMiii. Subvention on price
5.00% +TR
4 1,033 5.00% +TR
5 1,292 5.00% +TR
6 1,550 6.00% +TR
6to 10 Top = 2,583 8.16% +TR
Sources: CEF and 11.977/09 Law
TABLE 3: CLASSES OF INCOME AND SUBVENTIONS OF PFH - I

19
PART II LOW INCOME HOUSING
ii. Also in the income range [i], the operational
procedure sets the entrepreneur free form
interest and marketing expenses, because
the PFH provides that CEF buys and sells
houses to families. At this time, the CEF
is registering families for the purchase
of houses and some constructors are
validating their projects. The evidence is
that projects only validate on very low cost
land, enabling to offer the maximum price
to be paid by the CEF (table 2), with the
minimum specifications required, leading
to a single-family residence around 35 sqm
and apartments around 42 sqm.
iii. The highest price accepted by the CEF
for apartments in the metropolitan areas,
such as São Paulo, the largest deficit in the
country, is 52,000 BRL (USD 28,889).
Considering the limit of the monthly
payment on 10 percent of income for the
highest income band, and the interest rate
of 5 percent per year, and not considering
the cost of insurance and other costs added
to the monthly payment, the family could
obtain financing from 13,219 BRL (USD
7,344). The implicit subsidy would be
38,781 BRL (USD 21,545).
The production quota for the region of 165,600
households, of the target of 400,000 of PFH
for the range [i], thus requiring subsidies
from BRL 6.4 billion, (USD 3.56 billion)
around 46% of the BRL 14.0 billion (USD
7.78 billion) allocated for the whole country.
With land at no cost, no financial cost and
with low taxes, the margin of income for the
entrepreneur at that price will be between 7
and 8 percent of the price, with a high default
risk.
Sources: CEF and 11.977/09 Law
TABLE 4: CLASSES OF INCOME AND SUBVENTIONS OF PFH - II
Monthy Family Income Subvention on price Market Price Limit
MW USD BRL USD BRL USD
upto 3 775 52,000 28,889
3 775 23,000 12,778 75,636 42,020
4 1,033 16,000 8,889 86,181 47,878
5 1,292 9,000 5,000 96,726 53,737
6 1,550 2,000 1,111 96,677 53,709
6to 10 Top = 2,583 128,327 71,293
iv. In the range [i], the accepted price limit for
housing is BRL 52,000 (USD 28,889) in
the city of São Paulo, ranging from BRL
37,000 (USD 25,555) and this limit,
depending on the region in Brazil.
v. In the range of monthly income [ii] 3 to 6
MW price is fully financed in interest rates
indicated in table 1, that in those currently
practiced by CEF, make a full allowance
of around 1 percentage point per year in
interest rate.
vi. In this range [ii], the price is paid in 360
monthly installments equivalent to 20
percent of family income and PFH pays
an allowance in price, as indicated therein,
given that CEF only funds projects to the
price limit indicated.

20
21
PART III HOUSING FINANCE IN BRAZIL
PART III. HOUSING FINANCE STATISTICS IN BRAZIL
MACROECONOMIC ISSUES AND THE SBPEIn order to better contextualize the housing
finance system in Brazil, it is adequate to
compile some information regarding the
Brazilian macroeconomic performance,
starting from the late 80’s and going through
the 90’s until the first half of 2009. In
parallel with the macroeconomics, set SBPE
performance for the same period allows us to
understand the connections and constraints of
the housing finance with the macroeconomic
scenario experimented by Brazil in this era.
For the evaluation of macroeconomic
fluctuations and its comparison with the
performance of the housing sector, the
following indicators were chosen: evolution
of the Gross Domestic Product (GDP),
price developments in the national economy,
through the General Prices (IGP M) from
FGV Getúlio Vargas Foundation, and the
Consumer Price Index (CPI) of FIPE-Institute
of Economic Research of São Paulo University.
For the cost of money in the economy, we
choose the rates on Interbank Deposit Rates,
called Interbank Deposit Certificates (CDI).
The analyses are for the period from 1988 to
2008. Looking back at the recent economic
history of the country, a first analysis of the data
indicates large macroeconomic turbulences
in restricted periods, with distortions and
reflections with their own characteristics in
the behavior of economic agents.
The year 1989 is characterized by stagflation
- high inflation and falling GDP (Figure 6);
from 1990 the economic environment is
characterized by a sharp decrease in the level
of economic activity, reflected in the decline
of GDP, with inflation indices also in decline,
albeit at very high levels.
Since 1992 the GDP started to grow at the
same the rate with inflation, a situation that
lasted until the Real Plan. The Real Plan was
set by Federal Government with the intention
of cutting inflation to one-digit values. The
plan incepted a new currency, the present
Brazilian Real, designed, at that moment, to
be par to the USD.
Since the Real plan installation it is possible to
characterize two distinct phases. The first, mid-
1994, the date of its implementation, until the
end of 1997, whose main characteristics are
low levels of inflation, GDP growth and high
interest rates, whose levels show a declining
trend since the beginning of this phase, but
reappear after its end.
The second phase of the Real Plan is linked to
the increasing need for financing the current
account deficit and covers the end of 1997
until the end of 1998, a period characterized
by crises in Southeast Asia and Russia. The
policies implemented during this period
showed the line of attack of increase interest
rates to attract volatile capital, in order to
support the exchange rate and maintain current
levels of inflation. The result was extremely
low growth rates in 1998 and expectations
for 1999 of a slight decrease in the GDP, high
interest rates and growth rates of inflation,
derived from the devaluation promoted in
early 1999.
22
HOUSING FINANCE MECHANISMS IN BRAZIL
The basic interest rate offered by the Brazilian
Central Bank (Bacen) in January 1999 stood
at a level of 27 % pa in March and reached
almost 41 % pa. From April the Bacen
adopted a policy with a downward bias for
that rate, reaching 19 % pa in August. With
the devaluation, a resumption of sustained
economic growth was expected but which was
quickly aborted in 2000 due to the crisis of
energy supply in 2000 - 2001. At these interest
rates the real estate market was paralyzed.
From 2000 to 2003 the Brazilian economy
experienced growth rates above GDP at
around 2 % pa, the best historical reference. It
is accepted that this was related to the political
transition of 2002, which originated intense
deterioration of expectations regarding the
evolution of the Brazilian economy under the
aegis of the new government. In this period,
we recorded the highest inflation rates since
the beginning of the Real Plan, accompanied
by a strong increase in interest rates in the
economy.
From 2004 until early 2008, Brazil engaged
in a relatively sustained expansion of
economic activity, according to the state of
main macroeconomic indicators, albeit with
the highest interest rates of the emerging
economies. The inflation level was high, but
matched the targets set by the Bacen. Strong
international reserves, increasingly surplus in
the foreign accounts and balance of payments
was realizeed, despite the effects of international
crises that was already being experienced since
the mid-2007 in major economies.
The year 2008 is marked on the Brazilian
economy as the reversal of the more euphoric
expectations found mainly in 2006 and 2007.
It is in the last quarter of 2008 that investments
pulled back abruptly and intensely, mainly in
the residential real estate, with a fall in demand
and the temporary restriction of credit.
In addition, we saw the financial strangulation
of several residential real estate companies
that, in the phase of euphoria and availability
of funding, immobilized abundant resources
in the formation of land banks.
The fall in GDP, which occurred in the last
quarter of 2008, though small, was repeated
in the first quarter of 2009. The Federal
Government, through the Brazilian Central
Bank, in order to reverse the expectations of
the market, promoted a series of reductions in
the basic interest rate of the economy, currently
8.75 percent per year, and announced the plan
to encourage production of housing for the
low-income strata. In the second quarter of
2009, the mood among the majority of agents
and analysts was that “the worst of the crisis
has passed,” and that Brazil was one of the
least affected.
In Figure 6, the value of GDP in 1988,
expressed in the currency of 2008, is
transformed into the index number 100; 20
years later, in 2008, the Brazilian GDP equals
167.9, resulting in an equivalent to annual
growth rate of 2.62%, with the highest annual
growth rate observed in the period of 5.85%
and the least of - 4.35%.
Taking into consideration that the Brazilian
system for housing finance is based on savings
for raising money, just as important to recognize
the pattern of evolution of the Brazilian GDP
is to distinguish the historical behavior of GDP
per capita over the same period. The higher
the average income, greater tends to be the
allocation of resources into long-term savings,
thus nourishing the funding of SBPE. On
the other hand, the higher the average income
imply in higher access to real estate credit for a
larger number of families.
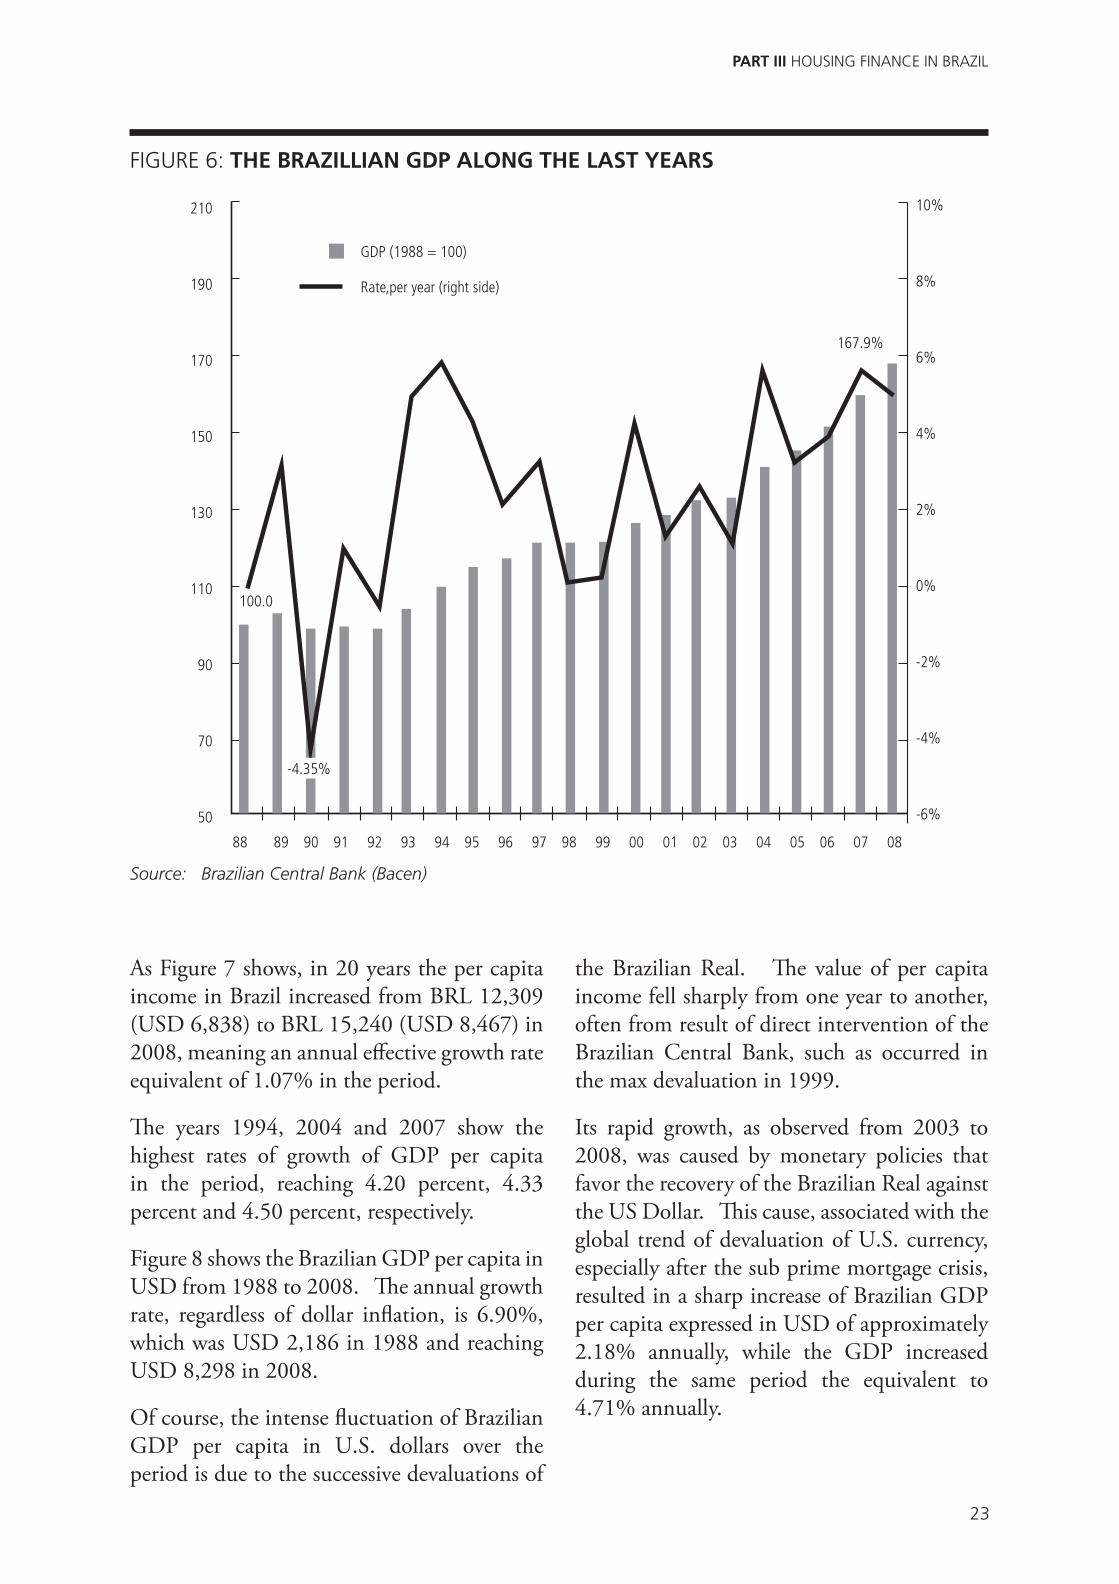
23
PART III HOUSING FINANCE IN BRAZIL
88 89 90 91 92 93 94 95 96 97 98 99 00 01 02 03 04 05 06 07 08
210
190
170
150
130
110
90
70
50
10%
8%
6%
4%
2%
0%
-2%
-4%
-6%
100.0
167.9%
GDP (1988 = 100)
Rate,per year (right side)
-4.35%
FIGURE 6: THE BRAZILLIAN GDP ALONG THE LAST YEARS
Source: Brazilian Central Bank (Bacen)
As Figure 7 shows, in 20 years the per capita
income in Brazil increased from BRL 12,309
(USD 6,838) to BRL 15,240 (USD 8,467) in
2008, meaning an annual effective growth rate
equivalent of 1.07% in the period.
The years 1994, 2004 and 2007 show the
highest rates of growth of GDP per capita
in the period, reaching 4.20 percent, 4.33
percent and 4.50 percent, respectively.
Figure 8 shows the Brazilian GDP per capita in
USD from 1988 to 2008. The annual growth
rate, regardless of dollar inflation, is 6.90%,
which was USD 2,186 in 1988 and reaching
USD 8,298 in 2008.
Of course, the intense fluctuation of Brazilian
GDP per capita in U.S. dollars over the
period is due to the successive devaluations of
the Brazilian Real. The value of per capita
income fell sharply from one year to another,
often from result of direct intervention of the
Brazilian Central Bank, such as occurred in
the max devaluation in 1999.
Its rapid growth, as observed from 2003 to
2008, was caused by monetary policies that
favor the recovery of the Brazilian Real against
the US Dollar. This cause, associated with the
global trend of devaluation of U.S. currency,
especially after the sub prime mortgage crisis,
resulted in a sharp increase of Brazilian GDP
per capita expressed in USD of approximately
2.18% annually, while the GDP increased
during the same period the equivalent to
4.71% annually.

24
HOUSING FINANCE MECHANISMS IN BRAZIL
FIGURE 7: THE BRAZILIAN GDP PER CAPITA OVER THE LAST 20YEARS (BRL OF 2008)
Source: Brazilian Central Bank (Bacen)
88 89 90 91 92 93 94 95 96 97 98 99 00 01 02 03 04 05 06 07 08
20,000
18,000
16,000
14,000
12,000
10,000
8,000
6,000
4,000
2,000
0
12,309
167.9%
GDP (1988 = 100)
Rate,per year (right side)
-7.15%
4.20% 4.33%
10
8
6
4
2
0
-2
-4
-6
-8
-10
88 89 90 91 92 93 94 95 96 97 98 99 00 01 02 03 04 05 06 07 08
2,186
GDP (1988 = 100)
Rate,per year (right side)
50%
40%
30%
20%
10%
0%
-10%
-20%
-30%
-40%
-50%
10,000
9,000
8,000
7,000
6,000
5,000
4,000
3,000
2,000
1,000
0
8,298
FIGURE 8: THE BRAZILIAN GDP PER CAPITA OVER THE LAST 20 YEARS (IN USD)
Source: Brazilian Central Bank (Bacen)

25
PART III HOUSING FINANCE IN BRAZIL
Another indicator that illustrates the efficiency
of the SBPE into funding Brazilian housing
is the ratio of housing credit volume in the
market turnover with GDP. In Figure 9 one
can visualize the behavior of this relationship
over the past 20 years in Brazil. In the late
1980’s the volume of granted credit for housing
purchase reached a value equivalent to about 9
% of the monetary value of the Brazilian GDP
on that date, which is BRL 161,123 thousand
in 2008.
The whole 1990’s decade is marked by a
decrease in this parameter, since in 1990 the
ratio of credit volume to GDP is 6.83 %, a
figure that remains relatively stable until the
middle of the decade, reaching, by the end of
1999, 5 %. This reduction in the ratio is due
to the virtually stagnating credit while there
has been a growth in GDP, albeit still small,
equivalent to 1.65 percent annually during the
decade.
After 2000, the significant reduction in the
volume of real estate credit as a proportion
of GDP average of 2 % is the result of two
movements:
i. the intensified expansion of economic
activity in Brazil, particularly from 2003,
achieving equivalent annual growth rate of
4.71%;
ii. the reduction on the amount of credit
allocated to the housing market, while
during the 90s the average volume of
credit, expressed in USD of 2008 was
116,456 thousands.
The allocation of credits for housing finance
decreased since 1995 in a proportion of GDP
which can be seen a as a paradox. However,
while the due balance of FCVS in favor of the
banks remained unsolved, the Government
authorized that, exceptionally, the CP funds
raised by the banks could be invested in public
titles, although very secure and paying one of
the highest rates in the world. Therefore,
the banks made the Federal titles options for
investing, instead use the CP funds to finance
real estate. Since 2004, this particular situation
is now replaced by the original obligation of
finance (65% of the CP balance has to be used
for real estate finance), but mitigated by the
FCVS balance in favor of each bank, that can
be used against the obligation in a decrease
ratio of 5% per year.
In early years of the decade that followed,
considering the interval from 2000 to 2008,
the average was USD 48,437 thousands of
2008.
For illustration and comparison, the relation
among housing credit and GDP indicators
of selected countries (source – world bank
2005):
Holland 88.0% Germany 51.0% Chile 16.1%
UK 62.0% Malaysia 21.0% Thailand 16.0%
USA 53.0% France 19.0% Mexico 10.1%

26
HOUSING FINANCE MECHANISMS IN BRAZIL
FIGURE 9: THE BRAZILIAN HOUSING FINANCING SYSTEM, AS A PROPORTION OF THE GDP
Source: Brazilian Central Bank (Bacen)
88 89 90 91 92 93 94 95 96 97 98 99 00 01 02 03 04 05 06 07 08
9.08%
GDP (1988 = 100)Housing Financing as a GDP proportion (%)
16%
14%
12%
10%
8%
6%
4%
2%
0%
210
190
170
150
130
110
90
70
50
167.9
6.97%
1.30%1.87%
In Figure 10, the evolution of the formation of
households in Brazil from 1982 to 2007 with
its annualized growth rates is presented.
In 1982, according to the IBGE, there were
about 27,900 thousand households in the
country.
In 2007, the number of households in Brazil
reached 55,544 thousands. Thus, the average
number of households formed each year in
Brazil, within the period under review was
approximately 1,135 thousand, which means
an expansion rate of 2.8 percent annually.
Considering only the SBPE and funds
generated under the FGTS as a source of
funds for the acquisition of residences by the
Brazilian population, one can have a measure
of the ability of the formal system to meet
one of the components that characterize the
demand for production housing and therefore
the financing for the acquisition.
Roughly speaking, the historical data compiled
here show that the system was able to fulfill the
order of 53% of the needs of demand, when
considering the best performance years (600
thousand residential units financed against a
demand of 1,135 thousand).
Table5 shows the data displayed in Figure 10.
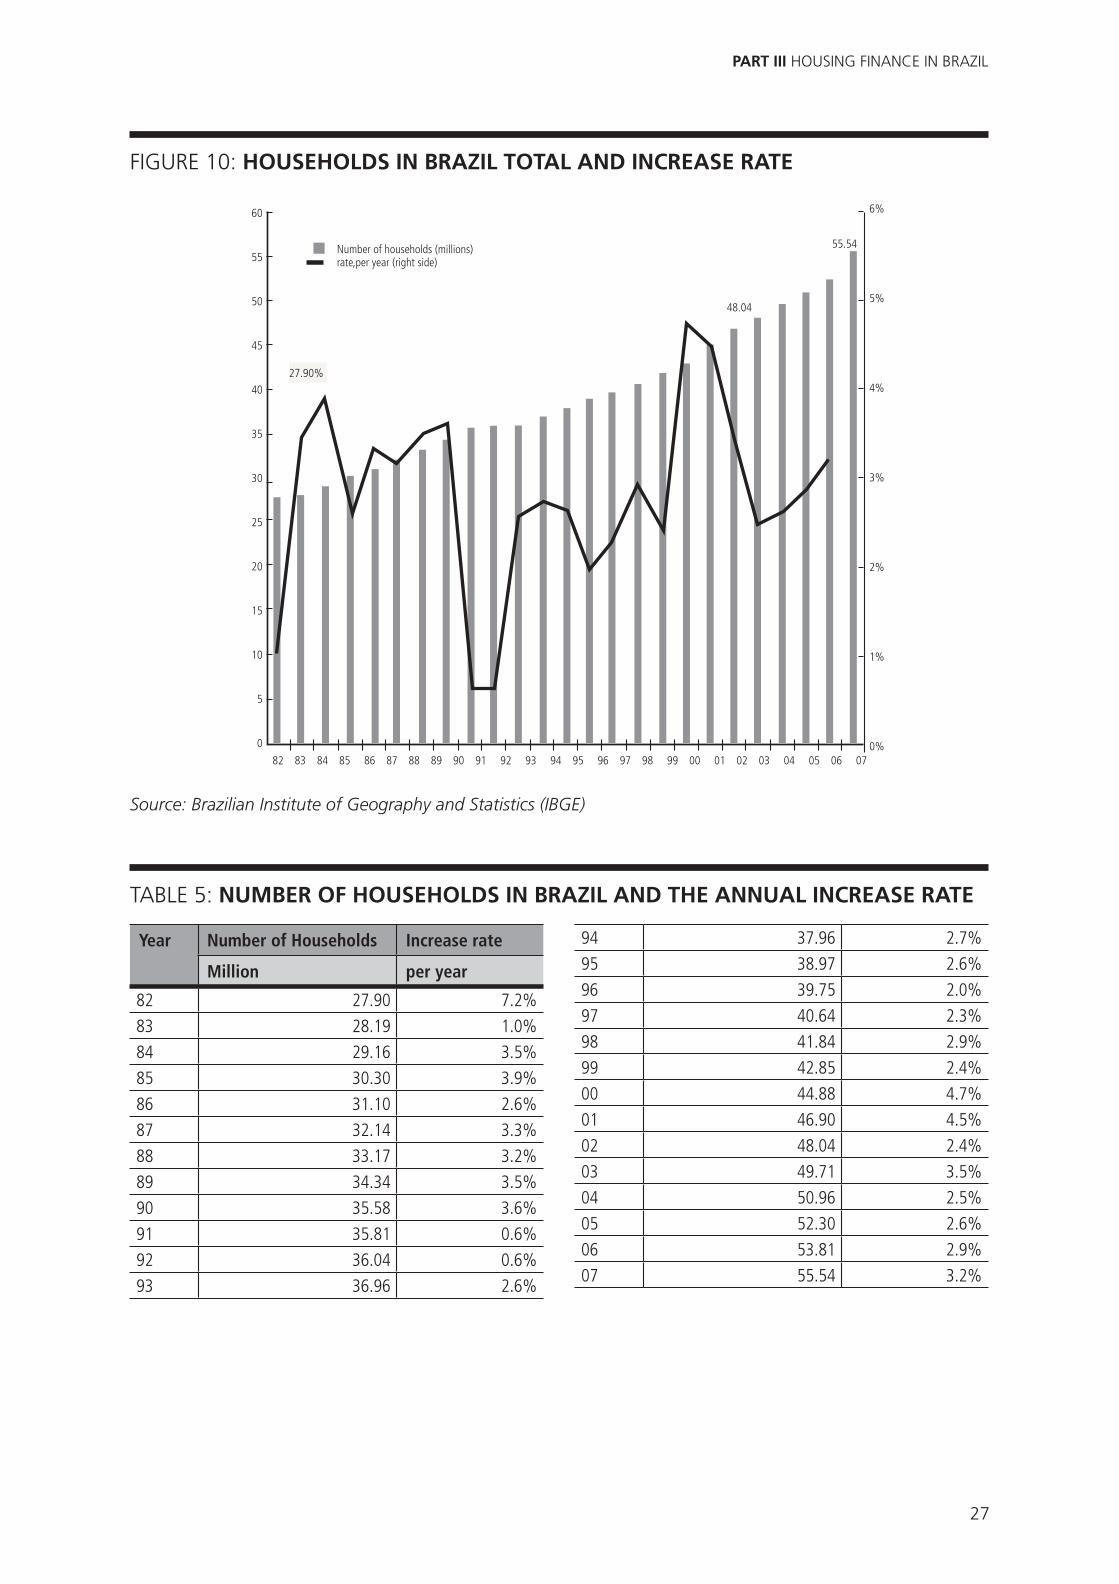
27
PART III HOUSING FINANCE IN BRAZIL
FIGURE 10: HOUSEHOLDS IN BRAZIL TOTAL AND INCREASE RATE
82 83 84 85 86 87 88 89 90 91 92 93 94 95 96 97 98 99 00 01 02 03 04 05 06 07
27.90%
Number of households (millions)rate,per year (right side)
6%
5%
4%
3%
2%
1%
0%
60
55
50
45
40
35
30
25
20
15
10
5
0
48.04
55.54
Source: Brazilian Institute of Geography and Statistics (IBGE)
Year Number of Households Increase rate
Million per year
82 27.90 7.2%
83 28.19 1.0%
84 29.16 3.5%
85 30.30 3.9%
86 31.10 2.6%
87 32.14 3.3%
88 33.17 3.2%
89 34.34 3.5%
90 35.58 3.6%
91 35.81 0.6%
92 36.04 0.6%
93 36.96 2.6%
94 37.96 2.7%
95 38.97 2.6%
96 39.75 2.0%
97 40.64 2.3%
98 41.84 2.9%
99 42.85 2.4%
00 44.88 4.7%
01 46.90 4.5%
02 48.04 2.4%
03 49.71 3.5%
04 50.96 2.5%
05 52.30 2.6%
06 53.81 2.9%
07 55.54 3.2%
TABLE 5: NUMBER OF HOUSEHOLDS IN BRAZIL AND THE ANNUAL INCREASE RATE
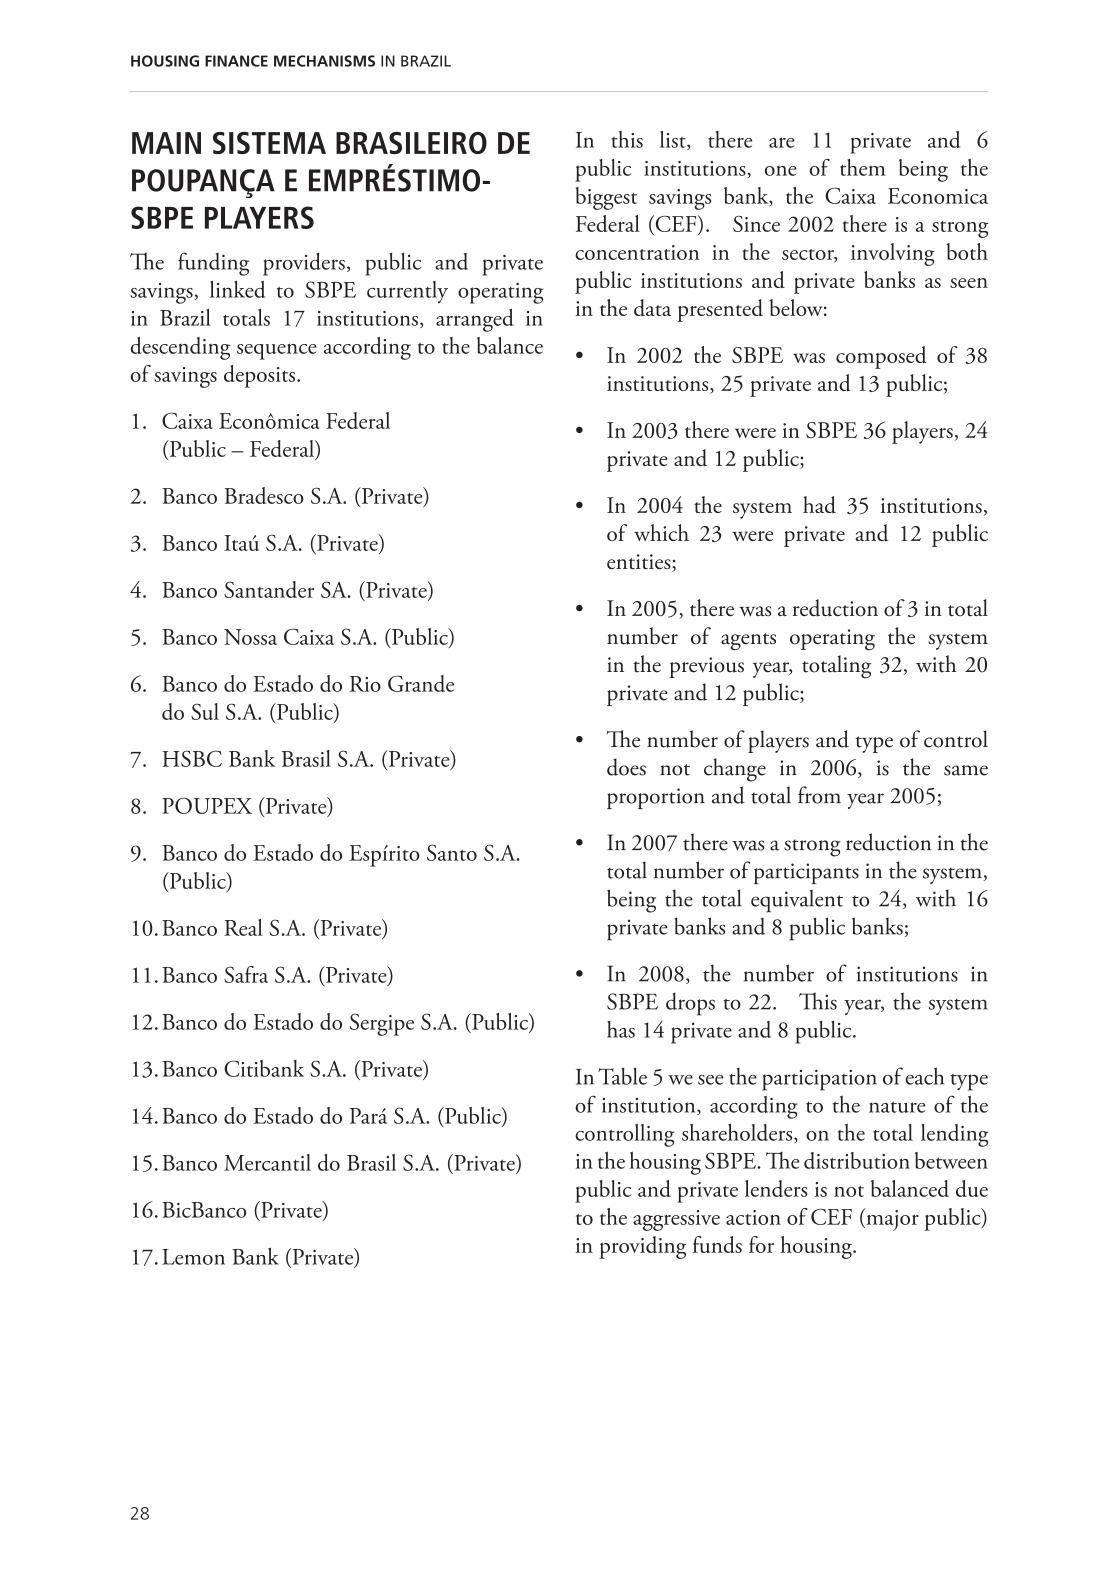
28
HOUSING FINANCE MECHANISMS IN BRAZIL
MAIN SISTEMA BRASILEIRO DE POUPANÇA E EMPRÉSTIMO-SBPE PLAYERSThe funding providers, public and private
savings, linked to SBPE currently operating
in Brazil totals 17 institutions, arranged in
descending sequence according to the balance
of savings deposits.
1. Caixa Econômica Federal
(Public – Federal)
2. Banco Bradesco S.A. (Private)
3. Banco Itaú S.A. (Private)
4. Banco Santander SA. (Private)
5. Banco Nossa Caixa S.A. (Public)
6. Banco do Estado do Rio Grande
do Sul S.A. (Public)
7. HSBC Bank Brasil S.A. (Private)
8. POUPEX (Private)
9. Banco do Estado do Espírito Santo S.A.
(Public)
10. Banco Real S.A. (Private)
11. Banco Safra S.A. (Private)
12. Banco do Estado do Sergipe S.A. (Public)
13. Banco Citibank S.A. (Private)
14. Banco do Estado do Pará S.A. (Public)
15. Banco Mercantil do Brasil S.A. (Private)
16. BicBanco (Private)
17. Lemon Bank (Private)
In this list, there are 11 private and 6
public institutions, one of them being the
biggest savings bank, the Caixa Economica
Federal (CEF). Since 2002 there is a strong
concentration in the sector, involving both
public institutions and private banks as seen
in the data presented below:
In 2002 the SBPE was composed of 38
institutions, 25 private and 13 public;
In 2003 there were in SBPE 36 players, 24
private and 12 public;
In 2004 the system had 35 institutions,
of which 23 were private and 12 public
entities;
In 2005, there was a reduction of 3 in total
number of agents operating the system
in the previous year, totaling 32, with 20
private and 12 public;
The number of players and type of control
does not change in 2006, is the same
proportion and total from year 2005;
In 2007 there was a strong reduction in the
total number of participants in the system,
being the total equivalent to 24, with 16
private banks and 8 public banks;
In 2008, the number of institutions in
SBPE drops to 22. This year, the system
has 14 private and 8 public.
In Table 5 we see the participation of each type
of institution, according to the nature of the
controlling shareholders, on the total lending
in the housing SBPE. The distribution between
public and private lenders is not balanced due
to the aggressive action of CEF (major public)
in providing funds for housing.

29
PART III HOUSING FINANCE IN BRAZIL
Year Public, mainly CEF Private all other banks
BRL million (%) of total BRL million (%) of total
1988 68.4% 31.6%
1989 70.3% 29.7%
1990 67.2% 32.8%
1991 67.7% 32.3%
1992 71.4% 28.6%
1993 75.0% 25.0%
1994 74.9% 25.1%
1995 407,689 76.1% 127,840 23.9%
1996 450,083 78.1% 126,136 21.9%
1997 479,078 81.2% 110,547 18.8%
1998 514,908 82.6% 108,252 17.4%
1999 540,222 83.2% 108,714 16.8%
2000 576,493 83.6% 112,564 16.4%
2001 316,427 68.8% 114,764 31.2%
2002 181,505 62.8% 107,290 37.2%
2003 195,752 66.2% 100,014 33.8%
2004 206,028 67.9% 97,253 32.1%
2005 226,749 69.5% 99,543 30.5%
2006 286,401 72.8% 106,411 27.2%
2007 355,432 72.6% 134,434 27.4%
2008 461,716 71.2% 186,918 28.8%
TABLE 6: HOUSING FINANCING LEVEL ACCORDING TO THE FUNDS PROVIDER SOURCE
Source: Brazilian Central Bank (Bacen)
FINANCING SYSTEMS IN NUMBERS
Residential Units FinancedIn Figure 11 there are the number of units
whose acquisition was financed through the
SBPE system and using the FGTS funds.
As shown in Figure 11, the SFH peaked in
1980, when it surpassed 600 thousand units
financed.
Different factors contributed to the change
in volume of loans granted since the time
limit on the use of FGTS for amortization
of mortgages (from 1983) to disagreements
arising from inflationary pressure that brought
the system to collapse,
registering in 1993 the worst point, only with
58 thousand units financed.
From the total funds allocated to housing
by SFH through SBPE, part has been used
first to produce new units, following the
acquisition. Part of the funds are used under
the direct purpose of buying a home by the
end purchasers.
The partition of resources to meet first the
production and directed straight to marketing
of units has been fair in recent years, as shown
in Figure 12.
Table 7 details the values in Figure 11 and
Table 8 the values of Figure 12.
30
HOUSING FINANCE MECHANISMS IN BRAZIL
58
72 75 78 81 84 87 90 93 96 99 02 05 08year
700
600
500
400
300
200
100
0
thou
sand
uni
ts
627FGTS
SBPE
FIGURE 11: NUMBER OF UNITS FINANCED BY SFH (SBPE+FGTS)
* FGTS information non availableSources: Bacen, Brazilian Association of Entities of Real Estate Finance and Savings (ABECIP), Caixa Econômica Federal (CEF), Brazilian Committee of the Construction Industry (CBIC)

31
PART III HOUSING FINANCE IN BRAZIL
Year Number of units financed
FGTS SBPE Total
1970 84,086 73,144 157,230
1971 58,531 59,059 117,590
1972 76,685 47,804 124,489
1973 96,623 61,178 157,801
1974 60,268 35,937 96,205
1975 64,512 77,417 141,929
1976 109,410 164,353 273,763
1977 58,004 209,709 267,713
1978 58,133 279,516 337,649
1979 108,985 274,238 383,223
1980 260,534 366,808 627,342
1981 266,884 198,514 465,398
1982 258,745 282,384 541,129
1983 44,562 32,685 77,247
1984 42,807 43,551 86,358
1985 34,652 25,005 59,657
1986 62,312 44,350 106,662
1987 132,005 99,227 231,232
1988 181,834 98,249 280,083
1989 68,089 31,617 99,706
TABLE 7: NUMBER OF UNITS FINANCED BY SFH (SBPE+FGTS
Year Number of units financed
FGTS SBPE Total
units
1990 74,993 165,617 240,610
1991 41,050 359,719 400,769
1992 64,869 43,801 108,670
1993 53,708 42,56 57,964
1994 61,384 NA
1995 46,594 16,550 63,144
1996 38,286 29,900 68,186
1997 35,487 170,729 206,216
1998 39,368 124,055 163,423
1999 35,131 99,875 135,006
200 36,465 160,821 197,286
2001 35,795 247,990 283,785
2002 28,905 212,144 241,049
2003 36,480 211,204 247,684
2004 53,827 266,424 320,251
2005 61,223 337,448 398,671
2006 113,873 408,428 522,301
2007 196,133 NA
2008 299,685 NA
32
HOUSING FINANCE MECHANISMS IN BRAZIL
94 95 96 97 98 99 00 01 02 03 04 05 06 07 08 year
35,000
30,000
25,000
20,000
15,000
10,000
5,000
0
BRL
mill
ion
ConstructionAquisition 30,032
Figure 12: AMOUNT FINANCE FROM SBPE FOR CONSTRUCTIOAND ACQUISITION OF RESIDENCES
Sources: CEF, Bacen, CBIC
Year Amount financed (SBPF)
Construction Aquisition Total
BRL Million BRL Million BRL Million
1994 1,124 611 1,735
1995 826 1,051 1,876
1996 699 764 1,463
1997 857 868 1,725
1998 1,161 984 2,146
1999 758 916 1,673
2000 1,048 888 1,935
2001 666 1,216 1,882
2002 595 1,175 1,769
2003 965 1,252 2,218
2004 1,394 1,608 3,002
2005 2,855 1,997 4,852
2006 4,484 4,857 9,340
2007 9,401 9,009 18,410
2008 16,221 13,811 30,032
TABLE 8: AMOUNT FINANCED FROM SBPE FOR CONSTRUCTION AND ACQUISITION OF RESIDENCES
Financing VolumesThe SFH achieved in historical values, the
mark of BRL 75 billion in funding the
residential construction and acquisition only
through funds raised by SBPE.
In the last 10 years, the funds raised in the
environment of the SFI were able to accrue just
over 7% of this amount, being in its most part
resources for the production or acquisition of
non-residential units.
In the SFI system, which fund raising system
is not based on savings, but in placement of
securities (the CRIs), overall there were 273
new offerings, including the raising of BRL
5,523 million. Since its inception, the SFI has
not been able to finance expressive volumes.
Figure 13 illustrates the behavior of the two
systems in finance volumes, within the last 10
years (1999-2008).

33
PART III HOUSING FINANCE IN BRAZIL
The image shows that the Brazilian housing
finance privileged mechanism is the SFH,
running with the CP (savings accounts) funds
and the FGTS (compulsory savings accounts),
as it was designed in 1964.
The SFI, with its fundamentals in capital
market fund raising, is still an appendix of the
Brazilian global system and tends to persist in
that situation.
Table 9 details Figure 13.
99 00 01 02 03 04 05 06 07 08 year
35,000
30,000
25,000
20,000
15,000
10,000
5,000
0
BRL
mill
ion
SFI (CRi)SFH (SBPE)
Figure13: FINANCED VOLUME SFH (SBPE) AND SFI (CRI)
Source: Bacen, CBIC, Brazilian Securities Issuing and Exchange Commission (CVM)
Year Financed Volume
SFH (SBPE) SFI (CRI)
BRL Million BRL Million
1999 1,673 13
2000 1,935 172
2001 1,882 223
2002 1,769 44
2003 2,218 148
2004 3,002 309
2005 4,852 2,102
2006 9,340 815
2007 18,410 868
2008 30,032 829
2009 5,872 638
Source: Bacen,CBIC,CVM
TABLE 9: FINANCED VOLUME SFH (SBPE) AND SFI (CRI)
The Caderneta de Poupança-CP (savings accounts) BalancesOvercoming the turmoil that took place in
prior periods in Brazil, derived from attempts
at economic plans that sought to contain
the inflationary spiral at the expense, among
others, of changes in rules for remuneration of
the CP savings accounts, since the Real Plan,
the amount of funds invested in conservative
savings has been growing vigorously.
Despite the net inflows that vary in the period,
the volume of global resources are significant
in amounts, in respect to which agents in
applications related to housing finance has
been propelling the growth of credit.

34
HOUSING FINANCE MECHANISMS IN BRAZIL
The evolution of CP balance and net fund
raising and withdraw balances is illustrated in
Figure 14.
The CP balance shows stability in these
years (since Real beginning) which gives to
the system the necessary confidence to keep
financing for 20/30 years against a month of
compulsory retaining of the deposits. The
asymmetry already described in Figures 1
and 2, although representing a liability of the
system is being surpassed for the long funds
retaining cycles experimented in those 35
years of SFH.
Residential Loans and Use of the Caderneta de Poupança-CP Fundshousing credit has grown permanently since
1994, real estate lenders were allowed to
compute receivables against FCVS (insurance
fund for compensation of installments
adjustments against debt loan balance
adjustments) to reach the chargeability of
65% required for the allocation of resources
raised through the savings accounts (CP). In
current values, the use of such claims peaked in
2004, decreasing since then, what triggered the
allocation of funds to residential construction
and acquisition.
220,000
200,000
180,000
160,000
140,000
120,000
100,000
80,000
60,000
40,000
20,000
0
45,000
40,000
35,000
30,000
25,000
20,000
15,000
10,000
5,000
0
-5,000
-10,000
Annu
al m
ovem
ent (
BRLM
illio
n)
Tota
l sav
ings
(BR
LMill
ion)
year
94 95 96 97 98 99 00 01 02 03 04 05 06 07 08
Savings in CP
Annual Movements = Deposits x Withdraws
FIGURE14: SAVINGS (CP) VOLUME AND ANNUAL NET BALANCE OF DEPOSITS AND WITHDRAWS
Sources: Bacen
35
PART III HOUSING FINANCE IN BRAZIL
On the other hand, the granting of housing
loans have been growing significantly in recent
years caused by, either the fall in interest rates
or expanding the time for payment.
In the period represented in Figure 15, the
granting of credits also used the sources from
LI and CI, and some transfers from funds and
social programs.
Counting the three different sources of funds,
(CP, LI+CH, social programs), in the last
10 years, in average, LI and CH together,
considering the net amount (corresponding to
the total issued, less the total paid), accounted
for 6.6% of the amount financed, while social
programs for 6.2%.
100%
80%
60%
40%
20%
0%
Minimum Required = 65%
95 96 97 98 99 00 01 02 03 04 05 06 07 08
Year
Hous
ing
load
s/ S
avin
gs V
olum
e
FIGURE 15: HOUSING LOANS X SAVINGS VOLUME IN CP
Source: SBPE-SFH, Bacen, CBIC
Residential Loans Allocation Within the CountryConsidering the vast territory of Brazil and
disparities between regions, whether in
terms of population distribution and stage of
socio-economic development of families, the
distribution of housing loans is disbursed.
Using the identification of macro-regions,
characterized by a set of states / territories, as
indicated in Figure 16, we have:
North (N): Acre (AC), Amapá (AP),
Amazonas (AM), Pará (PA), Rondônia
(RO), Roraima (RR) e Tocantins (TO);
36
HOUSING FINANCE MECHANISMS IN BRAZIL
Northeast (NE): Alagoas (AL), Bahia (BA),
Ceará (CE), Maranhão (MA), Paraíba
(PB), Pernambuco (PE), Piauí (PI), Rio
Grande do Norte (RN), Sergipe (SE);
South-East (SE): Espírito Santo (ES),
Minas Gerais (G), Rio de Janeiro (RJ) e
São Paulo (SP);
South (S): Paraná (PR), Santa Catarina
(SC), Rio Grande do Sul (RS) and
Mid-West (MW): Distrito Federal (DF),
Goiás (GO), Mato Grosso (MT), Mato
Grosso do Sul (MS).
Figure 7 presents the distribution of loans all
over the country.
RR AP
AM
AC RO
S
SE
MG
SPMS
PR
RS
SC
RJ
ES
PE
SEBA
TO
GOMT
AL
PB
RNCEMA
PI NEN
PA
DF
Figure 16: BRAZILIAN REGIONS

37
PART III HOUSING FINANCE IN BRAZIL
350,000
300,000
250,000
200,000
150,000
100,000
50,000
0
Units
98 99 00 01 02 03 04 05 06 07 08
39,368
196,133
113,873
61,22353,827
36,48028,905
35,79536,46535,131
Mid-west
South
SouthEast
NorthEast
North
299,685
FIGURE 17: NUMBER OF RESIDENTIAL UNITS FINANCED (SBPE) ACCORDING TO REGIONS
Sources: CEF, Bacen, CBIC

38

39

40
Housing finance mechanisms in Brazil have a very particular structure, when compared with the existing system allover the world. The Federal Government, aiming to solve different situations at the same time, created the Brazilian system in 1964. Labor problems caused by stability, the intensive creation of unqualified jobs in civil construction and the institutionalization of a housing finance mechanism, for construction and acquisition.
The whole conception of the Brazilian system is based on these two sources of funds: Fundo de garantia por tempo de serviço-FGTS - a retirement fund and Caderneta de Poupança –Savings Account (CP). The mortgages remain as anchors of the savings (mandatory in FGTS and voluntary in CP). As the mortgages are not object of securitization, the system operate at a very low level of leverage, and its growth is based on the capacity of the economy to create jobs and pay salaries adjusted higher than the accrued inflation rates. In 2008, construction finance accounted for 9 USD billions; acquisition finance 7.7 USD billions, 299,685 residential units were financed from the housing finance system in Brazil.
United Nations Human Settlements ProgrammeP.O. Box 30030, GPO Nairobi, 00100, KenyaTelephone: +254 20 762 3120Fax: +254 20 762 [email protected]
The Human Settlements Finance Systems Series
HS/115/10EISBN: 978-92-1-132225-5 (Volume)ISBN: 987-92-1-132027-5 (Series)