housing finance market in poland - efbs
TRANSCRIPT

Housing Finance Market in Poland
Regulations & Initiatives
Dr. Jacek Furga
Chairman of the Real Estate Finance Committee
at Polish Banks Association

Situation on housing loans market
2002 2003 2004 2005 2006 2007 2008 2009 2010 2011 2012 2013 2014 2015 Q1 - Q22016
112 141 162 218
302 314 287 189 230 231 197 177 174 181
94
290 405
521
717
945
1.136
1.303 1.374
1.449
1.631 1.732
1.820 1.897
1.995 2.028
number of new loan agreements [thousand] total number of active housing loans [thousand]
Source: Polish Banks Association - SARFiN

2002 2003 2004 2005 2006 2007 2008 2009 2010 2011 2012 2013 2014 2015 Q1 - Q22016
7,4 11,3 15,2 24,2
42,0 55,9 57,1
38,7 48,7 49,2
39,1 36,5 36,8 39,3 20,0 19,5
29,6 35,8 50,4
77,7
116,8
192,6
214,9
263,6
313,7 316,3 330,8
350,4
374,1 382,9
value of new loan agreements [PLN billion] total debt from housing loans [PLN billion]
Situation on housing loans market
Source: Polish Banks Association - SARFiN

Average value of a housing loan (in PLN; € 1 = PLN 4,3)
76
.22
0
81
.34
0
94
.24
0
10
9.5
50
13
9.1
40
18
7.2
90
20
5.1
80
20
2.4
48
20
5.9
54
20
7.5
71
19
5.5
99
20
0.0
70
20
6.5
52
21
2.6
49
21
2.5
64
0
50.000
100.000
150.000
200.000
250.000
2002 2003 2004 2005 2006 2007 2008 2009 2010 2011 2012 2013 2014 2015 Q1 - Q22016
Source: Polish Banks Association - SARFiN

Currency structure of the value of new loans
0%
10%
20%
30%
40%
50%
60%
70%
80%
90%
100%
Q 12008
Q 32008
Q 12009
Q 32009
Q 12010
Q 32010
Q 12011
Q 32011
Q 12012
Q 32012
Q 12013
Q 32013
Q 12014
Q 32014
Q 12015
Q 32015
Q 12016
PLN CHF EUR Other
Source: Polish Banks Association - SARFiN
0%
1%
2%
3%
4%
5%
Q 12009
Q 32009
Q 12010
Q 32010
Q 12011
Q 32011
Q 12012
Q 32012
Q 12013
Q 32013
Q12014
Q32014
Q12015
Q32015
Q12016
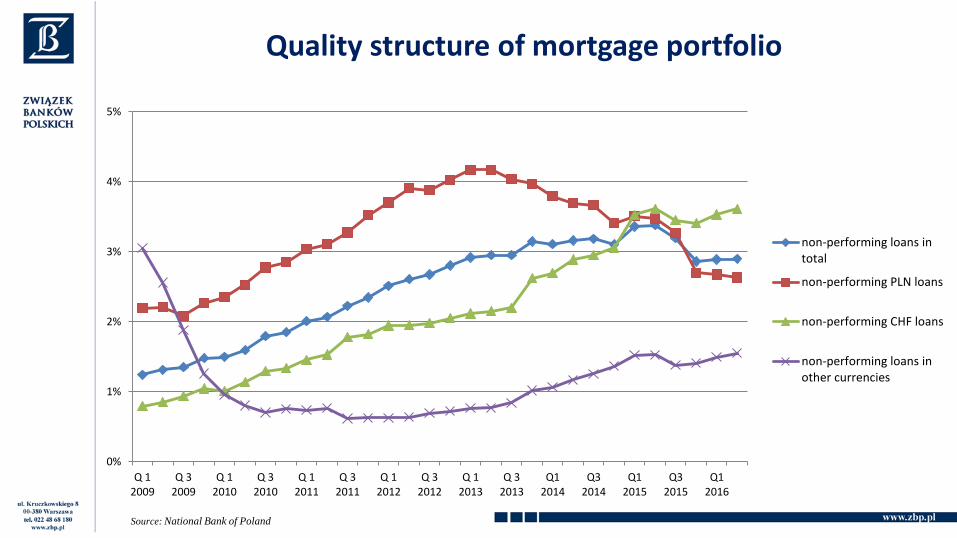
non-performing loans intotal
non-performing PLN loans
non-performing CHF loans
non-performing loans inother currencies
Quality structure of mortgage portfolio
Source: National Bank of Poland

Number of new housing loans granted under the ’Family On Its Own’ Programme (RnS)
0
10.000
20.000
30.000
40.000
50.000
60.000
2007 2008 2009 2010 2011 2012 2013
4.0
01
6.6
45
30
.88
2
43
.12
0 51
.32
8
48
.79
2
10
.59
2
Source: BGK

Number of new housing loans granted under the ’Flat for Youth’ (MdM) Programme
0
5000
10000
15000
20000
25000
30000
2014 2015 2016 2017 2018
9.1
41
21
.88
8 2
7.1
09
12
.56
4
33
5
Source: BGK

Source: National Bank of Poland, Ministry of Finance
Households savings [PLN billion]
58,6 52,2 58,0 63,0 61,5 65,1 65,2 63,6 65,2 65,1
0
200
400
600
800
1000
1200
1400
2007 2008 2009 2010 2011 2012 2013 2014 2015 Q1 - Q2 2016
in PLN billion in relation to GDP [%]

Source: ‚Polish attitudes towards finances’ Report, Kronenberg Foundation
at Citi Handlowy Bank, 2015
Propensity to save in Poland
35%
43%
16%
6%
don't save occasional saving systematic saving no answer

Source: National Bank of Poland, Central Statistical Office, Ministry of Finance
57,7%
13,6%
11,2%
4,6% 8,5%
0,5% [WARTOŚĆ] 2,9%
deposits cash
OFE capital insurance funds
investment funds foreign investment funds
government bonds stocks
Structure of household savings in June 2016 (total € 279 billion)

Source: National Bank of Poland
Structure of bank deposits of households in June 2016 (total € 160 billion)
54,0%
43,5%
2,5%
overnight deposits
deposits with agreed maturity of up and including two years
other fixed-term deposits

Prices of dwellings in major Polish cities (PLN per sq. m.)
0
1.000
2.000
3.000
4.000
5.000
6.000
7.000
8.000
9.000
Q1 Q2 Q3 Q4 Q1 Q2 Q3 Q4 Q1 Q2 Q3 Q4 Q1 Q2 Q3 Q4 Q1 Q2 Q3 Q4 Q1 Q2 Q3 Q4 Q1 Q2 Q3 Q4 Q1 Q2 Q3 Q4 Q1 Q2 Q3 Q4 Q1 Q2 Q3 Q4 Q1 Q2 Q3 Q4 Q1 Q2 Q3 Q4 Q1 Q2
2004 2005 2006 2007 2008 2009 2010 2011 2012 2013 2014 2015 2016
Warsaw Bialystok Katowice agglomeration Wroclaw Gdansk Cracow Poznan Lodz
Source: AMRON Centre

14
First pillar : Apartments for rent constructed on the State land:
Dedicated to families who do not have credit worthiness to get a
mortgage and their incomes are sufficient to pay the market rent;
Assumed rental fee: PLN 10-20 per sq. m. per month (construction cost) + building operation costs
′The ownership path’ as a possible option (rental fee higher by 20%);
Construction projects financed by selling the land from the ′land bank′ (the State Treasury, local government units and private entities land transferred in exchange for the investment certificates enabling to participate in the National Housing Fund profits);
Start of construction projects: first half of 2018
National Housing Programme (′Flat Plus′ Programme)

15
Second pillar: State’s support for the social rental housing:
Programme supporting construction of housing with low or moderate rent, used in the formula of social rental housing;
Programme intended for people whose income is too high to get a house from the municipality and too low to purchase or rent an apartment on the market;
Local governments allowed to apply for funding in the amount of 35-55% of the project construction costs;
Local governments, municipal companies and social housing societies allowed to apply for preferential loans at Bank Gospodarstwa Krajowego
Start of application process: year 2018
National Housing Programme ('Flat Plus' Programme)

16
Third pillar: State’s support for saving for housing purposes:
Savings collected on Individual Housing Accounts (IKM), held by banks and credit unions;
Tax exemptions (concerning interest accrued on deposited savings) and additional support in the form of State’s bonuses are planned;
Planned value of the suport: approx. PLN 1 billion per year ;
Implementation schedule: adoption of the draft law by the Council of Ministers in the second quarter of 2017, first saving accounts (IKM) in 2018.
National Housing Programme ('Flat Plus' Programme)

17
Savings collected on Individual Housing Accounts (IKM)
saving rules:
minimum period of saving: 60 months,
no limit on the length of saving period,
one saving account (IKM) per one saver,
maximum limit of savings entitling to tax exemption and maximum level of State bonus to be specified in the Act;
National Housing Programme ('Flat Plus' Programme)

18
A comprehensive plan to create a voluntary capital saving system and long-term investment products in Poland
8 key pillars of the Programme:
1. Employee Capital Plans (PPK); 2. Individual Capital Plans (IPK) for microenterprises;
3. Polish Development Fund;
4. Central Electronic Registry of pension schemes;
5. Public Real Estate Funds (′Polish REITs′);
6. Premium bonds and project bonds;
7. Lower taxes on income from long-term investments lasting more than 1 year;
8. Reconstruction model of the Open Pension Funds (OFE).
Responsible Development Strategy (Capital Building Programme)

19
Estimated total cost of PPK and IPK fiscal incentives: approx. PLN 2.2 billion (0.11 percent. of GDP) during the first two years and PLN 1.7 billion (0.08 percent) in the following years.
• Capital Building Programme expected results:
5.5 million more participants of the third pillar pension system (assumptions: participation of 75% employees ),
more than PLN 12 billion new savings in the third pillar per year at an average premium of 4%,
more than PLN 120 million (nearly 5 percent of GDP) inflow of the new funds to the Polish capital market after 10 years,
Capital Building Programme
