household use of information technology - australian bureau of
TRANSCRIPT

42Glossary . . . . . . . . . . . . . . . . . . . . . . . . . . . . . . . . . . . . . . . . . . . . . .38Technical note . . . . . . . . . . . . . . . . . . . . . . . . . . . . . . . . . . . . . . . . . .33Explanatory notes . . . . . . . . . . . . . . . . . . . . . . . . . . . . . . . . . . . . . . . .
A D D D I T I O N A L I N F O R M A T I O N
27Chapter 5: Selected Internet transactions . . . . . . . . . . . . . . . . . . . . . . . . .21
Chapter 4: Type of Internet connection and type of technology used for broadband Internet access . . . . . . . . . . . . . . . . . . . . . . . . . . .
12Chapter 3: Use of computers or the Internet . . . . . . . . . . . . . . . . . . . . . . .5Chapter 2: Characteristics of households with computers or Internet access . . . .4Chapter 1: Main findings . . . . . . . . . . . . . . . . . . . . . . . . . . . . . . . . . . . .3List of tables . . . . . . . . . . . . . . . . . . . . . . . . . . . . . . . . . . . . . . . . . . . .2Notes . . . . . . . . . . . . . . . . . . . . . . . . . . . . . . . . . . . . . . . . . . . . . . . .
page
C O N T E N T S
E M B A R G O : 1 1 . 3 0 A M ( C A N B E R R A T I M E ) T H U R S 1 5 D E C 2 0 0 5
HOUSEHOLD USE OF INFORMATIONTECHNOLOGY A U S T R A L I A
8146.02 0 0 4 – 0 5
For further informationabout these and relatedstatistics, contact theNational Information andReferral Service on1300 135 070 orSiddhartha De on Canberra(02) 6252 6519.
I N Q U I R I E S
w w w . a b s . g o v . a u
De n n i s T r e w i n
Au s t r a l i a n S t a t i s t i c i a n
The ABS welcomes comments and suggestions from users regarding future surveys of IT
use by households and individuals. These comments should be addressed to the
Director, Innovation and Technology National Statistics Centre, Australian Bureau of
Statistics, Locked bag 10 Belconnen, ACT, 2616.
CO M M E N T S
Information about ABS activities in the field of IT statistics is available free from the ABS
website. Details of other ABS publications relating to the production and use of IT in
Australia can be found in paragraph 31 of the Explanatory Notes.
MO R E IN F O R M A T I O N ON
AB S IN F O R M A T I O N
TE C H N O L O G Y ( I T )
S T A T I S T I CS
Where estimates have been rounded, discrepancies may occur between the sums of the
components items and totals.
EF F E C T S OF RO U N D I N G
Due to the difference in the scope of previous surveys, previous person level data on
household use of information technology which is comparable with the 2004-05 survey is
only available up until 2002. The HUIT data for 2003 was obtained from the Survey of
Disability, Ageing and Carers (SDAC), and person level data from this survey only relates
to persons with a disability aged 15 years or over, and is thus not comparable with results
from MPHS 2004-05. SDAC data are comparable at the household level.
H I S T O R I C A L
CO M P A R I S O N S
The 2004-05 MPHS included a HUIT module. The survey collected information from
15,524 randomly selected private dwelling households across Australia. In the survey,
one randomly selected person per household was asked about their household's access
to, and their own use of, computers and the Internet.
AB O U T TH E 20 0 4 - 0 5
MP H S
Data on Household Use of Information Technology (HUIT) was previously collected by
the ABS in the Population Survey Monitor (1996, 1998, 1999 and 2000), Survey of
Education, Training and Information Technology (2001), General Social Survey (2002),
National Aboriginal and Torres Strait Islander Survey (2002), Survey of Disability, Ageing
and Carers (2003) and the Survey of Children's Participation in Cultural and Leisure
Activities (2000 and 2003).
AB O U T HO U S E H O L D US E
OF IN F O R M A T I O N
TE C H N O L O G Y (H U I T ) DA T A
This publication presents results from the Multi-Purpose Household Survey (MPHS) that
was conducted by the ABS as a supplement to the Labour Force Survey (LFS) each
month from August 2004 to June 2005. The statistics included in this publication present
information about access to computers and the Internet by people aged 18 years or over
in these households.
I N T R O D U C T I O N
2 A B S • H O U S E H O L D U S E OF I N F O R M A T I O N T E C H N O L O G Y • 8 1 4 6 . 0 • 2 0 0 4 – 0 5
N O T E S
L I S T OF TA B L E S . . . . . . . . . . . . . . . . . . . . . . . . . . . . . . . . . . . . . .
32Main reason for not purchasing via the Internet, by age5.5 . . . . . . . . . . . . .31
Total expenditure by persons on Internet purchases and orders, by
age
5.4. . . . . . . . . . . . . . . . . . . . . . . . . . . . . . . . . . . . . . . . . . . . .
31
Goods or services purchased or ordered by persons via the Internet,
broad product groups, by age
5.3. . . . . . . . . . . . . . . . . . . . . . . . . . . . .
30
Persons purchasing or ordering goods or services via the Internet for
private use, selected characteristics
5.2. . . . . . . . . . . . . . . . . . . . . . . . .
29
Persons purchasing or ordering goods or services via the Internet for
private use, by age group
5.1. . . . . . . . . . . . . . . . . . . . . . . . . . . . . . .
SE L E C T E D IN T E R N E T TR A N S A C T I O N S
26
Household Internet access, selected characteristics, by type of
broadband access
4.3. . . . . . . . . . . . . . . . . . . . . . . . . . . . . . . . . . . .
25Personal use of the Internet, selected characteristics, by type of access4.2 . . . .24
Household Internet connection, selected characteristics, by type of
access
4.1. . . . . . . . . . . . . . . . . . . . . . . . . . . . . . . . . . . . . . . . . . .
TY P E OF IN T E R N E T CO N N E C T I O N AN D TY P E OF TE C H N O L O G Y US E D FO R BR O A D B A N D
IN T E R N E T AC C E S S
20Frequency of Internet use by persons, by site3.6 . . . . . . . . . . . . . . . . . . .19
Use of the Internet at home, selected characteristics, by main
purpose
3.5. . . . . . . . . . . . . . . . . . . . . . . . . . . . . . . . . . . . . . . . . .
18Use of the Internet, selected characteristics, by purpose3.4 . . . . . . . . . . . .17Use of the Internet, selected characteristics, by site3.3 . . . . . . . . . . . . . . .16Use of computers, by persons, selected characteristics by purpose3.2 . . . . . .15Use of computers by persons, selected characteristics3.1 . . . . . . . . . . . . .
US E OF CO M P U T E R S OR TH E IN T E R N E T
11
Households access to home computer or Internet, by equivalised
household income quintile
2.5. . . . . . . . . . . . . . . . . . . . . . . . . . . . . .
10Households with home Interne access, by selected characteristics2.4 . . . . . .9
Households with home Internet access, selected characteristics by
period
2.3. . . . . . . . . . . . . . . . . . . . . . . . . . . . . . . . . . . . . . . . . . . .
8
Households with access to a home computer, by selected
characteristics
2.2. . . . . . . . . . . . . . . . . . . . . . . . . . . . . . . . . . . . . . .
7
Households with access to a home computer, selected characteristics
by period
2.1. . . . . . . . . . . . . . . . . . . . . . . . . . . . . . . . . . . . . . . . . .
CH A R A C T E R I S T I C S OF HO U S E H O L D S W I T H CO M P U T E R S OR IN T E R N E T AC C E S S
page
A B S • H O U S E H O L D U S E OF I N F O R M A T I O N T E C H N O L O G Y • 8 1 4 6 . 0 • 2 0 0 4 – 0 5 3

CHAP T E R 1 MA I N F I N D I N G S . . . . . . . . . . . . . . . . . . . . . . . . . . . . . . . . . . . . . .
Overall, 60% of Australian adults used a computer at home and 52% accessed the
Internet at home during 2004-05. Personal or private purposes was stated as the most
popular purpose of computer or Internet use at home, followed by work or business
related purposes. In 2004-05, home was reported to be the most popular site of Internet
use.
Of the 4.4 million households with home Internet access in 2004-05, 28% had broadband
Internet access and 69% had dial-up access. Of the households with broadband access,
the most commonly reported type of technology used was Digital Subscriber Line (DSL),
reported by 76% of households with broadband access.
Australians are increasing their use of information technology, in particular making more
use of the Internet to purchase or order goods or services. In 2004-05, of all Australian
adults aged 18 years or over, an estimated 31% purchased or ordered goods or services
via the Internet for private use. Travel, accommodation or tickets of any kind were
identified as the most popular product purchased or ordered over the Internet. Of the
people that did not purchase or order over the Internet, "had no need to" was the
principal reason given, followed by concerns over security.
In 2004-05, 67% of Australian households had access to a computer at home and 56%
had home Internet access. The growth in household access to computers over recent
years (from 61% to 67% between 2002 and 2004-05) has been significantly lower than the
growth in household home Internet access (from 46% to 56% between 2002 and
2004-05).
I N T R O D U C T I O N
4 A B S • H O U S E H O L D U S E OF I N F O R M A T I O N T E C H N O L O G Y • 8 1 4 6 . 0 • 2 0 0 4 – 0 5

CHAP T E R 2 CH A R A C T E R I S T I C S OF HO U S E H O L D S W I T HCO M P U T E R S OR IN T E R N E T AC C E S S . . . . . . . . . . . . . . . .
The percentage of Australian households with access to the Internet at home has
increased significantly over the past 7 years, rising from 16% in 1998 to 56% in 2004-05.
From 2003 to 2004-05, there has been an increase of 3 percentage points.
As with home computer access, the percentage of households with Internet access was
higher for households with children under 15 years of age, households in the Australian
Capital Territory, households in the highest income quintile and households in
metropolitan areas.
CH A N G E S IN HO M E
IN T E R N E T AC C E S S
The percentage of Australian households with access to a computer at home has
increased from 44% in 1998 to 67% in 2004-05. However, from 2003 to 2004-05, the
increase was only 1 percentage point.
During 2004-05, the percentage of households with home computer access was
significantly higher for households with children under 15 years of age, households in
the Australian Capital Territory and households in the highest income quintile.
Households in metropolitan areas continued to have higher computer access, but the
gap between metropolitan areas and ex-metropolitan areas has narrowed since 1998 to 6
percentage points in 2004-05.
CH A N G E S IN HO M E
CO M P U T E R AC C E S S
Data presented in this chapter were collected in the Population Survey Monitors (1998,
1999 and 2000), the Survey of Education, Training and Information Technology (2001),
the General Social Survey (2002), the Survey of Disability, Ageing and Carers (2003) and
the Multi-Purpose Household Survey (MPHS) 2004-05.
AB O U T TH E DA T A
A B S • H O U S E H O L D U S E OF I N F O R M A T I O N T E C H N O L O G Y • 8 1 4 6 . 0 • 2 0 0 4 – 0 5 5
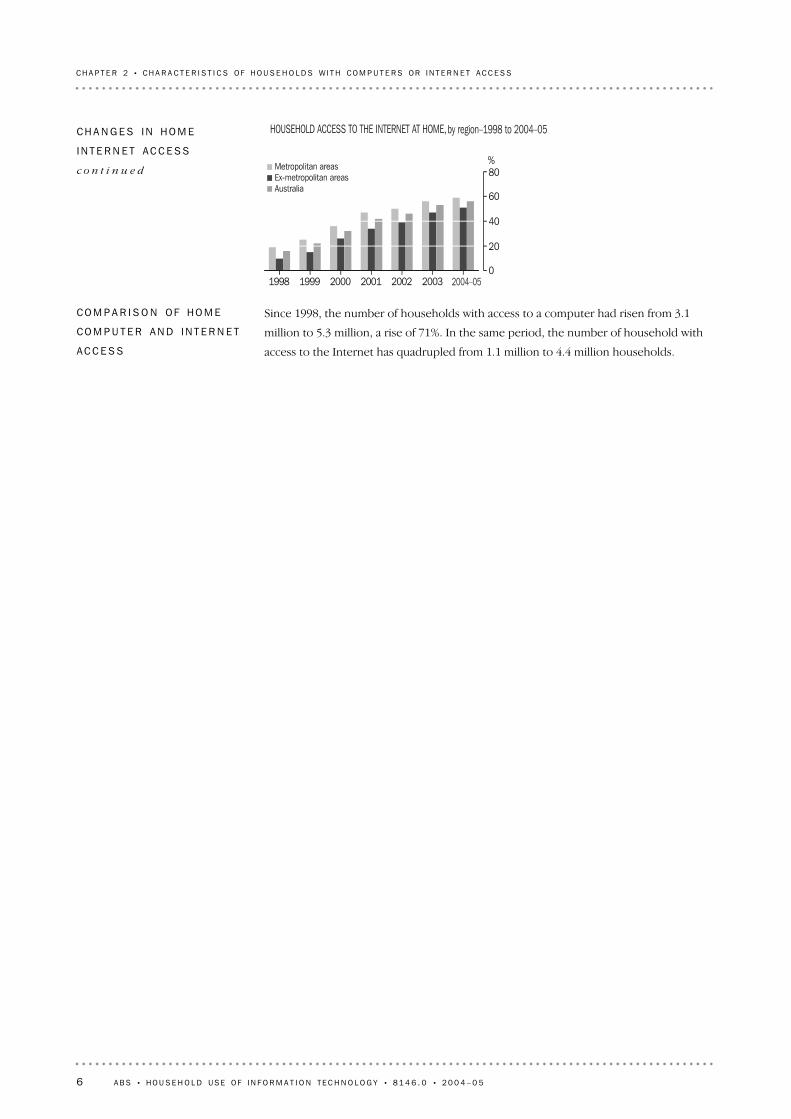
Since 1998, the number of households with access to a computer had risen from 3.1
million to 5.3 million, a rise of 71%. In the same period, the number of household with
access to the Internet has quadrupled from 1.1 million to 4.4 million households.
CO M P A R I S O N OF HO M E
CO M P U T E R AN D IN T E R N E T
AC C E S S
CH A N G E S IN HO M E
IN T E R N E T AC C E S S
c o n t i n u e d
6 A B S • H O U S E H O L D U S E OF I N F O R M A T I O N T E C H N O L O G Y • 8 1 4 6 . 0 • 2 0 0 4 – 0 5
CH A P T E R 2 • CH A R A C T E R I S T I C S OF HO U S E H O L D S W I T H CO M P U T E R S OR I N T E R N E T A C C E S S

np not available for publication but included in totals where applicable, unless otherwise indicated(a) Northern Territory estimates for 2003 are included in the totals and other classifications but cannot be shown
separately.
67666158534744Total
63615452484038Ex-metropolitan areas69696562555148Metropolitan areas
Region
79807877706664Australian Capital Territory71np6252545542Northern Territory(a)61575150454036Tasmania69676358555044Western Australia64625856494541South Australia67655755504443Queensland68686261565046Victoria67656159524544New South Wales
State or territory
84857977716563With children under 1560585351443936Without children under 15
Households
PR O P O R T I O N OF AL L HO U S E H O L D S (% )
5 2665 0384 5564 3113 8033 3373 083Total
1 8101 6891 4651 3831 2601 035958Ex-metropolitan areas3 4553 3493 0912 9282 5432 3022 126Metropolitan areas
Region
99999694847975Australian Capital Territory38np3428282720Northern Territory(a)
1191119896847566Tasmania545512479427397352300Western Australia409390355346299272246South Australia
1 026957822776680585562Queensland1 3061 2781 1441 108987867791Victoria1 7231 6531 5281 4351 2441 0791 023New South Wales
State or territory
1 8781 8601 7141 6751 5481 4041 354With children under 153 3883 1792 8422 6362 2551 9321 730Without children under 15
Households
NU M B E R OF HO U S E H O L D S ( ' 0 0 0 )
2004-05200320022001200019991998
HOUSEHOLDS WITH ACCESS TO A HOME COMPUTER, se lec ted charac te r i s t i cs by
per iod —1998 to 2004- 052.1 . . . . . . . . . . . . . . . . . . . . . . . . . . . . . . . . . . . . . . . . . . . . . . . . .
A B S • H O U S E H O L D U S E OF I N F O R M A T I O N T E C H N O L O G Y • 8 1 4 6 . 0 • 2 0 0 4 – 0 5 7
CH A P T E R 2 • CH A R A C T E R I S T I C S OF HO U S E H O L D S W I T H CO M P U T E R S OR I N T E R N E T A C C E S S

(a) For information on equivalised household income refer toparagraph 19 to 24 of the Explanatory Notes.
(b) Includes those households with income less than zero. Seeparagraph 18 of the Explanatory Notes for more information.
677 847Total
632 854Ex-metropolitan areas694 993Metropolitan areas
Region
79125Australian Capital Territory7155Northern Territory61196Tasmania69789Western Australia64643South Australia671 532Queensland681 916Victoria672 590New South Wales
State or territory
711 734Could not be determined92648$120,000 or over88978$80,000-$119,999751 853$40,000-$79,999452 634$0-$39,999(b)
Household income
711 734Could not be determined89134$120,000 or over88319$80,000-$120,000801 714$40,000-$79,999573 947$0-$39,999(b)
Equivalised household income(a)
842 236With children under 15605 611Without children under 15
Households
%'000
Households
with access
to home
computer
Total no.
of all
households
HOUSEHOLDS WITH ACCESS TO A HOME COMPUTER, by selec ted
characte r i s t i cs —2004- 052.2 . . . . . . . . . . . . . . . . . . . . . . . . . . . . . . . . . . . . . . . . . . . . . . . . .
8 A B S • H O U S E H O L D U S E OF I N F O R M A T I O N T E C H N O L O G Y • 8 1 4 6 . 0 • 2 0 0 4 – 0 5
CH A P T E R 2 • CH A R A C T E R I S T I C S OF HO U S E H O L D S W I T H CO M P U T E R S OR I N T E R N E T A C C E S S

np not available for publication but included in totals where applicable, unless otherwise indicated(a) Northern Territory estimates for 2003 are included in the total and other clasifications but cannot be shown
separately.
56534642322216Total
51473934261510Ex-metropolitan areas59565047362519Metropolitan areas
Region
67666060463427Australian Capital Territory61np4838353016Northern Territory(a)48413531251810Tasmania58534841342215Western Australia50484337291912South Australia56524240312015Queensland57544643342315Victoria56544845322218New South Wales
State or territory
72685954432920With children under 1549474037281814Without children under 15
Households
PR O P O R T I O N OF AL L HO U S E H O L D S (% )
4 3934 0393 4453 1142 3401 5381 098Total
1 4521 3031 047908676387264Ex-metropolitan areas2 9402 7372 3982 2061 6651 151834Metropolitan areas
Region
84827473564132Australian Capital Territory34np262118148Northern Territory(a)94786759483419Tasmania
456406366300245155101Western Australia32330026122917711775South Australia861757602563416269194Queensland
1 0851 019852780603394255Victoria1 4551 3651 1961 088776514414New South Wales
State or territory
1 6211 5021 2921 178932633441With children under 152 7722 5372 1531 9361 408905657Without children under 15
Households
NU M B E R OF HO U S E H O L D S ( ' 0 0 0 )
2004-05200320022001200019991998
HOUSEHOLDS WITH HOME INTERNET ACCESS, selec ted charac te r i s t i cs by
per iod —1998 to 2004- 052.3 . . . . . . . . . . . . . . . . . . . . . . . . . . . . . . . . . . . . . . . . . . . . . . . . .
A B S • H O U S E H O L D U S E OF I N F O R M A T I O N T E C H N O L O G Y • 8 1 4 6 . 0 • 2 0 0 4 – 0 5 9
CH A P T E R 2 • CH A R A C T E R I S T I C S OF HO U S E H O L D S W I T H CO M P U T E R S OR I N T E R N E T A C C E S S
(a) For more information in equivalised household income refer toparagraph 19 to 24 of the Explanatory Notes.
(b) Includes those households with income less than zero.
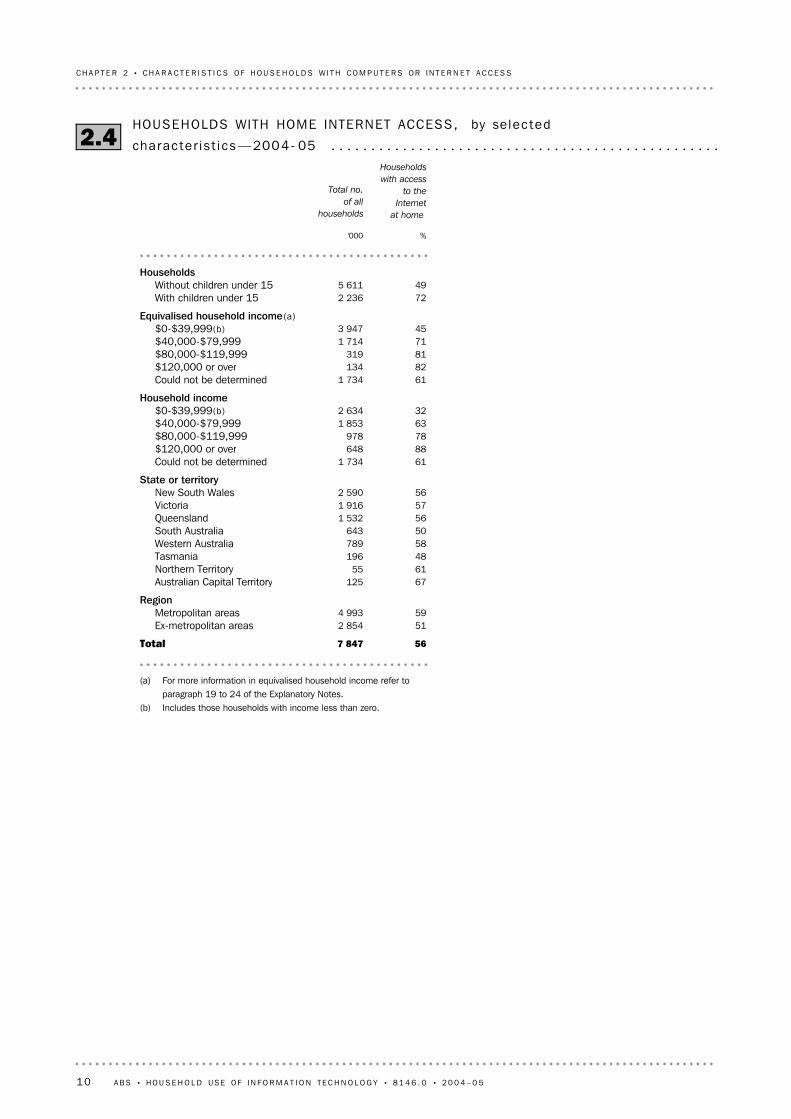
567 847Total
512 854Ex-metropolitan areas594 993Metropolitan areas
Region
67125Australian Capital Territory6155Northern Territory48196Tasmania58789Western Australia50643South Australia561 532Queensland571 916Victoria562 590New South Wales
State or territory
611 734Could not be determined88648$120,000 or over78978$80,000-$119,999631 853$40,000-$79,999322 634$0-$39,999(b)
Household income
611 734Could not be determined82134$120,000 or over81319$80,000-$119,999711 714$40,000-$79,999453 947$0-$39,999(b)
Equivalised household income(a)
722 236With children under 15495 611Without children under 15
Households
%'000
Households
with access
to the
Internet
at home
Total no.
of all
households
HOUSEHOLDS WITH HOME INTERNET ACCESS, by se lec ted
characte r i s t i cs —2004- 052.4 . . . . . . . . . . . . . . . . . . . . . . . . . . . . . . . . . . . . . . . . . . . . . . . . .
10 A B S • H O U S E H O L D U S E OF I N F O R M A T I O N T E C H N O L O G Y • 8 1 4 6 . 0 • 2 0 0 4 – 0 5
CH A P T E R 2 • CH A R A C T E R I S T I C S OF HO U S E H O L D S W I T H CO M P U T E R S OR I N T E R N E T A C C E S S

(a) Excludes those households where income could not bedetermined.
(b) For more information on equivalised household income quintilesrefer to paragraph 19 to 24 of the Explanatory Notes.
55666 113Total
78861 222Highest quintile66771 224Fourth quintile60741 222Third quintile41541 222Second quintile28411 224Lowest quintile
Quintiles
%%'000
Households
with access
to the
Internet
at home
Households
with access
to a home
computer
No. of
households
HOUSEHOLDS ACCESS TO HOME COMPUTER OR INTERNET, by equ i va l i sed
househo ld income quin t i l e (a ) (b ) —2004- 052.5 . . . . . . . . . . . . . . . . . . . . . . . . . . . . . . . . . .
A B S • H O U S E H O L D U S E OF I N F O R M A T I O N T E C H N O L O G Y • 8 1 4 6 . 0 • 2 0 0 4 – 0 5 11
CH A P T E R 2 • CH A R A C T E R I S T I C S OF HO U S E H O L D S W I T H CO M P U T E R S OR I N T E R N E T A C C E S S

CHAP T E R 3 US E OF CO M P U T E R S OR TH E IN T E R N E T . . . . . . . . . . .
Personal/ Private
Work/ Business
Education/ Study
Voluntary/ Community
%
0
20
40
60
80
1002002 2004-05
USE OF COMPUTERS AT HOME, by purpose–2002 and 2004–05
In 2004-05, the most common purpose of computer or Internet use at home was
personal or private purposes (96% of those using a computer at home and 97% of those
using the Internet at home). Work or business related purposes was the next most
common response (representing 53% of those using a computer at home and 50% of
those using the Internet at home), followed by educational or study purposes and
voluntary or community purposes.
PU R P O S E OF CO M P U T E R
AN D IN T E R N E T US E
18-24 25-34 35-44 45-54 55-64 65 or over Total
%
0
20
40
60
80
100 Computer use at homeInternet use at any site
USE OF COMPUTERS AT HOME OR INTERNET AT ANY SITE–2004-05
In 2004-05, 60% of people aged 18 years or over reported having used computer at home
in the previous 12 months. For the same period, 63% had accessed the Internet from any
site. During 2004-05, the proportion of people using a computer at home or the Internet
at any site was relatively higher for the age group of 18-24 years, people living in the
Australian Capital Territory, metropolitan areas, the employed, and non-indigenous
people. The likelihood that a person had used a computer at home or used the Internet
at any site decreased with age.
CO M P U T E R AN D IN T E R N E T
US E
12 A B S • H O U S E H O L D U S E OF I N F O R M A T I O N T E C H N O L O G Y • 8 1 4 6 . 0 • 2 0 0 4 – 0 5
In 2004-05, 63% of Australian persons aged 18 years or over accessed the Internet at any
site, representing an increase of 5 percentage points from 2002. Overall, during 2004-05,
home was reported to be the most likely site at which adults used the Internet.
Aside from home or work, the next most popular site of Internet use in 2004-05 was a
neighbour's, friend's or relative's home, with 19% of adults using such a site. Internet use
from all sites other than home or work generally decreased with age, with the age group
18-24 years being the highest users of the Internet from these sites.
LO C A T I O N OF IN T E R N E T
US E
Personal/private
Work/business
Education/ study
Voluntary/community
Other
%
0
20
40
60
80
100Main purpose of Internet access at homePurpose of Internet access at home
MAIN PURPOSE OF INTERNET USE AT HOME–2004-05
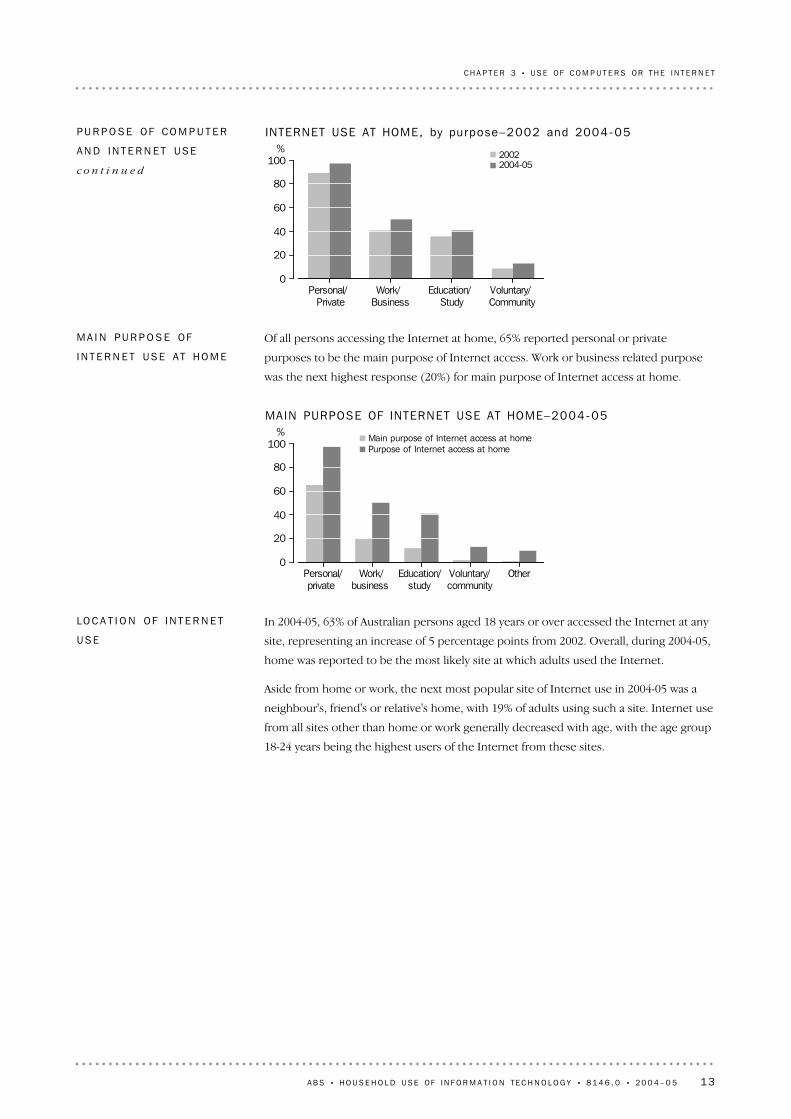
Of all persons accessing the Internet at home, 65% reported personal or private
purposes to be the main purpose of Internet access. Work or business related purpose
was the next highest response (20%) for main purpose of Internet access at home.
MA I N PU R P O S E OF
IN T E R N E T US E A T HO M E
Personal/ Private
Work/ Business
Education/ Study
Voluntary/ Community
%
0
20
40
60
80
10020022004-05
INTERNET USE AT HOME, by purpose–2002 and 2004-05PU R P O S E OF CO M P U T E R
AN D IN T E R N E T US E
c o n t i n u e d
A B S • H O U S E H O L D U S E OF I N F O R M A T I O N T E C H N O L O G Y • 8 1 4 6 . 0 • 2 0 0 4 – 0 5 13
CH A P T E R 3 • U S E OF CO M P U T E R S OR T H E I N T E R N E T

Every day At least weekly
At least monthly
At least yearly
%
0
20
40
60
80
100Home WorkOther sites
FREQUENCY OF INTERNET USE, by si te–2004-05
The frequency with which adults accessed the Internet during 2004-05 varied by site. Of
the 7.8 million adults accessing the Internet at home, 36% used it every day, while 49%
used it at least on a weekly basis and only 13% used the Internet at least once a month.
Of those adults accessing the Internet at work, 59% reported accessing the Internet
every day. Access at sites other than home or work occurred much less frequently.
FR E Q U E N C Y OF IN T E R N E T
US E
Home Work Neighbour'sfriend's
orrelative's
TAFEor
tertiary institution
Public library Other Any site
%
0
20
40
60
80
100
INTERNET USE, by si te–2004-05LO C A T I O N OF IN T E R N E T
US E c o n t i n u e d
14 A B S • H O U S E H O L D U S E OF I N F O R M A T I O N T E C H N O L O G Y • 8 1 4 6 . 0 • 2 0 0 4 – 0 5
CH A P T E R 3 • U S E OF CO M P U T E R S OR T H E I N T E R N E T

^ estimate has a relative standard error of 10% to lessthan 25% and should be used with caution
(a) Includes those persons with income less than zero.(b) Labour force status in the week before the survey.
6015 079Total
575 323Ex-metropolitan areas629 756Metropolitan areas
Region
75237Australian Capital Territory62102Northern Territory55361Tasmania621 486Western Australia591 166South Australia612 891Queensland603 779Victoria595 057New South Wales
State or territory
^49^127Indigenous6014 952Non indigenous
Indigenous status
385 361Not employed729 719Employed
Labour force status(b)
552 334Could not be determined90298$120,000 or over86546$80,000-$119,999743 070$40,000-$79,999548 831$0-$39,999(a)
Personal income
597 667Female617 413Male
Sex
202 46565 or over512 14755–64672 75345–54722 96335–44722 81425–34761 93818–24
Age group (years)
%'000
Home
use of
computer
No. of
persons
aged 18
years
or over
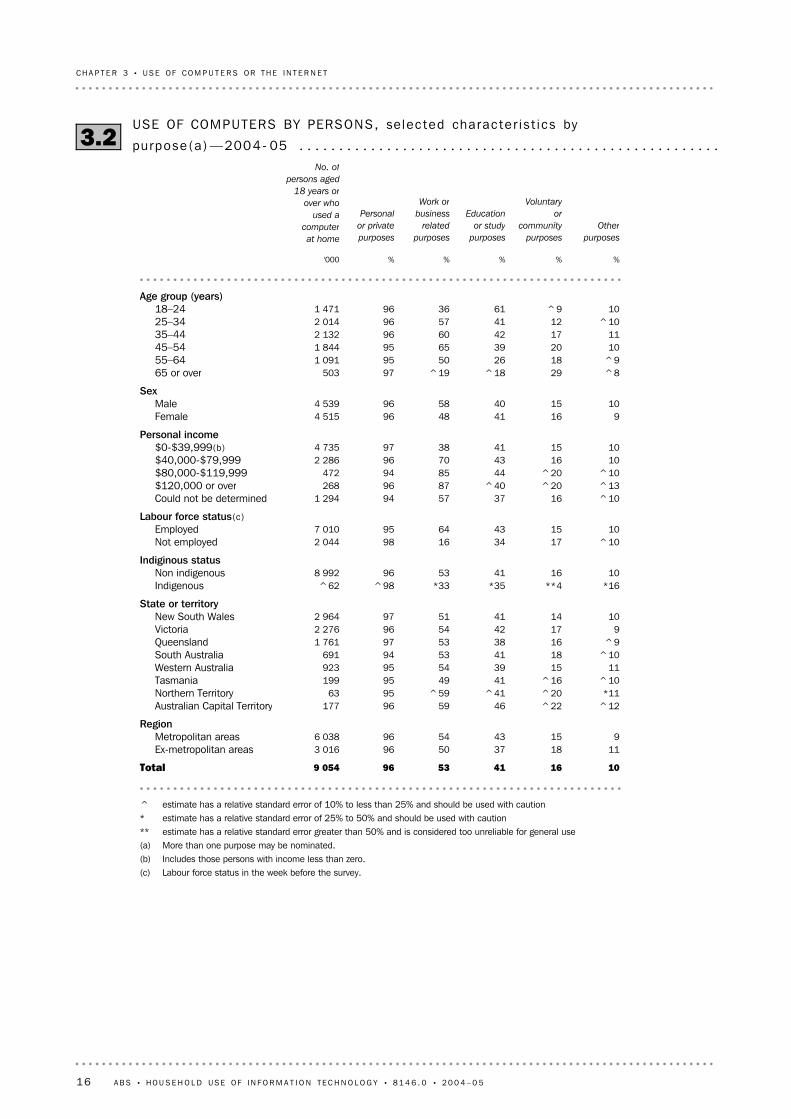
USE OF COMPUTERS BY PERSONS, selec ted charac te r i s t i cs —2004- 053.1 . . . . . . . . .
A B S • H O U S E H O L D U S E OF I N F O R M A T I O N T E C H N O L O G Y • 8 1 4 6 . 0 • 2 0 0 4 – 0 5 15
CH A P T E R 3 • U S E OF CO M P U T E R S OR T H E I N T E R N E T
^ estimate has a relative standard error of 10% to less than 25% and should be used with caution* estimate has a relative standard error of 25% to 50% and should be used with caution** estimate has a relative standard error greater than 50% and is considered too unreliable for general use(a) More than one purpose may be nominated.(b) Includes those persons with income less than zero.(c) Labour force status in the week before the survey.
10164153969 054Total
11183750963 016Ex-metropolitan areas9154354966 038Metropolitan areas
Region
^12^22465996177Australian Capital Territory*11^20^41^599563Northern Territory
^10^16414995199Tasmania1115395495923Western Australia
^1018415394691South Australia^9163853971 761Queensland
9174254962 276Victoria10144151972 964New South Wales
State or territory
*16**4*35*33^98^62Indigenous10164153968 992Non indigenous
Indiginous status
^10173416982 044Not employed10154364957 010Employed
Labour force status(c)
^10163757941 294Could not be determined^13^20^408796268$120,000 or over^10^20448594472$80,000-$119,999
10164370962 286$40,000-$79,99910154138974 735$0-$39,999(b)
Personal income
9164148964 515Female10154058964 539Male
Sex
^829^18^199750365 or over^9182650951 09155–6410203965951 84445–5411174260962 13235–44
^10124157962 01425–3410^96136961 47118–24
Age group (years)
%%%%%'000
Other
purposes
Voluntary
or
community
purposes
Education
or study
purposes
Work or
business
related
purposes
Personal
or private
purposes
No. of
persons aged
18 years or
over who
used a
computer
at home
USE OF COMPUTERS BY PERSONS, selec ted charac te r i s t i cs by
purpose(a ) —2004- 053.2 . . . . . . . . . . . . . . . . . . . . . . . . . . . . . . . . . . . . . . . . . . . . . . . . . . . . .
16 A B S • H O U S E H O L D U S E OF I N F O R M A T I O N T E C H N O L O G Y • 8 1 4 6 . 0 • 2 0 0 4 – 0 5
CH A P T E R 3 • U S E OF CO M P U T E R S OR T H E I N T E R N E T

(a) More than one site may be nominated.(b) Includes those persons with income less than zero.(c) Labour force status in the week before the survey.
^ estimate has a relative standard error of 10% to less than 25%and should be used with caution
* estimate has a relative standard error of 25% to 50% and shouldbe used with caution
63129719295215 079Total
5810761723465 323Ex-metropolitan areas66131082032559 756Metropolitan areas
Region
7922^13^12314965237Australian Capital Territory70^18*9*6^144354102Northern Territory5711^9^6182246361Tasmania65138^62031531 486Western Australia6012891828481 166South Australia6412882028522 891Queensland63121081930523 779Victoria6211971829515 057New South Wales
Stare or territory
^57*10*10*9*24^25^29^127Indigenous63129719295214 952Non indigenous
Indigenous status
37677115305 361Not employed77151082343649 719Employed
Labour force status(c)
5710^561326482 334Could not be determined92^31*4*6^287287298120,000 or over9125^7^9226978546$80,000-$119,9998117772454663 070$40,000-$79,9995591081817458 831$0-$39,999(b)
Personal income
6210981828507 667Female6413872031537 413Male
Sex
17^2*1^2^3^3152 46565 or over49834823422 14755–646813561337592 75345–547512671838642 96335–44801910103244622 81425–34861933164425651 93818–24
Age group (years)
%%%%%%%'000
Any
site
Other
TAFE or
tertiary
institition
Public
library
Neighbour's
or friend's
or relative's
houseWorkHome
No. of
persons
aged 18
years
or over
USE OF THE INTERNET, selec ted charac te r i s t i cs , by si te (a ) —2004- 053.3 . . . . . . . . . .
A B S • H O U S E H O L D U S E OF I N F O R M A T I O N T E C H N O L O G Y • 8 1 4 6 . 0 • 2 0 0 4 – 0 5 17
CH A P T E R 3 • U S E OF CO M P U T E R S OR T H E I N T E R N E T

^ estimate has a relative standard error of 10% to less than 25% and should be used with caution* estimate has a relative standard error of 25% to 50% and should be used with caution** estimate has a relative standard error greater than 50% and is considered too unreliable for general use(a) More than one purpose may be nominated.(b) Includes those persons with income less than zero.(c) Labour force status in week before the survey.
10134150977 793Total
10143747962 462Ex-metropolitan areas9134352975 331Metropolitan areas
Region
^11^20485498154Australian Capital Territory*10^14^39^61^9455Northern Territory
^13^13414697165Tasmania^814395196788Western Australia
^10^15445096563South Australia^9123749971 511Queensland
^10144351971 981Victoria10134250972 576New South Wales
State or territory
**4**2*23*36^98^37Indigenous10134150977 756Non indigenous
Indigenous status
10153516981 618Not employed10134359966 174Employed
Labour force status(c)
^9^133755951 132Could not be determined^11^14^428393258$120,000 or over^11^19458097429$80,000-$119,999
10144365962 040$40,000-$79,9999134136983 933$0-$39,999(b)
Personal income
9134145983 848Female10134156963 944Male
Sex
^8^23^20^219836565 or over^10^1629489689855–64
10183961961 62445–549144158961 89435–44
1094153971 74525–34^10^75931981 26618–24
Age group (years)
%%%%%'000
Other
purposes
Voluntary
or
community
purposes
Education
or study
purposes
Work or
business
related
purposes
Personal
or private
purposes
No. of
persons aged
18 years or
over who
used the
Internet
at home
USE OF THE INTERNET, selec ted charac te r i s t i cs , by purpose(a) —2004- 05 3.4 . . . . .
18 A B S • H O U S E H O L D U S E OF I N F O R M A T I O N T E C H N O L O G Y • 8 1 4 6 . 0 • 2 0 0 4 – 0 5
CH A P T E R 3 • U S E OF CO M P U T E R S OR T H E I N T E R N E T

^ estimate has a relative standard error of 10% to less than 25% and should be used with caution* estimate has a relative standard error of 25% to 50% and should be used with caution** estimate has a relative standard error greater than 50% and is considered too unreliable for general use— nil or rounded to zero (including null cells)(a) Includes those persons with income less than zero.(b) Labour force status in the week before the survey.
^1^21220657 793Total
^1^2^1020672 462Ex-metropolitan areas^1^21220645 331Metropolitan areas
Region
—*3^13^1964154Australian Capital Territory**1*3*7^20^6955Northern Territory**2**1^11^1769165Tasmania
*1*1^102068788Western Australia*1^3^121964563South Australia*1*2^1121661 511Queensland
^1^21319641 981Victoria*1^2^1121642 576New South Wales
State or territory
**1—**12**20*67^37Indigenous^1^21220657 756Non indigenous
Indigenous status
^2^315^4771 618Not employed^1^21125626 174Employed
Labour force status(b)
*1*3^825631 132Could not be determined**2**1*6^45^46258120,000 or over
*1*2^7^4148429$80,000-$119,999*1^2827632 040$40,000-$79,999
^1^21512703 933$0-$39,999(a)Personal income
^1^21316673 848Female^1^21024623 944Male
Sex
*1*5*2^108236565 or over*2^3^6216789855–64*1^3^628611 62445–54
^1^2827621 89435–44^1*1^1119681 74525–34*1—30^5631 26618–24
Age group (years)
%%%%%'000
Other
purposes
Voluntary
or
community
purposes
Education
or study
purposes
Work or
business
related
purposes
Personal
or private
purposes
No. of
persons aged
18 years or
over who
used the
Internet
at home
USE OF THE INTERNET AT HOME, selec ted charac te r i s t i cs , by main
purpose —2004- 053.5 . . . . . . . . . . . . . . . . . . . . . . . . . . . . . . . . . . . . . . . . . . . . . . . . . . . . . . .
A B S • H O U S E H O L D U S E OF I N F O R M A T I O N T E C H N O L O G Y • 8 1 4 6 . 0 • 2 0 0 4 – 0 5 19
CH A P T E R 3 • U S E OF CO M P U T E R S OR T H E I N T E R N E T

^ estimate has a relative standard error of 10% to lessthan 25% and should be used with caution
— nil or rounded to zero (including null cells)
100100100Total^2——Don't know37^22At least yearly31913At least monthly233049At least weekly
75936Everyday
%%%
Accessed
the
Internet at
other site
Accessed
the
Internet
at work
Accessed
the
Internet
at home
FREQUENCY OF INTERNET USE BY PERSONS, by si te —2004- 053.6 . . . . . . . . . . . . . . . .
20 A B S • H O U S E H O L D U S E OF I N F O R M A T I O N T E C H N O L O G Y • 8 1 4 6 . 0 • 2 0 0 4 – 0 5
CH A P T E R 3 • U S E OF CO M P U T E R S OR T H E I N T E R N E T

CHAP T E R 4 TY P E OF IN T E R N E T CO N N E C T I O N AN D TY P E OFTE C H N O L O G Y US E D FO R BR O A D B A N D IN T E R N E TAC C E S S . . . . . . . . . . . . . . . . . . . . . . . . . . . . . . . . . . . . . . . . . . . . . . .
The uptake of dial-up and broadband access varied according to household and
socio-demographic characteristics. The proportion of households accessing the Internet
at home with children under 15 years old with a broadband connection was 30%, and for
households without children under 15 years old was 27%. A higher proportion of males
(34%) with Internet access at home used broadband connection than females (29%). Of
those persons with a broadband Internet connection at home, there was some variation
by age groups. The proportion of persons aged 18-24 years and 45-54 years with a
broadband connection was 37%, while for persons aged 65 years or over it was 26%. The
proportion of people accessing the Internet at home using a dial-up connection did not
vary significantly across age groups. The proportion of households with broadband
access increased with higher annual household income, equivalised gross household
income and personal income.
CH A R A C T E R I S T I C OF
BR O A D B A N D OR D I A L - U P
IN T E R N E T CO N N E C T I O N
US E R S
Dial-up access Broadband Both
%
0
20
40
60
80
TYPE OF HOUSEHOLD INTERNET CONNECT ION–2004-05
During 2004-05, dial-up access was reported to be the most popular method of Internet
connection for households. Of the 4.4 million households accessing the Internet at
home, 69% had a dial-up connection and 28% (1.2 million) reported a broadband
Internet connection.
T Y P E OF HO U S E H O L D
IN T E R N E T CO N N E C T I O N
A B S • H O U S E H O L D U S E OF I N F O R M A T I O N T E C H N O L O G Y • 8 1 4 6 . 0 • 2 0 0 4 – 0 5 21
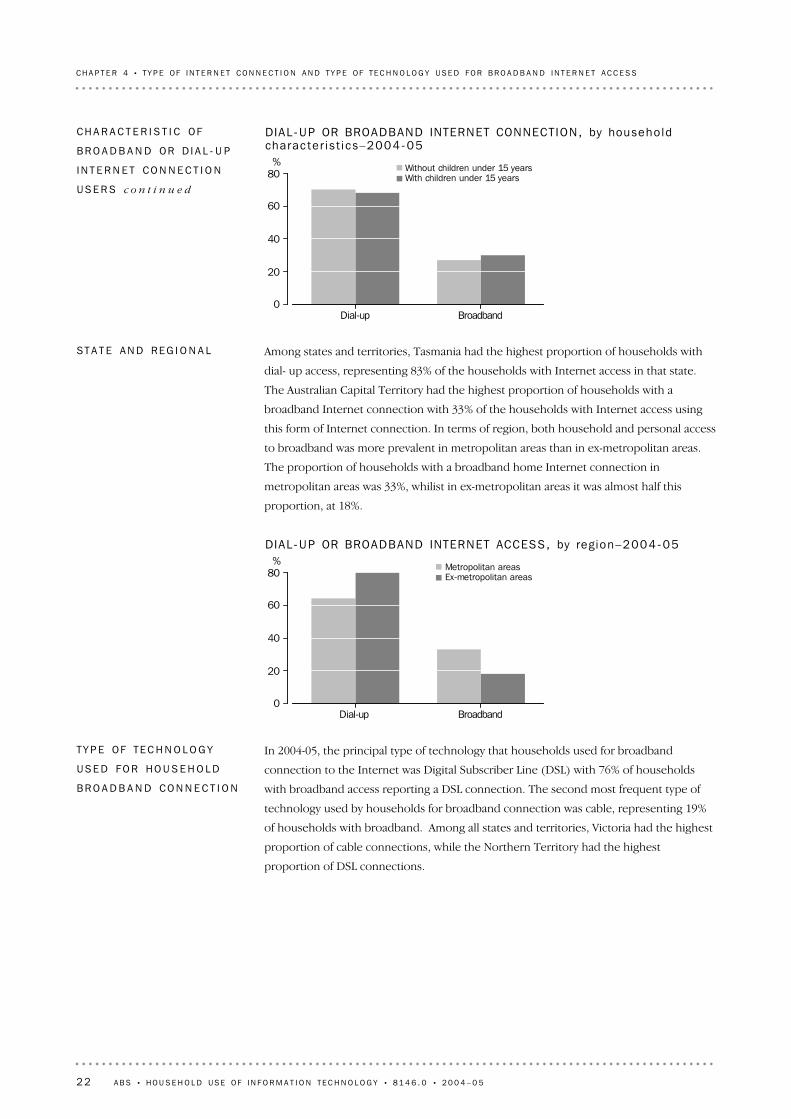
In 2004-05, the principal type of technology that households used for broadband
connection to the Internet was Digital Subscriber Line (DSL) with 76% of households
with broadband access reporting a DSL connection. The second most frequent type of
technology used by households for broadband connection was cable, representing 19%
of households with broadband. Among all states and territories, Victoria had the highest
proportion of cable connections, while the Northern Territory had the highest
proportion of DSL connections.
T Y P E OF TE C H N O L O G Y
US E D FO R HO U S E H O L D
BR O A D B A N D CO N N E C T I O N
Dial-up Broadband
%
0
20
40
60
80Metropolitan areasEx-metropolitan areas
DIAL-UP OR BROADBAND INTERNET ACCESS, by reg ion–2004-05
Among states and territories, Tasmania had the highest proportion of households with
dial- up access, representing 83% of the households with Internet access in that state.
The Australian Capital Territory had the highest proportion of households with a
broadband Internet connection with 33% of the households with Internet access using
this form of Internet connection. In terms of region, both household and personal access
to broadband was more prevalent in metropolitan areas than in ex-metropolitan areas.
The proportion of households with a broadband home Internet connection in
metropolitan areas was 33%, whilist in ex-metropolitan areas it was almost half this
proportion, at 18%.
ST A T E AN D RE G I O N A L
Dial-up Broadband
%
0
20
40
60
80Without children under 15 yearsWith children under 15 years
DIAL-UP OR BROADBAND INTERNET CONNECT ION, by househo ldcharac te r i s t i cs–2004-05
CH A R A C T E R I S T I C OF
BR O A D B A N D OR D I A L - U P
IN T E R N E T CO N N E C T I O N
US E R S c o n t i n u e d
22 A B S • H O U S E H O L D U S E OF I N F O R M A T I O N T E C H N O L O G Y • 8 1 4 6 . 0 • 2 0 0 4 – 0 5
CH A P T E R 4 • T Y P E OF I N T E R N E T C O N N E C T I O N A N D T Y P E OF T E C H N O L O G Y U S E D F O R B R O A D B A N D I N T E R N E T A C C E S S

DSL Cable Other or Don't know
%
0
20
40
60
80
BROADBAND INTERNET ACCESS, by type of techno logy–2004-05TY P E OF TE C H N O L O G Y
US E D FO R HO U S E H O L D
BR O A D B A N D CO N N E C T I O N
c o n t i n u e d
A B S • H O U S E H O L D U S E OF I N F O R M A T I O N T E C H N O L O G Y • 8 1 4 6 . 0 • 2 0 0 4 – 0 5 23
CH A P T E R 4 • T Y P E OF I N T E R N E T C O N N E C T I O N A N D T Y P E OF T E C H N O L O G Y U S E D F O R B R O A D B A N D I N T E R N E T A C C E S S

^ estimate has a relative standard error of 10% to less than 25% and should be used with caution* estimate has a relative standard error of 25% to 50% and should be used with caution** estimate has a relative standard error greater than 50% and is considered too unreliable for general use— nil or rounded to zero (including null cells)(a) For information on equivalised household income refer to paragraph 19 to 24 of the Explanatory Notes.(b) Includes those households with income less than zero.
*2**128694 393Total
^1—18801 452Ex-metropolitan areas^2^133642 940Metropolitan areas
Region
**1**1336684Australian Capital Territory**3—^237434Northern Territory**1**1^168394Tasmania^2—2672457Western Australia^2*11978323South Australia*1^12771861Queensland
^2*131671 085Victoria^2^131661 455New South Wales
State or territory
^4*130651 051Could not be determined*1*1^4255571$120,000 or over*1*12970763$80,000-$119,999
^1*124741 170$40,000-$79,999^2—2276839$0-$39,999(b)
Household income
^4*130651 051Could not be determined**2**2^4651110$120,000 or over
—**23860260$80,000-$119,999^1*128701 213$40,000-$79,999^1^125731 759$0-$39,999(b)
Equivalised household income(a)
^1^130681 621With children under 15^2^127702 772Without children under 15
Households
%%%%'000
Don't
knowBothBroadband
Dial-up
access
No. of
households
accessing
the Internet
at home
HOUSEHOLD INTERNET CONNECT ION, selec ted charac te r i s t i cs , by type of
access —2004- 054.1 . . . . . . . . . . . . . . . . . . . . . . . . . . . . . . . . . . . . . . . . . . . . . . . . . . . . . . . .
24 A B S • H O U S E H O L D U S E OF I N F O R M A T I O N T E C H N O L O G Y • 8 1 4 6 . 0 • 2 0 0 4 – 0 5
CH A P T E R 4 • T Y P E OF I N T E R N E T C O N N E C T I O N A N D T Y P E OF T E C H N O L O G Y U S E D F O R B R O A D B A N D I N T E R N E T A C C E S S

^ estimate has a relative standard error of 10% to less than 25% and should be used with caution* estimate has a relative standard error of 25% to 50% and should be used with caution** estimate has a relative standard error greater than 50% and is considered too unreliable for general
use— nil or rounded to zero (including null cells)(a) Includes those persons with income less than zero.(b) Labour force status in the week before the survey.
^1^131677 793Total
*1—21782 462Ex-metropolitan areas^1^136625 331Metropolitan areas
Region
—**13761154Australian Capital Territory——^22^7855Northern Territory——^1782165Tasmania——2871788Western Australia*1*12375563South Australia—*130681 511Queensland*1*133651 981Victoria
^1^134632 576New South WalesState or territory
——*52^48^37Indigenous^1^131677 756Non indigenous
Indigenous status
*1*129691 618Not employed^1^132666 174Employed
Labour force status(b)
*2*130671 132Could not be determined—**1^55^44258$120,000 or over—*2^3761429$80,000-$119,999—*131672 040$40,000-$79,999
^1^130693 933$0-$39,999(a)Personal income
^1^129703 848Female^1^134643 944Male
Sex
*1**2^267136565 or over*1*1277189855–64*1*137611 62445–54—*130691 89435–44*1*127711 74525–34—*137611 26618–24
Age group (years)
%%%%'000
Don't
knowBothBroadbandDial-up
No. of
persons aged
18 years
or over
accessing
the Internet
at home
PERSONAL USE OF THE INTERNET, selec ted charac te r i s t i cs , by type of
access —2004- 054.2 . . . . . . . . . . . . . . . . . . . . . . . . . . . . . . . . . . . . . . . . . . . . . . . . . . . . . . . .
A B S • H O U S E H O L D U S E OF I N F O R M A T I O N T E C H N O L O G Y • 8 1 4 6 . 0 • 2 0 0 4 – 0 5 25
CH A P T E R 4 • T Y P E OF I N T E R N E T C O N N E C T I O N A N D T Y P E OF T E C H N O L O G Y U S E D F O R B R O A D B A N D I N T E R N E T A C C E S S

^ estimate has a relative standard error of 10% to less than 25% and should be used withcaution
* estimate has a relative standard error of 25% to 50% and should be used with caution** estimate has a relative standard error greater than 50% and is considered too unreliable for
general use— nil or rounded to zero (including null cells)(a) Includes satellite and microwave.(b) For more information on equivalised household income refer to paragraph 19 to 24 of the
Explanatory Notes.(c) Includes those households with income less than zero.
^519761 244Total
^6^787266Ex-metropolitan areas^52273978Metropolitan areas
Region
*3^14^8328Australian Capital Territory—**6^94^8Northern Territory*8*8^84^15Tasmania*8^983118Western Australia*8^137963South Australia*3^1977232Queensland
^5^2471332Victoria^5^1976449New South Wales
State or territory
^9^1873315Could not be determined*2^2276242$120,000 or over*3^1681219$80,000-$119,999
^4^2175282$40,000-$79,999^7^1677186$0-$39,999(c)
Household income
^9^1873315Could not be determined**2*1979^51$120,000 or over**2^197999$80,000-$119,999
*32077344$40,000-$79,999^51877436$0-$39,999(c)
Equivalised household income(b)
^32077483With children under 15^61875761Without children under 15
Households
%%%'000
Other
or don't
know(a)Cable
Digital
Subscriber
Line
No. of
households
with
broadband
access
HOUSEHOLD INTERNET ACCESS, selec ted charac te r i s t i cs , by type of broadband
access —2004- 054.3 . . . . . . . . . . . . . . . . . . . . . . . . . . . . . . . . . . . . . . . . . . . . . . . . . . . . . . . .
26 A B S • H O U S E H O L D U S E OF I N F O R M A T I O N T E C H N O L O G Y • 8 1 4 6 . 0 • 2 0 0 4 – 0 5
CH A P T E R 4 • T Y P E OF I N T E R N E T C O N N E C T I O N A N D T Y P E OF T E C H N O L O G Y U S E D F O R B R O A D B A N D I N T E R N E T A C C E S S
CHAP T E R 5 SE L E C T E D IN T E R N E T TR A N S A C T I O N S . . . . . . . . . . . . . .
During 2004-05, travel, accommodation or tickets of any kind was the most common
product group purchased or ordered via the Internet with 77% of persons who ordered
goods or services via the Internet purchasing or ordering these products.
TY P E OF IN T E R N E T
PU R C H A S E S OR OR D E R S
(a) Persons aged 65 years or over not in scope in 2001. Imputed data for this age category included in totals.
18-24 25-34 35-44 45-54 55-64 65 or over Total
%
0
20
40
60
80 2001(a)20022004-05
PURCHASING OR ORDERING VIA THE INTERNET FOR PRIVATE USE, byage group–2001-2004-05
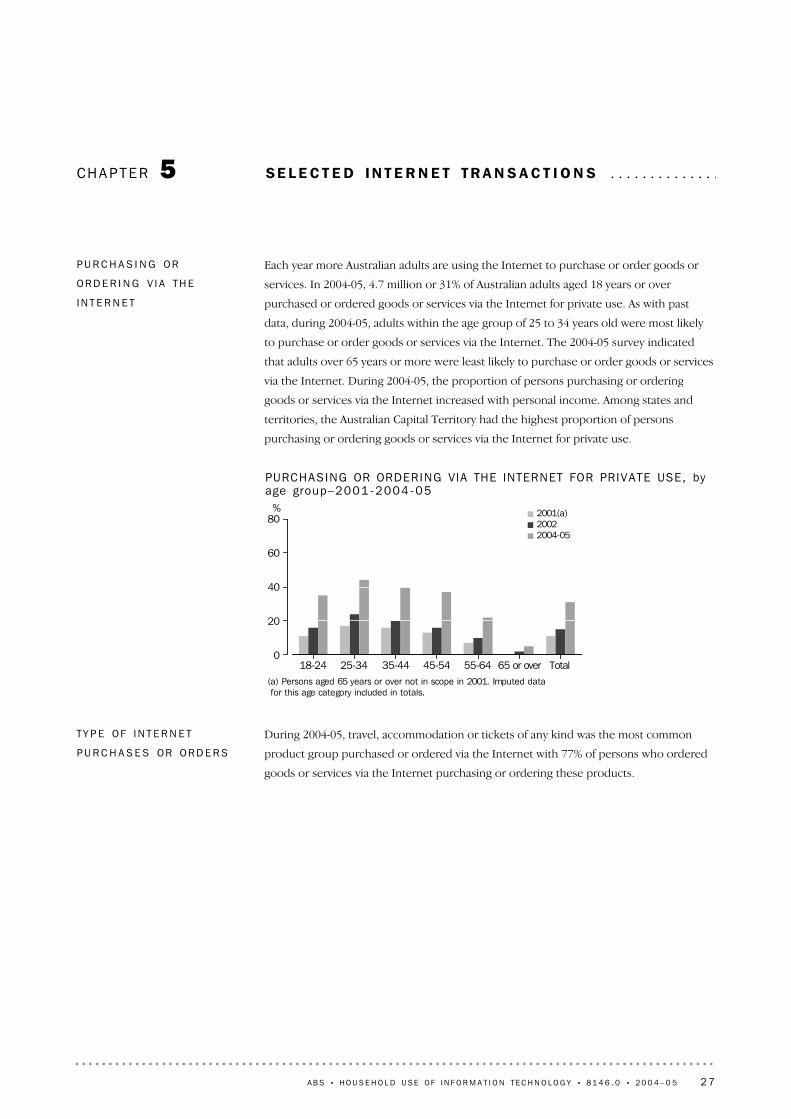
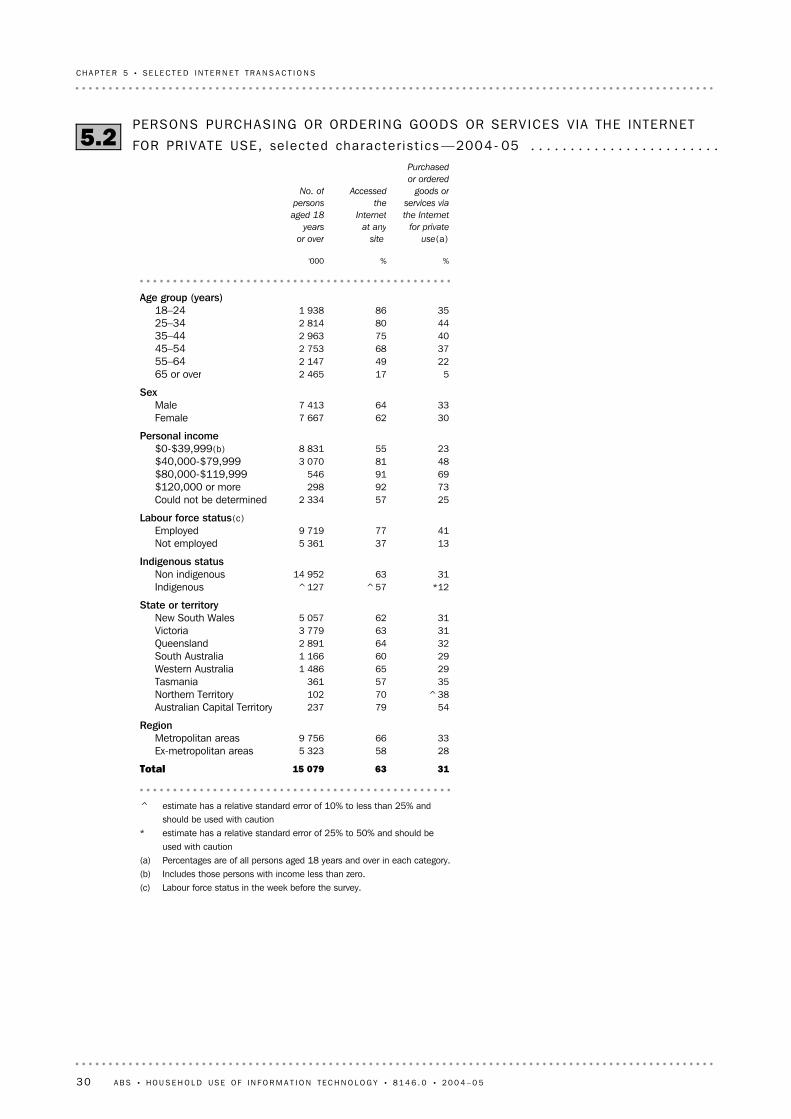
Each year more Australian adults are using the Internet to purchase or order goods or
services. In 2004-05, 4.7 million or 31% of Australian adults aged 18 years or over
purchased or ordered goods or services via the Internet for private use. As with past
data, during 2004-05, adults within the age group of 25 to 34 years old were most likely
to purchase or order goods or services via the Internet. The 2004-05 survey indicated
that adults over 65 years or more were least likely to purchase or order goods or services
via the Internet. During 2004-05, the proportion of persons purchasing or ordering
goods or services via the Internet increased with personal income. Among states and
territories, the Australian Capital Territory had the highest proportion of persons
purchasing or ordering goods or services via the Internet for private use.
PU R C H A S I N G OR
OR D E R I N G V I A TH E
IN T E R N E T
A B S • H O U S E H O L D U S E OF I N F O R M A T I O N T E C H N O L O G Y • 8 1 4 6 . 0 • 2 0 0 4 – 0 5 27

During 2004-05, of the 9.5 million persons accessing the Internet from any site, 4.9
million did not purchase or order via the Internet. The main reason for not shopping via
the Internet reported by these persons was "have no need" (35%). Security concerns was
the next most prevalent reason for not purchasing over the Internet (27%). Compared to
other age groups, adults aged 18-24 years were less likely to report security concerns as a
reason for not purchasing or ordering via the Internet.
MA I N RE A S O N FO R NO T
PU R C H A S I N G OR
OR D E R I N G V I A TH E
IN T E R N E T
Of the 4.7 million persons purchasing or ordering goods or services via the Internet in
2004-05, 94% spent less than $5,000 and 42% spent less than $500. Younger adults within
the age group of 18 to 24 years reported the highest proportion for expenditure on
Internet purchases or orders in the $1 to $499 category. A higher proportion of persons
aged 45 years or over spent $1,000 or more on Internet purchases or orders.
EX P E N D I T U R E ON
IN T E R N E T PU R C H A S E S OR
OR D E R S
Foodgroceriesalcohol
CDsmusicDVDsvideos
Computer softwarehardware
Internet time
Clothessporting equipment
toys
Travelaccommodation
tickets
%
0
20
40
60
80
PRODUCTS PURCHASED VIA THE INTERNET, by broad produc tgroups–2004-05
TY P E OF IN T E R N E T
PU R C H A S E S OR OR D E R S
c o n t i n u e d
28 A B S • H O U S E H O L D U S E OF I N F O R M A T I O N T E C H N O L O G Y • 8 1 4 6 . 0 • 2 0 0 4 – 0 5
CH A P T E R 5 • SE L E C T E D I N T E R N E T T R A N S A C T I O N S

— nil or rounded to zero (including null cells)(a) Persons aged 65 years or over were not in scope in 2001. Imputed data for this age category is included
in totals.
314 704152 204111 64079815660Total5132239——12111365 or over(a)
2248010182712047023155–64371 01016411133308203512845–54401 17320581164649254515435–44441 238246921750110278924725–34356701629811199815558718–24
%'000%'000%'000%'000%'000
2004-052002200120001999
PERSONS PURCHASING OR ORDERING GOODS OR SERVICES VIA THE INTERNET
FOR PRIVATE USE, by age group —1999 to 2004- 055.1 . . . . . . . . . . . . . . . . . . . . . . . . . .
A B S • H O U S E H O L D U S E OF I N F O R M A T I O N T E C H N O L O G Y • 8 1 4 6 . 0 • 2 0 0 4 – 0 5 29
CH A P T E R 5 • SE L E C T E D I N T E R N E T T R A N S A C T I O N S
^ estimate has a relative standard error of 10% to less than 25% andshould be used with caution
* estimate has a relative standard error of 25% to 50% and should beused with caution
(a) Percentages are of all persons aged 18 years and over in each category.(b) Includes those persons with income less than zero.(c) Labour force status in the week before the survey.
316315 079Total
28585 323Ex-metropolitan areas33669 756Metropolitan areas
Region
5479237Australian Capital Territory^3870102Northern Territory
3557361Tasmania29651 486Western Australia29601 166South Australia32642 891Queensland31633 779Victoria31625 057New South Wales
State or territory
*12^57^127Indigenous316314 952Non indigenous
Indigenous status
13375 361Not employed41779 719Employed
Labour force status(c)
25572 334Could not be determined7392298$120,000 or more6991546$80,000-$119,99948813 070$40,000-$79,99923558 831$0-$39,999(b)
Personal income
30627 667Female33647 413Male
Sex
5172 46565 or over22492 14755–6437682 75345–5440752 96335–4444802 81425–3435861 93818–24
Age group (years)
%%'000
Purchased
or ordered
goods or
services via
the Internet
for private
use(a)
Accessed
the
Internet
at any
site
No. of
persons
aged 18
years
or over
PERSONS PURCHASING OR ORDERING GOODS OR SERVICES VIA THE INTERNET
FOR PRIVATE USE, selec ted charac te r i s t i cs —2004- 055.2 . . . . . . . . . . . . . . . . . . . . . . . .
30 A B S • H O U S E H O L D U S E OF I N F O R M A T I O N T E C H N O L O G Y • 8 1 4 6 . 0 • 2 0 0 4 – 0 5
CH A P T E R 5 • SE L E C T E D I N T E R N E T T R A N S A C T I O N S

^ estimate has a relative standard error of 10% to less than 25% and should be used with caution* estimate has a relative standard error of 25% to 50% and should be used with caution(a) Percentages are of all persons making purchases or orders via the Internet for private use in each age range.
15*14^14161715^12Other77^767980787769Travel, accommodation or tickets of any kind20*6^8^142326^22Clothes, sporting equipment or toys33^39^35363831^25Computer software, hardware or Internet time33^18^24303238^41CDs, music, DVDs, videos, books or magazines
9*6^7^912^11*5Food, groceries or alcohol
%%%%%%%
65 or
over
55-6445-5435-4425-3418-24 Total
AGE GROUP (YEARS)(a)
GOODS OR SERVICES PURCHASED OR ORDERED BY PERSONS VIA THE INTERNET,
broad product groups , by age —2004- 055.3 . . . . . . . . . . . . . . . . . . . . . . . . . . . . . . . . . . . .
^ estimate has a relative standard error of 10% to less than 25% and should be used withcaution
* estimate has a relative standard error of 25% to 50% and should be used with caution** estimate has a relative standard error greater than 50% and is considered too unreliable
for general use— nil or rounded to zero (including null cells)(a) Percentages are of all persons making purchases or orders via the Internet for private
use in each age range.
100100100100100100100Total^1**1**1*1*1*1—Don't know^1—*2*2*2*1—10,000 or more
4*7*4^5^5^3*2$5,000–$9,99927^3131302926^16$1,000–$4,99925^212325242723$500–$99942^393937404158$1–$499
%%%%%%%
65 or
over
55-6445-5435-4425-3418-24 Total
AGE GROUP (YEARS)(a)
TOTAL EXPENDITURE BY PERSONS ON INTERNET PURCHASES AND ORDERS, by
age —2004- 055.4 . . . . . . . . . . . . . . . . . . . . . . . . . . . . . . . . . . . . . . . . . . . . . . . . . . . . . . . . . . .
A B S • H O U S E H O L D U S E OF I N F O R M A T I O N T E C H N O L O G Y • 8 1 4 6 . 0 • 2 0 0 4 – 0 5 31
CH A P T E R 5 • SE L E C T E D I N T E R N E T T R A N S A C T I O N S

^ estimate has a relative standard error of 10% to less than 25% and should be used with caution* estimate has a relative standard error of 25% to 50% and should be used with caution(a) Percentages are of all persons who accessed the Internet but did not order or purchase goods or services for private use in each age range.
100100100100100100100Total14^6^10^1112^16^20Other
^2*3*3*2*1*2*2Trust concerns/concerned about receiving or returning goods^3*5^4^4^3^2*1Privacy concerns/concerned about providing personal details on-line27^2730313326^17Security concerns/concerned about providing credit card details on-line19^21^22^192017^20Prefer to shop in person/like to see the product35^393133323739Have no need
%%%%%%%
65 or
over
55-6445-5435-4425-3418-24 Total
AGE GROUP (YEARS)(a)
MAIN REASON FOR NOT PURCHASING VIA THE INTERNET, by age —2004- 055.5 . . . . .
32 A B S • H O U S E H O L D U S E OF I N F O R M A T I O N T E C H N O L O G Y • 8 1 4 6 . 0 • 2 0 0 4 – 0 5
CH A P T E R 5 • SE L E C T E D I N T E R N E T T R A N S A C T I O N S

EX P L A N A T O R Y NO T E S . . . . . . . . . . . . . . . . . . . . . . . . . . . . . . .
6 The Multi-Purpose Household Survey (MPHS) is conducted as a supplement to the
monthly Labour Force Survey. One third of the dwellings in the outgoing rotation group
(one eighth of the sample is rotated out each month) are selected for the MPHS. In
these dwellings, after LFS has been fully completed for each person in scope and
coverage, a person (usual resident) aged 18 and over is selected at random (based on a
computer algorithm) and asked the additional MPHS questions in a personal interview.
Data are collected using Computer Assisted Interviewing (CAI), whereby responses are
recorded directly onto an electronic questionnaire in a notebook computer during a
telephone interview.
7 The sample was accumulated over an eleven month period (August 2004 to June
2005). It was not enumerated in July 2004 due to a delay in full implementation of CAI
for the LFS.
DA T A CO L L E C T I O N - M P H S
4 Due to the difference in the scope of previous surveys, previous person level data on
household use of information technology which is comparable with the 2004-05 survey is
only available up until 2002. The HUIT data for 2003 was obtained from the Survey of
Disability, Ageing and Carers (SDAC), and person level data from this survey only relates
to persons with a disability aged 15 years or over, and is thus not comparable with results
from MPHS 2004-05. SDAC data are comparable at the household level.
5 In addition, the 2002 HUIT data were obtained from the GSS using a face-to-face
randomly selected person methodology. MPHS questions were asked using a telephone
interview. The ABS has taken reasonable steps during the survey development process to
ensure that this change in collection methodology does not affect the quality of the data,
but a small impact for the more complex questions cannot be ruled out.
H I S T O R I C A L CO M P A R I S O N S
1 This publication presents results which were compiled from data collected in the
inaugural Multi-Purpose Household Survey (MPHS) that was conducted throughout
Australia as a supplement to the Labour Force Survey (LFS) each month from August
2004 to June 2005. In future years, the survey will be conducted over the full financial
year.
2 The MPHS was designed to provide statistics annually for a number of small,
self-contained topics. These include both labour topics and other social and economic
topics. The topics collected in 2004-05 were:
! Barriers and Incentives to Labour Force Participation
! Retirement and Retirement Intentions
! Household Use of Information Technology (HUIT)
3 Data on household use of information technology has been previously collected by
the ABS in the Population Survey Monitor (1996, 1998, 1999 and 2000), Survey of
Education, Training and Information Technology (2001), General Social Survey (2002),
National Aboriginal and Torres Strait Islander Survey (2002), Survey of Disability, Ageing
and Carers (2003), and the Survey of Children's Participation in Cultural and Leisure
Activities (2000 and 2003). The MPHS will provide the vehicle for collection of HUIT data
in the future.
I N T R O D U C T I O N
A B S • H O U S E H O L D U S E OF I N F O R M A T I O N T E C H N O L O G Y • 8 1 4 6 . 0 • 2 0 0 4 – 0 5 33

15 The survey was benchmarked to the estimated civilian population aged 18 years
and over living in private dwellings in each state and territory in non-sparsely settled
areas. The process of weighting ensures that the survey estimates conform to person
benchmarks by state, part of state, age and sex and to household benchmarks by state,
part of state and household composition. These benchmarks are produced from
estimates of the resident population derived independently of the survey.
Benchmark ing
14 Weighting is the process of adjusting results from a sample survey to infer results
for the total in scope population. To do this, a 'weight' is allocated to each sample unit,
which, for the MPHS, can be either a person or a household. The weight is a value which
indicates how many population units are represented by the sample unit. The first step
in calculating weights for each unit is to assign an initial weight, which is the inverse of
the probability of being selected in the survey. The initial weights are then calibrated to
align with independent estimates of the population of interest, referred to as
'benchmarks'. Weights are calibrated against population benchmarks to ensure that the
survey estimates conform to the independently estimated distribution of the population
rather than the distribution within the sample itself.
WE I G H T I N G , BE N C H M A R K I N G
AN D ES T I M A T I O N
13 The initial sample for the MPHS 2004-2005 consisted of 18,148 private dwelling
households. Of the 15,524 private dwelling households that remained in the survey after
sample loss and fully responding to the LFS (for example, households selected in the
survey which had no residents in scope for the LFS, vacant or derelict dwellings and
dwellings under construction), approximately 13,422 or 86% were fully responding to the
MPHS.
SA M P L E S I Z E FO R MP H S
12 In the LFS, coverage rules are applied which aim to ensure that each person is
associated with only one dwelling and hence has only one chance of selection in the
survey. See Labour Force, Australia (Cat. no. 6202.0) for more details.
CO V E R A G E
9 The scope of the LFS is restricted to people aged 15 years and over and excludes the
following persons:
! members of the permanent defence forces
! certain diplomatic personnel of overseas governments, customarily excluded from
census and estimated populations
! overseas residents in Australia
! members of non-Australian defence forces (and their dependants).
10 For the MPHS in 2004-2005 the following people are also excluded:
! people under the age of 18 years
! people living in private dwellings in very remote parts of Australia
! people living in special dwellings such as hotels, university residences etc
! Students at boarding schools, patients in hospitals, residents of homes (e.g.
retirement homes, homes for persons with disabilities), and inmates of prisons
! visitors to private dwellings
! people living in very remote indigenous communities.
11 This supplementary survey was conducted in both urban and rural areas in all states
and territories, but excluded persons living in very remote parts of Australia. The
exclusion of these people is unlikely to impact on the estimates included in this
publication.
SC O P E OF L F S AN D MP H S
8 The publication Labour Force, Australia (Cat. no. 6202.0) contains information
about survey design, sample redesign, scope, coverage and population benchmarks
relevant to the monthly LFS, which also apply to supplementary surveys. It also contains
definitions of demographic and labour force characteristics, and information about
telephone interviewing relevant to both the monthly LFS and supplementary surveys.
DA T A CO L L E C T I O N - M P H S
continued
34 A B S • H O U S E H O L D U S E OF I N F O R M A T I O N T E C H N O L O G Y • 8 1 4 6 . 0 • 2 0 0 4 – 0 5
EX P L A N A T O R Y N O T E S
19 These are groupings of 20% of the total population when ranked in ascending order
according to equivalised gross household income. The population used for this purpose
includes all people living in private dwellings, including children and other persons
under the age of 18 years. As the scope of this publication is restricted to only those
persons aged 18 years and over, the distribution of this smaller population across the
quintiles is not necessarily the same as it is for persons of all ages, i.e. the percentage of
persons aged 18 years and over in each of these quintiles may be larger or smaller than
20%.
20 Equivalence scales are used to adjust the actual incomes of households in a way
that enables the analysis of the relative wellbeing of people living in households of
different size and composition. For example, it would be expected that a household
comprising two people would normally need more income than a lone person
household if all the people in the two households are to enjoy the same material
standards of living. Adopting a per capita analysis would address one aspect of
household size difference, but would address neither compositional difference (i.e. the
number of adults compared with the number of children) nor the economies derived
from living together.
21 When household income is adjusted according to an equivalence scale, the
equivalised income can be viewed as an indicator of the economic resources available to
a standardised household. For a lone person household, it is equal to income received.
For a household comprising more than one person, equivalised income is an indicator of
the household income that would be required by a lone person household in order to
enjoy the same level of economic wellbeing as the household in question.
22 The equivalence scale used in this publication was developed for the Organisation
for Economic Co-operation and Development and is referred to as the "modified OECD"
equivalence scale. It is widely accepted among Australian analysts of income distribution.
23 The scale allocates 1.0 point for the first adult (aged 15 years or older) in a
household; 0.5 for each additional adult; and 0.3 for each child. Equivalised household
income is derived by dividing total household income by the sum of the equivalence
points allocated to household members. For example, if a household received combined
gross income of $2,100 per week and comprised two adults and two children (combined
household equivalence points of 2.1), the equivalised gross household income for each
household member would be calculated as $1,000 per week.
24 For more information on the use of equivalence scales, see Household Income and
Income Distribution, Australia, 2003-04 (cat. no. 6523.0)
EQ U I V A L I S E D GR O S S
HO U S E H O L D IN C O M E
QU I N T I L E S
18 Some households reported negative income in the survey. This is possible if they
incur losses in their unincorporated businesses or have negative returns from their
investments. Studies of income and expenditure from the 1998–99 Household
Expenditure Survey (HES) have shown that such households in the bottom income
decile and with negative gross incomes tend to have expenditure levels that are
comparable to those of households with higher income levels (and slightly above the
average expenditures recorded for the fifth decile), indicating that these households
have access to economic resources, such as wealth or that the instance of low or
negative income is temporary, perhaps reflecting business or investment start up.
I N C O M E LE S S TH A N ZE R O
17 Certain data items such as estimates of income had significant non-response for
2004-2005. The ABS has not applied any imputation methodology for estimation of
values for non-responses.
IM P U T A T I O N FO R NO N
RE S P O N S E
16 Survey estimates of counts of persons or households are obtained by summing the
weights of persons or households with the characteristic of interest.
Estimation
A B S • H O U S E H O L D U S E OF I N F O R M A T I O N T E C H N O L O G Y • 8 1 4 6 . 0 • 2 0 0 4 – 0 5 35
EX P L A N A T O R Y N O T E S
33 As well as statistics included in this and related publications, the ABS may have
other relevant data available on request. Inquiries should be made to Siddhartha De,
Canberra, (02) 6252 6519 or the National Information Referral Service on 1300 135 070.
AB S DA T A AV A I L A B L E ON
RE Q U E S T
31 Other ABS publications on the production and use of information and
communication technologies and telecommunication goods and services in Australia are:
! Business Use of Information Technology, 2003-04 (Cat. no. 8129.0)
! Government Use of Information Technology, Australia, 2002-03 (Cat. no. 8119.0)
! Household Use of Information Technology, Australia, 2002 and 2003 (Cat. no.
8146.0)
! Information and Communication Technology, Australia, 2002-03 (Cat. no. 8126.0)
! Use of Information Technology on Farms, Australia, 2003-04 (Cat. no. 8150.0)
! Internet Activity, Australia, March 2005 (Cat. no. 8153.0)
32 Current publications and other products released by the ABS are listed in the
Catalogue of Publications and Products (Cat. no. 1101.0). The catalogue is available
from any ABS office or the ABS website <http://www.abs.gov.au>. The ABS also issues a
daily release advice on the web site which details products to be released in the week
ahead.
RE L A T E D PU B L I C A T I O N S
30 ABS publications draw extensively on information provided freely by individuals,
businesses, governments and other organisations. Their continued cooperation is very
much appreciated. Without it, the wide range of statistics published by the ABS would
not be available. Information received by the ABS is treated in strict confidence as
required by the Census and Statistics Act 1905.
AC K N O W L E D G E M E N T
29 The ABS will conduct the MPHS again during the 2005-06 financial year. The topics
included in the 2005-06 MPHS are:
! Work related injuries
! Household use of information technology
! Participation in sport and physical activity
! Attendance at selected culture and leisure venues and events
FU T U R E SU R V E Y S
28 Due to differences in the scope and sample size of the MPHS and that of the LFS,
the estimation procedure may lead to some small variations between labour force
estimates from this survey and those from the LFS.
CO M P A R A B I L I T Y W I T H
MO N T H L Y LF S ST A T I S T I C S
27 Non-sampling error may occur in any collection, whether it is based on a sample or
a full count such as a census. Sources of non-sample error include non-response, errors
in reporting by respondents or recording of answers by interviewers, and errors in
coding and processing data.
Non-sampl ing error
26 Sampling error is the difference between the published estimates, derived from a
sample of persons, and the value that would have been produced if all persons in scope
of the survey had been included. For more information refer to the technical note.
Sampling error
25 The estimates provided in this publication are subject to sampling and
non-sampling error.
RE L I A B I L I T Y OF ES T I M A T E S
Multi-Purpose Household SurveyMPHS
Labour Force SurveyLFS
information technologyIT
Household Use of Information TechnologyHUIT
Collection DistrictCD
Australian Bureau of StatisticsABSAB B R E V I A T I O N S
36 A B S • H O U S E H O L D U S E OF I N F O R M A T I O N T E C H N O L O G Y • 8 1 4 6 . 0 • 2 0 0 4 – 0 5
EX P L A N A T O R Y N O T E S
Technical and Further EducationTAFE
standard errorSE
relative standard errorRSE
A B S • H O U S E H O L D U S E OF I N F O R M A T I O N T E C H N O L O G Y • 8 1 4 6 . 0 • 2 0 0 4 – 0 5 37
EX P L A N A T O R Y N O T E S
TECH N I C A L NOTE RE L I A B I L I T Y OF ES T I M A T E S . . . . . . . . . . . . . . . . . . . . . . . .
5 An example of the use of SEs in relation to estimates is as follows.
6 From table 3.4, it is estimated that 7,793,000 households accessed the Internet from
home in 2004-05. Since this estimate is between 5,000,000 and 10,000,000, the SE for
Australia will lie between 41,850 and 52,200 and can be approximated by interpolation to
be 48,000. This estimate has a SE of around 48,000. This means there are about two
chances in three that the value that would have been obtained from a complete census is
within the range 7,745,000 to 7,841,000 households and about 19 chances in 20 that the
true value is in the range 7,697,000 to 7,889,000 households.
US I N G S T A N D A R D ER R O R S
FO R PO P U L A T I O N ES T I M A T E S
1 As the estimates in this publication are based on information obtained from a sample
of households and persons, they are subject to sampling variability. That is, they may
differ from the figures that would have been produced if all households and persons in
Australia had been included in the survey. One measure of the likely difference is given
by the standard error (SE), which indicates the extent to which an estimate might have
varied by chance because only a sample of households and persons was included. There
are about 2 chances in 3 that a sample estimate will differ by less than one SE from the
figure that would have been obtained if all households and persons had been included in
the survey and about 19 chances in 20 that the difference will be less than two SEs.
2 Another measure of the likely difference is the relative standard error (RSE), which is
obtained by expressing the SE as a percentage of the estimate.
3 In the tables in this publication, only estimates (numbers and percentages) with RSEs
less than 25% are considered sufficiently reliable for most purposes. However, estimates
with larger RSEs have been included and are annotated to indicate they are subject to
higher SEs and should be used with caution. Estimates with RSEs of 10% to less than 25%
are preceded by a (^), and estimates with RSEs of 25% to 50% are preceded by an
asterisk (*) to indicate that they should be used with caution. Estimates with RSEs
greater than 50% are preceded by a double asterisk (**) to indicate that they are
considered too unreliable for general use.
4 To assist readers of this publication to ascertain the approximate levels of reliability
of estimates throughout this publication, tables of SEs and RSEs for certain estimates of
population counts for the data appear at the end of this Technical Note. These values do
not give a precise measure of the SEs or RSEs for a particular estimate but will provide an
indication of their magnitude.
RE L I A B I L I T Y OF TH E
ES T I M A T E S
38 A B S • H O U S E H O L D U S E OF I N F O R M A T I O N T E C H N O L O G Y • 8 1 4 6 . 0 • 2 0 0 4 – 0 5

— nil or rounded to zero (including null cells)
194 100————————20,000,000186 700————————15,000,000176 800————————10,000,000161 500—————36 95063 40062 5005,000,000244 600———24 85023 00030 35043 15046 9002,000,000334 200———19 70018 50025 35032 20036 8001,000,000525 800——9 95015 40014 65020 65023 95028 300500,000720 7006 500—8 35012 75012 20017 45019 20023 000300,000917 2505 8508 7507 20010 90010 50015 15016 10019 350200,000
1015 1005 4007 8006 5009 7509 40013 60014 20017 050150,0001312 4504 8006 6005 5508 3008 00011 60011 90014 150100,000188 8003 9004 9004 2506 2006 0008 6508 80010 15050,000207 8503 6004 4503 8505 6505 5007 8507 9509 10040,000236 7503 2503 9003 4505 0004 8506 8507 0007 85030,000275 4502 8503 2502 9004 1504 0505 6505 8506 35020,000314 6502 5502 8002 5503 6503 5504 9005 1505 40015,000373 7002 1502 3002 1503 0502 9503 9504 3004 35010,000433 0001 9001 9501 8002 5502 4503 3003 6503 5507,000492 4501 6501 6001 5502 2002 1002 7003 1502 9005,000542 1501 5001 4501 4001 9501 9002 4002 8502 5504,000572 0001 4001 3501 3001 8501 7502 2002 6502 3503,500601 8001 3001 2501 2001 7001 6002 0002 5002 1003,000641 6001 2001 1001 1001 5501 5001 8002 3001 9002,500701 3901 0809909901 3901 3101 5802 0701 6402,000771 1609508408601 2001 1301 3201 8101 3701,500898907806706909709101 0201 5101 0501,000
1007006505405808007508101 2808207001125605404404806706206401 090650500130390410320360500460450860450300145290330250290400360330710340200180180220160190270240200510200100
Size of estimate%no.no.no.no.no.no.no.no.no.
Relative
standard
error
Standard
errorACTNTTas.WASAQldVICNSW
AUSTRALIASTANDARD ERROR
STANDARD ERRORS OF PERSON ESTIMATES– 2004- 05
TA B L E S OF ST A N D A R D
ER R O R S AN D RE L A T I V E
ST A N D A R D ER R O R S
8 The estimated increase in the number of adults who purchased or ordered goods or
services over the Internet in 2004-05 was 2,500,000 people (from 2,204,000 persons in
2002 to 4,704,000 in 2004-05). The SE on this movement has been calculated to be
around 69,000. There are 2 chances in 3 that the true value is within the range 2,431,000
to 2,569,000 persons and 19 chances in 20 that the true value is in the range 2,362,000 to
2,638,000 persons.
SE(x − y) = [SE(x)]2 + [SE(y)]2
7 Particular care should be taken when comparing figures over time. It is not correct to
assume that an apparent difference between figures is actually significant. Such an
estimate is subject to sampling error. An approximate SE of the difference between two
estimates (x-y) may be calculated by the following formula:
US I N G S T A N D A R D ER R O R S
FO R PO P U L A T I O N ES T I M A T E S
continued
A B S • H O U S E H O L D U S E OF I N F O R M A T I O N T E C H N O L O G Y • 8 1 4 6 . 0 • 2 0 0 4 – 0 5 39
T E C H N I C A L N O T E • R E L I A B I L I T Y OF ES T I M A T E S

— nil or rounded to zero (including null cells)
152 200————————10,000,000141 850—————24 40041 85041 2505,000,000230 350———16 40023 00020 05028 50030 9502,000,000223 250———13 00018 50016 75021 25024 3001,000,000417 550——6 55010 15014 65013 65015 80018 700500,000514 0504 300—5 5008 40012 20011 55012 70015 200300,000611 7003 8505 8004 7507 20010 50010 00010 65012 800200,000710 2503 5505 1504 3006 4509 4008 9509 40011 250150,00098 4503 2004 3503 6505 4508 0007 6507 8509 350100,000
126 0002 5503 2502 8004 1006 0005 7005 8006 70050,000135 3502 4002 9502 5503 7505 5005 1505 2506 00040,000154 6002 1502 6002 2503 3004 8504 5504 6505 20030,000193 7001 8502 1501 9002 7504 0503 7503 8504 20020,000213 1501 7001 8501 7002 4003 5503 2503 4003 60015,000252 5001 4501 5501 4002 0002 9502 6002 8502 85010,000292 0501 2501 3001 2001 7002 4502 1502 4002 3507,000331 6501 1001 0501 0001 4502 1001 8002 0501 9005,000361 4501 0009509001 3001 9001 6001 8501 6504,000391 3509009008501 2001 7501 4501 7501 5503,500401 2008508008001 1001 6001 3501 6501 4003,000441 1008007507501 0501 5001 2001 5001 2502,500489507206506509201 3101 0501 3701 0902,000537906205605607901 1308701 2009001,500606005104404606409106709906901,000694804303603805307505308405407007638036029032044062042072043050090270270210240330460300570300300
100200220170190260360220470220200120120140110130180160130340130100
Size of estimate
Relative
standard
error
%
Standard
error
no.
ACT
no.
NT
no.
Tas.
no.
WA
no.
SA
no.
Qld
no.
Vic
no.
NSW
no.
AUSTRALIASTANDARD ERROR
STANDARD ERRORS OF HOUSEHOLD ESTIMATES– 2004- 05
4 7702 3261 9611 9563 8523 5176 0627 5827 124Estimate with RSEs of 50%6 1922 8242 4812 4124 7324 3467 6569 1839 129Estimate with RSEs of 45%8 2283 4963 2093 0405 9435 4899 86511 37211 960Estimate with RSEs of 40%
11 2594 4334 2723 9387 6697 12413 03514 48316 107Estimate with RSEs of 35%16 0015 8015 8985 28310 2549 57517 79619 13522 480Estimate with RSEs of 30%23 9277 9188 5557 43414 38113 49625 38526 57632 919Estimate with RSEs of 25%
Size of estimate
Aust.
no.
ACT
no.
NT
no.
Tas.
no.
WA
no.
SA
no.
Qld
no.
Vic
no.
NSW
no.
PERSON EST IMATES WITH RELAT IVE STANDARD ERRORS OF 25% TO 50%– 2004- 05
40 A B S • H O U S E H O L D U S E OF I N F O R M A T I O N T E C H N O L O G Y • 8 1 4 6 . 0 • 2 0 0 4 – 0 5
T E C H N I C A L N O T E • R E L I A B I L I T Y OF ES T I M A T E S
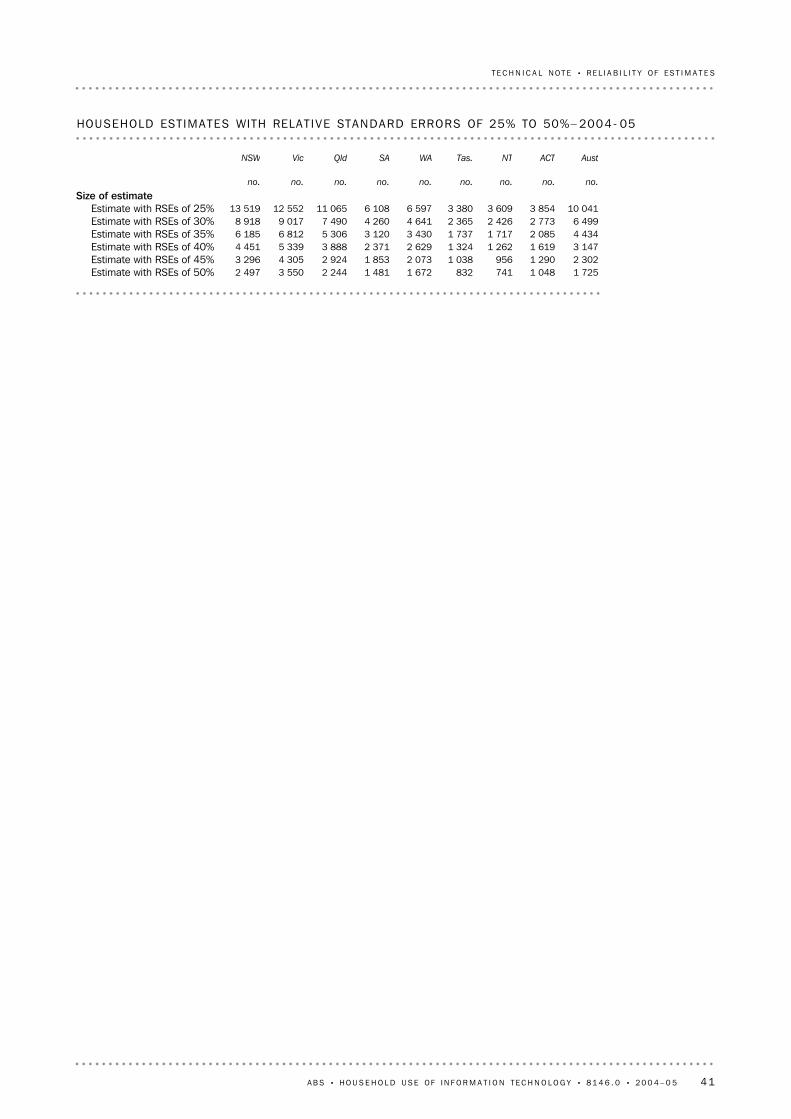
1 7251 0487418321 6721 4812 2443 5502 497Estimate with RSEs of 50%2 3021 2909561 0382 0731 8532 9244 3053 296Estimate with RSEs of 45%3 1471 6191 2621 3242 6292 3713 8885 3394 451Estimate with RSEs of 40%4 4342 0851 7171 7373 4303 1205 3066 8126 185Estimate with RSEs of 35%6 4992 7732 4262 3654 6414 2607 4909 0178 918Estimate with RSEs of 30%
10 0413 8543 6093 3806 5976 10811 06512 55213 519Estimate with RSEs of 25%Size of estimate
Aust
no.
ACT
no.
NT
no.
Tas.
no.
WA
no.
SA
no.
Qld
no.
Vic
no.
NSW
no.
HOUSEHOLD ESTIMATES WITH RELAT IVE STANDARD ERRORS OF 25% TO 50%– 2004- 05
A B S • H O U S E H O L D U S E OF I N F O R M A T I O N T E C H N O L O G Y • 8 1 4 6 . 0 • 2 0 0 4 – 0 5 41
T E C H N I C A L N O T E • R E L I A B I L I T Y OF ES T I M A T E S

GL O S S A R Y . . . . . . . . . . . . . . . . . . . . . . . . . . . . . . . . . . . . . . . . . . . .
A data transfer speed measurement for high speed networks.Gbps
Refers to areas outside the capital city statistical divisions.Ex-metropolitan areas
These are groupings of 20% of the total population when ranked in ascending orderaccording to equivalised gross household income. The population used for this purposeincludes all people living in private dwellings, including children and other personsunder the age of 18 years. As the scope of this publication is restricted to only thosepersons aged 18 years and over, the distribution of this smaller population across thequintiles is not necessarily the same as it is for persons of all ages, i.e. the percentage ofpersons aged 18 years and over in each of these quintiles may be larger or smaller than20%.
Equivalised gross householdincome quintiles
Gross household income adjusted using an equivalence scale. For a lone personhousehold it is equal to gross household income. For a household comprising morethan one person, it is an indicator of the gross household income that would need to bereceived by a lone person household to enjoy the same level of economic well-being asthe household in question.
Equivalised Gross HouseholdIncome
Employed persons are those who had a job or business, or who undertook work withoutpay in a family business, in the week prior to the survey for a minimum of one hour perweek. Includes persons who were absent from a job or business. Includes CommunityDevelopment Employment Program participants.
Employed
More properly referred to as ADSL as this covers several digital technologies (e.g.asymmetric DSL or ADSL and Symmetric DSL or SDSL) for fast two-way data connectionsover the PSTN.
Digital Subscriber Line
Connection to the Internet via modem and dial-up software utilising the public switchedtelecommunication network (PSTN).
Dial-up connections
This refers to use of a computer in the 12 months prior to interview.Computer use
A person of any age who is a natural, adopted, step, or foster son or daughter of a coupleor lone parent, usually resident in the same household, and who does not have a child orpartner of his/her own usually resident in the household.
Child
Describes those technologies including coaxial cable, fibre optic cable and hybrid fibrecoaxial cable which are capable of transmitting data at speeds of up to 2 Gigabits persecond (Gbps).
Cable
Abbreviation for binary term. A unit of data, today almost always consisting of 8 bits. Abyte can represent a single character, such as a letter, a digit, or a punctuation mark. Seealso kilobit and kilobyte.
Byte
Defined by the ABS as an 'always on' Internet connection with an access speed equal toor greater than 256 Kilobits per second (Kbps).
Broadband
Abbreviation for binary digit and describing the smallest unit of information handled by acomputer. One bit expresses a 1 or a 0 in a binary numeral, or a true or false logicalcondition. See also Byte.
Bit
A telecommunications network operated by a carrier to provide services to the public.Analog/Public SwitchedTelephone Network (PSTN)
This is the reported age of a person on their last birthday.Age
42 A B S • H O U S E H O L D U S E OF I N F O R M A T I O N T E C H N O L O G Y • 8 1 4 6 . 0 • 2 0 0 4 – 0 5
A satellite stationed in geosynchronous orbit that acts as a microwave relay station,receiving signals sent from a ground based station, amplifying them, and re-transmittingthem on a different frequency to another ground-based station. Satellites can be used forhigh-speed transmission of computer data.
Satellite
Refers to permanent and 'always on' connections to the Internet via a variety oftechnologies including Integrated Services Digital Network (ISDN), Digital SubscriberLines (DSL), Cable, Wireless, Satellite, dedicated data service, frame relay, etc.
Non Dial-up connections
Metropolitan refers to capital city statistical divisions. These delimit an area which isstable for general statistical purposes. The boundary is defined to contain anticipateddevelopment of a city for a period of 20 years. The metropolitan area contains more thanjust the urban centre, and represents the city in the wider sense.
Metropolitan
A data unit of 1,048, 576 bytes, sometimes interpreted as 1 million bytes.Megabyte (MB)
A data unit of 1,048, 576 bits, sometimes interpreted as 1 million bits. Faster data speedsare generally referred to in megabits rather than megabytes (hence Mbps).
Megabit (Mb)
A data unit of 1,024 bytes and generally abbreviated as KB or Kbyte.Kilobyte (KB)
A data unit of 1,024 bits and generally abbreviated as kb or kbit. Data speeds aregenerally referred to in kilobits (kbps) rather than kilobytes.
Kilobit (Kb)
A measure od data transfer rate . A unit of data transfer that equates to 1000 bits persecond.
Kbps
This refers to the use of the Internet in the 12 months prior to interview. It includesaccess via mobile phones, set-top boxes connected to either an analogue or digitaltelevision, and games machines.
Internet use
Availability of lines, points, ports, and modem to subscribers to access the Internet.Internet Access
A world-wide public computer network. Organisations and individuals can connect theircomputers to this network and exchange information across a country and/or across theworld. The Internet provides access to a number of communication services includingthe World Wide Web and carries email, news, entertainment and data files.
Internet
A digital access technique for both voice and data. Digital alternative to an analog publicswitched telephone service and carries data or voltages consisting of discrete steps orlevels, as opposed to continuously variable analog data. ISDN enables digitaltransmission over the PSTN.
Integrated Services DigitalNetwork (ISDN)
This refers to people who identified themselves, or were identified by anotherhousehold member, as being of Aboriginal and/or Torres Strait Islander origin.
Indigenous
A household consists of a person living alone, or two or more related or unrelatedpersons who live and eat together in private residential accommodation.
Household
A B S • H O U S E H O L D U S E OF I N F O R M A T I O N T E C H N O L O G Y • 8 1 4 6 . 0 • 2 0 0 4 – 0 5 43
GL O S S A R Y

www.abs.gov.auWEB ADDRESS
All ABS publications can be downloaded free of chargefrom the ABS web site.
F R E E A C C E S S T O P U B L I C A T I O N S
Client Services, ABS, GPO Box 796, Sydney NSW 2001POST
1300 135 211FAX
1300 135 070PHONE
Data already published that can be provided within fiveminutes will be free of charge. Our information consultantscan also help you to access the full range of ABSinformation—ABS user pays services can be tailored toyour needs, time frame and budget. Publications may bepurchased. Specialists are on hand to help you withanalytical or methodological advice.
I N F O R M A T I O N S E R V I C E
This service now provides only current Consumer PriceIndex statistics call 1900 986 400 (call cost 77c perminute).
DIAL-A-STATISTIC
For current and historical Consumer Price Index data, call1902 981 074 (call cost 77c per minute).
CPI INFOLINE
A range of ABS publications is available from public andtertiary libraries Australia-wide. Contact your nearest libraryto determine whether it has the ABS statistics you require,or visit our web site for a list of libraries.
LIBRARY
www.abs.gov.au the ABS web site is the best place tostart for access to summary data from our latestpublications, information about the ABS, advice aboutupcoming releases, our catalogue, and Australia Now—astatistical profile.
INTERNET
F O R M O R E I N F O R M A T I O N . . .
ISSN 1329 40672814600007042
RRP $27.00
© Commonwealth of Australia 2005Produced by the Australian Bureau of Statistics
81
46
.0
•
HO
US
EH
OL
D
US
E O
F IN
FO
RM
AT
IO
N
TE
CH
NO
LO
GY
, A
US
TR
AL
IA
•
20
04
–0
5