household hygiene improvement survey in yemen€¦ · water supply sanitation, and ... vi household...
TRANSCRIPT
This document was produced by PHRplus with funding from the US Agency forInternational Development (USAID) under Project No. 936-5974.13, Contract No.HRN-C-00-00-00019-00 and is in the public domain. The ideas and opinions in thisdocument are the authors’ and do not necessarily reflect those of USAID or itsemployees. Interested parties may use the report in part or whole, providing theymaintain the integrity of the report and do not misrepresent its findings or presentthe work as their own. This and other HFS, PHR, and PHRplus documents can beviewed and downloaded on the project website, www.PHRplus.org.
Abt Associates Inc. 4800 Montgomery Lane, Suite 600 Bethesda, Maryland 20814 Tel: 301/913-0500 Fax: 301/652-3916
In collaboration with: Development Associates, Inc. Emory University Rollins School of PublicHealth Philoxenia International Travel, Inc. PATH Social Sectors Development Strategies, Inc. Training Resources Group Tulane University School of Public Health and Tropical Medicine University Research Co., LLC.
Partners for Health Reformplus
Household Hygiene Improvement Survey in Yemen: Knowledge, Practices, and Coverage of Water Supply Sanitation, and Hygiene September 2005 Prepared by: Emtinan Al-Medhwahi, Author Organization Catherine Briggs, Author Organization Susan Keane, Abt Associates Inc.
Order No TE 076

Mission
Partners for Health Reformplus is USAID’s flagship project for health policy and health system strengthening in developing and transitional countries. The five-year project (2000-2005) builds on the predecessor Partnerships for Health Reform Project, continuing PHR’s focus on health policy, financing, and organization, with new emphasis on community participation, infectious disease surveillance, and information systems that support the management and delivery of appropriate health services. PHRplus will focus on the following results:
Implementation of appropriate health system reform.
Generation of new financing for health care, as well as more effective use of existing funds.
Design and implementation of health information systems for disease surveillance.
Delivery of quality services by health workers.
Availability and appropriate use of health commodities.
September 2005
Recommended Citation Al-Medhwahi, Emtinan, Catherine Briggs, and Susan Keane. September 2005. Household Hygiene Improvement Survey in Yemen: Knowledge, Practices, and Coverage of Water Supply Sanitation, and Hygiene. Bethesda, MD: The Partners for Health Reformplus Project, Abt Associates Inc.
For additional copies of this report, contact the PHRplus Resource Center at [email protected] or visit our website at www.PHRplus.org. Contract/Project No.: HRN-C-00-00-00019-00 Submitted to: USAID/Sana’a and: Karen Cavanaugh, CTO Health Systems Division Office of Health, Infectious Disease and Nutrition Center for Population, Health and Nutrition Bureau for Global Programs, Field Support and Research United States Agency for International Development

Abstract
One mandate of the USAID-funded Partners for Health Reformplus (PHRplus) in Yemen is to design pilot interventions that focus on environmental issues impacting health. An early assessment in the Thula district, in Amran governorate, identified diarrheal disease, acute respiratory infection, and parasitic diseases as major causes of child morbidity; these ailments are caused by or related to environmental factors. A household environmental knowledge, attitudes/perceptions, and practices (KAP) survey was conducted to gain a better understanding of current knowledge, beliefs, and practices of district households in relation to water, sanitation, and hygiene so that specific needs of the district’s communities may be better understood. Survey findings indicate a serious lack of access to safe water in at least half of the surveyed communities; a frequent lack of knowledge and protective practices related to effective handwashing and sanitation measures; the existence of householder concerns about the inadequacy of community solid waste disposal practices; and indications of a general lack of awareness and information about healthy school environments and ways to improve the environments of their local schools. As a result of the findings, pilot project activities will be initiated, in cooperation with local participants, in communities identified as most in need of a targeted. A set of cost-effective interventions including hygiene promotion, cistern rehabilitation/unprotected spring management, solid waste management/recycling, and healthy schools will be made available.


Table of Contents
Acronyms and Glossary .......................................................................................................................vii
Acknowledgments ................................................................................................................................. ix
Executive Summary ..............................................................................................................................xi
1. Introduction .................................................................................................................................... 1 1.1 Survey background................................................................................................................1 1.2 Survey objectives...................................................................................................................1
2. The Survey...................................................................................................................................... 3 2.1 Characteristics of survey and survey instrument ...................................................................3 2.2 Pilot testing of the survey ......................................................................................................3 2.3 Survey content .......................................................................................................................4 2.4 Survey administration and logistics.......................................................................................4 2.5 Profile of survey sample − Communities and households.....................................................5
2.5.1 Head of household information .....................................................................................6
3. Survey Methods.............................................................................................................................. 7 3.1 Design....................................................................................................................................7 3.2 Sample ...................................................................................................................................7
4. Results ............................................................................................................................................ 9 4.1 Health − Survey results on respondent reports of illness in their family and community and their perceptions on preventing/avoiding diarrhea .........................................................................9
4.1.1 Respondents with children under 5 years of age – reports of the child having experienced diarrhea (a) within the past 24 hours and (b) the past two weeks.......................9 4.1.2 Respondents’ reports of illnesses in any age groups that they had heard of in their area within the past two weeks.......................................................................................................9 4.1.3 Perceptions of the causes of the recent diseases in their area ......................................10 4.1.4 Householder reports of sickness ascribed to drinking or using water from locally available sources ...................................................................................................................10 4.1.5 Perceptions on preventing/avoiding diarrhea ..............................................................12
4.2 Water − Water sources for drinking/household uses, water transport and storage practices, and attitudes and community practices related to local cisterns ...................................................12
4.2.1 Water sources ..............................................................................................................12 4.2.2 Availability of main source water throughout the year ...............................................15 4.2.3 Practices related to how water reaches the households ...............................................15 4.2.4 Practices related to storage and treatment of water in the household ..........................16
Table of Contents v
4.2.5 Householder attitudes and community practices related to local cisterns ...................17 4.3 Sanitation – Solid waste and human waste management ....................................................20
4.3.1 Solid waste practices and perceptions .........................................................................20 4.3.2 Human waste/toilets/sewage........................................................................................22 4.3.3 Toileting practices of under 5s in the household and disposal of toddler/small child stools (questions H37-38 were asked about each child under 5) ..........................................23
4.4 Hygiene ...............................................................................................................................23 4.4.1 Handwashing practices ................................................................................................23 4.4.2 Perceptions of the importance of washing hands and of the role of personal hygiene in being healthy.........................................................................................................................24 4.4.3 Practices regarding food preparation and storage........................................................25
4.5 Healthy Schools...................................................................................................................25 4.5.1 School-age children and school attendance .................................................................25 4.5.2 Exploring the ideas of healthy schools with the community respondents ...................26 4.5.3 Cleaning of the local school ........................................................................................27 4.5.4 How respondents describe the roles of the school, parents, students, local leaders, and local council in developing/maintaining a healthy school ....................................................27
5. Summary of Main Points.............................................................................................................. 31 5.1 Main survey results overall .................................................................................................31
5.1.1 Findings pointing to poor water quality.......................................................................31 5.1.2 Findings pointing to inadequate handwashing ............................................................32 5.1.3 Findings pointing to inadequate community solid waste and sanitation measures .....32 5.1.4 Findings pointing to poor conditions for healthy school environments ......................33 5.1.5 Main points of survey results in individual communities............................................33
6. Recommendations ........................................................................................................................ 35 6.1 Hygiene promotion training to combat disease ...................................................................35 6.2 Water sources ......................................................................................................................36 6.3 Community hygiene ............................................................................................................36
6.3.1 Solid waste management .............................................................................................37 6.3.2 Healthy schools............................................................................................................37
6.4 Summary of recommended interventions............................................................................37 Annex A: Maps .................................................................................................................................... 39
Annex B: Tables................................................................................................................................... 43
Annex C. Survey Questionnaire ........................................................................................................... 63
vi Household Hygiene Improvement Survey in Yemen

Acronyms and Glossary
Basin A translation of an Arabic word that in this context denotes water derived from a ground/spring source, piped so that it is easier to access.
C Cisterns – as in C1 = Cistern section, question number 1
Flush toilet “Western” style pour toilets that use more water than a traditional toilet and where all wastes go in one pipe to a sewer system, septic tank, or in some cases, to the streets, causing a very significant health hazard.
H Hygiene – as in H1 = Hygiene section, question 1
HS Healthy Schools – as in HS1 = Healthy Schools section, question 1
KAP Knowledge, attitudes, and practices
NR No Response
PHRplus - Partners for Health Reformplus
Protected springs Natural source of water from an underground spring that is protected by a physical barrier, e.g., fence or stone wall.
SW Solid waste – as in SW1 = Solid waste section, question 1
Traditional toilet Traditional Yemeni dry latrine method where solid wastes are collected in a pit, with urine washed off with water as wastewater. The solid wastes are then traditionally recycled as fertilizer.
Unprotected springs Natural source of water without physical protection
USAID United States Agency for International Development
Acronyms vii

Acknowledgments
The PHRplus/Yemen Environmental Health Project team wishes to express its appreciation to USAID/Yemen for the support to the PHRplus environmental health pilot project, of which this survey is a part. In particular, we wish to express our appreciation to Dr Ahmed Attieg, USAID/Yemen, for his support of the project and recognition of the role of environmental health improvements for the health of families, mothers, and children in the region.
The Environmental Health Project team would also like to express its sincere appreciation to the field workers for their fine work in gathering the data, the householders for their willingness to participate and the time given, and to the local communities for their important support.
The work of the survey was carried out in collaboration with the entire environmental health team; the members are Ms Emtinan Al-Medhwahi, Ms Fawzia Youssef, and Mr Fouad Al Harithi, with the leadership of the PHRplus Chief of Party, Cheri Rassas. Valuable input and consultation have consistently been provided by PHRplus U.S.-based environmental health advisor, Susan Keane. The major contributions of the data consultants Sawsan Al Eryani and Amal Al Manaky, as well as the significant administrative and data assistance support of Dalia Al Eryani, are also gratefully acknowledged and appreciated.
Acknowledgments ix


Executive Summary
Summary of background information
One of the mandates of the USAID-funded Partners for Health Reformplus project (PHRplus) in Yemen is to design pilot interventions that focus on environmental issues impacting health. Another aim is to provide assistance leading to visible and tangible results. In addition, the pilot activities formulated as a result of this report directly support USAID/Yemen’s Intermediate Result in health, increased knowledge of healthy behaviors at the community level, and has potential to influence a second Intermediate Result, improved policy environment for health.
An early assessment in the District of Thula, Amran Governorate, identified diarrheal disease, acute respiratory infection, and parasitic diseases as major causes of child morbidity; these ailments are caused by or related to environmental factors. The pilot design team identified the initial environmental health problems through a series of field visits, observations, interviews, and stakeholder meetings.
Objective of the survey
The objective of this household environmental “KAP” survey is to gain a better understanding of current knowledge, attitudes, and practices of households in Thula, in relation to water, sanitation, hygiene, and solid waste management. The results are meant to more clearly identify the specific needs of the district’s communities. In addition to gathering the baseline KAP data, the survey will be used to inform the planning of feasible environmental health activities under the PHRplus Thula district environmental health pilot project. The Governorate Health Office, District Health Office, the local council and other stakeholders were consulted before the household survey was started.
Summary of results/Main findings
1. Lack of access to safe water
Half of the 12 communities report poor access or a complete lack of access to sources of safer drinking water1; these communities also report the highest levels of water-related diseases and symptoms.
Close to one-third of the householders with children under 5 reported that their child of this age had diarrhea in the past 24 hours.
Nine out of every 10 householders report that they must go to fetch water three or more times a day, and two out of every five women have a round trip that takes more than 40 minutes − up to more than one hour − for each trip.
TP 1 PT In this context, "safer sources" are sources other than the local cisterns and unprotected springs, i.e., protected springs, basin [water from a spring], tanker truck, water vendor, water project.
Executive Summary xi

2. Lack of knowledge and protective practices related to handwashing
Survey results show low levels of adequate handwashing practices as well as a general lack of understanding of the importance of handwashing for adults, children, and for all who care for small children.
Although six out of every 10 respondents reported using soap in handwashing, in observed handwashings, householders used soap less than half of the time.
Only one in three respondents felt that handwashing is important to stay healthy.
Only about a third of the responding householders felt that diarrhea could be prevented.
3. Inadequate community solid waste and sanitation practices
Nine of every 10 respondents stated that their community had no designated place for garbage, and only about a third said their community gets rid of garbage.
Desire for better solid waste management was nearly universal; only one person among all surveyed householders said that nothing more should be done to deal with garbage in their community. Four of every five felt that garbage is associated with the possibility of illness.
More than half of the responding householders with children under 5 years old use unsanitary and environmentally risky feces disposal practices.
4. Challenges in attaining healthy school environments
Half of the responding householders felt their local school was not a healthy school, or did not know.
When asked what makes up a healthy school environment, the householders’ most common answer was “don’t know.” Only one out of every five respondents mentioned that water availability at the school is part of a healthy school environment.
Most respondents demonstrated a lack of awareness as to how the school, the local council, and local leaders can take active roles in helping to ensure a healthy school.
The report also analyzes the survey findings by individual community and recommends priority and targeted community-specific interventions. Based on the survey results indicating community needs, and with the cost-effective use of project resources in mind, five villages (Al Ghoolah, Al Khadhrab, Al Saadiah, Al Zafen, and Hathan) and the town of Thula will be candidates for intervention activities in hygiene promotion, cistern rehabilitation/unprotected spring management, solid waste management/recycling, and healthy schools interventions.
xii Household Hygiene Improvement Survey in Yemen

1. Introduction
1.1 Survey background
Environmental factors play a major role in the high toll of infant and child mortality and morbidity throughout Yemen. Diseases account for a large portion of preventable illness in children as well as adults; diseases such as diarrheal disease, acute respiratory infection, and parasitic diseases are frequently closely linked to local environmental hygiene, water safety, and sanitation conditions.
In December 2004, the U.S. Agency for International Development (USAID)-funded Partners for Health Reformplus (PHRplus) team conducted a rapid assessment of selected communities in the Thula district of Amran governorate.2 The purpose of the assessment was to identify major environmental health problems by means of field visits, observations, interviews, and stakeholder meetings, with the aim to plan and implement relevant and practical community-based solutions when possible.
Once the preliminary assessment results3 indicated the need to improve the environmental health, hygiene, and sanitation conditions in Thula district, further actions to address these needs were initiated. Through consultation with the Governorate Health Office, District Health Office, the local council, and other stakeholders, the PHRplus team identified the need for an environmental health-related knowledge, attitudes, and practices (KAP) survey of households within communities representative of Thula district. A list of the twelve communities chosen as locations for the survey, with their populations as of 2004 census estimates, is found in Table 1.4
1.2 Survey objectives
The overall objective of the survey is to gain a better understanding of current knowledge, beliefs, and practices of households in these communities in relation to water, sanitation, and hygiene. The resulting information will assist in the identification of the needs of the district's communities, both as a group and as individual communities. In addition, the information gathered will inform the activities of the Thula district environmental health pilot, to best achieve its goal of improved community and family health through better hygiene and health education.
TP 2 PT Annex A contains maps of Yemen, Amran governorate, and Thula districts. For a map of Yemen highlighting Amran, see Figure 1. Figure 2 is a map of Amran governorate and its districts, showing the location of Thula District, the site of the survey.
TP 3 PT Keane, Susan Egan. 12/23/04. Environmental Health Assessment. Trip Report. Bethesda, MD: PHRplus, Abt Associates Inc. Selected findings included a) frequent reliance on cisterns and/or springs for all domestic water uses, b) lengthy and time-consuming trips for domestic water collection, c) essentially no treatment of water at the household level, d) newer flush toilet systems without proper waste water disposal, e) communities without methods for collecting trash, and f) schools in very poor condition and without toilets or water.
TP 4 PT All tables are found in Annex B.
1. Introduction 1


2. The Survey
2.1 Characteristics of survey and survey instrument
The survey took place by means of a face-to-face interview with each respondent. The trained interviewer, guided by the questionnaire, marked the participant's responses, or, in some cases, the results of the observation of a practice.
PHRplus-Yemen staff with experience in survey development and community participation developed the survey questionnaire. Reference was made to survey guidelines for environmental health and hygiene projects,5 and the team worked to develop the questions with care so that the survey as a whole could help define the current environmental health situation and clarify environmental health needs for the district’s families. The team chose the option of conducting a face-to-face interview, with the surveyor completing the survey instrument with the responses and additional observations, as the most appropriate method for this context of rural communities.
The survey instrument went through an approval process by the Institutional Review Board at Abt Associates. One condition of the approval was to assure that the confidentiality of the interviewees is respected, and to ensure that each interviewee understands that the option to refuse to participate.
2.2 Pilot testing of the survey
The survey team field-tested the survey in Thula town. The objectives of this pilot test were to decide a) if the survey should be administered to the male or female head of household; b) if the questions were understandable to the householders as initially written; and c) if the questions were acceptable to the householders, i.e., not causing offense or embarrassment that would interfere with the successful completion of interviews.
Fifteen householders were visited by two members – one female, one male - of the PHRplus survey team and a survey was completed in each visit. As a result of the pilot testing procedure, the following decisions were made:
The survey would be addressed to female heads of household, since it became evident that male heads of households were less able to answer several of the questions such as those concerned with child care, water, and food preparation.
The interviewers should be female to assure access to the female respondents.
Interviews should not take place during midday meal preparation time.
TP 5 PT Environmental Health Project (EHP). 2004. Strategic Report 8 – Assessing Hygiene Improvement: Guidelines for Household and Community Levels. USAID.
2. The Survey 3

Certain response choices were modified and some of the original questions were clarified, to ensure they would be understood.
The observations would be made at the end of the interview process.
2.3 Survey content
The main subject areas within the survey questionnaire were the following:
1. Basic demographic information about the respondents and their households
2. The current situation of community water supply
3. The current situation of community sanitation
4. The current situation regarding a healthy school environment
5. Community members’ current knowledge, beliefs, and practices concerning hygiene
6. Perceptions about common diseases in the community
In addition to collecting basic demographic information on the respondents and their households, all the questions making up the survey were grouped into four general subject areas within the four-part questionnaire, as follows6:
1. Cisterns and related information on community water supply and water usage (16 questions)
2. Solid waste and related information attitudes and community practices related to household refuse (10 questions)
3. Healthy school environment and attitudes toward community roles in possible improvements to school environments (10 questions)
4. Hygiene-related knowledge, beliefs and practices (56 questions)
Questions about community members’ perceptions concerning diseases and the health effects of poor hygiene were included in sections 1 and 4. For more information on the survey questions, please refer to the questionnaire in Annex C.
2.4 Survey administration and logistics
Interviewer selection and training − The data collectors were community members, selected from a group of more than 20 people recommended by the local District Health Office and the Local Council. The selection process was through interviews of all suggested individuals, carried out by project staff based on criteria such as education and prior experience with survey administration and interviewing. Project staff then trained the selected surveyors in a full-day session which included project orientation, interviewing techniques, overcoming obstacles, role-play, and practice sessions to
TP 6 PT These four sections are identified throughout this survey report by the following abbreviations when specific questions are identified: C=Cisterns; SW=Solid waste; HS = Healthy schools, and H=Hygiene.
4 Household Hygiene Improvement Survey in Yemen

gain familiarity and experience with the questionnaire and its administration. All trainees were evaluated as well prepared to administer the questionnaire at the end of the day.
Data collection in the 12 villages took place over three days in March 2005 – Each interviewer completed approximately eight or nine interviews a day, each interview taking around 40-45 minutes. All 11 interviewers except one were female to ensure success in reaching the female householders; the single male was part of a husband-wife team.7 If a survey could not be completed due to refusal or otherwise, the interviewer completed an information sheet as to why that household did not participate. The total refusals were six out of 275 households visited, or a refusal rate of 2%.
Quality assurance – To ensure that the survey was administered and interpreted in a uniform way, the interviewers were debriefed each day on their return, and the data obtained were collected from the interviewers and reviewed. This daily supervision and review, in addition to the pilot testing, careful interviewer selection, and interviewer training, were all performed to help ensure that all surveys were administered and recorded in a standardized way, so that responses would be comparable and reliable.
Data security and management – Each household received a unique identification number, and the cover sheet with the name of the household was kept in a separate file. Completed interview forms were kept in a locked container and stored at local health centers and schools until transferred to the PHRplus office when the field work ended. The database created for the survey was password protected; database preparation work continued under PHRplus supervision during April and May 2005.
Challenges in achieving the coverage planned for the survey included occasional mountainous terrain and rocky, narrow roads, but the communities were welcoming and the major goals for data collection were achieved.
Householder response rates for questions within the survey were generally satisfactory. Some of the individual questions in the survey had higher non-response rates than others, and in most cases this was readily explained. For example, some questions were follow-up questions only applicable to a proportion of the responders, and some were aimed only to those householders with access to a cistern, or with school-age children.8
2.5 Profile of survey sample − Communities and households.
Communities – See Figure 3 for a map of the locations of the 12 communities within Thula district. Table 1 identifies the surveyed communities, including five with populations less than 500 (Al Ghoolah, Al Khadhrab, Hathan, Beit Behr, Al Dhabr) and seven with more than 500 residents. The largest community surveyed, at 6728, was Thula town, the district seat. Al Zafen and Mahla are between 1000 and 1500 residents, and Al Hejra, Madaa, Al Sheem, and Al Saadiah mid-sized with more than 500 but less than 1000 residents.
TP 7 PT This was a special case because the husband was a respected and familiar local teacher and was accepted by the female householders in that area. In the communities where householders were interviewed by this team, the total sample populations were approximately 16 rather than 24 since the couple visited one community per day and each interviewed eight households in each of those three communities (Al Khadhrab, Hathan, and Al Hejra).
TP 8 PT Because of this situation where the true “N” for a certain question was sometimes actually a subset of the total “N” of 269 households, percentages in the results section have frequently been re-calculated from original datasheet, so that the denominator becomes the actual number of people responding to the question rather than the total number in the survey. (See also preface to the results).
2. The Survey 5
Gender – The 269 surveyed householders were female. In three of the households surveyed, the interviewed woman was the head of the household, in the others, she was not the household head, but was identified as the person who otherwise managed the household.
Household size – The average household size calculated for the 12 communities as a whole is 8.1.
Number of children 0 to 5 years old – Householders were asked how many children in the household were aged 0 to 5 years. Nearly three out of every four households had at least one child aged from 0 to 5. Slightly more than a quarter (27%) had no children of this age. The total number of children 5 and under in the 264 reporting households was 417, with the average number per household 1.6.
2.5.1 Head of household information
Literacy – More than half of the 269 households (56%) reported that the household heads could neither read nor write. The three communities with the highest levels of household heads without literacy skills were Bait Behr (84%), Al Hejra (81%), and Al Saadiah (75%)9; those reporting the highest numbers with literacy skills were Al Dhabr (75%), Madaa (70%) and Al Khadrab (63%). Literacy level was not ascertained for the women respondents, but Yemeni survey data have indicated about 70% illiteracy in the female population, with only 1% of the rural female population completing secondary school.10
Age – Data from 263 households on the age of the household head (age of respondent was not available) showed that 32% were in their 30s or younger, 40% in their 40s or 50s, and 29% were age 60 or older.
TP 9 PT Other communities with illiteracy rates more than the sample average of 56% were Al Mahla, Al Thafin, and Al Sheem.
TP 10 PT Yemen Family Health Survey, 2002 (2004 English translation)
6 Household Hygiene Improvement Survey in Yemen

3. Survey Methods
3.1 Design
The cross-sectional survey was designed to describe a “snapshot in time” look at environmental health-related knowledge, attitudes/perceptions and practices of a proportion of the households of 12 communities in the district of Thula. The 12 communities were chosen to be as representative as possible of the 175 communities in the district, with at least one town or village from each of the six subdistricts of Al Masane’a, Bani Al A’bas, Al Surm, Al Khamisi, Hababa’a, and Thula.
3.2 Sample
After the pilot testing, the completion of the final questionnaire, and the training of the interviewers, the survey began with the goal of reaching approximately 25 respondents for each community surveyed. The final result was a total of 269 participating households with completed questionnaires. Refer to Table 1 for the sample size for each community, the total number of households, and the percentage of households surveyed, ranging from 3% in Thula to 89% in Al Dhabr. The final sample size ranged from 14 to 27, with an average of 22.4 household respondents per community.
The convenience sample of the households within the community was based on a process whereby the interviewer selected any household near the center of the village and then went to every second or third household to ask that female head of household to participate. In some of the very smallest communities, nearly every, or every other, household was surveyed. Each household in the community was eligible to participate. Only six of the 275 households visited refused or were unable to participate (examples: old age, had to fetch water).
Once the householder accepted the invitation to participate in the survey, the interviewers did their best to complete every question. Some of the original observation questions were excluded from the analysis because of insufficient data.
3. Survey Methods 7

4. Results11
4.1 Health − Survey results on respondent reports of illness in their family and community and their perceptions on preventing/avoiding diarrhea
4.1.1 Respondents with children under 5 years of age – reports of the child having experienced diarrhea (a) within the past 24 hours and (b) the past two weeks
Table 2 points out that one in four respondents (27%) with children under age 5 report a child of that age with diarrhea within the past 24 hours [H39]12, and four of ten (42%) report diarrhea in the past two weeks [H40]. In one village, Al Dhabr, more respondents said that their child had experienced diarrhea within the past 24 hours than did not. In Hathan, Al Zafen, Al Ghoolah, and Al Khadhrab, 33% or more of respondents reporting a child under 5 with diarrhea in the past 24 hours. In Al Ghoolah, Al Zafen, Madaa, Al Dhabr, Al Khadhrab, and Hathan, 50% or more of the respondents citing child diarrhea in the past two weeks.
4.1.2 Respondents’ reports of illnesses in any age groups that they had heard of in their area within the past two weeks
Table 3 lists seven communities – Al Zafen, Al Hejra, Al Sheem, Hathan, Thula, Al Khadhrab, and Mahla − where participants reported hearing of cases of typhoid, giardia, or bilharzia in their area within the past two weeks, and/or where respondents reported three or more reports of diarrhea in the same time period.
The most frequently mentioned respondent-reported diseases within the past two weeks [H21] were diarrhea (62 of 194 respondents or 32%) and flu (29%), followed by typhoid (13%), respiratory diseases (5%), bilharzia (3%), malaria (3%), skin diseases (2%), and giardia (2%). Each respondent could name one or more illnesses. Four out of 10 of the respondents said they did not know. On average, each respondent who cited at least one disease had heard of 1.5 conditions. As highlighted in Table 3, some of the reported diseases were located in just a few of the villages, for example, 20 of
TP 11 PT The percentage results for each question were frequently calculated on the actual number of respondents rather than the total number of surveyed households, especially when there were a significant number of non-respondents to the questions (e.g., as when a question was aimed only at those respondents with children in school). The term “respondents” is used in each case when the actual number of respondents is the denominator for the reported percentages. This contrasts with the use of the phrase “those surveyed” or similar when the denominator is the total number of survey participants (269).
TP 12 PT Each specific question discussed in the text is identified by an abbreviation depending on its location in the original four-part survey (Cistern, Solid Waste, Hygiene, and Healthy Schools). See also the Acronyms/ definitions page.
4. Results 9

the 62 reports of diarrhea were from Al Zafen, 11 of the 25 typhoid reports were in Al Hejra, and four of the five bilharzia reports were in Hathan.
How the named diseases occurring in their area were treated [H24] was answered by 118 respondents, of which 94% said that the diseases were treated at the health facility. Only five respondents said the diseases were not treated, one said the person affected received traditional health treatment, and one did not know about the treatment.
4.1.3 Perceptions of the causes of the recent diseases in their area
Householders were also asked about their opinions on the causes of the diseases that they named as recently occurring in their areas [H22]. The 213 respondents gave a total of 251 responses, of which the majority response (61%) was “don't know”.13 The three main perceived causes of the diseases that had been reported by respondents follow:
1. Drinking dirty water – 77 of 213 respondents – 36%
2. Eating improperly washed food – 10%
3. Eating with dirty hands – 7%
The following responses were given by three or fewer householders – dealing with animals (3), playing in areas filled with waste and feces (2), not washing hands before eating (2), and not washing hands after exiting the bathroom and playing in dirty cisterns (1 each).
The communities with respondents most often citing ‘drinking dirty water’ as a cause of the illnesses mentioned (the most frequent of which was diarrhea) were Al Hejra, Al Dhabr, Al Zafen, and Hathan. In one town, Al Hejra, more than 50% of respondents chose “eating with dirty hands.” The numbers of non-respondents were particularly high in Mahla (20 of 27) and Madaa (15 of 23). The 83 respondents who named at least one perceived cause of a disease gave a total number of 121 opinions as to causes, an average of 1.5 each.
4.1.4 Householder reports of sickness ascribed to drinking or using water from locally available sources
Any drinking water – Of the 258 respondents to the question Have you heard of any one who was sick because of drinking from the water in the last two weeks [H20], the majority (73%) answered no. Sixteen percent said they had heard of this situation. The only two communities to have more “yes” answers than “no” answers were Al Zafen (13 yes, 7 no) and Al Hejra (8 yes, 4 no). “Don’t know” responses were given by 11% of the respondents.
Drinking cistern water – In another question [C10], the householders were specifically asked if they knew anyone who got sick because of using cistern water (no time frame was specified). Of the 213 respondents to this question, 20% said that yes, while the other four out of five respondents (80%) said no, they had not heard of this situation. There were 56 non-respondents. The only
TP 13 PT In seven of the 12 communities, 50% or more of the surveyed householders responded “don't know” when asked about their opinions as to causes of any of the diseases mentioned. These seven communities were Al Dhabr, Al Khadhrab, Al Saadiah, Al Sheem, Bait All Bahr, Madaa, and Thula.
10 Household Hygiene Improvement Survey in Yemen

community with a majority of “yes” responses was Al Zafen (14 of 22). Communities with all or a majority of non-responses were Mahla and Madaa.14
A follow-up question [C11] asked about what disease was thought to be caused by the cistern water. Of the 43 household respondents who answered “yes” that they knew a person who got sick from cistern water, 38 responded to this follow-up question. These 38 respondents gave a total of 52 responses from the options offered; the responses in order of frequency were diarrhea (50%), got poisoned (18%), don't know (13%), bilharzia, malaria, skin diseases, respiratory diseases (11% each), typhoid (8%), and giardia (5%).
Below, each category of disease is listed, with the communities with one or more respondents citing that category:
Diarrhea – Al Zafen, Hathan, Al Sheem, Al Hejra, Al Khadhrab, Al Saadiah, Al Dhabr
Got poisoned – Al Saadiah, Al Zafen, Al Sheem, Al Hejra, Thula
Bilharzia – Al Sheem, Al Zafen, Hathan, Thula
Malaria – Al Khadhrab, Al Saadiah, Al Zafen
Skin diseases – Thula, Al Saadiah
Respiratory diseases – Al Dhabr
Typhoid – Al Khadrab, Al Hejra, Hathan
Giardia – Hathan
Don't know – Al Sheem, Al Zafen, Madaa
Although 43 householders said they knew someone whose sickness was attributed to cistern water, 155 respondents answered a follow-up question [C12a] asking about how people who got sick from cistern water were dealt with. Most of the respondents (76%) said that affected people went to the health facility, 10% said that they received traditional treatment,15 10% said the affected person did nothing, and 10% didn’t know what happened.
Householders were then asked how the cistern was dealt with after someone had gotten sick due to cistern water [C12b]. Once again, more households gave responses to this question (143) than the number who responded to the question if someone had gotten sick because of using cistern water (43). Of the respondents, 50% said nothing was done, 27% reported that the cistern was cleaned, 21% said “don’t know,” and 3% said grass or a tree16 was planted.
Communities with more than half of the responses for that village indicating that nothing was done to the cistern were Al Zafen, Al Sheem, Al Hejra, and Bait Behr. In only one village, Al Dhabr, the majority agreed that the cistern had been cleaned because of people getting sick.
TP 14 PT Madaa and Mahla residents were usually non-respondents to the cistern questions; neither village reports any use of cistern water.
TP 15 PT Communities with three or more responses saying “traditional treatment” were Al Dhabr (9), Al Sheem (3), and Al Zafen (3).
TP 16 PT This response referred to either the Qelsina grass or Sho'abat/Ta'amsh tree, believed to be helpful in filtering dust and dirt from the water.
4. Results 11

Table 4 and Table 5 compare the communities that report that drinking water is from cisterns (Table 4) or unprotected springs (Table 5) with the numbers of household respondents reporting likely water-related diseases.
4.1.5 Perceptions on preventing/avoiding diarrhea
When respondents were asked if they thought diarrhea could be prevented [H41], 213 householders responded. Of that group, 41% said yes, 24% said no, and 35% said that they did not know. Table 6 is a chart of the results of this question, for all the 269 surveyed households.
In Al Zafen, a majority of respondents said that diarrhea cannot be prevented (18 of 25 or 72%). Other communities with more “no” than “yes” answers were Bait Behr and Thula; communities where more than five respondents answered “don’t know” were Al Khadhrab, Hathan, Al Sheem, Al Saadiah, and Al Ghoolah. Communities with 10 or more non-respondents were Mahla, Madaa, and Thula. See Table 6 for the complete responses by town to this question.
Householders who believed that diarrhea can be prevented were then asked how do you think diarrhea can be avoided. Of the 87 people who answered “yes” to H41, 86 answered this question [H42], to which multiple choices were allowed. Nearly half of the respondents said that one way was to have children avoid drinking dirty water; three of 10 cited not eating dirty food, and a quarter of the respondents said that children should wash their hands before and after eating.
Communities with five or more responses for any of the list of responses were: a) to have children not drink dirty water (Al Saadiah, Al Sheem, Al Zafen, Bait Behr, and Hathan); b) not eating dirty food (Al Saadiah); c) children wash their hands before and after eating (Al Hejra, Mahla); d) to keep him/her away from sick children (Al Saadiah, Al Sheem); and e) children wash their hands after using bathroom (Al Hejra).
The householders did not often choose the two responses citing children’s handwashing as a way to avoid diarrhea, with a few exceptions such as Al Hejra. In three communities, no respondents selected the children’s handwashing responses: Al Zafen, Madaa, and Thula.
These 86 respondents gave a total of 121 responses (other than six “don't knows”), or an average of 1.4 perceptions each about ways to avoid diarrhea. The communities with more than this average number of responses per respondent were Al Hejra (2.3), Al Dhabr (1.7), Al Zafen (1.6), Bait Behr (1.6), Al Saadiah (1.5), and Mahla (1.5).
4.2 Water − Water sources for drinking/household uses, water transport and storage practices, and attitudes and community practices related to local cisterns
4.2.1 Water sources
Drinking water − The survey asked two separate but parallel questions about drinking-water sources, H1 (263 respondents), and C1a (241 respondents).17 Question H1 asked for main and secondary sources of drinking water. Each respondent, on average, named 1.4 sources, demonstrating
TP 17 PT Percentages are calculated from the number of respondents to each question; “H1” identifies the question asked in the hygiene section, and “C1a” was the question in the cistern section. The questionnaire is available for reference in Annex C.
12 Household Hygiene Improvement Survey in Yemen
that not all households have a secondary/alternative source of drinking water. The second drinking water question, C1a, asked from what source drinking water is brought. Even though an alternative source was not requested, each householder again gave more than one answer, with the average (1.3) very close to the previous average.
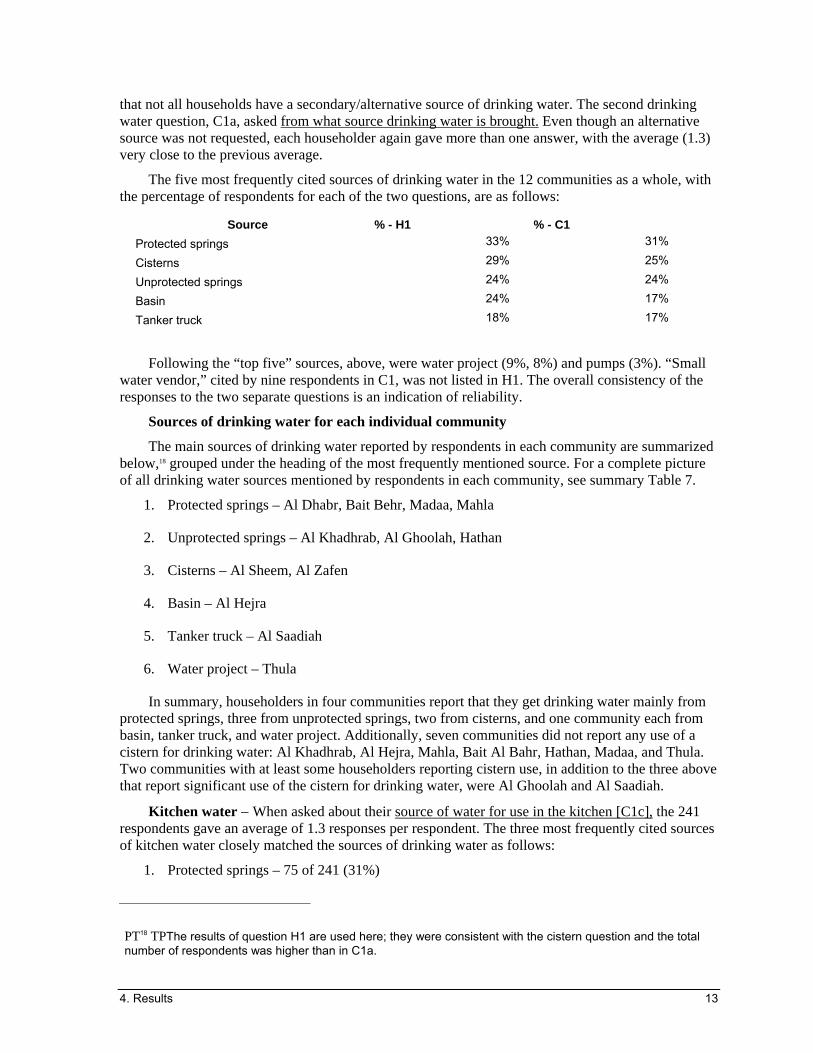
The five most frequently cited sources of drinking water in the 12 communities as a whole, with the percentage of respondents for each of the two questions, are as follows:
Source % - H1 % - C1 Protected springs 33% 31%
Cisterns 29% 25%
Unprotected springs 24% 24%
Basin 24% 17%
Tanker truck 18% 17%
Following the “top five” sources, above, were water project (9%, 8%) and pumps (3%). “Small water vendor,” cited by nine respondents in C1, was not listed in H1. The overall consistency of the responses to the two separate questions is an indication of reliability.
Sources of drinking water for each individual community
The main sources of drinking water reported by respondents in each community are summarized below,18 grouped under the heading of the most frequently mentioned source. For a complete picture of all drinking water sources mentioned by respondents in each community, see summary Table 7.
1. Protected springs – Al Dhabr, Bait Behr, Madaa, Mahla
2. Unprotected springs – Al Khadhrab, Al Ghoolah, Hathan
3. Cisterns – Al Sheem, Al Zafen
4. Basin – Al Hejra
5. Tanker truck – Al Saadiah
6. Water project – Thula
In summary, householders in four communities report that they get drinking water mainly from protected springs, three from unprotected springs, two from cisterns, and one community each from basin, tanker truck, and water project. Additionally, seven communities did not report any use of a cistern for drinking water: Al Khadhrab, Al Hejra, Mahla, Bait Al Bahr, Hathan, Madaa, and Thula. Two communities with at least some householders reporting cistern use, in addition to the three above that report significant use of the cistern for drinking water, were Al Ghoolah and Al Saadiah.
Kitchen water − When asked about their source of water for use in the kitchen [C1c], the 241 respondents gave an average of 1.3 responses per respondent. The three most frequently cited sources of kitchen water closely matched the sources of drinking water as follows:
1. Protected springs – 75 of 241 (31%)
TP 18 PT The results of question H1 are used here; they were consistent with the cistern question and the total number of respondents was higher than in C1a.
4. Results 13

2. Cisterns – 28%
3. Unprotected springs – 23%
Other sources mentioned were: small water vendor, basin, water project, pumps, and tanker truck. The most frequently chosen source of kitchen water for each of the individual communities was the same as for drinking water, except in Al Saadiah, where the most frequent source of kitchen water is small water vendor whereas for drinking water the respondents cited tanker truck most frequently. The seven communities where there were no respondents reporting the use of a cistern for drinking water [see 4.2.1.1] also did not report using cisterns as their main source for kitchen water.
Bathroom water − The top five sources for bathroom water for 231 respondents (averaging 1.3 responses each) show that cisterns are now first place:
1. Cisterns – 104 of 231 or 45%
2. Protected springs – 27%
3. Unprotected springs – 27%
4. Tanker truck – 11%
5. Basin – 10%
Other sources less frequently cited (20 or fewer respondents) were water project, small water vendor, and pumps. In the individual communities, the choice for bathroom water was the same as for drinking water except for Beit Behr, where householders report their most frequent source of bathroom water as unprotected springs. In Thula, residents cited the water project as their most frequent source of bathroom water, as they did for drinking water, but now the use of cistern water is mentioned for the first time, with 17 of 20 respondents saying that they also use cistern water for bathroom water.
Housecleaning water − As with drinking water, two separate questions were asked about the sources of (house)cleaning water, and the two housecleaning water results were essentially duplicates of each other, including the average number of responses per respondent at 1.4 each. The “top 5” choices of cleaning water sources are listed below, with percentages calculated in each case on the number of respondents for that question. (H2 = 263, C1d = 242).
1. Cisterns – 45, 46%
2. Protected springs – 30, 32%
3. Unprotected springs – 30%
4. Basin – 12, 14%
5. Tanker truck – 8, 13%
Less frequently cited were water project, small water vendor, and pumps. Al Dhabr and Al Saadiah list cisterns as a main source for cleaning water, as do Al Sheem and Al Zafen, the two communities that appear to heavily rely on cisterns for all or nearly all water use. At least some Al Dhabr and Al Saadiah residents appear to be able to choose between water sources; in Al Saadiah an equal number of households cite cisterns and tanker truck for cleaning.
14 Household Hygiene Improvement Survey in Yemen

4.2.2 Availability of main source water throughout the year
About three of every 10 (31%) respondents reported that water from the main source has been unavailable for at least a day out of the last two weeks [H6]. In Al Zafen, Thula, and Al Saadiah, the majority of surveyed households say that “yes,” within the past two weeks, their main source of water has been unavailable for at least a day. Eight of 10 (80%) respondents [H7] stated they are able to use their [main] source of water all year long, while two of 10 (19%) say only part of the year, and three respondents say only during the rainy season. Al Saadiah and Thula were the only two communities where a majority of respondents said that their primary source of water is available only part of the year.
Fifty respondents answered a follow-up question about an alternate source of water when their main source is not available [H8]. The alternate sources and the percentage of respondents citing them were as follows (average of 1.5 responses per respondent): cisterns (90%), tanker truck (20%), basin (16%), pumps (14%), and unprotected springs (10%). Both in Thula and Al Saadiah, where the majority of householders say the main water source is available only part of the year, the most frequently cited alternate source is a cistern.
4.2.3 Practices related to how water reaches the households
Trips to the water source – Of 261 respondents to a question about how many times the householder fetches water every day [H3], 66% go more than four times a day, 23% make a trip three to four times, and 11% go once or twice a day. The communities where the largest numbers of household respondents answered that they take more than four trips for water a day were Al Zafen, Al Dhabr, Al Sheem, and Mahla. The most frequent answer in all 12 communities was that the respondents fetched water more than four times a day.
Not only do the women respondents report the need to take frequent trips to bring water for the household, they spend significant amounts of time on these trips. Of 262 respondents to a question [H4] about the length of time needed for a roundtrip for water, only about one in five have the shorter round-trip journey of 20 minutes or less to get needed water, with the rest requiring a roundtrip of 20 minutes or longer each time. A full 43% of respondents have to make a roundtrip of at least 41 minutes and up to over one hour each time that water is needed. Al Ghoolah is the only community where a majority of respondents report a trip of 20 minutes or less. In Madaa, the majority must travel more than an hour.
When asked about what container is used for fetching water, most (six of 10) householders use a “pot” for fetching water, followed by a large plastic container, and 20% use a bucket [H5].
Scooping water from a cistern [C5] − When asked to list the ways used to scoop water out of the cisterns, a majority (86%) of the 153 respondents said they use a “bucket prepared for collecting water” and only 9% used a bucket that is also used for animals. Of the six communities with over a majority of respondents answering this cistern question − Al Ghoolah; Al Saadiah; Al Dhabr; Al Sheem; Al Zafen; and Thula − five gave “bucket prepared for collecting water” as their most frequent answer. The exception, Al Zafen, with 21 respondents, had 11 responses for “bucket used for animals and collecting water.”
A total of 119 observations were made of how the householder scooped water from the cisterns, and the interviewers noted that the use of a clean bucket occurred in only 14% of the observations. In 91% of the cases observed, a hand touched the cisterns, and in 9% the feet touched the water.
4. Results 15

4.2.4 Practices related to storage and treatment of water in the household
Household water storage − Two-thirds of 253 respondents say that they store the water at home, while a third do not [H9]. The only five communities where a majority of respondents answered that they do not store water at home were Al Ghoolah, Al Hejra, Al Khadhrab, Hathan, and Madaa.
When asked how many water storage containers are in the household [H10], most (54%) of the 171 respondents said there were two or more containers, while a sizeable proportion, 46%, said there was only one. With respect to having different containers for storing drinking water and cleaning water [H11], of the 188 respondents who answered this question, most (76%) said they do not have separate containers19 and 24% say they do. The only community with a majority of respondents saying that they do have different containers for storing drinking water and cleaning water was Mahla.
Type of container: Of the 186 respondents to this question, HS14 (with 305 responses, an average of 1.6 responses each), 55% have a tapped container, 38% have a barrel, 18% have a narrow-capped container, and less than 10% each have a piped container or a plastic container. As to how the householder gets water out of the storage container [H12], the 181 respondents (with 213 total responses) reported that they take water with a ladle/small water bucket (56%); from a tap (48%); with a water pump (9%); and with a bucket (6%).
Cleaning the water containers: When asked if the water containers are cleaned [H15], 96% of the 193 respondents say that they are and 4% that they are not. A follow-up question about when the last cleaning was done [H16] found that slightly more than half (52%) the respondents said they had last cleaned the containers two weeks ago, more than a month ago, or that they didn’t remember, and slightly less than half (48%) responded that they had cleaned the containers either today, yesterday, or last week. The towns where the majority of the respondents said “more than a month” or “don't remember” were: Thula, Al Zafen, Al Sheem, Al Saadiah, and Al Hejra. Towns were the majority said “today” or “yesterday” were Al Ghoolah, Mahla, and Al Dhabr.
Household water treatment − When asked if they treat drinking water [H17], 20% of the 245 respondents said they do treat water and 80% said that they do not. The households responding that they did not treat water were in a majority in all villages except Al Dhabr and Al Zafen. These two villages were the only locations where “yes” responses exceeded “no” responses. Only two other villages had any “yes” responses: Al Saadiah (8) and Al Sheem (4).
A follow-up question [H18] asked the “yes” responders how they typically treat the drinking water. Of the 50 who answered “yes” to the previous question, 49 responded that they treat the water by: a) sieving through a cloth (94%), and b) boiling (6%). The only community with any respondents who said they boiled water was Al Saadiah (three of eight responses). All the respondents in the other communities (Al Dhabr, Al Zafen, and Al Sheem) sieved the water.
When asked about the last time the water was treated [H19], most of the 47 respondents (60%) said they treated their drinking water today or yesterday. Only eight said they treated it a week or a month ago and 11 did not recall. The four communities where all the 47 respondents to this question resided were Al Dhabr, Al Saadiah, Al Sheem, and Al Zafen, which were the only four communities where respondents said they treated their drinking water.
TP 19 PT The lack of two separate containers for drinking and cleaning water is likely to be particularly risky in locations such as Al Dhabr and Al Saadiah, where cleaning water is from cisterns but a main source of drinking water is from protected springs (Al Dhabr) or tanker truck (Al Saadiah).
16 Household Hygiene Improvement Survey in Yemen

4.2.5 Householder attitudes and community practices related to local cisterns
Householder perceptions of the importance of the cistern - When asked how important the cistern is to the householder and the village [C16], 210 respondents chose 239 answers as follows, in order of frequency:
Rely totally on it for drinking and cleaning – 120 of 210 or 57%
Rely on it for animals and cleaning – 38%
Village doesn’t rely on it – 11%
Don’t know – 6%
Rely on it for animals – 2%
The most frequent response by community is as follows (the notation (100%) indicates that all respondents gave this response):
Rely totally on it for drinking and cleaning - Al Ghoolah (100%), Madaa (100%), Al Dhabr (100%), Al Zafen (100%), Al Khadhrab, and Al Sheem
Rely on it for animals and cleaning – Thula (100%), Al Saadiah, Hathan
Village doesn’t rely on it − Bait Behr
Don’t know or no response − Al Hejra, Mahla (100% non-response)
For a summary of selected survey results relating to cisterns, focusing on the communities where respondents specify that they drink water from the cistern, see Table 8.
Householder perceptions of the suitability of the local cistern − When asked if the cistern is currently suitable for all its uses [C13], slightly over half of the 200 respondents (54%) said that the cistern is NOT currently suitable for all its uses, while 46% said that the cistern is suitable. Communities where more than half of the respondents said it is suitable were Al Ghoolah, Al Dhabr (100%), Al Sheem, Madaa (100%) and Thula.
Participating communities where no respondent said the cistern was suitable for all uses were Al Zafen (cistern is drinking water source), Al Hejra, Bait Behr, and Hathan (do not rely on cistern for drinking). Finally, for the remaining two villages, the “no” votes outnumbered the “yes” votes: Al Khadrab, and Al Saadiah. More than half of the non-responders were from two villages, Mahla and Madaa.
Of the 109 “no” respondents to this suitability question, 89 responded to a follow-up question as to why cisterns are not suitable for all uses [C14]. The 89 respondents gave a total of 195 answers (2.2 responses each) as follows:
Isn't covered – 85%
Animals drink from it – 56%
Children and animals defecate next to the water – 42%
4. Results 17

Green colored – 29%
Isn't fenced – 7%
Villages with the clearest “number one reason” for why the cistern is not suitable were Al Khadhrab (animals drink from it); Al Saadiah (isn't covered, also animals drink from it); Al Zafen (children and animals defecate next to the water); and Bait Behr (is not covered).
Householders opinions about how to improve the suitability of the cistern − The question how can the [local] cistern be made suitable [C15] had 189 respondents and 304 responses as follows:
Clean the cisterns – 129 of 189 or 68%
Cover the cisterns – 34%
Don't know – 20%
Stop having children play there – 14%
Fence the cisterns – 12%
Plant Sho'abat/Ta'amsh tree – 6%
Add Qelsina grass – 4%
Stop fetching water from it – 3%
Communities (except Madaa and Mahla with non-respondents) and their “number one” choice of response for improving the cistern were: “clean the cisterns” cited by Al Ghoolah, Al Saadiah, Al Dhabr, Al Sheem, Al Zafen, Al Hejra, and Thula and “cover the cisterns” from Al Khadhrab and Hathan. Bait Behr respondents gave equal numbers of responses for each of the following: clean, cover, and don't know.
Householder perceptions of what makes water unusable − Respondents were also asked their opinion on what makes water unusable [C9]. There were 343 responses from 213 respondents, averaging 1.6 responses each excluding the “don’t knows.” The responses in order of frequency were as follows:
Isn’t covered: 124 of 213 or 58%
Animals drink from it – 42%
Children and animals defecate next to the water – 34%
Green-colored water – 15%
Isn’t fenced – 6%
Don't know – 6%
Some of the communities cited more reasons why water becomes unusable than others. The communities with responses per participant exceeding the average of 1.6 each included Al Zafen at 2.7, Madaa 2.6, and Bait Behr at 2.3.
18 Household Hygiene Improvement Survey in Yemen

The most frequent reason given by seven communities as to what makes water unusable was that it “isn't covered,” they were Al Khadhrab, Al Saadiah, Al Sheem, Al Hejra, Bait Behr, Madaa, and Thula. For the communities of Al Ghoolah Al Dhabr, and Hathan, the most frequently offered reason was that “animals drink from it.” Hathan had an equal number of respondents saying that “children and animals defecate next to the water” was a reason that water is unusable, and most Al Zafen residents selected this response as well.
Householder reports of community practices related to cisterns − When asked if the local cistern(s) get cleaned [C3], 20 three out of four of the 172 respondents (75%) said yes, 19% said no, and 6% didn't know. The five communities where the majority of respondents reported that the cisterns get cleaned were Al Saadiah, Al Dhabr, Al Sheem, Al Zafen, and Thula. In Al Ghoolah, half of the 24 respondents answered that the cisterns do not get cleaned. The remaining villages either had no responses (Mahla) or a small number of respondents (Al Khadhrab, Al Hejra, Bait Behr, Hathan, and Madaa).
Of the 129 householders responding to a question about when the cistern was most recently cleaned, the most frequent answer was more than one year ago (41%). Only 16% mentioned any time period shorter than six months ago, 30% said cleaning was done between six months and a year ago, and 13% didn’t know. Communities with a 100% non-response rate to this question were Al Khadhrab and Mahla. The most frequent answer for communities with more than half of the respondents answering were as follows:
Last time cleaned was from six months to one year ago: Al Saadiah and Thula
Last time cleaned was more than one year ago: Al Dhabr and Al Sheem
Don’t know: Al Zafen
When asked how long the water in the cisterns stay stored [C2], nearly a third (30%) of the 161 respondents reported that the water is “always” stored there, and another third (34%) say that it is stored from a year to two years or over two years. Twenty-seven percent said water was stored from six months to one year, and other respondents gave shorter time periods or “don't know.” Looking at the results in a slightly different way, the number of respondents who say the cistern water stays stored six months or more (146) is 11 times as high as the number that say cistern water is stored for less than six months (13). The two communities where the majority response was “always” were Al Zafen and Al Ghoolah, and the two communities where a majority of respondents said that the water is stored in the cistern from a year to two years or more were Al Sheem and Al Dhabr. In Thula and Al Saadiah, most respondents said water is stored from six months to a year.
Finally, when asked from where do animals drink [C8], the 216 respondents gave 242 responses, with the majority (82%) saying animals drink from a bucket, and 19% citing another location; 7% directly from the cisterns; and 4% said they don’t know. Al Saadiah was the only community where more than one or two respondents (nine of 24) reported that animals drink directly from the cisterns.
TP 20 PT The three questions [C2-4] that follow were asked only of households that get water from the cisterns for any purpose.
4. Results 19

4.3 Sanitation – Solid waste21 and human waste management
4.3.1 Solid waste practices and perceptions
Household-level solid waste practices − The survey was a source of information on solid waste collection and disposal practices within the households, such as:
How garbage is gathered in the house [SW1]: A total of 177 householders (or 69% of 258 respondents), say they use buckets, 65 (37%) use plastic bags, and 25 (10%) use the yard. In one town, Al Ghoolah, most respondents said they gather garbage from the house “in the yard,” and in Bait Behr most use plastic bags. In the other ten communities, the most frequently reported choice is buckets.
Where garbage is collected in the house [SW2]: Of the 253 respondents to this question, 99 (39%) say they collect the garbage outside the premises, 80 (32%) collect in the yard, and 74 (29%) collect it in the kitchen. In Al Dhabr, 100% of the respondents said they collect it outside the premises; other villages where this was the most often mentioned response were Al Sheem, Al Ghoolah, and Bait Al Bahr. However, in Al Khadhrab, Al Zafen, and Madaa, most responded that they collect garbage in the yard, and in all other villages/towns the kitchen was most frequently mentioned as the household garbage collection point.
How often the household gets rid of the garbage [SW3]: Of 255 households responding, 215 (84%) said that they get rid of waste every day; 28 (11%) said every 2 days, and 12 (5%) said once a week.
Community-level solid waste practices − Survey responses regarding community-level refuse disposal were the following:
Where garbage is collected outside the house [SW4]: About nine out of 10 of the 256 responding households (89%) responded that there is no specific area for gathering garbage outside the house. A few other respondents were as follows: (a) garbage is collected from each house (7%); (b) a family member takes it to a designated place (2%); and (c) don’t know (2%). Only Thula had more than two responses that “garbage is collected from each house” (11 of 24 responses).
Does the community get rid of garbage? [SW5]: Four out of ten (41%) of the 256 responding households said that no, the community as a whole does not get rid of the garbage. About a third (34%) said yes, and there were some respondents who said their community acts to get rid of garbage only sometimes (13%) or rarely (12%). At the community level, the majority of respondents in six villages said their community does not get rid of the garbage, most respondents in four villages state their community does get rid of garbage, and in Thula participants said the community “rarely” gets rid of garbage. In Hathan, responses are divided. See Table 9 for selected responses on solid waste disposal practices for each community.
Methods the community uses to get rid of garbage [SW6]: Of the 151 households answering “yes, sometimes or rarely” to question 5, 131 respondents indicated the methods
P21 P Solid waste is defined as household solid waste, e.g., trash and/or garbage. The Arabic word for garbage was used in the survey, it also means trash, waste.
20 Household Hygiene Improvement Survey in Yemen

used by their community, which were either burning (54%) or gathering in one place (22%). A quarter of the respondents to this question (24%) said that they did not know the methods the community uses. The villages where burning garbage was most often mentioned were Al Dhabr, Al Sheem, and Al Zafen. In Madaa, most responded that the community gathers garbage in one place.
When asked their opinion on what else should be done to deal with garbage in their community [SW10], the respondents said:
Gather the garbage and burn it – 120 of 248 respondents (48%)
Don't know - 29%
Designate a fenced place to throw garbage – 29%
Gather it in a plastic bag and tie it – 4%
Recycle the garbage – 1%
Nothing – 1 response only (<1%)
Communities with the highest proportions of responses saying that the community should gather/burn the garbage were Al Dhabr, Thula, Bait Behr, and Al Sheem .
Perceptions about problems caused by household solid waste
Beliefs about garbage as the cause of disease(s) in the respondent household − More than four of five respondents (85% of 261) connected garbage with the possibility of illness [SW7] answering that, yes, they believed garbage has caused disease in their household. The proportion of respondents who did not believe garbage had caused disease in their household was 8%. A further 7% said they didn’t know the answer. The only towns where there were any respondents who said they did not believe garbage has caused diseases in their household were Al Ghoolah, Mahla, Al Sheem, Al Zafen, and Madaa.
When asked [SW8] to choose what diseases they felt that garbage has caused, however, the most frequent response from the 215 respondents was “don't know” (38%), followed by diarrhea (33%), skin disease (25%), respiratory diseases (16%), typhoid (12%), bilharzias(7%), and giardia (1%).
Certain villages had particularly high suspicions of certain diseases being caused by garbage. For example, in Al Dhabr more than half of the respondents mentioned skin diseases; in Al Hejra 14 of the 16 surveyed householders mentioned diarrhea and 12, typhoid; in Bait Behr there were 10 of 25 householders who said respiratory disease, and Hathan householders (n=14) mentioned typhoid (6) and diarrhea (6) most frequently. Communities with 10 or more “don’t know” responses were Al Saadiah, Al Zafen, Thula, and Bait Behr. The two communities where respondents offered the most examples of diseases they felt were caused by garbage were Al Hejra (36 answers for 16 respondents, with every respondent gave at least one disease) and Hathan (20 answers for 14 respondents).
Perceptions about what problems are caused by garbage generally − When asked what problems are caused by garbage in general [SW9], the two most frequent responses were two species of flies: larger flies/houseflies (75%, 189 of 252 respondents) and the smaller fruit flies (46%). Another problem cited was a bad smell (44%), which seemed to be particularly noticed in Al Dhabr, Mahla, and Thula. The remaining four choices and the total respondent numbers for each were that garbage brings germs (21%), spreads malaria (3%), and spreads diarrhea (1%), also don’t know (8%). Communities with over five responses each saying that garbage “brings germs” were Thula (14), Al Ghoolah (10), and Madaa (8).
4. Results 21

4.3.2 Human waste/toilets/sewage
Household toilet facility presence and types − Overall, more than eight of 10 (84%) of the 262 respondents stated that a toilet facility is present in or near their household [H25], with 16% stating that it is not. See Table 10 for the percentage of householders without toilet facilities for each community.
Table 10 also summarizes the percentages of respondents in each community that report having a traditional bathroom. Overall, when asked what kind of toilet facility is in their household [H26], a majority of the respondents (71% of the 220 respondents) replied that they have a traditional bathroom. Other responses to the question were flush toilet (22%) and both types (6%).
Communities with the highest numbers of flush toilets (counting both the numbers of those responding they had flush toilets, and those who answered “both” − 63 total) were Al Zafen (14); Al Sheem (12); Al Dhabr (9); Thula (7); Al Hejra (6); and Bait Behr (6).
Regarding the number of toilet facilities in the household [H28], of the 245 respondents, 63% answered that they have one, and the remaining responses are as follows: two (23%), none (10%), and “three or four” (4%). Thula was the only community where households with two toilet facilities outnumbered those with one. The five communities where one or more respondents reported no toilet facilities in their household22 were Al Ghoolah (11), Bait Behr (5), Hathan (5), Al Zafen (2), Al Khadhrab (1), and Al Saadiah (1). The only community with five or more non-respondents was Madaa (7).
A question [H29] was also asked to ascertain how many members in the households use the toilet facilities. Of the 269 households, 217 gave a response to this question, with a majority (51%) of the 217 respondents saying that from six to 10 people use the toilet facilities. The other response categories were as follows:
One to five – 60 of 217 (28%)
Eleven to fifteen – 36 (17%)
Sixteen to twenty-one – 11 (5%)
The only two towns with more than one household each saying that their toilet facility or facilities were used by from 16 to 21 people were Al Sheem and Al Dhabr. Al Sheem had 12 households with two or more toilets each, and Al Dhabr had four households with two or more toilets (from question H28).23 The towns with five or more households each who gave no answer to this question were Hathan, Bait Behr, Madaa, and Al Ghoolah.
Sewage system − The survey also asked the householders about the type of sewage system that is connected to the bathroom. Most of the 215 respondents have a dry latrine24 (60%), about a quarter (26%) flush to piped sewer system, 16% flush to a septic system, and 2% have a service latrine where excreta are manually removed.
P22 P The number of respondents reporting no toilet facilities in the household was 25 [H28] and the number of respondents reporting no toilet facility in or near the household was 42 [H25]. P23 P Since the numbers of toilet facilities per household was not correlated with the numbers of people using the facilities in each house in the data reporting, it is not possible to calculate the exact number of people who use each toilet. 24 Dry latrine is another name for the Yemeni traditional toilet (see acronyms/glossary).
22 Household Hygiene Improvement Survey in Yemen
4.3.3 Toileting practices of under 5s in the household and disposal of toddler/small child stools (questions H37-38 were asked about each child under 5)
Toileting practices of under 5s: Householders were asked where their under-5 child passed stools last [H37]. The 167 respondents to this question gave 188 responses as follows:
Used washable diapers – 106 of 167 or 63%
Went in house/yard – 17%
Went outside the premises – 15%
Used disposable diapers – 9%
Used potty – 7%
Don't know – 1%
The only community where the most frequent response was not “washable diapers” was Al Zafen, where 19 respondents said the child either went in the yard or outside the premises.
Disposal of infant and young child stools − The 166 respondents to a question asking where feces were disposed after the last time their under-5-year-old child passed stools [H38] were:
Outside the premises − 48 of 166 or 29%
Washed away in sink or tub – 22%
Somewhere in yard – 16%
Washed away water discarded into water facility – 10%
Dropped in toilet – 9%
Into garbage – 8%
Did nothing, left it there – 5%
Don’t know – 1%
When the results for disposal outside the premises, in the yard, or in the garbage are combined, the total proportion of households currently using unsanitary and environmentally risky feces disposal practices is 58%. Table 11 pulls together the responses by community.
4.4 Hygiene
4.4.1 Handwashing practices
Table 12 summarizes selected responses indicating handwashing practices, including stated and observed use of soap. In response to a question about when the respondent washes her hands [H31], the average number of responses was 2.7 per respondent. The three most frequently stated responses were:
Before and after eating – 175 of 257 respondents (68%)
Praying – (66%)
4. Results 23

Before and after cooking – (42%)
Other responses were the following: when entering and going out of toilet facility (26%); when using contaminated materials (18%); before and after feeding an infant (13%); before and after cleaning infant feces (12%); and after dealing with animals (6%). In addition, 15% of the householders responded that they washed their hands for all the listed examples.
Two communities stood out as the only locations having more than 15 respondents saying that they wash their hands at all the listed times: Al Zafen and Madaa.
The fourth and fifth column in Table 12 highlights the differences found between what the recipients said about using soap for handwashing, and the observed use of soap for handwashing during an interviewer observation. Nearly all householders (96%) said that they would allow the observation, and in 80% of the households the observation was completed and recorded. The results from the 214 observed handwashings [H34] showed that only 43% actually used soap in the handwashing process. The results from the observed handwashing are shown in Figure 7.
In all communities except Mahla, the reported use of soap was greater than the observed use of soap. Al Dhabr had the highest number of occasions when both rubbing hands and using soap were observed (100% for both behaviors). The two communities where more than 10 observations of handwashing practices were not recorded were Maada and Al Saadiah.
The most frequent response for where the householder washes her hands [H30} is in or near the toilet facility, cited by 40%, followed by the response “no specific place” for 38%, in or near the kitchen for 37%, elsewhere in the premises 4%, and outside premises for 3%.
4.4.2 Perceptions of the importance of washing hands and of the role of personal hygiene in being healthy
When asked, “Why is it important to wash hands” [H36], the 259 respondents chose a total of 358 responses (averaging 1.4 each) to explain what they believe about the importance of handwashing, as follows:
Personal hygiene – 152 or 259 respondents or 59%
Prevents germs from getting into the body – 34%
To stay healthy – 30%
Prevents germs from getting into food – 11%
Don't know – 4%
The only two communities with respondents choosing “to stay healthy” as their number one choice were Bait Behr and Thula. All others chose “personal hygiene,” except Al Ghoolah where the first choice was “prevent germs from getting into the body.”
In another question [H54], householders were asked if they thought that personal hygiene has a role in being healthy. The respondents were nearly unanimous (97% of 258) in their agreement with this relationship. No householder said that it did not play such a role, and only eight householders said they did not know.
Still another area of questioning offered further information about householder perceptions of the importance of handwashing. Previously [section 4.1.6] it was reported that 41% of the householders
24 Household Hygiene Improvement Survey in Yemen

believed that diarrhea could be prevented [H41]. These householders were then asked how they thought diarrhea could be avoided. Of the 80 who answered, 26% said that they thought diarrhea could be prevented by having children wash their hands before and after eating, and 14% said by children washing their hands after using the bathroom. Communities with five or more responses for either or both of these two perceived diarrhea-avoidance methods were Al Hejra and Mahla. On the other hand, in Al Zafen, Madaa, and Thula, there were no respondents who chose either of the two handwashing options.
Finally, about a third of the women cited “not eating dirty food” as a way to avoid diarrhea. This leads into survey information about food preparation and storage practices.
4.4.3 Practices regarding food preparation and storage
Food preparation practices − In all communities except Bait Behr and Mahla, the majority of respondents, and 76% of all survey respondents overall, stated that they had left-over food from the last meal they had cooked [H45]. Most (90%) had already prepared food the day of the interview, with 10% having not prepared any food since the previous day [H43]. Table 13 summarizes householder practices relating to food preparation and storage.
Regarding the practice of handwashing before preparing food, nearly eight of 10 (78%) respondents said they include handwashing as part of food preparation, and in most communities the response “washed hands” was the number-one choice of the listed steps in preparing food. In four communities, however, fewer than three out of four women report that they wash their hands as a step in food preparation. Madaa stood out in particular, with not one of the 22 householders stating that they wash their hands before preparing food. Seventy percent of the householders also report washing dishes and utensils as part of food preparation. On the other hand, in eight out of 12 communities, fewer than two respondents report a routine of washing “food especially vegetables.” Thula is an exception with 22 of the 25 surveyed householders reporting that they do wash food/vegetables.
Food storage practices [H46] − Table 13 also confirms that, even though in most of the communities a majority of householders had leftover food at the last meal, the use of refrigerators for optimal temperature-controlled food storage is essentially non-existent in the villages. The only exceptions to the complete lack of refrigeration facilities were found in Thula and Al Saadiah. Other than the 8% of respondents who store their leftover food in a refrigerator, householders use room temperature (or warmer) storage, with 64% reporting that they store their leftover food on the table or shelf, 24% in the stone oven, and 4% in the oven.
4.5 Healthy Schools
4.5.1 School-age children and school attendance
Seven out of 10 (70%) of the 269 surveyed households said they had school-age children, and 25% did not. There was a 5% non-response rate to this question. All communities had more households with school-age children than without children of school age.
Reported school attendance for school-age children − About nine out of every 10 (89%) respondents report that they send their school-age child to school, and 11% reported they do not. The five communities in which 100% of the respondents reported sending their children to school were: Al Hejra Al Saadiah, Al Sheem, Al Zafen, and Thula. The seven remaining communities in which at
4. Results 25

least some of the respondents did not send children to school, in order of percentage of respondents indicating non-attending children, were:
Mahla − 45% (9 of 20 respondents)
Hathan − 25% (2 of 8)
Al Dhabr − 17% (4 of 23)
Al Ghoolah − 16% (3 of 19)
Bait Behr − 13% (2 of 16)
Al Khadhrab − 10% (1 of 10), and
Madaa − 7% (1 of 15).
Of the 22 respondents who said they do not send children to school, only 15 (68%) answered a follow-on question that asked why. Of these 15 responses, 11 said “social reasons (no girl schools),” two reported that the girls “fetch water all day,” one cited a child who “gets sick when they attend school,” and another chose the response that “the floor is not tiled/cemented, which causes dust.” Of the 11 household respondents who cited “no girl schools” in their area, eight were in Mahla. The other three responses citing this reason were from Bait Behr (2) and Al Dhabr (1).
4.5.2 Exploring the ideas of healthy schools with the community respondents
Table 14 presents selected responses regarding householders’ perceptions on whether their local school is a healthy school and if not, why not. Each community’s most frequent answer – yes or no − as to whether their school is a healthy school is recorded. Five communities stood out as locations where more respondents say no, their school is not a healthy school: Al Saadiah, Al Zafen, Hathan, Mahla, and Thula. Overall, slightly more than half of the 205 respondents − 52% − said that “yes,” they consider their local school a healthy school, 41% said no, and 7% said they did not know. Mahla was the only community that had more than 10 householders not responding to this question.
Householders’ reasons for why their school is not a healthy school − Table 14 also summarizes the most frequently mentioned reason on why the school is not a healthy school. From the previous question, 85 respondents said that their school was not a healthy school. In the follow-up question [HS6] as to why the school is not a healthy school, respondents chose a total of 211 responses. The four most frequently chosen reasons as to why the householder’s local school was not “a healthy school” were:
No proper windows in the class – 60 of 211 total responses25 (28% of responses)
There is dust in the class – 40 (19% of responses)
Trash isn’t collected in the school – 32 (15% of responses)
P25 P The number of respondents/non-respondents (out of the total N of 269) are missing from the datasheet for this question so the numbers of responses are given.
26 Household Hygiene Improvement Survey in Yemen

There aren’t any toilets – 29 (14% of responses)
The other responses were: the classrooms are cold (21), no water available (13), there are no facilities for handwashing (5). Eleven respondents said they didn’t know. Thula was the community with the highest number of total responses selected.
The last two columns in Table 14 point out that only a few respondents state that the lack of water in the school is a reason that their school is not a healthy school.
Householders’ opinions as to what is a healthy school environment
When householders were asked about factors that make up a healthy school environment [HS5] in general, the most frequent response of the 223 respondents was “don't know” (39%). Having “proper windows” in the school was the first specified factor given (39%), followed by “toilets should be provided” (25%), “no dust in the class” (24%), “trash is collected in the school” (20%), “water is provided” (20%), “classrooms aren’t cold” (12%), and finally, “provision of facilities for handwashing” – 1 (<1%).
The numbers of ideas for what makes a healthy school, per respondent in each community, were over the average of 2.3 in Thula, Mahla, Al Saadiah, Al Zafen, and Al Hejra. They were under average in Bait Behr, Hathan, Al Ghoolah, Al Khadhrab, Al Sheem and Madaa.
The four villages where respondents mentioned “toilets should be provided” as the most frequent specific response were Al Hejra, Al Khadrab, Bait Al Bahr, and Hathan.
4.5.3 Cleaning of the local school
Four out of five respondents (81% of 230 respondents) responded “yes” as to whether or not the school is cleaned regularly [HS7]. Sixteen percent said they did not know and 3% stated that the school was not cleaned regularly. When asked how often the cleaning is done [HS8], four out of five respondents (81% of 177) said the school is cleaned once a week, with the remaining participants saying that it was cleaned less often than once a week or that they didn't know.
Of the 210 respondents who answered a question about how the school is cleaned [HS9], four out of five (79%) said that the school is cleaned by the students having a cleaning campaign. Only 9% said that there is a person who cleans it, and 12% said they don’t know. Thula was the only community with most respondents saying that there is a person who cleans the school. All the other communities, except Mahla where the most frequent response was “don't know,” responded most frequently that the students have a cleaning campaign in order to clean the school.
4.5.4 How respondents describe the roles of the school, parents, students, local leaders, and local council in developing/maintaining a healthy school
When asked how different institutions and groups in the community can play an active role in having a healthy school, a noticeable result was how often the respondents said that they did not know the answer, rather than mentioning or selecting one of the specific responses listed in the survey.
Table 15 summarizes the extent of the “don't know” responses for each of the five sections of the question about potential roles for different community groups, demonstrating the apparent uncertainty and lack of awareness on the part of many respondents as to how the school, parents, students, and local leaders can take active roles in helping to ensure a healthy school. For example, in the case of Al
4. Results 27

Khadhrab and Al Ghoolah, the householders' most frequent response in this entire series of question was “don't know.”
The responses given by the householders who did offer some opinions on how the different groups can help to assure a healthy school show that, overall:
For the school − after the most frequently given answer of “don't know, given by 108 (46%) of the 231 respondents, the next response that there should be a “person designated to be in charge of cleaning the school” (32%), followed by the idea that the teachers should be encouraged to clean (27%). The options that the school should ensure that “there should be water” and “there should be toilets” came in fourth (12%) and 5th (7%), respectively. Only two respondents said the school should ensure facilities for handwashing (one in Thula, one in Hathan). Communities who had at least one respondent saying, “there should be toilets” were Al Dhabr and Thula (6 each); Mahla (3); and Al Saadiah (2).
The most frequently mentioned response by community to “How could the school play an active role in having a healthy school?” were:
Don't know – Al Ghoolah, Al Khadhrab, Al Saadiah, Al Sheem, Bait Al Bahr, and Hathan
A person in charge of cleaning the school – Al Zafen, Thula
The teachers should be encouraged to clean – Al Dhabr
There should be water, There should be toilets, or There should be facilities for handwashing – [no town’s most frequent responses]
For the parent, the most frequent answer overall for the 230 respondents was that parents should “teach their children to be clean” (43%), followed closely by the ubiquitous “don't know” response at 40%. The other responses, in order of frequency, were “teach their children not to throw waste” (26%), “shouldn't send sick children to school” (15%), “ask the school to properly clean their school” (4%), and then 3% or less of the respondents said parents should “teach their children to wash their hands,” “find out from school why is he/she sick,” and “teach their children to use the toilet.” The only three communities where any respondents chose the response “parents should teach their children to wash their hands” were Al Dhabr (3), Thula (3) and Al Ghoolah (1).
For the students, the householders currently see the student role as primarily keeping their school clean (as is apparently now the case), with 52% of the respondents choosing that option, and not throwing trash in the yard, at 41%. Other less frequently offered ideas on how students can play an active role, mentioned by 7% or less of the respondents, were to “ask the teacher to teach them personal hygiene,” “wash their hands,” “not go to school if they are sick” and “use the toilet.” Respondents to this question gave an average of 1.9 responses each (excluding the 74 “don’t knows”), showing a good supply of ideas on how the students can help to keep their schools clean. The only communities with any respondents saying that student roles could include handwashing were Al Dhabr (6), Thula (2), and Mahla and Hathan (one respondent each). Of the total of 16 respondents choosing the response “ask the teacher to teach them personal hygiene,” 10 were in Al Dhabr, as were eight of the nine responses for “students shouldn't go to school when they are sick.”
For the local council, “don't know” was by far the most frequently given response of the 226 respondents, at 79%. There were only two remaining responses available, “supervise the school to check if it is clean” (18%) and the least frequently chosen option, “build proper
28 Household Hygiene Improvement Survey in Yemen
schools with toilets and handwashing” (10%). The only communities to have any responses for the latter choice (schools with toilets and handwashing) were Al Dhabr (15 of 24 respondents), Hathan (five of 14 respondents), Thula (two of 20) and Al Sheem (one of 23) The only two communities that did not have “don't know” as their most frequent response were Al Dhabr (where 15 of 21 respondents chose “supervise the school to check if it is clean” and 15 also chose “build proper schools with toilets and handwashing”) and Thula (where 11 of 20 respondents chose “supervise the school to check if it is clean” and two chose “build schools with toilets and handwashing”).
For local leaders, “don't know” was again the most frequent response and was given by 57% of the 228 household respondents. Nearly three in 10 (28%) said that local leaders could “encourage the community to have a healthy school” and 14% said that local leaders could “have a Friday speech on healthy schools.” In only three communities – Mahla, Al Dhabr, and Bait Behr - more respondents answered “encourage the community to have a healthy school” than “don't know.” In Al Ghoolah, Al Khadhrab, and Hathan, 100% of the respondents stated that they didn't know the answer to this question. In Madaa, there were 83% “don't know” responses, in Al Hejra, 80%, in Al Saadiah, 78%, and in Thula, 75%.
4. Results 29


5. Summary of Main Points
5.1 Main survey results overall
This section highlights the main findings from the 12 Thula communities taken as a whole. The recommendations in the next section set out priority and targeted community-specific interventions that are based on these findings by individual community:
5.1.1 Findings pointing to poor water quality
Fully half of the 12 communities report a significant lack of access to sources of safer drinking water26, and also report the highest levels of water-related diseases and symptoms.
The only four communities where householders reported recent typhoid cases were among those where one-quarter or more reported obtaining water for drinking either from unprotected springs or from cisterns.
Nearly three out of 10 households with children under 5 reported that their child of this age had diarrhea in the last 24 hours. Over four of 10 of those families report diarrhea in an under-5 child within the past two weeks.27
Respondents report an array of recently occurring and potentially water-borne or water-related diseases in their area, specifically diarrhea, typhoid, giardia, skin diseases, and bilharzias.28
The main perceived cause of the named diseases was “drinking dirty water.”
Effective household water treatment methods are essentially non-existent. Less than one in five of the respondents practice any water treatment, and most of those householders cite water sieving only. Only three respondents boiled drinking water.
Three out of every four respondents do not have separate water storage containers for drinking water and for housecleaning water.
26 In this context, “safer sources” are sources other than the local cisterns and unprotected springs, i.e., protected springs, basin [water from a spring], tanker truck, water vendor, and water project. 27 The most recent Yemen Family Health Survey (2003 English translation) found that 22.4% of under 5s in rural areas had experienced diarrhea in the past two weeks. 28 Although these were anecdotal reports, it is worth noting that nearly all of the respondents (94%) said that the persons with the diseases named were treated at the health facility.
5. Summary of Main Points 31

5.1.2 Findings pointing to inadequate handwashing
Survey results suggest very low levels of handwashing, along with a basic lack of understanding of the importance of handwashing for adults, children, and for all who care for small children.
Less than a third of respondents report practicing handwashing when entering and going out of toilet facility; when using contaminated materials; before and after feeding an infant; before and after cleaning infant feces; and after dealing with animals.
Although six out of every 10 respondents reported using soap in handwashing, women actually used soap less than half of the time (43%).
Only about a third of the responding householders felt that handwashing prevents germs from entering the body.
Only one in three respondents felt that handwashing is important to stay healthy. Just one of 10 recognized the importance of handwashing in preventing germs from getting into food.
Of the minority of respondents who felt that diarrhea could be prevented, only one in four cited having children wash their hands before and after eating as a way to avoid diarrhea. Only one of seven said diarrhea could be avoided by children washing their hands after using the bathroom.
5.1.3 Findings pointing to inadequate community solid waste and sanitation measures
Nine out of every 10 respondents state that there is no specific area for gathering garbage outside the house.
Nearly half the respondents say the community as a whole does not get rid of the garbage in any way, and another quarter say that it gets rid of waste sometimes or rarely.
Only one person in the entire group of surveyed householders said that nothing more should be done to deal with garbage in their community, and four of every five felt that garbage is associated with the possibility of illness.
When asked about specific problems caused by garbage, flies were by far the most frequent answer.
A third of the respondents said that on the last occasion their under-5 child passed stools, they went in the house, yard, or outside of the premises.
When asked about disposal of child feces, a majority of respondents cited one of the following methods: disposal in their yard, in the garbage, outside the premises, or “did nothing, left it there.”
32 Household Hygiene Improvement Survey in Yemen

5.1.4 Findings pointing to poor conditions for healthy school environments
Half of the householders thought their local school was a healthy school, and the other half said it was not a healthy school or that they did not know.
Those who considered their school an unhealthy school most often cited no proper windows; dust; trash is not collected; and absence of toilets.
When asked what makes up a healthy school environment, the householders' most common answer was “don’t know.”
Only one out of every five respondents mentioned that water availability at the school is part of a healthy school environment.
In 11 of the 12 communities, no specific person (other than students), is responsible for cleaning the school.
Most respondents demonstrated a lack of awareness as to how the school, the local council, and local leaders can take active roles in helping to ensure a healthy school.
Householders who gave responses about the role of the school thought the school should designate someone to be in charge of cleaning the school, that teachers should be encouraged to clean; and that parents should teach their children to be clean.
Householders who gave responses about roles for the local council and local leaders most frequently chose the options of supervising the school for cleanliness and encouraging the community to have a healthy school.
5.1.5 Main points of survey results in individual communities
For a summary of selected findings by individual communities, please refer to Tables 16-18 and the following Recommendations section.
5. Summary of Main Points 33

6. Recommendations
The survey provides a wealth of information regarding the baseline knowledge, attitudes, and practices of the residents of Thula district with regard to hygiene and other environmental health-related issues. This baseline information is also valuable in providing input into the selection of communities in which the PHRplus Environmental Health (EH) pilot should implement its environmental health interventions. Resource constraints prevent the project from engaging in all types of interventions in all communities; therefore, we have used the survey results to target those communities most in need for each of four types of interventions: participatory hygiene promotion and training; cistern rehabilitation; solid waste management; and school-based hygiene and health promotion.
6.1 Hygiene promotion training to combat disease
The results described in the previous sections underscore that diarrheal disease is an important, frequent illness among young children in Thula district, with more than 40% of respondents indicating that children had diarrhea in the two weeks preceding the survey. The results also indicate a relatively low level of knowledge about the causes and routes of transmission of disease. The majority of survey respondents said either that diarrhea cannot be prevented or they did not know whether it could be prevented. For example, among those who could name ways to prevent diarrhea, only 13% responded that children should wash their hands after using the toilet. These results suggest that there is a substantial knowledge gap about the methods of transmission of diarrheal and other hygiene-related diseases, and about the critical hygiene practices (i.e., handwashing with soap) that are necessary to prevent disease.
Given this low level of knowledge, the communities in Thula district are likely to benefit substantially from a campaign of hygiene training and education. Table 19 displays which specific communities have relatively high levels of diarrheal disease as well as low levels of knowledge about diarrhea and measures to prevent it. Table 20 shows handwashing practices of each community, while Table 21 displays information about household water management and human waste management. As Table 19 shows, almost all communities lack knowledge about diarrheal disease prevention, and Table 20 shows that all communities have markedly poor handwashing practices, especially after using toilet facilities. Table 21 indicates that several communities also have poor household water and human waste management practices. When all of these hygiene-related issues are considered together, Al Ghoolah, Al Hejra, Al Khadhrab, Al Dhabr, Al Zafen, and Hathan emerge as high-priority communities, because they exhibit a number of high-risk characteristics: relatively high levels of disease, relatively low levels of knowledge, and poor handwashing practices. In addition, three of these communities, Al Ghoolah, Al Dhabr and Al Zafen also have poor household water management and human waste management. These six communities, but especially Al Ghoolah, Al Dhabr, and Al Zafen, should be considered high-priority candidates for hygiene promotion training.
6. Recommendations 35

Some other results from the survey may also inform the content of the hygiene training. For example, obtaining water is difficult and time-consuming: almost two-thirds of survey respondents fetch water more than four times per day, and 80 percent say each trip takes more than 20 minutes. The difficulty of obtaining water creates a barrier to having sufficient quantities of water in the household for hygiene purposes. Furthermore, the survey shows that household-level treatment of water is uncommon; thus, it may be difficult to gain acceptance of water boiling and other treatment measures. Methods and approaches for teaching the importance of hygiene and water management practices should take into account these potential barriers.
6.2 Water sources
The survey revealed that communities use a mix of water sources. Most communities reported (appropriately) reserving protected spring water, tanker water and other more protected sources for drinking water, and using cistern and unprotected sources for kitchen, bathroom and housecleaning water. However, notably, some of the “protected” drinking water sources are not available all year round, and communities rely on supplemental sources, notably cisterns, for additional water. Furthermore, several communities reported using cisterns and unprotected springs as their primary sources of drinking water. A majority of respondents among all communities rated cisterns as extremely important to their community because of their uses for drinking and cleaning. Given that some respondents reported that the cisterns are not covered, animals drink from the cisterns, and children and animals defecate near the cisterns, cisterns are very likely contaminated and unsuitable for drinking water. In fact, the Jaadan cistern in Thula was tested by the PHRplus team and found to have fecal coliform at levels “too numerous to count,” meaning it is highly contaminated with fecal matter. Most respondents recognized that cleaning the cisterns and possibly covering the cisterns would improve the quality of the cisterns.
These findings suggest that cistern rehabilitation, cleaning, and protection (as well as protection of currently unprotected springs) will benefit the health of several communities, especially where the cistern or unprotected springs serve as the primary source of drinking water either for the whole or part of the year, and where the cistern was judged by residents to be unsuitable for its current uses. Table 22 displays the communities that rely on cisterns or unprotected springs, and also indicates where the majority of the community believed its cistern is unsuitable for its uses. Al Zafen and Al Saadiah emerge as high-priority communities, given that these communities use the cistern for drinking water (either as a primary or secondary source) and the majority believed the cistern is not suitable for this purpose. Furthermore, Al Ghoolah, Al Khadhrab, and Hathan use unprotected springs, which are susceptible to contamination. Better management and protection of these springs (e.g., through solid, animal, and human waste management near the spring) could be incorporated as part of the hygiene promotion training suggested earlier.
6.3 Community hygiene
Community hygiene refers to the practices of the community as a whole in managing environmental health risks. For the purposes of this discussion, both community solid waste management and maintenance of a healthy school environment are included as community hygiene issues.
Table 23 summarizes the results of key questions of the survey regarding solid waste management and healthy schools.
36 Household Hygiene Improvement Survey in Yemen

6.3.1 Solid waste management
The rapid environmental assessment conducted in December 2004 revealed solid waste as a major issue in Thula district communities, and these rapid results are confirmed by the current survey. Nearly four in 10 respondents said that the community does not collect garbage, and an additional 25 percent indicated that garbage is collected sometimes or rarely. Eighty-five percent of respondents recognized garbage as a source of illness, although there were apparently some misperceptions about the role of garbage in disease transmission (e.g., some believed garbage contributes to bilharzia, while this disease is actually transmitted through snails that live in water bodies).
Given the limited ability of the PHRplus program to support the development of solid waste management programs, the focus of the intervention will be on source reduction and recycling. Notably, in the survey, only 1 percent of respondents overall mentioned recycling as a solid waste management option. These findings suggest that the introduction of pilot source reduction and recycling programs to selected communities will provide an entirely new perspective on solid waste management that will empower community members to realize they can dramatically affect the problem through their own actions.
Table 23 shows that in Al Ghoolah, Al Hejra, Al Khadhrab, Mahla, Al Saadiah, Bait Behr and Thula, residents report that the community rarely or never gets rid of garbage. These communities are high-priority candidates for potential solid waste management pilot programs.
6.3.2 Healthy schools
Respondents in the survey frequently reported that they did not believe that their school was a healthy environment for their children; they complain of lack of windows, dust, lack of solid waste management, and lack of toilet facilities. However, most also indicated that they did not know what constituted a healthy school environment. Further, as Table 23 shows, respondents in almost all communities frequently could not express how the parents, teachers, and local leaders could contribute to creating health school environment. These results indicate that these communities are ripe for environmental health interventions in the school environment, including improvements in the physical environment of the schools, as well as directing hygiene messages and practical experience at school children, who will then act to carry these same practices and messages to the home environment. A healthy school program can help the community understand the ways in which each of the stakeholders (teachers, parents, students, local government) can take part in creating a healthy school environment.
Table 23 shows that, in particular, respondents in Mahla, Al Saadiah, Al Zafen, Hathan, and Thula most frequently responded that their school was not healthy; of these, two communities, Al Saadiah and Hathan, also indicated that they did not know how the various stakeholders could contribute to a healthy school. These communities are the highest priority communities for a healthy school intervention.
6.4 Summary of recommended interventions
Table 24 summarizes the interventions recommended for high-priority communities, based on the results of the survey.
Among these communities, five (Al Ghoolah, Al Khadhrab, Al Saadiah, Al Zafen, and Hathan) are high-priority candidates for three interventions. In order to use resources most cost-effectively, it may be beneficial to concentrate activities in these five communities. Thula will also be
6. Recommendations 37

included in order to test methodologies for the interventions and develop district-level knowledge and capacity that can then be utilized to deliver environmental health assistance to other communities in the district. Rehabilitation of Thula’s cistern will also be part of these efforts, because the majority of respondents in Thula stated that their main drinking water source, the water project, is available for only part of the year, and that their main source of water for the other part of the year is a cistern.
38 Household Hygiene Improvement Survey in Yemen

Annex A: Maps
Figure 1. Five Yemen governorates targeted for USAID projects, with Amran
Annex A: Maps 39

Figure 2. Amran governorate, with Thula district
40 Household Hygiene Improvement Survey in Yemen
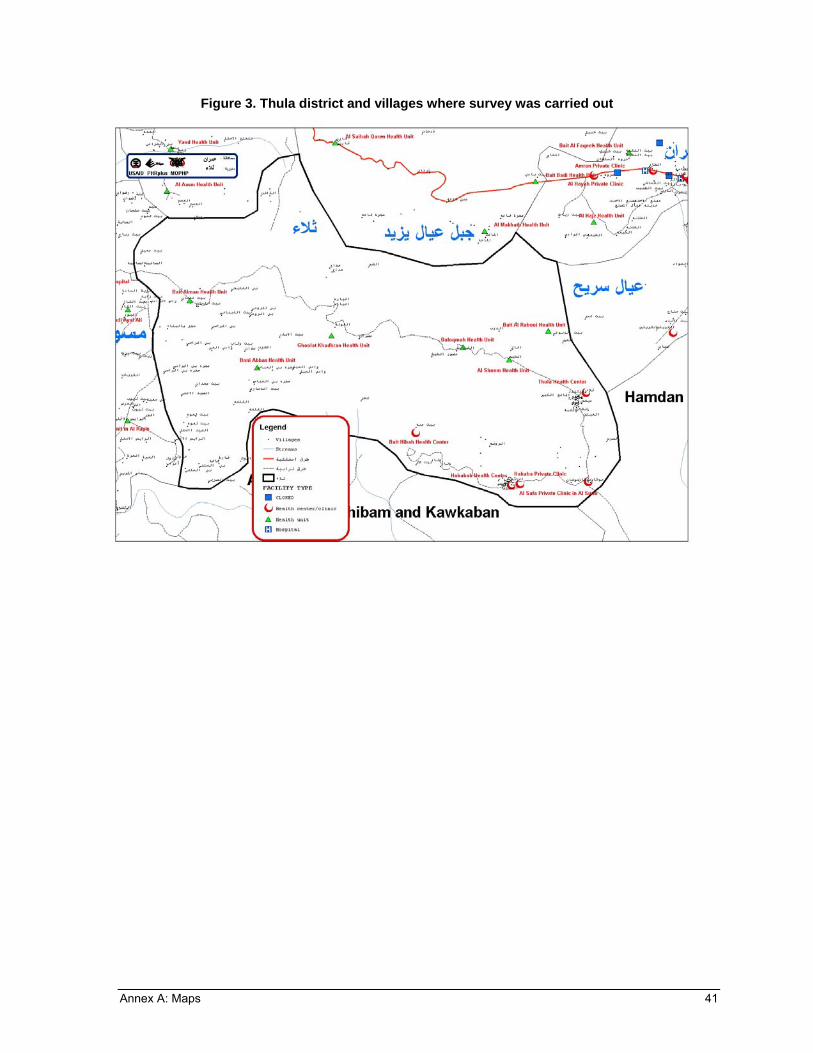
Figure 3. Thula district and villages where survey was carried out
Annex A: Maps 41


Annex B: Tables
Table 1. Thula district communities surveyed with populations and number and percentage of households surveyed
Community Total Population # of Households # of Households Surveyed % of Households surveyed
Al Dhabr 236 27 24 89%
Al Ghoolah 411 51 24 47%
Al Hejra 916 102 16 16%
Al Khadhrab 338 47 16 34%
Al Saadiah 702 108 24 22%
Al Sheem 712 70 26 37%
Al Zafen 1484 186 25 13%
Bait Behr 255 45 25 56%
Hathan 278 41 14 34%
Madaa 889 121 23 19%
Mahla 1219 131 27 21%
Thula 6728 813 25 3%
Total (THULA DISTRICT)
14168 40904
1742 5192
269 15%
Annex B: Tables 43

Table 2. Communities with number and percentage of householders reporting diarrhea in children under 5 years of age
Reports of diarrhea in under-5 year old children in households with children of this age group
Community
n Past 24 hours [H39] Past two weeks [H40]
Responses/Respondents* Percentage** Responses/ respondents
Percentage
Al Dhabr 24 9/17 53% 11/18 61%
Hathan 14 5/11 45% 6/12 50%
Al Zafen 25 10/23 43% 15/23 65%
Al Ghoolah 24 6/17 35% 10/17 59%
Al Khadhrab 16 5/15 33% 9/16 56%
Al Sheem 26 3/18 17% 7/18 39%
Mahla 27 2/16 13% 3/17 18%
Al Hejra 16 2/12 17% 5/14 33%
Al Saadiah 24 2/18 11% 3/19 16%
Bait Behr 25 2/14 14% 5/21 24%
Madaa 23 1/8 13% 5/8 63%
Thula 25 1/9 11% 1/9 11%
Totals 269 48/178 27% 80/192 42%
* These survey questions were asked only of respondents with children under five. ** Percentages in this table are calculated on the actual number of respondents to the question.
Table 3. Communities with respondent reports* of typhoid, giardia, bilharzia, and/or diarrhea in their area during the last two weeks before the survey [H21]
Community Name
Number of respondents
reporting: Typhoid
Number of respondents
reporting: Giardia
Number of respondents
reporting: Bilharzia
Number of respondents
reporting: Diarrhea
Al Zafen 2 2 0 20
Al Hejra 11 1 4 11
Al Sheem 0 0 0 10
Hathan 7 0 0 6
Thula 0 0 0 5
Al Khadhrab 5 0 0 4
Mahla 0 0 1 3 Note: Highest value in each column is in bold. * Respondents who have heard of that illness occurring in their area during the last 2 weeks. In the case of diarrhea, the table only lists communities where over three respondents mentioned diarrhea, all the others are listed if they were mentioned at least once. In Al Zafen, Hathan, and Al Khadhrab more than 30% of surveyed households also reported that a child under 5 in their household had experienced diarrhea in the past 24 hours [see Table 2].
44 Household Hygiene Improvement Survey in Yemen

Table 4. Communities with any reported use of cisterns for drinking water* with survey responses indicating morbidity in the village
A summary of selected information from householder reports of illness within communities where at least one source of drinking water is from cisterns.
Community N Drinking water is from cistern (M or S)** [H1]
Diseases caused because of cistern
water [C11]
Diseases*** heard of in the area in past 2
weeks
[H21]
Did your child have diarrhea in
the past 24 hours?
[H-39]
AL ZAFEN 25 96%
Diarrhea – 8, Got poisoned – 2, Bilharzias – 1, Malaria – 1 NA – 14
Diarrhea – 20, Typhoid – 2, Giardia – 2 NA – -2
Yes – 10 NA – 2
AL SHEEM 26 77%
Diarrhea – 2, Bilharzias – 1, Got poisoned – 2 NA – 22
Diarrhea – 10 NA – 2
Yes – 3 NA – 8
AL DHABR 24 100%
Diarrhea – 1, Respiratory disease – 4 NA – 19
- NA – 9
Yes – 9 NA – 7
AL GHOOLAH
24 21%
- NA – 24
- NA – 6
Yes – 6 NA – 7
AL SAADIAH 24 8%
Diarrhea – 1, Got poisoned – 2, Skin diseases – 1, Malaria – 1 NA – 20
Diarrhea – 2, Skin diseases – 1 NA – 5
Yes – 2 NA – 6
Notes: All communities had respondents that listed other, less frequently mentioned, sources of drinking water as follows [H1 and C1a]], as follows. This information is also summarized in Table 7. Al Zafen – 3 unprotected springs, 2 tanker truck, and 1 protected springs/ C1a [cisterns only] Al Sheem – 13 tanker truck, 1 no answer; C1a: 12 tanker truck, 1 no answer Al Dhabr – 23 protected springs; C1a: 22 protected springs, 1 no answer. Al Ghoolah – 20 unprotected springs, 4 basin, and 2 protected springs; C1a: 18 unprotected springs, 9 small water vendor, 2 protected springs, 1 basin Al Saadiah – 22 tanker truck, 16 basin, 7 pumps, 1 unprotected springs; C1a: 20 tanker truck, 11 basin, 8 pumps, 2 unprotected springs * As a main or secondary source according to question H1. Drinking water may also be obtained from other sources as well (see Table A for more information on other sources). ** M or S = Main or Secondary water sources were both requested. *** Diseases not listed here but may have been listed include flu and respiratory disease.
The five villages above account for 63% of the total number (48) of children in all 12 villages reported to have experienced diarrhea in the last 24 hours. NA – No Answer
Annex B: Tables 45

Table 5. Communities reporting unprotected springs for drinking water, with survey responses indicating morbidity
A summary of selected information about householder reports of illness in communities with at least one source of drinking water from unprotected springs*
Community N Drinking water from
unprotected springs**
[H-1]
Any cistern use?
Yes or No [C1a, H1]
Diseases*** heard of in the area in
past 2 weeks [H21]
Did your child have diarrhea in the past
24 hours? [H39]
AL KHADHRAB 16 100% NoDiarrhea – 4, Typhoid - 5, NA - 1
Yes – 5 NA – 1
HATHAN 14 100% No
Typhoid 7, Diarrhea 6, Bilharzias 4 NA – 1
Yes – 5 NA – 3
AL GHOOLAH 24 83% Yes 0 (18 - don't know) NA – 6
Yes – 6 NA – 7
AL HEJRA 16 25% No
Diarrhea 11, Typhoid 11, Giardia 1 NA - 0
Yes – 2 NA – 4
MADAA 23 13% No NA 16
Yes – 1 NA – 15
AL SAADIAH 24 4% Yes Diarrhea 2 NA 5
Yes – 2 NA – 6
Note: The above communities had respondents also listing other sources of drinking water, see list of towns by all reported sources of water in Table 7. Communities with only 1respondent mentioning unprotected springs for drinking water (Bait Al Bahr and Al Mahla) were not included in this Table. * Unprotected springs – natural springs without a protective fence or wall ** Main or secondary water sources were both requested. *** Diseases not listed here but may also have been mentioned include flu, respiratory disease, and malaria.
Although Al Khadhrab, in question C-16, has 8 of 14 respondents (with 2 NA) saying that the village relies on a cistern for "drinking and cleaning". NA = No answer Although Madaa, in question C-16, has 10 of 10 respondents (with 13 NA) saying that the village relies on a cistern for "drinking and cleaning".
46 Household Hygiene Improvement Survey in Yemen

Table 6. Communities by percentage of householders' beliefs about whether diarrhea can be prevented
Community Number of Households Surveyed*
Don't know if diarrhea can be prevented [H41]
(%)
No, diarrhea cannot be prevented [H41]
(%)
Yes, diarrhea can be prevented [H41]
(%)
Al Dhabr 24 8 79 13
Al Ghoolah 24 29 13 29
Al Hejra 16 25 19 56
Al Khadhrab 16 63 6 31
Al Saadiah 24 29 13 58
Al Sheem 26 27 0 62
Al Zafen 25 72 8 20
Bait Behr 25 24 36 28
Hathan 14 57 0 43
Madaa 23 26 9 4
Mahla 27 11 11 41
Thula 25 0 24 12
Total 269
Note: Bolded figures are the highest value in that column. * NR = No response. The percentages for each question do not add up to 100% in all cases, due to non-respondents. For this table, communities with more than 5 non-respondents were: Madaa (17), Thula (16), Mahla (10), and Al Ghoolah (7).
Annex B: Tables 47

Table 7. Communities with all* reported use of sources of water for drinking
Community
Protected springs
Cisterns Part-year cistern use** (for drinking neither specified
nor ruled out)
Unprotected springs
BASIN Tanker Truck (TT), water vendor (WV), water project (WP)
Al Dhabr √ √
AlGhoolah √ √ √ √ WV
Al Hejra √ √
AlKhadrab √ √
Al Saadiah √ √ √ TT***
Al Sheem √ TT
Al Zafen (√) √ √ TT
Bait Behr √ (√)
Hathan √ √
Madaa √ √ √
Mahla √ (√) (√)
Thula √ √ WP, TT
Total Key: √ - (a checkmark in bold) signifies the drinking water source most frequently cited by respondents – if a different source was most frequently citied in the two different sources of data for this table, two checkmarks are bolded. √ - (nonbolded checkmark) signifies 2 or more respondents cited this source (√) – (checkmark in parentheses) signifies cited by only one respondent TT, WV, WP – abbreviations for tanker truck, small water vendor, and water project, used in the last column * Data about reported drinking water sources from both questions H1 and C1a were reviewed. ** Part-year cistern use was identified when respondents said their main waster source was not available all year long; other water sources used then were named. *** Also pumps were mentioned in Al Saadiah.
48 Household Hygiene Improvement Survey in Yemen

Table 8. Communities with reported use of cisterns for drinking water Percentage* of total householders surveyed in each community reporting cisterns as a main or secondary drinking water source, with selected additional data on householder responses regarding the suitability and the cleaning of the cistern
Last time cistern was cleaned (C-4) Community N Drinking water
brought from cistern (C-1a)
Drinking water is from cistern
[M or S]** (H-1)
Rely totally on cistern for
drinking and cleaning
(C-16)
Cistern is suitable for all its uses
(C-13) DK*** NA*** >6 mos
AL ZAFEN 25 96% 96% 96% 0% 40% 44% 16%
AL SHEEM 26 62% 77% 85% 70% 4% 12% 85%
AL DHABR 24 46% 100% 100% 100% 0 4% 96% (all>1yr)
AL GHOOLAH 24 29% 21% 92% 67% 13% 58% 8%
AL SAADIAH 24 13% 8% 42% 17% 0 0 63% Note: All the above communities had respondents that also listed other sources of drinking water. See Table 7 for complete list of water sources for each * Percentages for this table are calculated using the ‘N' for the community as the denominator. ** M or S = Main or Secondary water sources were both requested. This table does not include Thula, where 24 respondents cited part-year use of cisterns as a "main" water source, however, no Thula respondent cited the use of cisterns specifically for drinking water, either as main or secondary source. Whether or not cistern water is used in Thula for drinking is unclear from the data. *** DK = Don't know; NA = No Answer
Al Saadiah was the only town in addition to Thula where more >1 respondent said they used their main water source part of the year and that an alternative source was cisterns during the time their main source was unavailable. However in Thula, there were 0 respondents who reported that they used cistern water for drinking, and 0 responses saying that village relies on the cistern "for drinking and cleaning", whereas in Al Saadiah, a proportion of respondents (from 8 to 13% as above) reported its use of cisterns for drinking water, and 42% said their village relies on the cistern for "drinking and cleaning". Two towns had 5 or less respondents reporting part-year loss of their main water supply, Al Thafin where the 5 alternative sources were: unprotected springs (3) or tanker truck (2), and Al Dhabr where the alternative source was cisterns (1).
Annex B: Tables 49

Table 9. Selected solid waste disposal responses, by community
For the towns without a majority of yes responses, # of respondents saying what
should be done with garbage [Q10]*
Community
Number of Households
Surveyed
>50% of those surveyed saying
yes, the community gets rid of garbage
[Q5] Garbage should be gathered &
burned
Designate a fenced place for garbage
Don't know what should be
done
Al Dhabr 24 Yes (92%) - - -
Al Ghoolah 24 No 6 9 10
Al Hejra 16 No 9 7 4
Al Khadhrab 16 No 8 3 7
Al Saadiah 24 No 9 7 9
Al Sheem 26 Yes (62%) - - -
Al Zafen 25 Yes (52%) - - -
Bait Behr 25 No 16 0 7
Hathan 14 No 8 3 6
Madaa 23 Yes (57%) - - -
Mahla 27 No 3 19 2
Thula 25 No 21 10 0
Total 269
* Other responses available in the interview questionnaire included "gather in a plastic bag and tie it" (10 responses in all 12 communities); "recycle the garbage" (2 responses in total); and "nothing" (1 response total). Total non-respondents for this question, of the 269 householders in the survey =21.
50 Household Hygiene Improvement Survey in Yemen

Table 10. Communities by summary information about toilet facilities in or near the households
Community
Number of Households
Surveyed
Percentage of those surveyed with no toilet facility in or
near the house [H25]
Percentage of those surveyed with traditional
toilet facility [H26]
Communities with less than
10% flush toilets [H26]
Percentage of respondents* with >11 people using the facilities [H29]
Al Dhabr 24 17 46 - 45
Al Ghoolah 24 42 50 Yes 15
Al Hejra 16 19 44 - 15
Al Khadhrab 16 19 75 Yes 15
Al Saadiah 24 4 88 Yes 22
Al Sheem 26 0 50 - 32
Al Zafen 25 8 36 - 18
Bait Behr 25 20 52 - 17
Hathan 14 43 57 Yes 0
Madaa 23 30 61 Yes 36
Mahla 27 4 74 - 9
Thula 25 0 68 - 21
Total 269 16% 58% 22%
Note: Bolded numbers are the highest two values in that column.
* In this calculation, actual respondents were used, that is, the denominator did not include the non-respondents (non-response rate to this question was 19%).
Table 11. Selected child feces disposal practices by community [H38]
Community
Number of households
surveyed
Number disposing "outside the premises"
Number disposing "somewhere in
yard"
Number disposing "into
garbage"
Number saying did "nothing, left
it there"
Al Dhabr 24 13 2 0 0
Al Ghoolah 24 2 4 1 0
Al Hejra 16 0 0 2 0
Al Khadhrab 16 0 3 4 0
Al Saadiah 24 8 8 1 0
Al Sheem 26 0 2 0 0
Al Zafen 25 14 0 1 4
Bait Behr 25 5 1 0 0
Hathan 14 1 1 3 0
Madaa 23 2 5 1 0
Mahla 27 2 1 1 4
Thula 25 1 0 0 0
Total 269 48 27 14 8
Annex B: Tables 51

Table 12. Communities by selected handwashing practices
Community
Number of Households
Surveyed
WHEN wash hands = > 3 answers per
respondent re HW* practices [H31]**
Percentage*** of respondents reporting the use of soap in HW
[H32]
NR rate=3%
Percent of observations in which
soap was used for HW [H34]
NR rate =8%
Al Dhabr 24 Yes 71% 100%
Al Ghoolah 24 No 50% 4%
Al Hejra 16 No 81% 54%
Al Khadhrab 16 No 44% 38%
Al Saadiah 24 Yes 75% 67%
Al Sheem 26 No 40% 11%
Al Zafen 25 Yes 68% 44%
Bait Behr 25 Yes 67% 55%
Hathan 14 No 38% 29%
Madaa 23 Yes 48% 10%
Mahla 27 Yes 38% 50%
Thula 25 Yes 88% 33%
Total
269 7 of 12 communities w/ average of > 3 examples per respondent of when wash hands
60% reported washing hands with soap
43% used soap for handwashing when observed
Note: Bolded figures are the highest values in that column, and all "yes" entries are bolded. * HW=handwashing ** In question 31, a series of 8 possible times for handwashing were listed (such as praying, before and after eating, before and after cooking, after dealing with animals, before and after cleaning infant feces, etc), and each response for that practice was coded. *** Percentages in this table were calculated on the number of respondents to the question.
NR- Non-response In the middle column, those communities where respondents offered over three examples of times when they wash hands during the day
[H31] are marked with a "yes" entry
52 Household Hygiene Improvement Survey in Yemen
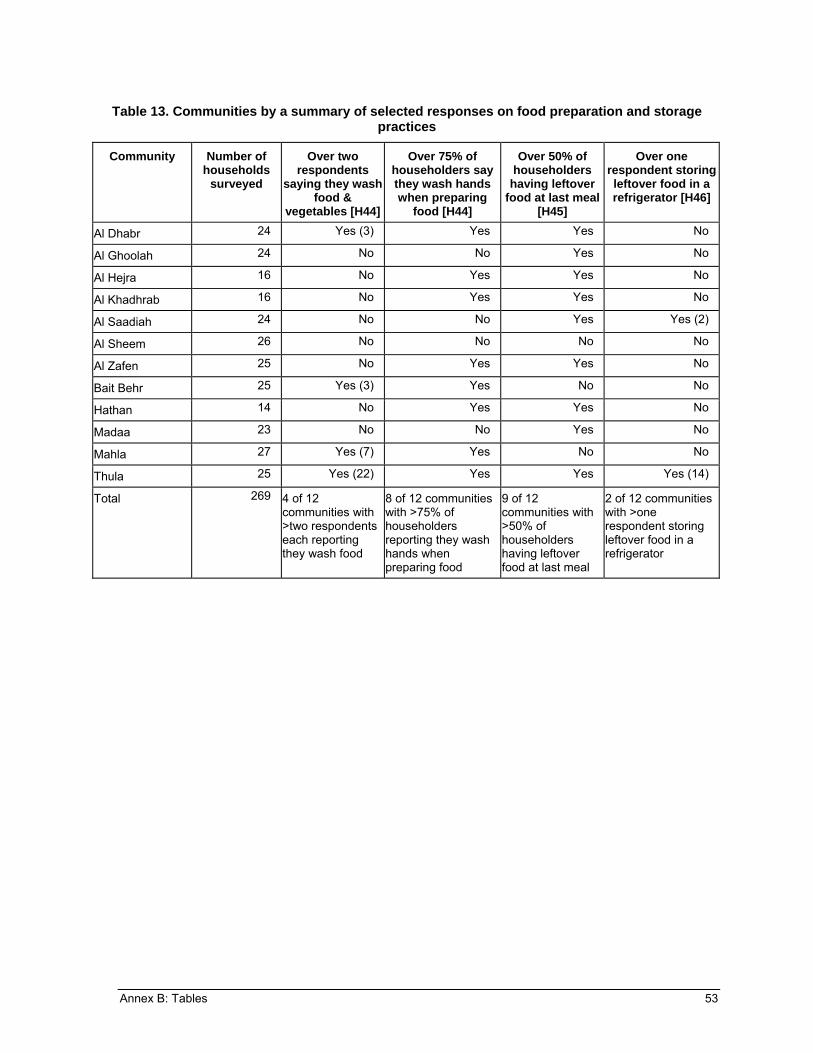
Table 13. Communities by a summary of selected responses on food preparation and storage practices
Community Number of households
surveyed
Over two respondents
saying they wash food &
vegetables [H44]
Over 75% of householders say they wash hands when preparing
food [H44]
Over 50% of householders
having leftover food at last meal
[H45]
Over one respondent storing leftover food in a refrigerator [H46]
Al Dhabr 24 Yes (3) Yes Yes No
Al Ghoolah 24 No No Yes No
Al Hejra 16 No Yes Yes No
Al Khadhrab 16 No Yes Yes No
Al Saadiah 24 No No Yes Yes (2)
Al Sheem 26 No No No No
Al Zafen 25 No Yes Yes No
Bait Behr 25 Yes (3) Yes No No
Hathan 14 No Yes Yes No
Madaa 23 No No Yes No
Mahla 27 Yes (7) Yes No No
Thula 25 Yes (22) Yes Yes Yes (14)
Total
269 4 of 12 communities with >two respondents each reporting they wash food
8 of 12 communities with >75% of householders reporting they wash hands when preparing food
9 of 12 communities with >50% of householders having leftover food at last meal
2 of 12 communities with >one respondent storing leftover food in a refrigerator
Annex B: Tables 53

Table 14. Communities by a summary of selected responses relating to healthy schools
Community Number of households
surveyed
Most frequent answer to "is your
child's school a healthy school?"
[HS4]
Most frequent response(s) as to why local school
is not healthy* [HS6]
Number of respondents saying local school not
healthy due to no water [HS6]
Number of respondents stating that a
healthy school should have water [HS5]
Al Dhabr 24 Yes NPW, NT** 2 19
Al Ghoolah 24 Yes NPW, DK 1 3
Al Hejra 16 Yes NPW, DIC, NT, NHW
0 6
Al Khadhrab 16 Yes DIC, NT, NW 1 1
Al Saadiah 24 No NPW 1 1
Al Sheem 26 Yes [100% NR] 0 1
Al Zafen 25 No NPW 3 0
Bait Behr 25 Yes NPW 1 3
Hathan 14 No NT 3 6
Madaa 23 Yes [100% NR] [100%NR] 1
Mahla 27 No NPW 1 0
Thula 25 No NPW 0 0
Total
269 7 Yes, 5 No (See below) 13 41
* Abbreviations for the most frequent response: NPW – No proper windows DIC – Dust in class NT – No toilets NW – No water NHW – No handwashing DK – Don't Know ** If a tie, all items with equal numbers of responses are included
54 Household Hygiene Improvement Survey in Yemen

Table 15. Communities by a summary of responses expressing uncertainty as how different groups can play an "active role in having a healthy school" [HS10]
Most frequent response was "Don't Know" to the question of how the following group can play an active role in having a healthy school:
Local:
Community Number of households
surveyed School Parents Students
Council Leaders
Al Dhabr 24 No No No No No
Al Ghoolah 24 Yes Yes Yes Yes Yes
Al Hejra 16 Yes* Yes No Yes Yes
Al Khadhrab 16 Yes Yes Yes Yes Yes
Al Saadiah 24 No Yes Yes Yes Yes
Al Sheem 26 Yes Yes No Yes Yes
Al Zafen 25 No No No Yes Yes
Bait Behr 25 Yes Yes No Yes No
Hathan 14 No Yes Yes Yes Yes
Madaa 23 Yes No No Yes Yes
Mahla 27 No No No Yes No
Thula 25 No No No No Yes
Total
269 6 with majority of don't know (DK) responses
7 with majority DK responses
4 with majority DK responses
Council: 10 w/ majority DK's; Leaders: 9
Note: "Yes" responses bolded * Tied as most frequent response, with having "person in charge of cleaning the school" as a role for the school.
Annex B: Tables 55
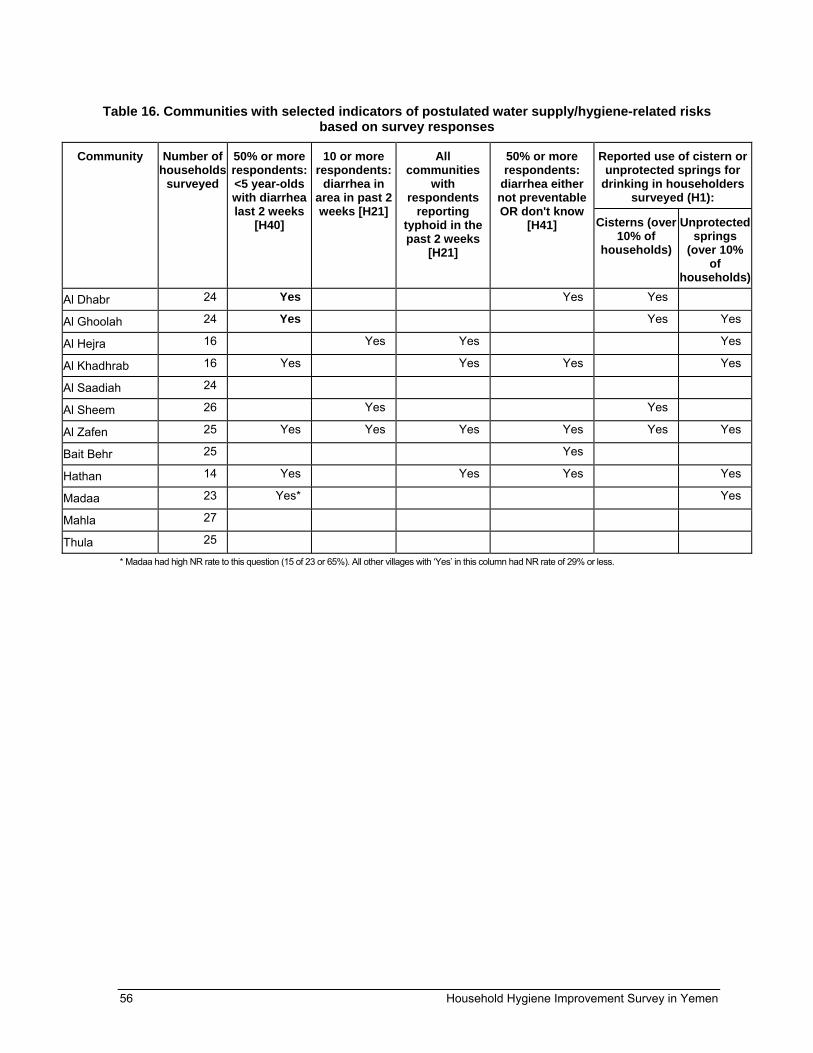
Table 16. Communities with selected indicators of postulated water supply/hygiene-related risks based on survey responses
Reported use of cistern or unprotected springs for
drinking in householders surveyed (H1):
Community
Number of households
surveyed
50% or more respondents: <5 year-olds with diarrhea last 2 weeks
[H40]
10 or more respondents:
diarrhea in area in past 2 weeks [H21]
All communities
with respondents
reporting typhoid in the past 2 weeks
[H21]
50% or more respondents:
diarrhea either not preventable OR don't know
[H41] Cisterns (over 10% of
households)
Unprotected springs
(over 10% of
households)
Al Dhabr 24 Yes Yes Yes
Al Ghoolah 24 Yes Yes Yes
Al Hejra 16 Yes Yes Yes
Al Khadhrab 16 Yes Yes Yes Yes
Al Saadiah 24
Al Sheem 26 Yes Yes
Al Zafen 25 Yes Yes Yes Yes Yes Yes
Bait Behr 25 Yes
Hathan 14 Yes Yes Yes Yes
Madaa 23 Yes* Yes
Mahla 27
Thula 25
* Madaa had high NR rate to this question (15 of 23 or 65%). All other villages with ‘Yes’ in this column had NR rate of 29% or less.
56 Household Hygiene Improvement Survey in Yemen

Table 17. Communities with selected indicators of levels of householder baseline knowledge/practices related to health and hygiene, based on survey responses (Part I of II)
Community Number of households
surveyed
50% or more respondents
say that diarrhea can
be prevented
[H41]
More than two respondents list children's handwashing*
as a way to avoid
diarrhea [H42]
More than two
respondents say
handwashing prevents
germs from getting into food [H36]
> 75% of respondents
report washing
hands when preparing food [H44]
Ten or more respondents
say handwashing is important for personal
hygiene [H36]
Five or more respondents
say handwashing is important
to stay healthy [H36]
% respondents observed to use soap for handwashing
is 50% or more [H34]
Al Dhabr 24 Yes Yes Yes Yes
Al Ghoolah 24 Yes
Al Hejra 16 Yes Yes Yes Yes Yes Yes Yes
Al Khadhrab
16 Yes Yes Yes
Al Saadiah 24 Yes Yes Yes Yes
Al Sheem 26 Yes Yes
Al Zafen 25 Yes Yes Yes
Bait Behr 25 Yes Yes Yes
Hathan 14 Yes Yes
Madaa 23 Yes
Mahla 27 Yes Yes Yes Yes Yes
Thula 25 Yes Yes
* Either citing "children wash their hands before and after eating" or "wash their hands after using bathroom" as a way to avoid diarrhea, or citing both
Annex B: Tables 57

Table 18. Communities with selected indicators of levels of householder baseline knowledge/practices related to health and hygiene, based on survey responses (Part II of II)
Healthy School Environment
[HS5]
Community Number of households
surveyed
Total # of listed ways
for avoiding
diarrhea is more than
survey average of 1.4 [H42]
Five or more respondentslist 'having
children avoid
drinking dirty water' as a way to
prevent diarrhea
[H42]
Five or more respondents say water is
made unusable
when "children
and animals defecate
next to the water" [C9]
Five or more respondents
have two separate
containers to store a) drinking
water and b) cleaning
water [H11]
Five or more respondents
say that "garbage
brings germs" [SW9] *
# of ideas on healthy school envt is
>average of 2.3 each
>5 respts
say HSEnvt
= having toilets,
or water
Al Dhabr 24 Yes Yes Yes
Al Ghoolah 24 Yes Yes
Al Hejra 16 Yes Yes Yes Yes
Al Khadhrab 16 Yes
Al Saadiah 24 Yes Yes Yes
Al Sheem 26 Yes Yes
Al Zafen 25 Yes Yes Yes Yes
Bait Behr 25 Yes Yes
Hathan 14 Yes Yes Yes
Madaa 23 Yes
Mahla 27 Yes Yes Yes
Thula 25 Yes Yes Yes Yes
* Much higher numbers of respondents (75% and more) cite the problem of flies as a problem caused by garbage.
58 Household Hygiene Improvement Survey in Yemen
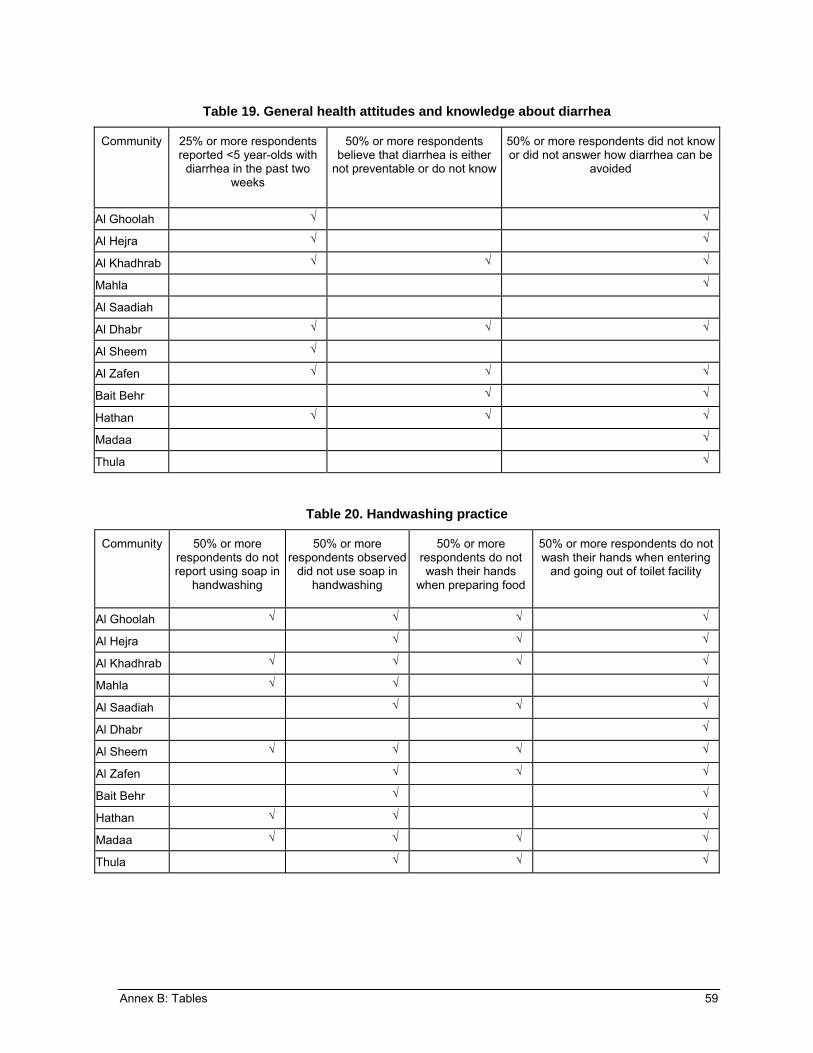
Table 19. General health attitudes and knowledge about diarrhea
Community 25% or more respondents reported <5 year-olds with
diarrhea in the past two weeks
50% or more respondents believe that diarrhea is either
not preventable or do not know
50% or more respondents did not know or did not answer how diarrhea can be
avoided
Al Ghoolah √ √
Al Hejra √ √
Al Khadhrab √ √ √
Mahla √
Al Saadiah
Al Dhabr √ √ √
Al Sheem √
Al Zafen √ √ √
Bait Behr √ √
Hathan √ √ √
Madaa √
Thula √
Table 20. Handwashing practice
Community 50% or more respondents do not report using soap in
handwashing
50% or more respondents observed
did not use soap in handwashing
50% or more respondents do not wash their hands
when preparing food
50% or more respondents do not wash their hands when entering
and going out of toilet facility
Al Ghoolah √ √ √ √
Al Hejra √ √ √
Al Khadhrab √ √ √ √
Mahla √ √ √
Al Saadiah √ √ √
Al Dhabr √
Al Sheem √ √ √ √
Al Zafen √ √ √
Bait Behr √ √
Hathan √ √ √
Madaa √ √ √ √
Thula √ √ √
Annex B: Tables 59

Table 21. Other hygiene/sanitation practices
Drinking Water Human Waste Community
50% or more respondents do not
use different containers for
storing, drinking & cleaning water
No drinking-water
treatment
33% or more respondents do not have a toilet facility in or near
the house
50% or more respondents dispose of child feces “outside the premises,” “somewhere in
yard,” “into garbage,” or “nothing, left it there”
Al Ghoolah √ √ √
Al Hejra √
Al Khadhrab √
Mahla √
Al Saadiah √ √
Al Dhabr √ √
Al Sheem √
Al Zafen √ √
Bait Behr √ √
Hathan √ √
Madaa √
Thula √ √
Table 22. Sources and perceived cleanliness of drinking water
Cisterns Unprotected springs Community
50% or more use as primary source of drinking water
50% or more use as secondary
source of water
50% or more believe cistern is not suitable for all
its uses
50% or more use as primary source of drinking water
Al Ghoolah √
Al Hejra √
Al Khadhrab √ √
Mahla
Al Saadiah √ √
Al Dhabr
Al Sheem √
Al Zafen √ √
Bait Behr √
Hathan √ √
Madaa
Thula √
60 Household Hygiene Improvement Survey in Yemen

Table 23. Community hygiene practices
Solid Waste Schools
Most frequent response = do not know how the following groups could play an active role in having a healthy school
Local:
Community
50% or more respondents
reported that the community rarely or never gets rid
of garbage
Most frequent
response = school is not
healthy School Parents Students
Council Leaders
Al Ghoolah √ √ √ √ √ √
Al Hejra √ √ √ √ √
Al Khadhrab √ √ √ √ √ √
Mahla √ √ √
Al Saadiah √ √ √ √ √ √
Al Dhabr
Al Sheem √ √ √ √
Al Zafen √ √ √
Bait Behr √ √ √ √
Hathan √ √ √ √ √
Madaa √ √ √
Thula √ √ √
Table 24. Summary of recommended interventions
Community Hygiene promotion Cistern rehabilitation/ unprotected spring management
Solid waste management/ recycling
Healthy schools
Al Ghoolah √ √ √
Al Hejra √ √
Al Khadhrab √ √ √
Mahla √ √
Al Saadiah √* √ √
Al Dhabr √
Al Zafen √ √* √
Bait Behr √
Hathan √ √ √
Thula * √ √
*=candidate for cistern rehabilitation
Annex B: Tables 61


Annex C. Survey Questionnaire
Baseline Survey for Thula Pilot
The USAID-funded Partners for Health Reformplus Project (PHRplus) is implementing an activity to address basic health needs in this district, including household water supply and sanitation. Through consultation with the Governorate Health Office, District Health Office, and the local council we are conducting a survey of households in the villages of Al Dhabr, Al Ghoolah, Al Hejra, Al Khadrab, Al Saddiah, Al Sheem, Al Zafen, Bait Behr, Hathan, Madaa, Mahla, and Thula.. The purpose of the survey is to understand the knowledge and practices of households in these villages in relation to water, sanitation and hygiene in order to identify their needs for improved health through better hygiene and health education.
The questions asked of participating households will focus on the following information:
1. Information of the household and the people living here 2. The current situation of the water supply and sanitation 3. The current situation of schools 4. Knowledge and practices concerning hygiene 5. Other health care and household practices
Because time is limited, not all households in the selected villages will be included in the survey.
A computer analysis will be conducted from the information collected in this survey. Names of participants will not be included in the analysis or report, nor will information about a person’s household be shared with anyone else. Participation is voluntary. If for any reason you do not wish to participate, you can choose not to, and you can object to answering any specific question or questions in the questionnaire. There are no disadvantages to deciding not to participate or not to answer certain questions. However, your cooperation is greatly appreciated.
The entire interview will take approximately 45 minutes and involve several members of your household. Do you agree to participate?
Yes____________________________________ No ____________________________
Interviewer, if the household refuses to participate, or if the survey cannot be done at the present time for other reasons, fill out the following page to the extent possible and select another household.
Annex C. Survey Questionnaire 63

Governorate_________________
District_____________________
Sub District _________________
Village _____________________
Household ID_____________________
Interviewer ID____________________
Number of visit
1 2 Date HH ID Interviewer ID
Name of Head of Household _____________________
Age _______________ Social Status______________
Gender of head of household M F (circle one)
Profession of head of household _______________________
Level of education Illiterate
Primary incomplete
Primary Completed
Secondary incomplete
Secondary completed
College incomplete
College completed
Don’t know__________
Can the head of household read, write or both
Can Read
Can write
Both
Number of people in the house_________________
Number of children of age 0-5 __________
64 Household Hygiene Improvement Survey in Yemen

Number Name (initials
only) Gender Age
Relation with the caretaker to this
person 1 2 3 4 5 6 7 8 9 10 11 12 13 14 15
REMEMBER! DETACH THESE PAGES FROM INTERVIEW FORM AFTER COMPLETION OF INTERVIEW!
Annex C. Survey Questionnaire 65
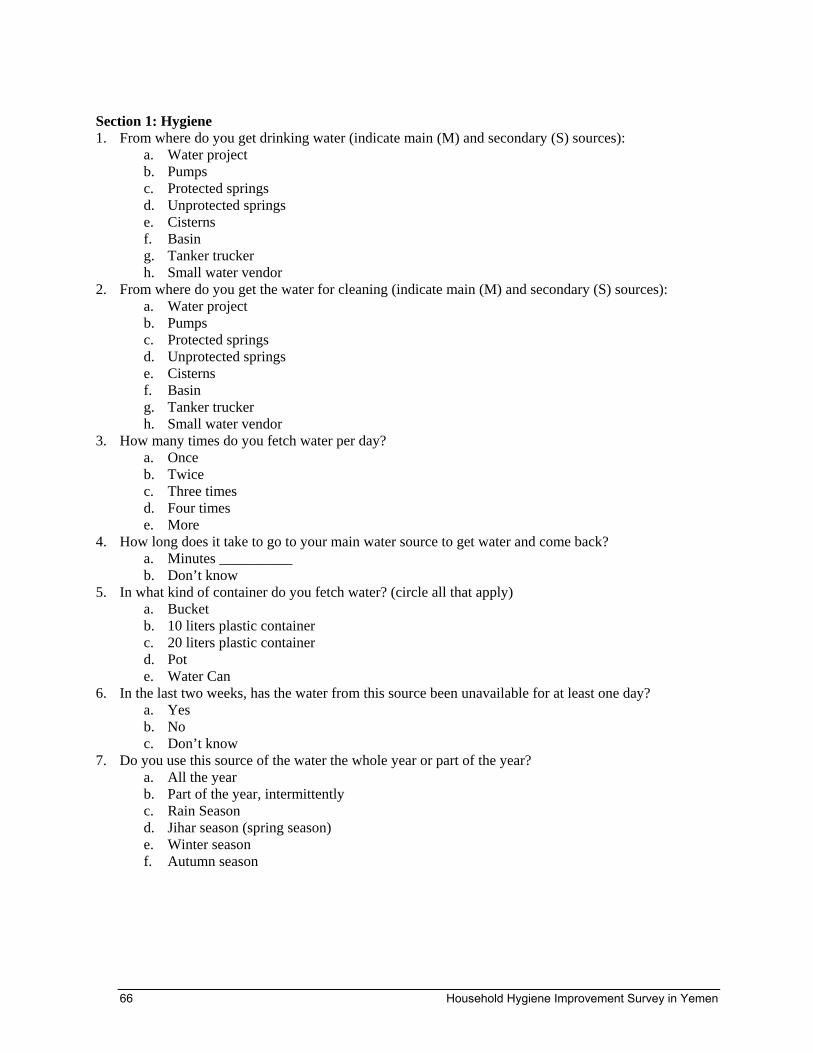
Section 1: Hygiene 1. From where do you get drinking water (indicate main (M) and secondary (S) sources):
a. Water project b. Pumps c. Protected springs d. Unprotected springs e. Cisterns f. Basin g. Tanker trucker h. Small water vendor
2. From where do you get the water for cleaning (indicate main (M) and secondary (S) sources): a. Water project b. Pumps c. Protected springs d. Unprotected springs e. Cisterns f. Basin g. Tanker trucker h. Small water vendor
3. How many times do you fetch water per day? a. Once b. Twice c. Three times d. Four times e. More
4. How long does it take to go to your main water source to get water and come back? a. Minutes __________ b. Don’t know
5. In what kind of container do you fetch water? (circle all that apply) a. Bucket b. 10 liters plastic container c. 20 liters plastic container d. Pot e. Water Can
6. In the last two weeks, has the water from this source been unavailable for at least one day? a. Yes b. No c. Don’t know
7. Do you use this source of the water the whole year or part of the year? a. All the year b. Part of the year, intermittently c. Rain Season d. Jihar season (spring season) e. Winter season f. Autumn season
66 Household Hygiene Improvement Survey in Yemen

8. If part of the year, during the other part of the year what is your main water source?
a. Water project b. Pumps c. Protected springs d. Unprotected springs e. Cisterns f. Basin g. Tanker trucker h. Small water vendor
9. Do you store the water at home? a. Yes b. No
10. How many water storage containers do you have in the house? a. One b. Two c. Three d. Four e. More
11. Are there different containers for storing drinking water and cleaning water? a. Yes b. No
12. How do you get water from the container? a. Bare hand b. With a bucket c. From a tap d. Water pump e. Ladler (Small water buckets)
13. If yes, may I see them later on after we finish the interview? a. Yes b. No
If yes turn to the Observation Page to observe the containers 14. What type of containers do you have?
a. Tapped container b. Piped container c. Barrel d. Narrowed cap
15. Are water containers cleaned? a. Yes b. No
16. When did you last clean the containers? a. Today b. Yesterday c. Last week d. Before two weeks e. More than a month f. Don’t remember
17. Do you treat drinking water? a. yes b. no
Annex C. Survey Questionnaire 67
18. If yes, how do you typically treat your drinking water?
a. Boil b. Add bleach/chlorine c. Sieve through cloth d. Water filter (ceramic, sand, composite) e. Solar disinfection f. Sedimentation g. Don’t know
19. When was the last time you treated your water: a. Today b. Yesterday c. In a week d. In two weeks e. A month f. Don’t remember
20. Have you heard of any one who was sick because of drinking from the water in the last two weeks? a. Yes b. No c. I don’t know
21. What kind of diseases have you heard of occurring in your area in the last two weeks? i. bilharzias
ii. malaria iii. diarrhea iv. respiratory diseases v. skin diseases
vi. typhoid vii. giardia
viii. flu ix. don’t know
22. In your opinion, what are the causes of these diseases? (circle all that are mentioned) a. Drinking dirty water b. Eating not properly washed food c. Eating with dirty hand d. Playing in areas filled of waste and feces e. Playing in dirty cisterns f. Not washing their hand before eating g. Not washing hand after going out of bathroom h. Not washing hand after dealing with animals i. Don’t know
23. Do you know how the diseases were treated? a. Yes b. No
24. If yes, how were they treated? a. At health facility b. Traditional health treatment c. Not treated d. Don’t know
25. Is there a toilet facility in or near the household? a. Yes b. No
68 Household Hygiene Improvement Survey in Yemen

26. What kind of toilet facility in the household? a. Flush toilets b. Traditional bathroom
27. What kind of sewage system connected to the bathroom? a. flush to piped sewer system b. flush to septic system c. dry latrine d. latrine (where excreta are manually removed)
28. How many toilet facilities are there in the household? a. 0 b. 1 c. 2 d. 3 e. 4 f. more
29. How many members in the households use these facilities a. ___________
30. In your household, where do you wash your hands? (circle all that are mentioned) a. in or near toilet facility b. in or near the kitchen c. elsewhere in premises d. outside premises e. no specific place
31. When do you wash your hands? (circle all that are mentioned) a. when entering and going out of toilet facility b. before and after cleaning infant feces c. before and after feeding an infant d. after dealing with animals e. before and after cooking f. praying g. before and after eating h. when using contaminated materials
32. Today, when you washed your hands, did you use soap? a. yes b. no
33. Can you show me how you wash your hands? a. yes b. no
34. for the observe, notice: a. rubbing hands b. using soap c. using toile
35. Can you show me the place that you wash your hands after we finish the questionnaires? a. Yes b. No
36. Why is important to wash hands? (circle all that are mentioned) a. prevents germs from getting into the body b. prevents germs from getting into food c. to stay healthy d. personal hygiene e. Don’t know
Annex C. Survey Questionnaire 69

QUESTIONS 36-39 SHOULD BE ASKED ABOUT EACH CHILD UNDER 5 37. The last time your child passed stool, where did he/she defecate?
a. used potty b. used washable diapers c. used disposable diapers d. went in house /yard e. went outside the premises f. don’t know
38. The last time your child passed stools, where were the feces disposed of? a. dropped in toilet facility b. washed away water discarded into water facility c. washed away into sink or tub d. into garbage e. some where in the yard f. outside premises g. buried h. did nothing left it there i. don’t know
39. Did your child have diarrhea in the last 24 hours? a. yes b. no c. don’t know
40. Did your child have diarrhea in the last two weeks? a. yes b. no c. don’t know
41. Do you think diarrhea can be prevented? a. yes b. no c. don’t know
42. If yes, how do you think diarrhea can be avoided? a. To have children not drink dirty water. b. To keep him/her away from sick children c. To have the children wash their hands before and after eating d. To have the children wash their hands after using bathroom e. Don’t know
43. When was the last time you prepared food? a. yesterday b. this morning c. noon d. today
44. What are the steps you followed when preparing food? (Circle all that are mentioned) a. washed food especially vegetables b. washed dishes and utensils c. washed hands
45. Was there any left over food from the last meal you cooked? a. yes b. no
70 Household Hygiene Improvement Survey in Yemen

46. If yes, how did you store it?
a. In the oven b. In the stone oven (that bread is baked in) c. In the fridge. d. Coopered e. Table/ Shelf f. Don’t know
47. Can you show me where you keep your food, after finishing from the survey? a. yes b. no
48. When was the last time you bathed? a. one day to one week ago b. one week to ten days ago c. more than ten days ago
49. Where do you bathe? a. In bathroom b. Cisterns c. In public bathroom d. In the mosque
50. How do you bathe? a. using shampoo soap or detergent b. only water c. pour water on the head three times d. rub the body
51. Do you clean your teeth? a. Yes b. No
52. When the last time you cleaned your teeth? a. last night b. this morning c. two days ago
53. With what do you clean your teeth? a. Ash b. coal c. Traditional brush d. Tooth brush with paste
54. In your opinion, does personal hygiene have role in being healthy? a. Yes b. No c. Don’t know
55. In your opinion, does indoor kitchen (smoky kitchen) affect women? a. Yes b. No
Annex C. Survey Questionnaire 71

56. If yes, how does it affect women? (circle all that are mentioned)
a. Coughing b. Eye vision problems c. Lung problems d. Blood problem e. Heart problem f. Headaches g. Skin Problems h. Tears
72 Household Hygiene Improvement Survey in Yemen

Cisterns 1. From where do you bring water for:
a. Drinking i. Water project
ii. Pumps iii. protected springs iv. unprotected springs v. Cisterns
vi. basin vii. tanker trucker
viii. small water vendor
b. Bathroom i. Water project
ii. Pumps iii. protected springs iv. unprotected springs v. Cisterns
vi. basin vii. tanker trucker
viii. small water vendor
c. Kitchen i. Water project
ii. Pumps iii. protected springs iv. unprotected springs v. Cisterns
vi. basin vii. tanker trucker
viii. small water vendor d. House cleaning
i. Water project ii. Pumps
iii. protected springs iv. unprotected springs v. Cisterns
vi. basin vii. tanker trucker
viii. small water vendor Ask Q2- Q4 if the Household gets water from the cisterns for any purpose. 2. How long does the water in the cisterns stay stored?
a. A week to a month b. A month to six months c. Six month to a year d. A year to two years e. Two years or more f. Don’t know g. always
Annex C. Survey Questionnaire 73

3. Do the cisterns get cleaned:
a. Yes b. No c. Don’t know
4. If yes, when was the last time the cistern got cleaned? a. last week to two weeks b. last month to two months c. more than two months to six months d. more than six months to one year e. more than one year f. don’t know
5. What are the ways used to scoop water out of the cisterns? a. Pump b. Bucket prepared for collecting water c. Bucket used for animals and for collecting water d. With bare hands e. Don’t know
6. Can you show me how you scoop water from cisterns? (demonstrating it not actually going to the cisterns)
a. yes b. no
7. for the researcher try to observe: a. if her hand touched the cisterns b. if she goes down and her feet touch the water c. if she is using a clean bucket (you could ask her to show you the bucket she use)
8. From where do animals drink water? a. Directly from the cisterns b. From a bucket c. From another location designated for animals to drink d. Don’t know
9. In your opinion, what makes water unusable? (Circle all that are mentioned) a. animals drink from it b. isn’t covered c. isn’t fenced d. green colored water e. children and animal defecate next to the water
10. Do you know anyone who got sick because of using cistern water? a. Yes b. No
11. If yes, what disease(s)? a. diarrhea b. bilharzias c. respiratory diseases d. skin diseases e. typhoid f. giardia g. get poisoned h. Don’t know
74 Household Hygiene Improvement Survey in Yemen

12. What was done to deal with this situation?
a. The illness i. Went to the health facility
ii. Traditional treatment iii. Nothing iv. Don’t know
b. The Cistern i. Was cleaned
ii. Filtered iii. Put a tree called (Qansila) iv. Put a tree called (Shabat/Ta’amsh) v. Nothing
vi. Don’t know 13. Currently, is cistern suitable for all its uses?
a. Yes b. No
14. If the answer no, why not? (Circle all that are mentioned) a. animals drink from it b. isn’t covered c. isn’t fenced d. green colored water e. children and animal defecate next to the water
15. How can the cistern be made suitable? a. Clean the cistern b. Fence the cisterns c. Stop fetching water from it d. Stop having children to play there e. Cover the cistern f. Plant Sha’abat g. Add Qansila h. Don’t know
16. How important is the cistern to you and village? a. The village relies totally on it for drinking and cleaning b. The village relies on it for animals and cleaning c. The village relies on it for cleaning only d. The village relies on it for animals only e. The village doesn’t rely on it f. Don’t know
Annex C. Survey Questionnaire 75

Solid Waste Management
1. How do you gather wastes inside the house? a. In plastic bags b. In buckets c. In the yard
2. Where is the garbage collected in the house? a. in the kitchen b. in the yard c. outside the premises
3. How often do you get rid of the waste? a. Every day b. Every two days c. Once per week d. Don’t know
4. Where is the garbage collected outside the house? a. Garbage is collected from each house b. A member of the family takes the garbage to a specific area designated to gather the
waste c. There isn’t a specific area to gather the waste, people throw it any place d. Don’t know
5. Does your community get rid of the garbage? a. Yes b. No c. Sometimes d. Rarely
6. If yes, what methods are used to get rid of the garbage? a. Burning b. Gathering in one place (e.g. dump or landfill) c. Don’t know
7. Do you believe that the garbage has caused disease(s) in your household? a. Yes b. No c. Don’t know
8. If yes, what disease(s)? g. diarrhea h. bilharzias i. respiratory diseases j. skin diseases k. typhoid l. giardia m. Don’t know
9. What problems are caused by garbage generally? a. it brings germs b. it has a bad smell c. it spreads malaria d. it spreads diarrhea e. flies f. house flies g. don’t know
76 Household Hygiene Improvement Survey in Yemen
10. In your opinion, what else should be done to deal with garbage in your community, if anything?(circle all that apply)
a. Designate a fenced place to throw the garbage in b. Gather the garbage and burn it c. Recycle the garbage d. Gather it in a plastic bag and tie it e. Don’t know
Annex C. Survey Questionnaire 77

Healthy Schools: 1. Do you have school-age children?
a. Yes b. No
2. If yes, do they go the school? a. Yes b. No
3. If no, why not? (circle all that are mentioned) a. There aren’t any toilets at the school b. Windows are broken and it’s cold c. The children get sick when they attend school d. The floor is not tiled or cemented, which causes dust e. Social reasons (no girl school) f. The girls go and fetch water all day they can’t go to school
4. Is the school that your children attend a healthy school? a. Yes b. No
5. In your opinion, what is a healthy school environment? a. Proper windows in the class b. No dust in the class c. There are toilets d. Trash is collected in the school e. There are facilities for hand washing f. The classrooms aren’t cold g. Water is provided h. Don’t know
6. If not, why not? (circle all that are mentioned) a. No proper windows in the class b. There is dust in the class c. There aren’t any toilets d. Trash is not collected at the school e. There aren’t facilities for hand washing f. The classrooms are cold g. Water isn’t provided h. Don’t know
7. Is the school cleaned regularly? a. Yes b. No c. Don’t know
8. If yes, how many times does the school get cleaned? a. Once every week b. Once every two weeks c. Once every month d. More than one months
9. How does it get cleaned? a. There is a person who cleans it b. The students have a cleaning campaign c. Don’t know
10. How could each one of the following play an active role in having a healthy school (circle all that are mentioned)
a. The School
78 Household Hygiene Improvement Survey in Yemen
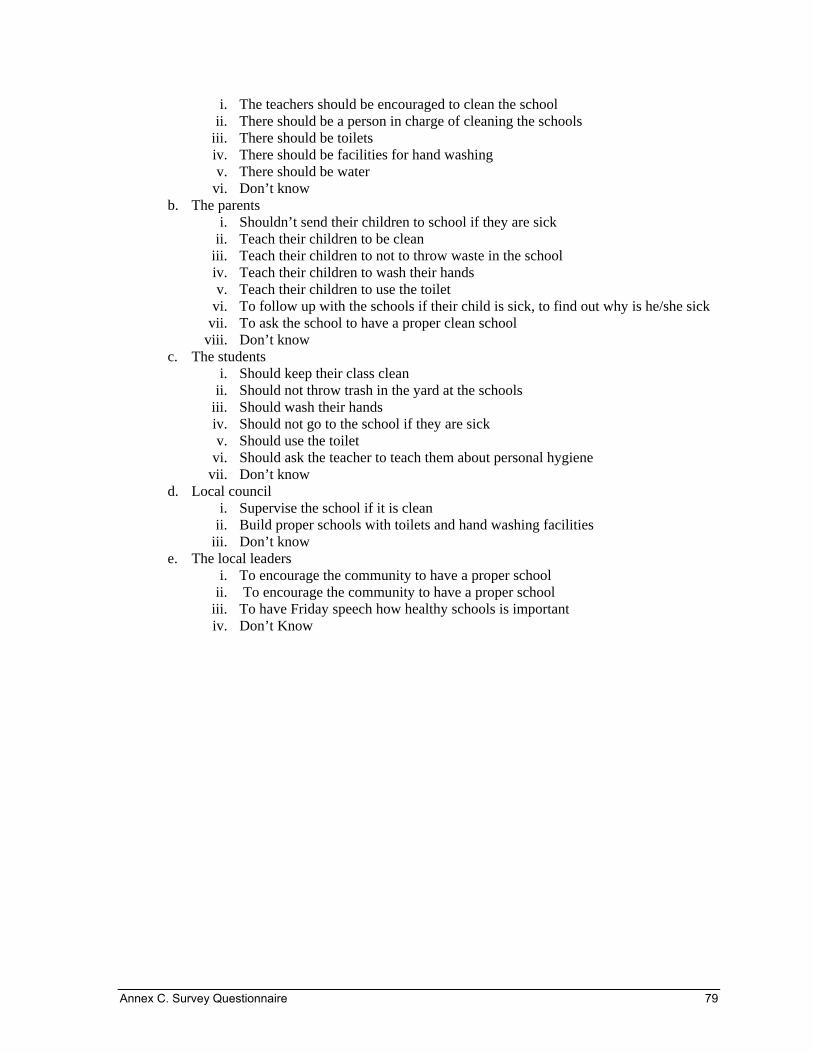
i. The teachers should be encouraged to clean the school ii. There should be a person in charge of cleaning the schools
iii. There should be toilets iv. There should be facilities for hand washing v. There should be water
vi. Don’t know b. The parents
i. Shouldn’t send their children to school if they are sick ii. Teach their children to be clean
iii. Teach their children to not to throw waste in the school iv. Teach their children to wash their hands v. Teach their children to use the toilet
vi. To follow up with the schools if their child is sick, to find out why is he/she sick vii. To ask the school to have a proper clean school
viii. Don’t know c. The students
i. Should keep their class clean ii. Should not throw trash in the yard at the schools
iii. Should wash their hands iv. Should not go to the school if they are sick v. Should use the toilet
vi. Should ask the teacher to teach them about personal hygiene vii. Don’t know
d. Local council i. Supervise the school if it is clean
ii. Build proper schools with toilets and hand washing facilities iii. Don’t know
e. The local leaders i. To encourage the community to have a proper school
ii. To encourage the community to have a proper school iii. To have Friday speech how healthy schools is important iv. Don’t Know
Annex C. Survey Questionnaire 79

Observation Paper After finishing the survey, remember to repeat to the interviewee the places that you would like to observe which are:-
• The container .TO INTERVIWER: if the interviewee agreed to observe the container observe the following :
a. What kind of containers Narrow mouthed Wide mouthed Tapped container Piped container Barrel
b. Are the containers covered all are covered some are covered none are covered
• washing hand facility:-. TO INTERVIEWER: if the house hold agreed to observe the washing hand facility observe the following:
a. if there is water b. place for hand washing c. if there is soap or detergent or ash d. is there a towel or cloth to dry hands e. condition of the towel if it is there (clean, dirty)
• the container of food INTERVIEWER: if the household agreed for you to observe the food container observe the following:
a. if the container is covered b. where are the food containers are placed
• The cisterns INTERVIEWER, if the interviewee agreed to show you on what they scoop water, observe the following:
a. What equipment is used to collect water?__________ b. Do hands enter the cistern during collection
80 Household Hygiene Improvement Survey in Yemen