household financial stability and economic growth · center for household financial stability ......
TRANSCRIPT

October 9, 2013
William R. Emmons Center for Household Financial Stability
Federal Reserve Bank of St. Louis [email protected]
These comments do not necessarily represent the views of the Federal
Reserve Bank of St. Louis or the Federal Reserve System.
Household Financial Stability and Economic Growth
1
FTA Revenue Estimation & Tax Research Conference

2
A New Research Initiative: Center for Household Financial Stability
§ What is the state of families’ balance sheets? Ø Survey of Consumer Finances Ø Financial Accounts of the United States Ø Experian/New York Fed Consumer-Credit panel
§ Why does it matter for families and for the economy?
§ What can we do to improve them?

3
www.stlouisfed.org/household-financial-stability/
§ Research Ø 2012 Annual Report: The state of American balance sheets Ø Who was hurt most in the crisis? Ø Why did vulnerable families have risky balance sheets? Ø Why did young families lose so much wealth? Ø What is the current status of older families?
§ Conferences and events Ø Financial-Access Forum (Oct. ’12); Student Loans (Nov. ‘13)
Ø Research Symposia (Feb. 2013; May 2014) Ø Rebuilding-Wealth Roundtable (Urban Institute, Oct. ‘13)
§ Updates and monitoring tools Ø In the Balance briefs Ø Household Financial Stability Index (in progress)

4
What is the State of American Families‘ Balance Sheets?
§ Largest household-wealth loss since the Great Depression: $16 trillion
§ Main balance-sheet components Ø Equity shares Ø Housing Ø Other assets Ø Liabilities continued to rise until Q3.2008
§ Demographic dimensions Ø In percentage terms, biggest losers were:
§ Young families § Less-educated § Minorities (African-American, Hispanic)

5
Recovery of Average Wealth Loss: 76 Percent
§ Average inflation-adjusted household wealth loss, Q1.2007 (peak) through Q1.2009 (trough)
-$153,000 -22.2%
§ Average inflation-adjusted household wealth regained, Q1.2009 (trough) through Q2.2013 (latest)
+$117,000 +21.8%

6
Average Real Household Wealth Hasn‘t Returned to Peak of 2007
Index equals 100 at cyclical wealth peak
Peak in Q1.2007: $689,000 in
today’s dollars
Trough in Q1.2009: $536,000 in
today’s dollars
Latest in Q2.2013: $652,000 in
today’s dollars
Sources: Federal Reserve Board, Bureau of Economic Analysis, Census Bureau

7
Wealth Loss During 1968-75 Cycle Also Was Protracted
Indexes equal 100 at cyclical wealth peak
Cycle with peak in
Q4.1968
Peak in Q1.2007: $689,000 in
today’s dollars
Trough in Q1.2009: $536,000 in
today’s dollars
Latest in Q2.2013: $652,000 in
today’s dollars
Sources: Federal Reserve Board, Bureau of Economic Analysis, Census Bureau

8
§ Wealth losses during the crisis (2010 wealth vs. 2004/07 average, inflation-adjusted) Ø Overall: -10% Ø Young (<40) families: -41% Ø Less-than HS families: -28% Ø Minority families: -31%
§ Groups with smaller average losses Ø Older (62+) families: -4% Ø College grads (2- or 4-yr): -9% Ø Whites and Asians: -6%
Source: Federal Reserve, Survey of Consumer Finances
Economically Vulnerable Groups Suffered Very Large Wealth Losses

9
Wealth Loss During the Crisis
Least economically vulnerable
Most economically vulnerable
Least economically vulnerable
Most economically vulnerable
Source: Federal Reserve, Survey of Consumer Finances

10
Wealth Recovery Continues
§ By balance-sheet item Ø Equity shares fully recovered Ø Housing still off 25% in real terms Ø Other assets remain below peak Ø Liabilities falling but still high
§ By demographic group Ø Biggest gainers owned stocks and businesses, had
little debt: Mainly college-educated whites and Asians over 40
Ø Biggest losers had only housing and lots of debt, and are recovering very slowly if at all

11
Why Does it Matter for Families and the Economy?
§ Families Ø Strong balance sheets can buffer income shocks Ø Wealth predicts health outcomes, community
stability, and children’s success Ø Economic mobility
§ The economy Ø Wealth effects Ø Leveraging and deleveraging effects

12
Case, Quigley, and Shiller (2013): Housing Wealth Effect Reduced Consumer Spending
Quarterly through Q2.2013
Billions of 2009 chained dollars
Gap created by loss of housing wealth: 3.5% of consumption
Inflation-adjusted household real estate
Smaller gap created by loss of stock-market wealth
Inflation-adjusted personal consumption expenditures
Sources: Federal Reserve Board, Bureau of Economic Analysis, Census Bureau

13
Dynan and Edelberg (2013): Debt Overhang Slows Deleveraging Households
Quarterly through Q2.2013
Billions of 2009 chained dollars
Inflation-adjusted household liabilities
Inflation-adjusted personal consumption expenditures
Sources: Federal Reserve Board, Bureau of Economic Analysis, Census Bureau

14
What Can We Do to Improve It?
§ Research Ø Demographic drivers of financial fragility Ø Balance-sheet failures Ø Wealth-building successes and failures; for example
homeownership
§ Events Ø Research symposia Ø Practitioner “best-practice” events
§ Policy Ø Help Federal Reserve leaders understand the role of
household balance sheets in economic growth Ø Public policy advocacy not the Fed’s job, but we
partner with advocates


16
Previous Presentations
§ Micro view
§ Macro view

17
The Micro View: Economic Vulnerability and Financial Fragility
§ Evidence from the Survey of Consumer Finances: Economically vulnerable families were more likely to have risky balance sheets in 2007, then suffered larger percentage wealth losses during the crisis.
§ Shouldn’t a family’s balance sheet be used to dampen its economic risk, rather than amplify it?
§ Which interventions are most likely to break the link between economic vulnerability and financial fragility?

18
Economically Vulnerable Group: The Young
Source: Bureau of Labor Statistics

19
Economically Vulnerable Group: Less-Educated
Source: Bureau of Labor Statistics

20
Economically Vulnerable Group: African-Americans and Hispanics
Source: Bureau of Labor Statistics

21
Economic Vulnerability and Financial Fragility
§ Economic vulnerability: Susceptibility to job and income losses
§ Financial fragility: Risky financial behavior and risky balance sheets Ø Fact: They are positively correlated in the
population across demographic sub-groups § Why don’t economically vulnerable families take
less financial risk to hedge their consumption risk? § Our explanation: They’re driven by common
factors—youth and inexperience, low human capital, and the legacy of discrimination

22
§ Wealth losses during the crisis (2010 wealth vs. 2004/07 average, inflation-adjusted) Ø Overall: -10% Ø Young (<40) families: -41% Ø Less-than HS families: -28% Ø Minority families: -31%
§ Groups with smaller average losses Ø Older (62+) families: -4% Ø College grads (2- or 4-yr): -9% Ø Whites and Asians: -6%
Source: Federal Reserve, Survey of Consumer Finances
Economically Vulnerable Groups Suffered Very Large Wealth Losses

Demographic Influences on Balance Sheets
Demographic group
Marginal effect of belonging to a demographic group on: Safe and liquid assets relative to annual income
Young families (< 40 years old)
-16 percentage points
High-school drop-out families
-16
African-Americans and Hispanics
-20
23
Source: Emmons and Noeth (2013), based on Survey of Consumer Finances
Economically Vulnerable Groups Had Risky Balance Sheets Going into the Crisis

Demographic Influences on Balance Sheets
Demographic group
Marginal effect of belonging to a demographic group on: Safe and liquid assets relative to annual income
Share of assets invested in housing
Young families (< 40 years old)
-16 percentage points
+13 percentage points
High-school drop-out families
-16 +9
African-Americans and Hispanics
-20 +14
24
Source: Emmons and Noeth (2013), based on Survey of Consumer Finances
Economically Vulnerable Groups Had Risky Balance Sheets Going into the Crisis

Demographic Influences on Balance Sheets
Demographic group
Marginal effect of belonging to a demographic group on: Safe and liquid assets relative to annual income
Share of assets invested in housing
Ratio of total debt to total assets
Young families (< 40 years old)
-16 percentage points
+13 percentage points
+32 percentage points
High-school drop-out families
-16 +9 -4
African-Americans and Hispanics
-20 +14 +7
25
Source: Emmons and Noeth (2013), based on Survey of Consumer Finances
Economically Vulnerable Groups Had Risky Balance Sheets Going into the Crisis

Innate cognitive ability, g
Educational attainment
Human capital, h
Labor-market earnings
Legacy of discrimination
On-the-job experience
Factors outside an individual’s control: Cognitive ability Race or ethnicity Age 26
Our Model of Earnings Determination...

Innate cognitive ability, g
Human capital, h
Labor-market earnings
Balance-sheet structure
Financial knowledge, f
Incentive to acquire financial knowledge
Savings available to invest
Legacy of discrimination
On-the-job experience
Financial experience and learning
Factors outside an individual’s control: Cognitive ability Race or ethnicity Age 27
... And Balance-Sheet Coice
Educational attainment

28
Key Implications
§ Economic vulnerability and financial fragility co-exist because they have common causes, including one or more of the following: Ø Being young and inexperienced Ø Low human capital Ø Historically disadvantaged minority
§ What’s new and counter-intuitive? Ø New: Endogenous acquisition of financial knowledge
interacts with human capital (and all of its determinants) v See Lusardi, Michaud, Mitchell (2013)
Ø Counter-intuitive: Balance sheets of groups with the most economic risk amplify their risk, rather than dampening it

29
Risky Financial Behavior and Risky Balance Sheets
§ We define risky financial behavior to include: Ø Low saving rate Ø High-cost financial services Ø High debt-service-to-income ratio
§ We define risky balance sheets to contain: Ø Low ratio of safe and liquid assets to income Ø High housing concentration Ø High balance-sheet leverage
30
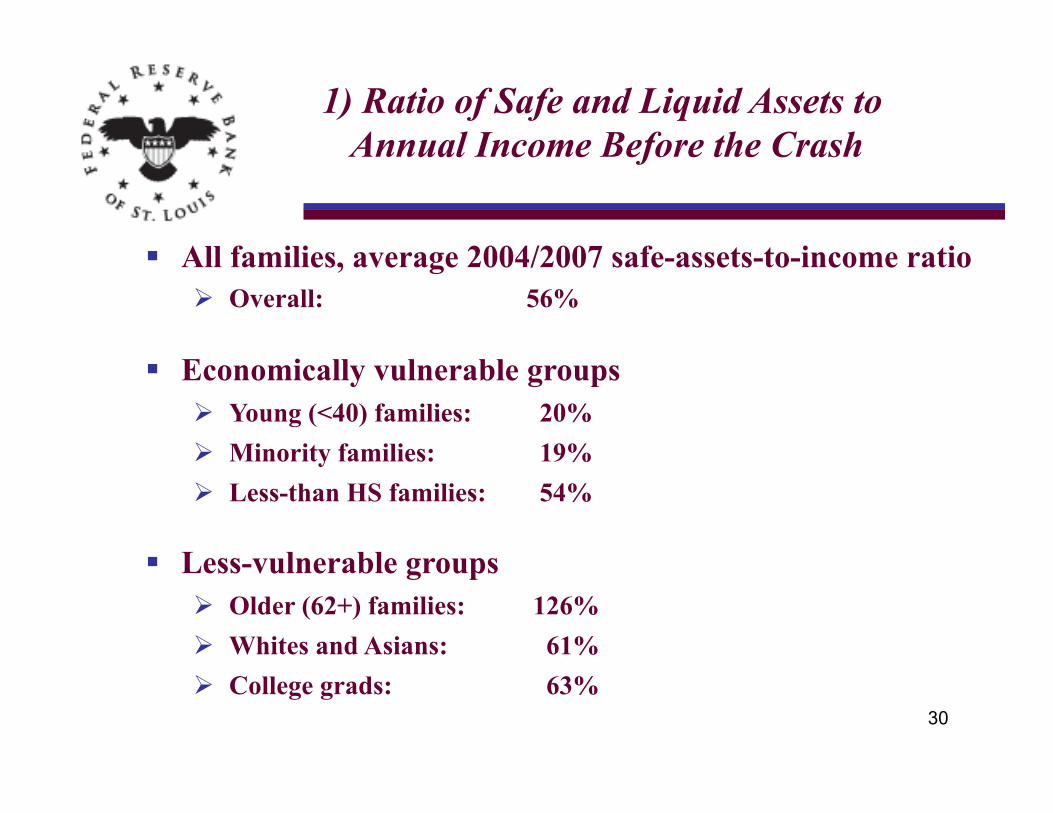
1) Ratio of Safe and Liquid Assets to Annual Income Before the Crash
§ All families, average 2004/2007 safe-assets-to-income ratio Ø Overall: 56%
§ Economically vulnerable groups Ø Young (<40) families: 20% Ø Minority families: 19% Ø Less-than HS families: 54%
§ Less-vulnerable groups Ø Older (62+) families: 126% Ø Whites and Asians: 61% Ø College grads: 63%

31
Ratio of Safe and Liquid Assets to Income
0
20
40
60
80
100
120
27
58
106
1130
98
7 10
116
Percent
Ratio of Safe Liquid Assets to Family Income in 2007 Among Whites, Asians, and Other Non-‐Disadvantaged Minorities
College gradHigh school gradHigh-‐school drop-‐out 0
20
40
60
80
100
120
1537
61
13 17 235 6 17
Percent
Ratio of Safe Liquid Assets to Family Income in 2007 Among African-‐Americans and Hispanics
College gradHigh school gradHigh-‐school drop-‐out
Least economically vulnerable
Most economically vulnerable
Least economically vulnerable
Most economically vulnerable

32
2) Share of Total Assets in Residential Real Estate Before the Crash
§ All families, average 2004/2007 RRE portfolio share Ø Overall: 39%
§ Economically vulnerable groups Ø Young (<40) families: 54% Ø Minority families: 58% Ø Less-than HS families: 59%
§ Less-vulnerable groups Ø Older (62+) families: 34% Ø Whites and Asians: 37% Ø College grads: 35%

33
Residential Real-Estate Portfolio Shares
Least economically vulnerable
Most economically vulnerable
Least economically vulnerable
Most economically vulnerable

34
3) Ratio of Total Debt to Total Assets Before the Crash
§ All families, average 2004/2007 debt-to-assets ratio Ø Overall: 15%
§ Economically vulnerable groups Ø Young (<40) families: 39% Ø Minority families: 31% Ø Less-than HS families: 16%
§ Less-vulnerable groups Ø Older (62+) families: 5% Ø Whites and Asians: 14% Ø College grads: 13%

35
Ratio of Total Debt to Total Assets
Least economically vulnerable
Most economically vulnerable
Least economically vulnerable
Most economically vulnerable

36
Wealth Loss During the Crisis
Least economically vulnerable
Most economically vulnerable
Least economically vulnerable
Most economically vulnerable
37
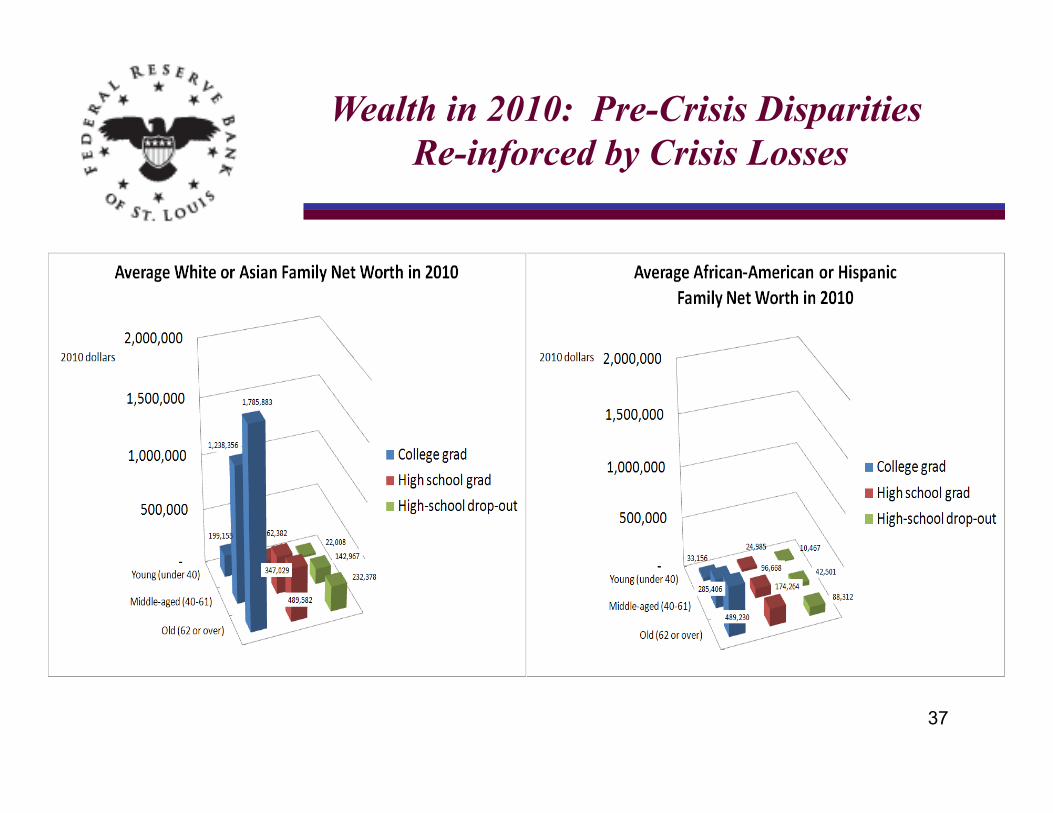
Wealth in 2010: Pre-Crisis Disparities Re-inforced by Crisis Losses

38
Ratio of African-American or Hispanic Wealth to Non-Minority Wealth
39
Can We Break the Link Between Economic Vulnerability and Financial Fragility?
§ Financial-literacy training
§ Cash and in-kind benefits
§ Individual-Development Accounts (IDAs)
§ Early-childhood enrichment

40
Adult Financial-Literacy Education Comes Too Late

41
Cash and In-Kind Benefits May Not Translate into Financial Knowledge

42
Individual Development Accounts Intervene at Several Points

43
Early Childhood Interventions Target Human Capital

44
Why Did Economically Vulnerable Families Enter the Crisis With Risky Balance Sheets?
§ Economically vulnerable families were more likely to have risky balance sheets in 2007, and then to suffer large percentage wealth losses during the crisis.
§ Common causes drive both: Ø Youth and inexperience Ø Low level of human capital Ø Legacy of discrimination
§ Interventions should target human-capital formation and experience-based learning.

45
The Macro View: Household Wealth and the Economy
§ How much wealth did the average household lose? How much has been rebuilt so far?
§ What assets contributed the most to wealth losses and subsequent gains?
§ Did wealth losses and deleveraging slow the recovery?
§ If households are still rebuilding wealth, why is the saving rate so low?

46
Recovery of Average Wealth Loss: 76 Percent
§ Average inflation-adjusted household wealth loss, Q1.2007 (peak) through Q1.2009 (trough)
-$153,000 -22.2%
§ Average inflation-adjusted household wealth regained, Q1.2009 (trough) through Q2.2013 (latest)
+$117,000 +21.8%

47
Average Real Household Wealth Hasn‘t Returned to Peak of 2007
Index equals 100 at cyclical wealth peak
Peak in Q1.2007: $689,000 in
today’s dollars
Trough in Q1.2009: $536,000 in
today’s dollars
Latest in Q2.2013: $652,000 in
today’s dollars
Sources: Federal Reserve Board, Bureau of Economic Analysis, Census Bureau

48
Wealth Loss During 1968-75 Cycle Also Was Protracted
Indexes equal 100 at cyclical wealth peak
Cycle with peak in
Q4.1968
Peak in Q1.2007: $689,000 in
today’s dollars
Trough in Q1.2009: $536,000 in
today’s dollars
Latest in Q2.2013: $652,000 in
today’s dollars
Sources: Federal Reserve Board, Bureau of Economic Analysis, Census Bureau

49
Composition of Household Wealth Losses and Recoveries
§ Composition of gains and losses by asset type Ø Losses
§ Same order of magnitude in dollar terms on stocks, houses, and “all other assets”
Ø Recoveries through Q2.2013 § Stocks at 113% of pre-recession peak § Other assets at 93% § Household RE at 70%

50
Wealth Changes By Asset Type: Measured at Peak and Trough of Total Net Worth
Q2.2013 dollars
Sources: Federal Reserve Board, Bureau of Economic Analysis, Census Bureau
Weakest recovery

51
Q2.2013 dollars
Wealth Changes By Asset Type: Measured at Peak and Trough of Housing Values
Sources: Federal Reserve Board, Bureau of Economic Analysis, Census Bureau
Weakest recovery

52
Case, Quigley, and Shiller (2013): Housing Wealth Effect Reduced Consumer Spending
Quarterly through Q2.2013
Billions of 2009 chained dollars
Gap created by loss of housing wealth: 3.5% of consumption
Inflation-adjusted household real estate
Smaller gap created by loss of stock-market wealth
Inflation-adjusted personal consumption expenditures
Sources: Federal Reserve Board, Bureau of Economic Analysis, Census Bureau

53
Dynan and Edelberg (2013): Debt Overhang Slows Deleveraging Households
Quarterly through Q2.2013
Billions of 2009 chained dollars
Inflation-adjusted household liabilities
Inflation-adjusted personal consumption expenditures
Sources: Federal Reserve Board, Bureau of Economic Analysis, Census Bureau

54
Much If Not All of Recession Output Loss Now Seen as Permanent
Quarterly through Q2.2013
Index levels equal 100 in
1997
Ann. avg. growth of CBO potential real GDP
Actual real GDP
CBO’s potential real GDP
‘97-’02 ’02-’07 ‘07-’12 ’12-’17
3.5% 2.5% 1.8% 2.1% 2.3%
‘17-’22
Pre-recession trend
Sources: Bureau of Economic Analysis, Congress-ional Budget Office

55
Real House Prices May Not Return to 2006 Peak for Decades
Quarterly through Q2.2013
Index levels equal 100 in
1997
Inflation-adjusted home-price index
Potential real GDP per available worker
Projected ann. avg. growth rate, 2013-23:
1.7%
Sources: CoreLogic, Bureau of Economic Analysis, Congress-ional Budget Office

Personal Saving Rate
Percent of disposable personal income
20151005009590858075706560555045Source: Bureau of Economic Analysis /Haver Analytics
16
14
12
10
8
6
4
2
0
16
14
12
10
8
6
4
2
0 56
A Wealth Puzzle: If HHs are Rebuilding Wealth, Why Isn‘t HH Saving Rate Higher?
Quarterly through Q2.2013
Percent
Q2.2013: 4.5%
1968-75: Previous largest protracted loss of household wealth

57
Household Wealth and the Economy: Is Wealth Rebuilding Finished?
§ Housing probably had the biggest effect on consumer spending and is slowest asset to recover.
§ Household deleveraging continues.
§ Slower projected economic growth suggests incomes and house prices unlikely to increase much.
§ The typical family faces stagnant income and house prices, and still may have too much debt—it’s not easy to rebuild wealth!

58
Center for Household Financial Stability
www.stlouisfed.org/household-financial-stability/