hot times in the city - earthobservatory.nasa.gov · 2 eo kids is affiliated with nasa’s earth...
TRANSCRIPT
National Aeronautics andSpace Administration
Urban Heat IslandsHot Times in the City
www.nasa.gov

2
EO Kids is affiliated with NASA’s Earth Observatory and written for audiences aged 9 to 14. It is published with support from NASA’s Landsat, Terra, and Aqua missions.
The Urban Heat Islands issue of EO Kids is available for download at http://earthobservatory.nasa.gov/eokids
EO Kids Team:Ginger Butcher, Editor in ChiefTassia Owen, Managing Editor Michael Carlowicz, Associate Editor Autumn Burdick, Senior Science Writer Kristen Weaver, Science Writer and Education SpecialistDorian Janney, Science Writer and Education SpecialistValerie Casasanto, Science Writer Abigail Nastan, Science WriterMike Taylor, Data Visualizer Kevin Ward, Earth Observatory Group Manager
Image Credits:Cover: morning in park photo, Fotolia; Pages 2-3: illustrations of New York City, globe, recipe, and sedum, Fotolia; Pages 4-5: urban heat island graphic, Harman Smith; New York City heat and vegetation maps, NASA's Earth Observatory; Pages 6-7: U.S. map of temperature differences, Joseph Nigro Science Systems and Applications, Inc. / NASA GSFC; Landsat images of Phoenix, Minneapolis, and Atlanta, Mike Taylor; graph of roof tempera-tures in New York City, NASA's Earth Observatory; Pages 8-9: land surface temperature map, NASA's Earth Observatory; Furnace Creek photo, Fotolia; Flaming Mountain photo, Fotolia; Page 10: heat map of Minneapolis, NASA's Earth Observatory and Tassia Owen; Landsat image of Minneapolis, Mike Taylor; Page 11: bird feeder illustration, Ginger Butcher; Copenhagen building, Brittany Bailey Erikson; Page 12: U.S. lights at night, NASA's Earth Observatory; U.S. map of temperature differences, Joseph Nigro Science Systems and Applications, Inc. / NASA GSFC; Page 13: experiment photos, Dorian Janney; Pages 14-15: satellite images of Amster-dam and Santorini, ASTER Science Team; Photo of Lahouari Bounoua, Ginger Butcher; Back Cover: lights at night around London, ISS Crew Earth Observations Facility and the Earth Science and Remote Sensing Unit, Johnson Space Center.
January / February 2017
The World Meteorological
Organization has approximately
11,000 weather stations
measuring temperatures. That
sounds like a lot until you learn
that Earth has 144.7 million
square kilometers of land —
leaving one thermometer for
every 13,012 square kilometers.
And that doesn’t account for
the three-quarters of the
planet covered by ocean.
New York has the highest population density of any major city in the United States, with over 27,000 people per square mile.
Did you know that a recipe
is like an algorithm? If it is
followed exactly, you should
get the same chocolate chip
cookies every time. Learn
how scientists are using
algorithms to look at how to
help keep cities from heating
up too much.
3
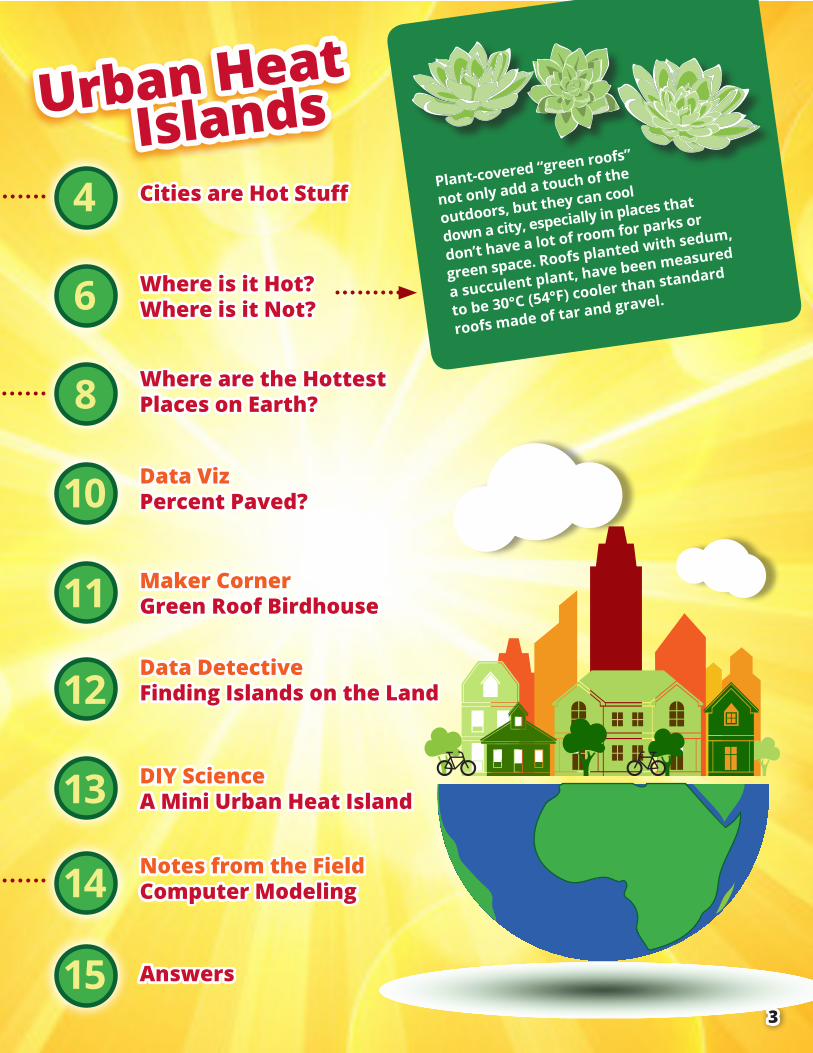
Plant-covered “green roofs”
not only add a touch of the
outdoors, but they can cool
down a city, especially in places that
don’t have a lot of room for parks or
green space. Roofs planted with sedum,
a succulent plant, have been measured
to be 30°C (54°F) cooler than standard
roofs made of tar and gravel.
4
8
11
6
10
12
13
14
15
Urban Heat Islands
Cities are Hot Stuff
Where is it Hot?Where is it Not?
Where are the Hottest Places on Earth?
Maker CornerGreen Roof Birdhouse
DIY ScienceA Mini Urban Heat Island
Data Detective Finding Islands on the Land
Notes from the FieldComputer Modeling
Answers
Data VizPercent Paved?
4
Vocabulary:Urban: An area with the characteristics of a city —lots of buildings, streets, and people.
Impervious Surface: A material that does not let water pass through it. Examples are concrete, brick, and asphalt.
A ir temperatures and surface temperatures are not the same. If you have ever walked barefoot across hot sand or pavement on a
summer day, you know the difference. The surface beneath your feet feels hotter than the air around your head. At night, the reverse should happen and it does for grass and soil. But what about pavement?
Hot StuffHow much an object warms depends on what it
is made of and its color. Roads, driveways, and many rooftops are dark colors, which absorb heat better than light ones. You may have noticed this when wearing a black or white shirt on a hot day. In which color did you feel warmer? Bet you regretted wearing black that day.
Pavement holds heat very well, and it is also an impervious surface, meaning that it does not absorb water or allow it to pass through. Without that moisture, a surface loses some of its natural air con-ditioning. An artificial turf field is green like grass, but it is hotter than a natural field. Why? The turf doesn’t hold water for long.
Urban Heat IslandsUrban areas are full of sidewalks, parking lots,
roads, and basketball courts. Those hard and dark-colored surfaces contribute to what scientists call the urban heat island effect, which means cities and other highly developed areas are hotter than the plant-covered countryside.
Cities don’t just feel warmer during the daytime; they are also warmer at night. This is because stone buildings and paved streets store heat during the day and release it long after the Sun has set. That heat-ing effect even means there is less snow in the city during the winter. Cities tend to be hotter than their surrounding areas at all times of day and at all times of the year.
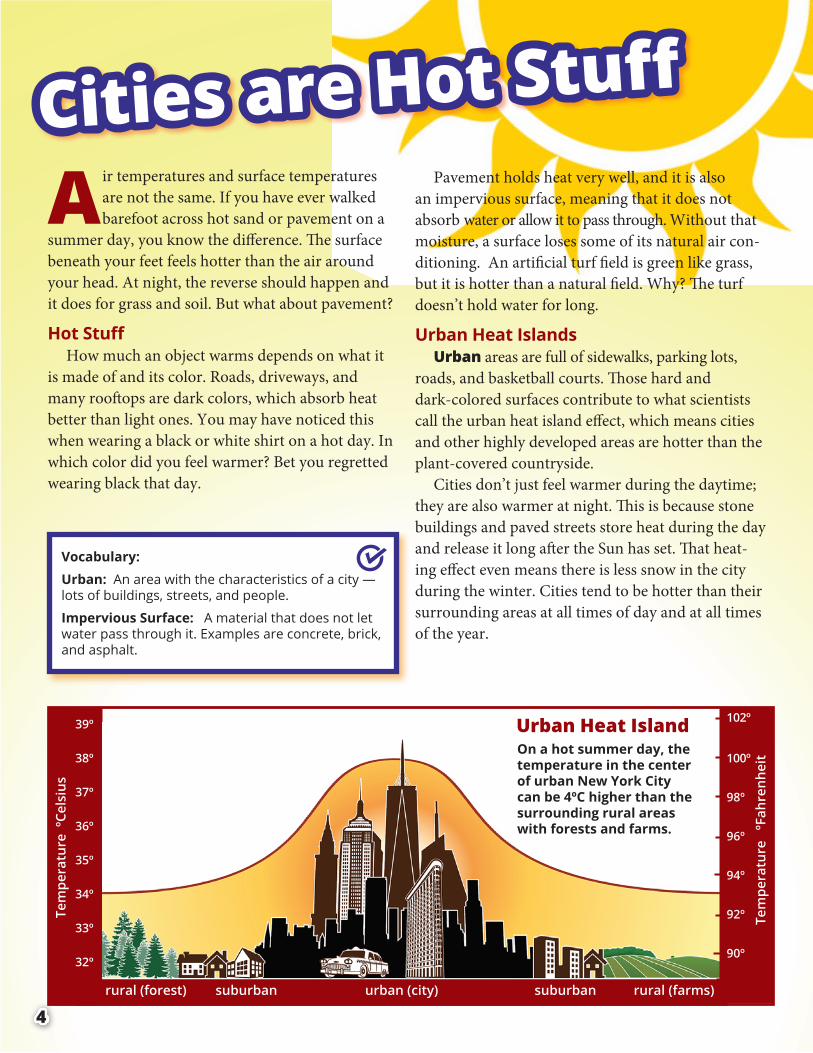
On a hot summer day, the temperature in the center of urban New York City can be 4ºC higher than the surrounding rural areas with forests and farms.
Urban Heat Island
urban (city) suburban
Tem
pera
ture
ºCe
lsiu
s
suburbanrural (forest) rural (farms)
36º
34º
33º
38º
32º
37º
35º
39º
Tem
pera
ture
ºF
ahre
nhei
t
96º
92º
90º
100º
98º
94º
102º
Cities are Hot Stuff

5
The map on the left shows relatively cool areas as dark purple and relatively hot areas as white. In the map below, vegetation in NYC is shown in green, with the darkest green areas having the most plants and trees. What can you tell by comparing these two images?
New York, New York – It’s a … HOT TownLet’s look at the city of New York, home to over
8 million people. To house and transport all those people takes a lot of buildings, streets, and side-walks — impervious surfaces. The city is also surrounded by lots of trees. During the summer, the city can be as much as 4°C warmer (7.2°F) than its surrounding areas. New York City is an urban heat island.
Seeing Urban Heat Islands from SpaceWe can measure urban temperature differences
from the ground, and we can also sense these temperatures from space. Looking at these two images, you can see that the hottest temperatures occur where there are more impervious surfaces and less vegetation. An increase of 4° Celsius may not seem like a lot, but there is a big difference between 34°C and 38°C (93°F and 100°F). This temperature increase will make you feel uncomfortable, and for some people (particularly the elderly) higher temperatures can cause heat exhaustion and stroke.
New York City has a higher density of people than any other city in the United States.
An increase of just 1°C (about 2°F) can raise energy demands for air conditioning by 5 to 20 percent. This is expensive and can lead to blackouts. When that happens, not only will you not be able to cool down with your air conditioning, but stores, libraries, and schools will have to shut down until the power goes back on. Missing that history quiz might not be so bad, but not being able to power your grandma’s house could be dangerous.
– A. Burdick
Temperature and Vegetation in New York City

6
Plains states such as Nebraska and Kansas don’t have a lot of cities, so they don’t have many urban heat islands. But the high-ways and small towns between major cities absorb and hold heat and can be seen as patterns of lines across the map, dividing the large, cool forests and the farmlands between them.
Phoenix is often cooler than its surrounding area – the opposite of most cities. Why is this? City residents grow trees and other plants. These add shade and moisture from transpiration. While the plants keep the city cool, the surrounding desert stays hot because there are smaller and fewer plants to cool it down.
Plant transpiration is more than just a drop in the bucket. One acre of corn can produce 15,142 liters (4,000 gallons) of transpired water vapor every day.
Two main factors influence the temperature of cities compared to their
surroundings: pavement and plants. Pavement makes them hot, and plants make them cool. Trees, shrubs, and grasses provide their own natural air conditioning through transpiration. The areas between cities — where there are more plants than pavement —tend to be cooler.
— A. Burdick and T. Owen
Vocabulary:Transpiration: The release of water vapor from pores (little holes) on the underside of leaves.
Where is it HOT? Where is it NOT?

August 1st 2nd 3rd 4th 5th
4.3º2.0º1.0º0º-1.5º 1.6º 2.4º-0.4º
7
Minneapolis is nestled among many, many farms. The plants growing on these farms cool the air through transpiration. This difference means the city is noticeably hotter than the surrounding fields.
Atlanta, Georgia, is nicknamed "Hotlanta." As the city grew, 380,000 acres of trees were removed, but some forest remains around the city. The forest keeps the area surrounding the city cool. Atlanta is an island of heat surrounded by cool forest – an urban heat island.
Satellites can sense the temperature of Earth’s surface. This map shows how much warmer U.S. cities and highways were in 2001 compared to the forests and farmlands around them.
Plant-covered “green roofs” can significantly cool down a city. The graph below shows how much cooler green roofs are compared to black roofs. To make your own green roof, see page 12.
60º
40º
20º
black roof
degrees celsius
white roofgreen roofair temperature
Temperature Comparisons of Roof Colors and Air Temperature
Urban/Rural Temperature Difference (ºC)

8
This map shows land surface tem-peratures (LST) in 2015, the hottest year on record up to that time. LST is a measure of how the Sun heats the ground, and it is often hotter than air temperatures. The brightest yellows show the hottest places on Earth.
The hottest air temperature ever recorded on Earth was measured in July 1913 in Furnace Creek, California, where the thermometer reached 56.7°C (134°F).
The hottest places on Earth — in the city or the countryside — have a few traits in common. They are full of rock and stone. They do not have a lot of water, plants, or trees. And
they are full of dark colors. The location of the hottest place on Earth can change, but these conditions do not.
Paving the DesertIn nature, the hottest spots are usually deserts, like the
Taklimakan in Asia, the Sahara in Africa, or the Sonoran in North America. These places are rocky, dark-colored landscapes, often covered with what geologists call “desert pavement” that absorbs heat from the Sun. Deserts have very little water on the ground or in the air, so they are missing one of nature’s best air conditioners.
Scientists have used satellites to find the absolute hottest places on Earth, measuring how much sun-light and heat is absorbed by the land. Over a span of seven years, the highest surface temperature on Earth was observed in the Lut Desert in Iran: 70.7°C (159.3°F). The second highest temperature — 69.3°C (156.7°F) — was measured in the shrublands of Queensland, Australia.
Think rocky, dry, and dark-colored...
Sahara
Sonoran Desert—
Where are the Hottest Places on Earth?

9
The dark red surface of Flaming Mountain in China is said to reach temperatures of 50 to 80°C (122 to 175°F) in the summer.
Beijing, ChinaThe amount of buildings and paved surfaces in Beijing quadrupled from 2000 to 2009. This increase of impervious surfaces also increased the city's average winter temperatures by 3 to 4°C (5 to 7°F) while wind speeds slowed by 1 to 3 meters per second (2 to 7 miles per hour).
The Urban DesertHuman landscapes can get just as hot. Scientists
have measured mid-summer surface temperatures between 77 to 82°C (170 to 180°F) on the black tar rooftops of New York City (learn more on page 5). Even in winter, rooftop temperatures can be tens of degrees warmer than air temperatures.
Just like the hottest natural places, cities are full of rocky surfaces — asphalt, brick, and concrete — that absorb heat by day and release it at night.
Cities have a lot of glass that reflects and concen-trates light. Tall buildings can slow the cooling winds. Fewer plants and trees also mean less shade and less water vapor in the air.
Urban areas often see temperatures rise 6°C (10°F) hotter than the surrounding suburbs and rural areas. This is a problem because 3.5 billion people live in cities. So around the world, scien-tists, engineers, and builders are looking for new
ways to build houses and offices that re-flect more sunlight into space. And
city planners are setting aside more space where grasses,
trees, and streams can cool the air naturally.
— M. Carlowicz
Hottest Temperatures in 2015 (ºC)
-40 27.5 75
—Lut Desert Sahara
Queensland—
—Taklimakan

+2.0º+1.0º +3.0º
10
Cities are usually warmer than the surrounding countryside, but how much of a city is warmer? In this map of Minneapolis and St. Paul, the bright and dark red squares are where impervious sur-faces (sidewalks, streets, and rooftops) make the temperatures warmer than their surroundings by over 2°C (3.6°F). Use the data visualization to identify what percentage of the city is warmer than its surroundings. —T. Owen
1. What is the total area of the satellite image? (hint: 1 square = 9.6 kilometers2)2. How many square kilometers have temperatures more than 2°C (3.6°F)
warmer than their surroundings?3. What percentage of this image is warmer than its surroundings because of
impervious surfaces? (hint: red squares ÷ total squares × 100 = percent)4. If less than 35% of a city is covered in impervious surfaces, temperatures
don’t change too drastically. Above that level, temperatures will rise abruptly. Given your results, are the temperatures in Minneapolis affected by sidewalks, streets, and rooftops?
Answers on page 15
Minneapolis— —St.Paul
This map shows the temperature differences between impervious surfaces (red) and vegetated (gray) areas around the Twin Cities.
Temperature Difference Degrees Celsius
Data Viz Percent Paved?
11
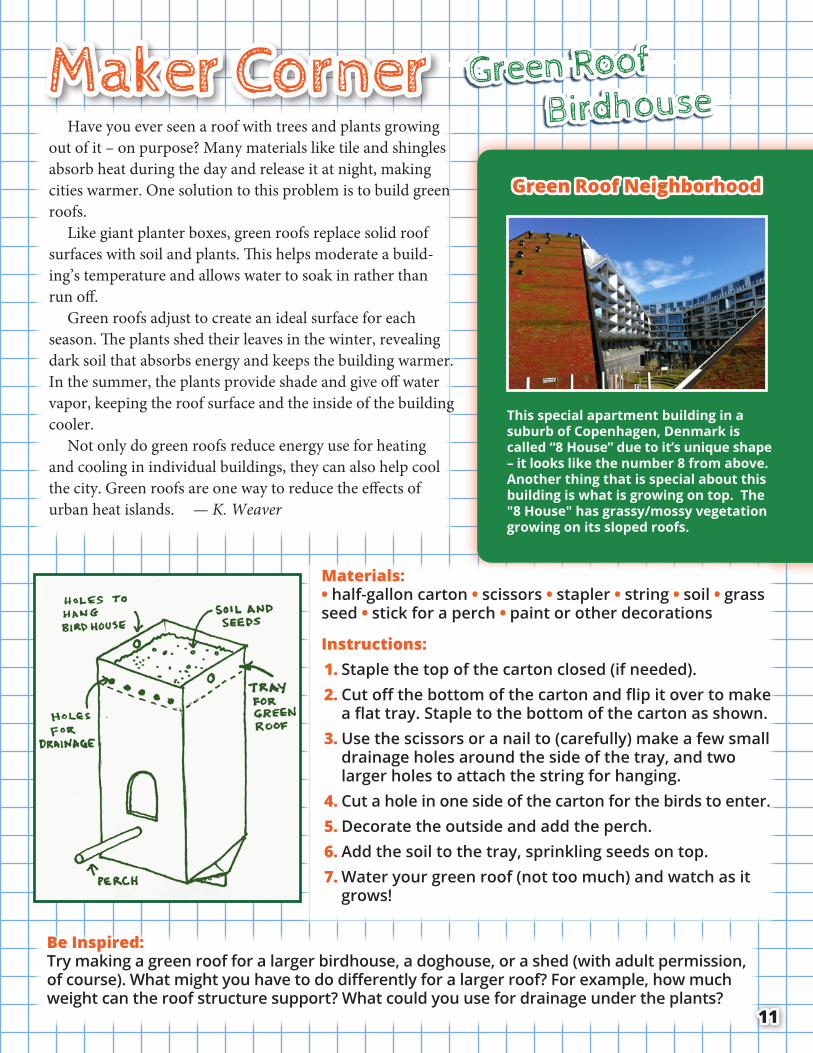
Materials:• half-gallon carton • scissors • stapler • string • soil • grass seed • stick for a perch • paint or other decorations
Instructions:1. Staple the top of the carton closed (if needed).2. Cut off the bottom of the carton and flip it over to make
a flat tray. Staple to the bottom of the carton as shown.3. Use the scissors or a nail to (carefully) make a few small
drainage holes around the side of the tray, and two larger holes to attach the string for hanging.
4. Cut a hole in one side of the carton for the birds to enter.5. Decorate the outside and add the perch.6. Add the soil to the tray, sprinkling seeds on top.7. Water your green roof (not too much) and watch as it
grows!
Have you ever seen a roof with trees and plants growing out of it – on purpose? Many materials like tile and shingles absorb heat during the day and release it at night, making cities warmer. One solution to this problem is to build green roofs.
Like giant planter boxes, green roofs replace solid roof surfaces with soil and plants. This helps moderate a build-ing’s temperature and allows water to soak in rather than run off.
Green roofs adjust to create an ideal surface for each season. The plants shed their leaves in the winter, revealing dark soil that absorbs energy and keeps the building warmer. In the summer, the plants provide shade and give off water vapor, keeping the roof surface and the inside of the building cooler.
Not only do green roofs reduce energy use for heating and cooling in individual buildings, they can also help cool the city. Green roofs are one way to reduce the effects of urban heat islands. — K. Weaver
Green Roof Neighborhood
This special apartment building in a suburb of Copenhagen, Denmark is called “8 House” due to it’s unique shape – it looks like the number 8 from above. Another thing that is special about this building is what is growing on top. The "8 House" has grassy/mossy vegetation growing on its sloped roofs.
Be Inspired:Try making a green roof for a larger birdhouse, a doghouse, or a shed (with adult permission, of course). What might you have to do differently for a larger roof? For example, how much weight can the roof structure support? What could you use for drainage under the plants?
Green Roof
BirdhouseMaker Corner
12
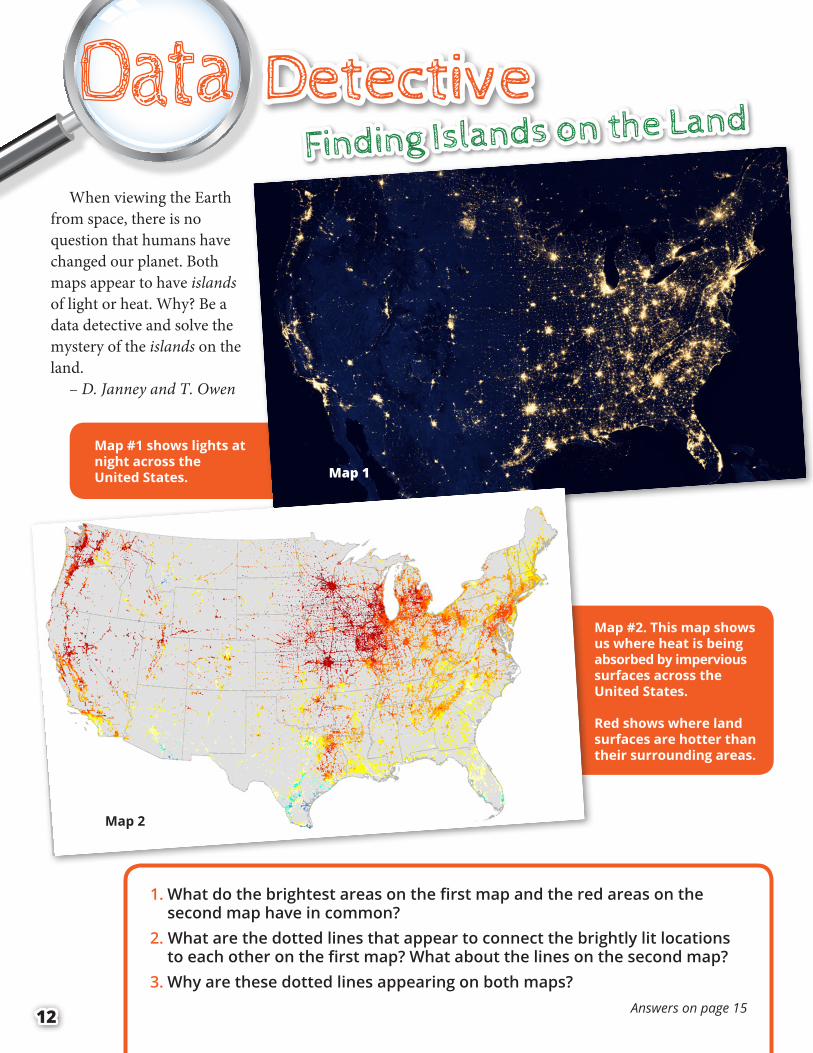
Map #2. This map shows us where heat is being absorbed by impervious surfaces across the United States.
Red shows where land surfaces are hotter than their surrounding areas.
1. What do the brightest areas on the first map and the red areas on the second map have in common?
2. What are the dotted lines that appear to connect the brightly lit locations to each other on the first map? What about the lines on the second map?
3. Why are these dotted lines appearing on both maps?
Map #1 shows lights at night across the United States.
Answers on page 15
Map 1
Map 2
When viewing the Earth from space, there is no question that humans have changed our planet. Both maps appear to have islands of light or heat. Why? Be a data detective and solve the mystery of the islands on the land.
– D. Janney and T. Owen
DetectiveFinding Islands on the Land

13
What you need:• infrared thermometer (available from hardware
stores for about $15)• pencil • data table• five different types of materials found outside:
grass, pavement (driveway, road), sidewalk, plant (tree or bush), and bare soil
Experiment:1. Using the infrared thermometer, measure the
temperature of each material during the day when it is in direct sunlight. Record the temperature for each object in the first row of the data table.
2. Wait for the Sun to set.3. Measure the temperature of each surface an hour
after sunset. Record the temperature for each object in the second row of the data table below.
4. Subtract the temperature of each material after dark from the temperature observed during day-light. Record this temperature difference in the bottom row of the data table.
Conclude:1. Which three materials retained the most heat (changed the least)? 2. Which two materials radiated the most heat (were warmest) at night? 3. Which two materials absorbed heat the most readily (warmest daytime temperatures)?
Answers on page 15.
Why do you think grass feels cooler than pavement? And how are materials in a city different from those you find in rural and wild areas? The answer is that the materials in our neighborhoods retain, absorb, and radiate heat differently. —D. Janney
Take measurements of the rest of the
materials — grass, soil, pavement, and
sidewalk. Repeat after sunset.
Use the infrared thermometer to measure the temperature of a plant.
temperature in the sunlight (°C)
temperature in the dark (°C)
difference in temperature (°C)
soil grassplantDATA TABLE pavement sidewalk
A Mini Urban Heat Island DIY Science

14
Do you ever wish you could see into the future? Dr. Lahouari Bounoua from NASA’s Goddard Space Flight Center may not have a
crystal ball, but he does make computer models that can predict how hot cities will be in the future.
Using ComputersBounoua has spent hours in front of his computer
screen writing algorithms to model how much cities warm up compared to the natural environment within which they are built. The programs he creates look at: how much of a city is covered by cement, as-
phalt, tar, and other impervious materials; the type of forest, grasslands, or desert around the city; and the size and color of the city. He noticed that when any of these things change, the temperature of the city gets cooler or warmer. For example, if the area covered by impervious materials increases, the city becomes warmer than its surroundings, enhancing the urban heat island effect. Using his algorithm, Bounoua can input possible changes – adding more plants and trees, removing paved areas – to model temperature changes for a city. This is useful information that can be used by city planners.
From space, cities appear in different colors depending on the type of building materials that are used. Cities that use a lot of asphalt appear darker than cities that use concrete. This is because asphalt is black and concrete is gray. Dark building materials absorb a lot of heat energy from the Sun and make these cities warmer than their surroundings. On the other hand, people living around the Mediterranean Sea often paint their buildings white, which reflects more sunlight and keeps the cities a little cooler.
Color of the City
Can you spot the cities in this satellite image of the island of Santorini, Greece? What color are these cities compared to Amsterdam?
Can you see the different shades of gray in this image of Amsterdam from space?
Notes From the FieldComputer Modeling

15
Dr. Lahouari Bounoua from NASA’s Goddard Space Flight Center
Modeling City Temperatures with Climate Changes
As greenhouse gases increase, so do temperatures around the world – which means the temperatures in our cities will be even higher. Using his computer model, ground measurements, and NASA satellite data, Bounoua can look at how climate change and urban heat islands are related. His models could be used by city planners to forecast how local temperatures might change and how new construction of buildings and parks will affect temperatures. Then, they can develop a better way to use the land – where to build houses or malls, where to make parks and green-spaces – and keep temperatures in balance.
DIY Science: 1. Grass, soil, and plants retain
the most heat. They have the smallest temperature change from sunlight to darkness.
2. Pavement and sidewalks are dark and absorb energy from the Sun during the day and then emit the energy as heat at night when the Sun is no longer providing energy for them to absorb.
3. Pavement and sidewalk ab-sorb the most heat. They are warmest in the sunlight.
Data Detective: 1. They are located in areas
where there are large cities.2. The lines on the first map
show city lights along major highways and freeways. The lines on the second map show warm impervious sur-faces from the pavement that make up those highways and freeways and the small cities that line them.
3. Cities, which appear as bright lights from space, line ma-jor highways and freeways and are warmer than their surroundings because their impervious surfaces absorb heat.
Data Viz:1. 58 squares long x 38 squares
wide = 2,204 squares. 2,204 squares × 9.6 km2 = 21,158 km2
2. 1,135 bright and dark red squares x 9.6 km2= 10,896 km2
3. 10,896 km2 ÷ 21,158 km2 × 100 = 51%
4. Yes. 51% is greater than 35%.
Where on Earth?London, England
Answers
Vocabulary:Algorithm: A set of steps you follow to get a result. You have steps that you follow to get the correct answer on a math problem. A computer can solve math and other problems by using a set of steps.
Model: A computer program that uses algorithms to simulate what may happen if certain things (wind, temperature, etc.) change.
Why Study Urban Heat Islands? Rising city temperatures can be a real threat to
people because heat waves can be deadly. “We live in cities. We want to understand how cities as ecosystems interact with the environment, how they modify it, and what we can do about it,” says Bounoua. “We study urban heat islands to help people. If your grandma doesn’t have air conditioning, it’s a real health concern.”
— T. Owen
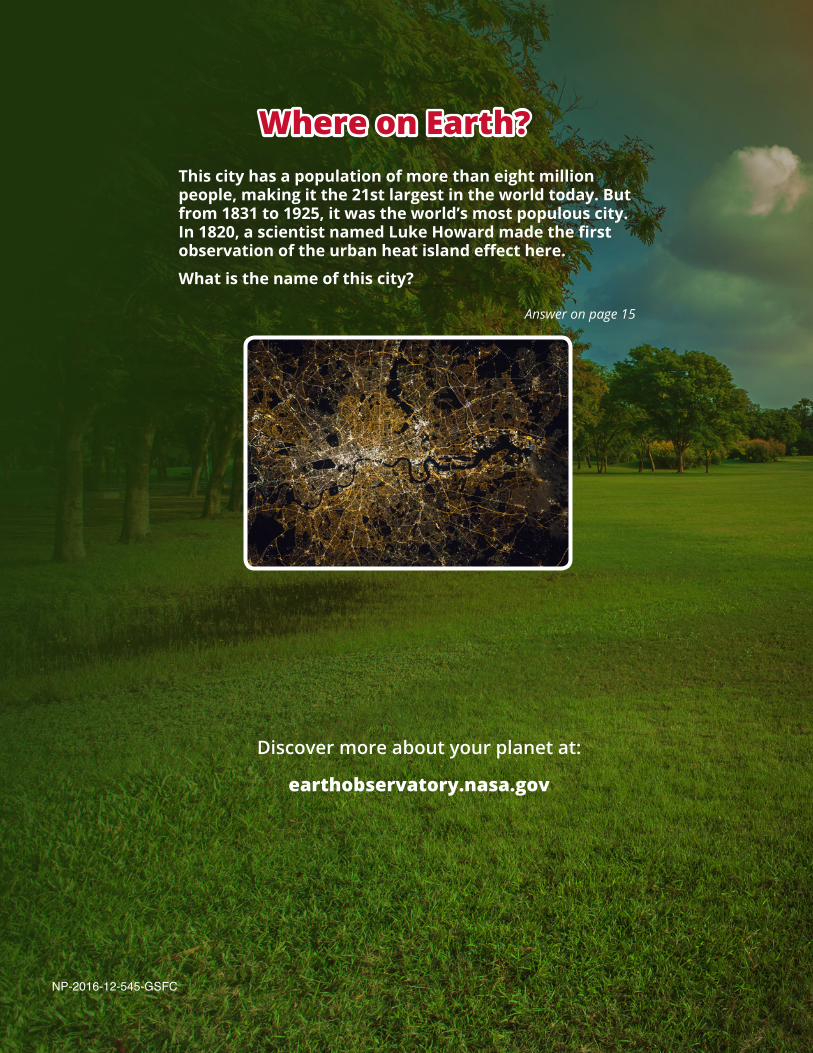
This city has a population of more than eight million people, making it the 21st largest in the world today. But from 1831 to 1925, it was the world’s most populous city. In 1820, a scientist named Luke Howard made the first observation of the urban heat island effect here.
What is the name of this city?
Answer on page 15
Discover more about your planet at:
earthobservatory.nasa.gov
NP-2016-12-545-GSFC
Where on Earth?