hot spots and labyrinths: why neuromodulation devices for episodic
TRANSCRIPT

Hot spots and labyrinths: Whyneuromodulation devices for episodicmigraine should be personalizedMarkus A Dahlem1,2,†, Bernd Schmidt1, Ingo Bojak3, Sebastian Boie4,Frederike Kneer5, Nouchine Hadjikhani6,7, and Jurgen Kurths8,9
1Department of Physics, Humboldt-Universitat zu Berlin, Berlin, Germany.2Department of Biological Physik, Max Planck Institute for the Physics of Complex Systems,Dresden, Germany.3Cybernetics Research Group, School of Systems Engineering, University of Reading,Reading, UK.4Department of Mathematics, The University of Auckland, Auckland, New Zealand.5Department of Software Engineering and Theoretical Computer Science, TechnischeUniversitat Berlin, Berlin, Germany.6Martinos Center for Biomedical Imaging, Massachusetts General Hospital, Harvard MedicalSchool, Charlestown, Massachusetts, USA.7GNC, Sahlgrenska Academy, University of Gothenburg, Sweden.8Potsdam Institute for Climate Impact Research, 14473 Potsdam, Germany.9Institute for Complex Systems and Mathematical Biology, University of Aberdeen, AberdeenAB24 3UE, United Kingdom.†Corresponding author; [email protected]
ABSTRACT
Stimulation protocols for medical devices should be rationally designed. For episodic migrainewith aura we outline model-based design strategies towards preventive and acute therapiesusing stereotactic neuromodulation. To this end, we regard a localized spreading depression(SD) wave segment as a central element in migraine pathophysiology. To describe nucleationand propagation features of the SD wave segment, we define the new concepts of cortical hotspots and labyrinths, respectively. In particular, we firstly focus exclusively on curvature-induceddynamical properties by studying a generic reaction-diffusion model of SD on the folded corticalsurface. This surface is described with increasing level of details, including finally personalizedsimulations using patient’s magnetic resonance imaging (MRI) scanner readings. At this stage,the only relevant factor that can modulate nucleation and propagation paths is the Gaussiancurvature, which has the advantage of being rather readily accessible by MRI. We concludewith discussing further anatomical factors, such as areal, laminar, and cellular heterogeneity,that in addition to and in relation to Gaussian curvature determine the generalized conceptof cortical hot spots and labyrinths as target structures for neuromodulation.Our numericalsimulations suggest that these target structures are like fingerprints, they are individual featuresof each migraine sufferer. The goal in the future will be to provide individualized neural tissuesimulations. These simulations should predict the clinical data and therefore can also serve asa test bed for exploring stereotactic neuromodulation.
Keywords: migraine, reaction-diffusion, spreading depression, gyrification, neuromodulation
1 INTRODUCTION
Migraine is characterized by recurrent episodes of head pain, often unilateral, with a prevalenceof about 14% in the population, and up to 18% in women (Stovner et al., 2007). In one thirdof the cases migraine involves additional neurological symptoms, called aura. The neuronal
PeerJ PrePrints | http://dx.doi.org/10.7287/peerj.preprints.515v1 | CC-BY 4.0 Open Access | rec: 26 Sep 2014, publ: 26 Sep 2014
PrePrin
ts
correlate of the aura is spreading depression (SD), a propagating wave of massive disruption incortical ion and water homeostasis. In the afthermath, SD may also cause the migraine pain byan inflammatory signaling cascade from metabolically stressed neurons to trigeminal afferents inthe dura (Karatas et al., 2013).
Based upon migraine aura symptoms reports like those shown in Fig. 1, it has been questionedwhether SD spreads concentrically in all directions (Wilkinson, 2004). Instead it was suggestedthat SD in the human cortex propagates as a localized small wave segment following only onedirection (Dahlem and Muller, 2004; Dahlem and Chronicle, 2004; Dahlem and Hadjikhani,2009). A spatially more restricted SD pattern could result in less symptomatic expression andresolve why such a profound electrophysiological event, which SD clearly is, causes rather minorneurological symptoms (Charles and Baca, 2013). If that is the case, there should be an entirelynew approach selectively targeting the specific paths of the SD wave segment and thus limitingits noxious effects.
There is strong evidence for localized SD patterns from five different lines of investigation.First, the spatio-temporal development of migraine aura symptoms in the visual field is oftenlocalized (Poppel, 1973; Grusser, 1995; Wilkinson, 2004; Dahlem and Hadjikhani, 2009; Hansenet al., 2013). This regards retinotopy as a single sensory modality (Fig. 1a,b). Second, aurasymptoms follow distinct though from attack to attack variable paths when mapped onto thecortical surface across sensory and cognitive modalities (Vincent and Hadjikhani, 2007). Third,we previously suggested a mechanism in a generic mathematical reaction-diffusion model(Dahlem and Isele, 2013; Dahlem, 2013) that can explain the large variety of SD patternsobserved (Hansen et al., 2013) as large-amplitude fluctuations that are critically slowed down.This mechanism links the fact that SD patterns in migraine are transient to spatial confinementin the shape of wave segments. This mechanism also proposes the existence of a more globalinhibitory signal—likely established by neurovascular coupling—that merely modulates thespread of SD though it can easily be confused for SD in noninvasive imaging depending onblood flow. Fourth, we investigated how localized patterns are influenced and possibly stabilizedby the intrinsic curvature of the medium using a torus (Kneer et al., 2014). To a certain degreecut outs of toroidal surfaces can approximate the hills and valleys of cortical gyri and sulci. Andfinally fifth, we detected localized and also re-entry and other propagation patterns of SD in
6/27/03 7 am 3/11/04 7:15 pm
14
1312.5
12
11
10
8
7
6
543
1 2 9
15°
30°
45°
15° 0 48
12
16
20
15° 30° 45°
a b c d
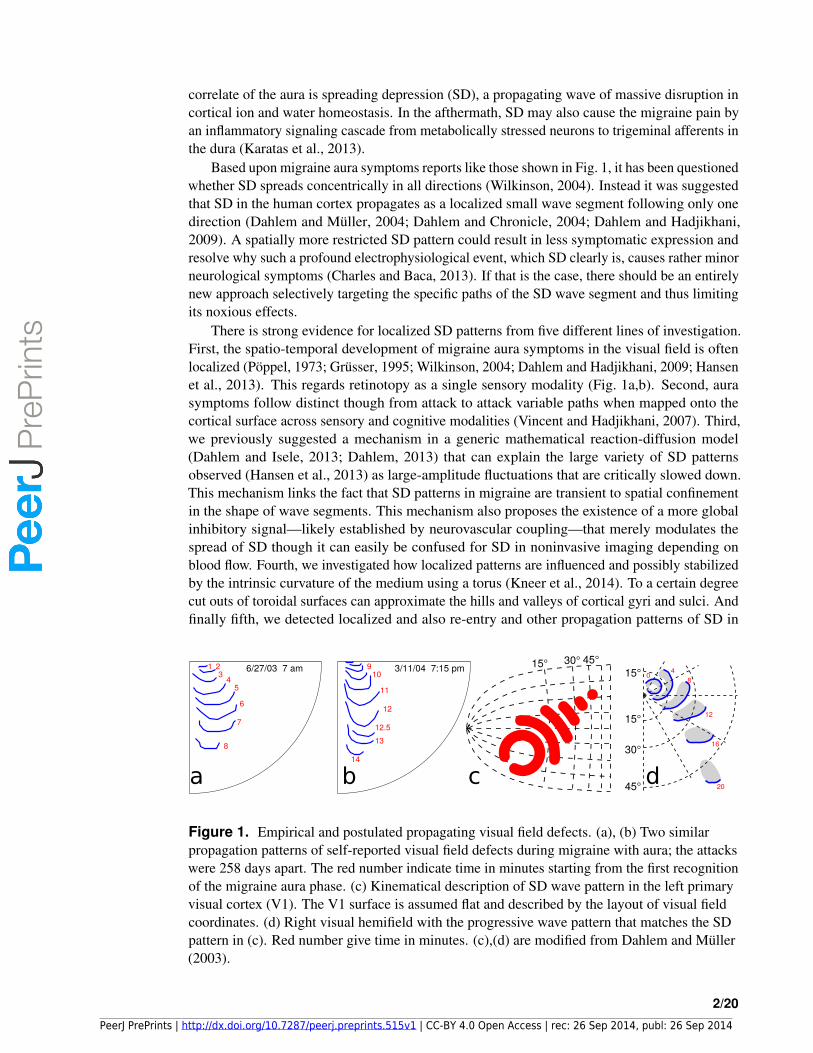
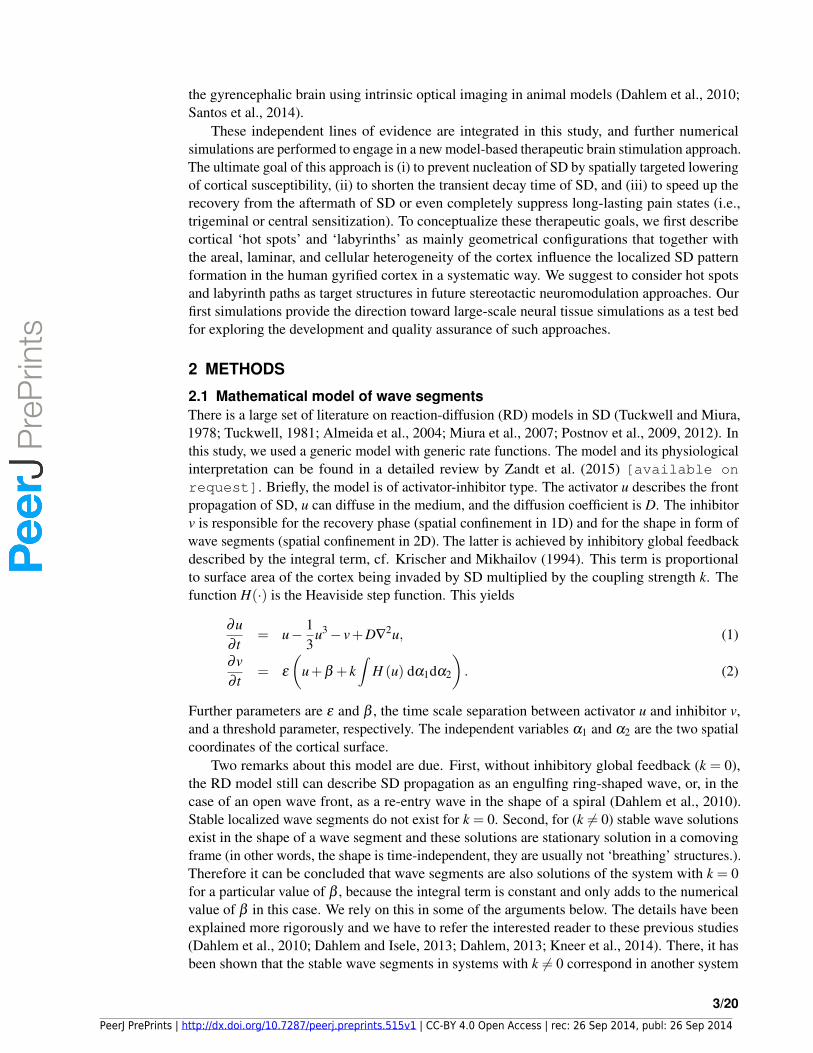
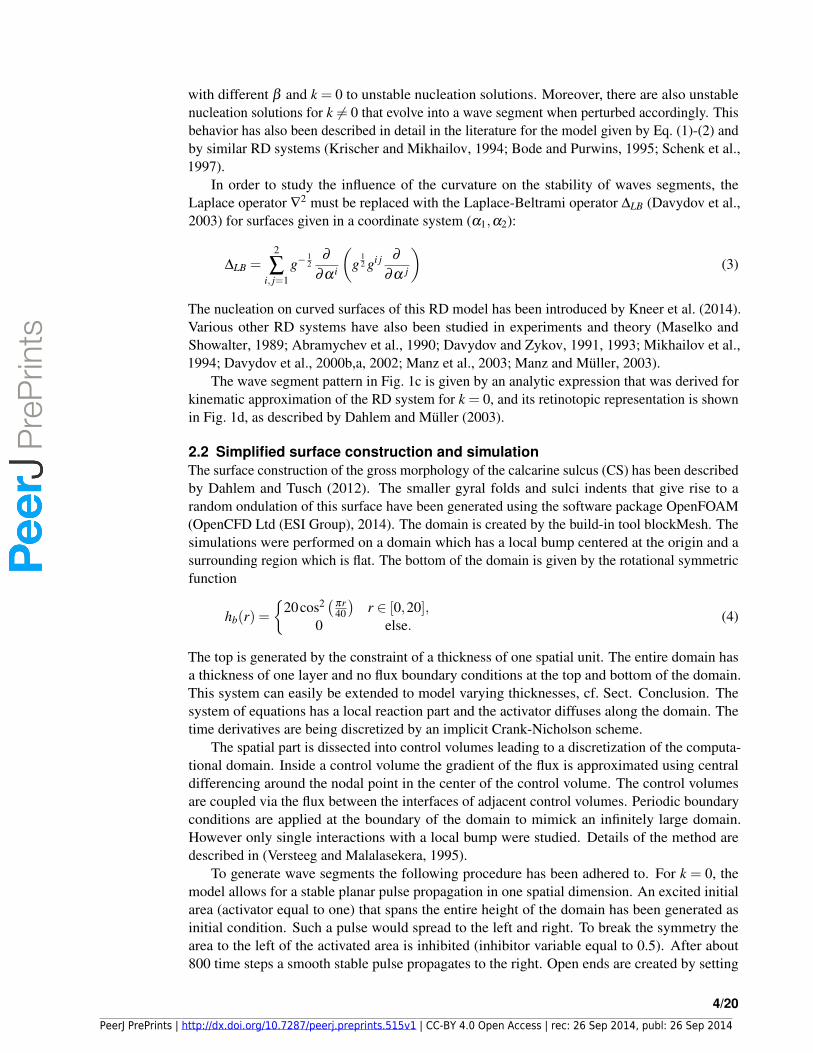
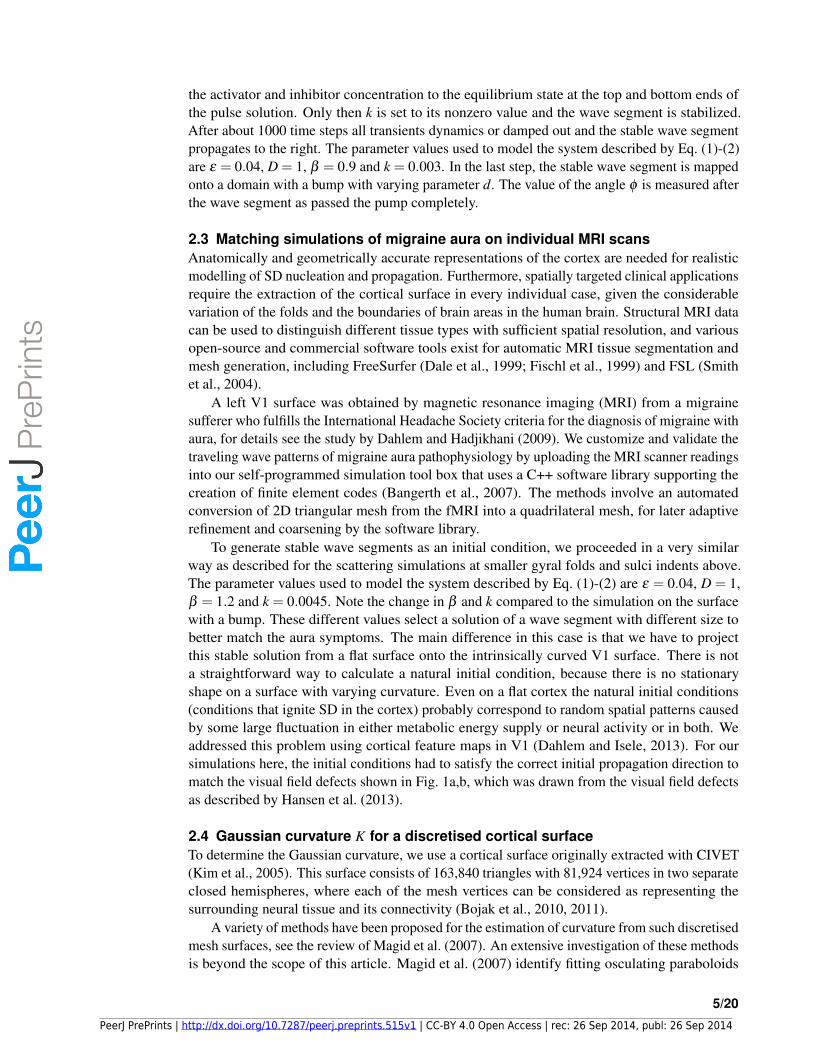
Figure 1. Empirical and postulated propagating visual field defects. (a), (b) Two similarpropagation patterns of self-reported visual field defects during migraine with aura; the attackswere 258 days apart. The red number indicate time in minutes starting from the first recognitionof the migraine aura phase. (c) Kinematical description of SD wave pattern in the left primaryvisual cortex (V1). The V1 surface is assumed flat and described by the layout of visual fieldcoordinates. (d) Right visual hemifield with the progressive wave pattern that matches the SDpattern in (c). Red number give time in minutes. (c),(d) are modified from Dahlem and Muller(2003).
2/20
PeerJ PrePrints | http://dx.doi.org/10.7287/peerj.preprints.515v1 | CC-BY 4.0 Open Access | rec: 26 Sep 2014, publ: 26 Sep 2014
PrePrin
ts
the gyrencephalic brain using intrinsic optical imaging in animal models (Dahlem et al., 2010;Santos et al., 2014).
These independent lines of evidence are integrated in this study, and further numericalsimulations are performed to engage in a new model-based therapeutic brain stimulation approach.The ultimate goal of this approach is (i) to prevent nucleation of SD by spatially targeted loweringof cortical susceptibility, (ii) to shorten the transient decay time of SD, and (iii) to speed up therecovery from the aftermath of SD or even completely suppress long-lasting pain states (i.e.,trigeminal or central sensitization). To conceptualize these therapeutic goals, we first describecortical ‘hot spots’ and ‘labyrinths’ as mainly geometrical configurations that together withthe areal, laminar, and cellular heterogeneity of the cortex influence the localized SD patternformation in the human gyrified cortex in a systematic way. We suggest to consider hot spotsand labyrinth paths as target structures in future stereotactic neuromodulation approaches. Ourfirst simulations provide the direction toward large-scale neural tissue simulations as a test bedfor exploring the development and quality assurance of such approaches.
2 METHODS
2.1 Mathematical model of wave segmentsThere is a large set of literature on reaction-diffusion (RD) models in SD (Tuckwell and Miura,1978; Tuckwell, 1981; Almeida et al., 2004; Miura et al., 2007; Postnov et al., 2009, 2012). Inthis study, we used a generic model with generic rate functions. The model and its physiologicalinterpretation can be found in a detailed review by Zandt et al. (2015) [available onrequest]. Briefly, the model is of activator-inhibitor type. The activator u describes the frontpropagation of SD, u can diffuse in the medium, and the diffusion coefficient is D. The inhibitorv is responsible for the recovery phase (spatial confinement in 1D) and for the shape in form ofwave segments (spatial confinement in 2D). The latter is achieved by inhibitory global feedbackdescribed by the integral term, cf. Krischer and Mikhailov (1994). This term is proportionalto surface area of the cortex being invaded by SD multiplied by the coupling strength k. Thefunction H(·) is the Heaviside step function. This yields
∂u∂ t
= u− 13
u3− v+D∇2u, (1)
∂v∂ t
= ε
(u+β + k
∫H (u) dα1dα2
). (2)
Further parameters are ε and β , the time scale separation between activator u and inhibitor v,and a threshold parameter, respectively. The independent variables α1 and α2 are the two spatialcoordinates of the cortical surface.
Two remarks about this model are due. First, without inhibitory global feedback (k = 0),the RD model still can describe SD propagation as an engulfing ring-shaped wave, or, in thecase of an open wave front, as a re-entry wave in the shape of a spiral (Dahlem et al., 2010).Stable localized wave segments do not exist for k = 0. Second, for (k 6= 0) stable wave solutionsexist in the shape of a wave segment and these solutions are stationary solution in a comovingframe (in other words, the shape is time-independent, they are usually not ‘breathing’ structures.).Therefore it can be concluded that wave segments are also solutions of the system with k = 0for a particular value of β , because the integral term is constant and only adds to the numericalvalue of β in this case. We rely on this in some of the arguments below. The details have beenexplained more rigorously and we have to refer the interested reader to these previous studies(Dahlem et al., 2010; Dahlem and Isele, 2013; Dahlem, 2013; Kneer et al., 2014). There, it hasbeen shown that the stable wave segments in systems with k 6= 0 correspond in another system
3/20
PeerJ PrePrints | http://dx.doi.org/10.7287/peerj.preprints.515v1 | CC-BY 4.0 Open Access | rec: 26 Sep 2014, publ: 26 Sep 2014
PrePrin
ts
with different β and k = 0 to unstable nucleation solutions. Moreover, there are also unstablenucleation solutions for k 6= 0 that evolve into a wave segment when perturbed accordingly. Thisbehavior has also been described in detail in the literature for the model given by Eq. (1)-(2) andby similar RD systems (Krischer and Mikhailov, 1994; Bode and Purwins, 1995; Schenk et al.,1997).
In order to study the influence of the curvature on the stability of waves segments, theLaplace operator ∇2 must be replaced with the Laplace-Beltrami operator ∆LB (Davydov et al.,2003) for surfaces given in a coordinate system (α1,α2):
∆LB =2
∑i, j=1
g−12
∂
∂α i
(g
12 gi j ∂
∂α j
)(3)
The nucleation on curved surfaces of this RD model has been introduced by Kneer et al. (2014).Various other RD systems have also been studied in experiments and theory (Maselko andShowalter, 1989; Abramychev et al., 1990; Davydov and Zykov, 1991, 1993; Mikhailov et al.,1994; Davydov et al., 2000b,a, 2002; Manz et al., 2003; Manz and Muller, 2003).
The wave segment pattern in Fig. 1c is given by an analytic expression that was derived forkinematic approximation of the RD system for k = 0, and its retinotopic representation is shownin Fig. 1d, as described by Dahlem and Muller (2003).
2.2 Simplified surface construction and simulationThe surface construction of the gross morphology of the calcarine sulcus (CS) has been describedby Dahlem and Tusch (2012). The smaller gyral folds and sulci indents that give rise to arandom ondulation of this surface have been generated using the software package OpenFOAM(OpenCFD Ltd (ESI Group), 2014). The domain is created by the build-in tool blockMesh. Thesimulations were performed on a domain which has a local bump centered at the origin and asurrounding region which is flat. The bottom of the domain is given by the rotational symmetricfunction
hb(r) ={
20cos2(
πr40
)r ∈ [0,20],
0 else.(4)
The top is generated by the constraint of a thickness of one spatial unit. The entire domain hasa thickness of one layer and no flux boundary conditions at the top and bottom of the domain.This system can easily be extended to model varying thicknesses, cf. Sect. Conclusion. Thesystem of equations has a local reaction part and the activator diffuses along the domain. Thetime derivatives are being discretized by an implicit Crank-Nicholson scheme.
The spatial part is dissected into control volumes leading to a discretization of the computa-tional domain. Inside a control volume the gradient of the flux is approximated using centraldifferencing around the nodal point in the center of the control volume. The control volumesare coupled via the flux between the interfaces of adjacent control volumes. Periodic boundaryconditions are applied at the boundary of the domain to mimick an infinitely large domain.However only single interactions with a local bump were studied. Details of the method aredescribed in (Versteeg and Malalasekera, 1995).
To generate wave segments the following procedure has been adhered to. For k = 0, themodel allows for a stable planar pulse propagation in one spatial dimension. An excited initialarea (activator equal to one) that spans the entire height of the domain has been generated asinitial condition. Such a pulse would spread to the left and right. To break the symmetry thearea to the left of the activated area is inhibited (inhibitor variable equal to 0.5). After about800 time steps a smooth stable pulse propagates to the right. Open ends are created by setting
4/20
PeerJ PrePrints | http://dx.doi.org/10.7287/peerj.preprints.515v1 | CC-BY 4.0 Open Access | rec: 26 Sep 2014, publ: 26 Sep 2014
PrePrin
ts
the activator and inhibitor concentration to the equilibrium state at the top and bottom ends ofthe pulse solution. Only then k is set to its nonzero value and the wave segment is stabilized.After about 1000 time steps all transients dynamics or damped out and the stable wave segmentpropagates to the right. The parameter values used to model the system described by Eq. (1)-(2)are ε = 0.04, D = 1, β = 0.9 and k = 0.003. In the last step, the stable wave segment is mappedonto a domain with a bump with varying parameter d. The value of the angle φ is measured afterthe wave segment as passed the pump completely.
2.3 Matching simulations of migraine aura on individual MRI scansAnatomically and geometrically accurate representations of the cortex are needed for realisticmodelling of SD nucleation and propagation. Furthermore, spatially targeted clinical applicationsrequire the extraction of the cortical surface in every individual case, given the considerablevariation of the folds and the boundaries of brain areas in the human brain. Structural MRI datacan be used to distinguish different tissue types with sufficient spatial resolution, and variousopen-source and commercial software tools exist for automatic MRI tissue segmentation andmesh generation, including FreeSurfer (Dale et al., 1999; Fischl et al., 1999) and FSL (Smithet al., 2004).
A left V1 surface was obtained by magnetic resonance imaging (MRI) from a migrainesufferer who fulfills the International Headache Society criteria for the diagnosis of migraine withaura, for details see the study by Dahlem and Hadjikhani (2009). We customize and validate thetraveling wave patterns of migraine aura pathophysiology by uploading the MRI scanner readingsinto our self-programmed simulation tool box that uses a C++ software library supporting thecreation of finite element codes (Bangerth et al., 2007). The methods involve an automatedconversion of 2D triangular mesh from the fMRI into a quadrilateral mesh, for later adaptiverefinement and coarsening by the software library.
To generate stable wave segments as an initial condition, we proceeded in a very similarway as described for the scattering simulations at smaller gyral folds and sulci indents above.The parameter values used to model the system described by Eq. (1)-(2) are ε = 0.04, D = 1,β = 1.2 and k = 0.0045. Note the change in β and k compared to the simulation on the surfacewith a bump. These different values select a solution of a wave segment with different size tobetter match the aura symptoms. The main difference in this case is that we have to projectthis stable solution from a flat surface onto the intrinsically curved V1 surface. There is nota straightforward way to calculate a natural initial condition, because there is no stationaryshape on a surface with varying curvature. Even on a flat cortex the natural initial conditions(conditions that ignite SD in the cortex) probably correspond to random spatial patterns causedby some large fluctuation in either metabolic energy supply or neural activity or in both. Weaddressed this problem using cortical feature maps in V1 (Dahlem and Isele, 2013). For oursimulations here, the initial conditions had to satisfy the correct initial propagation direction tomatch the visual field defects shown in Fig. 1a,b, which was drawn from the visual field defectsas described by Hansen et al. (2013).
2.4 Gaussian curvature K for a discretised cortical surfaceTo determine the Gaussian curvature, we use a cortical surface originally extracted with CIVET(Kim et al., 2005). This surface consists of 163,840 triangles with 81,924 vertices in two separateclosed hemispheres, where each of the mesh vertices can be considered as representing thesurrounding neural tissue and its connectivity (Bojak et al., 2010, 2011).
A variety of methods have been proposed for the estimation of curvature from such discretisedmesh surfaces, see the review of Magid et al. (2007). An extensive investigation of these methodsis beyond the scope of this article. Magid et al. (2007) identify fitting osculating paraboloids
5/20
PeerJ PrePrints | http://dx.doi.org/10.7287/peerj.preprints.515v1 | CC-BY 4.0 Open Access | rec: 26 Sep 2014, publ: 26 Sep 2014
PrePrin
ts
as the method of choice if one wants to employ only one method, due to its good stability,convergence and accuracy. This method also has the advantage of conceptional simplicity andcomputational speed. Essentially, to compute the curvatures at a specific vertex, its coordinatesand those of its immediate neighbours are transformed by translation and rotation so that thevertex is now located at the origin and the surface normal at the target vertex coalesces withthe z-axis. This surface normal can be estimated as the average of the normals of the trianglesthat the vertex forms with its neighbours. Then a least square fit of the canonical parabolicform z = ax2 +bxy+ cy2 to the vertex and its surrounding neighbours is performed, making theresulting paraboloid optimally osculate, i.e., be as near as possible to all these vertices. Fromthe resulting fit values the mean H = a+ c and Gaussian K = 4ac−b2 curvatures, respectively,can be obtained directly. If needed, the principal curvatures κ1,2 = H±
√H2−K are easily
computed from these values. Overall, the method hence consists in estimating the curvatures at amesh point by identifying them with the curvatures of a locally fitted paraboloid.
In practice, mesh surfaces obtained from MRI tissue segmentation are uneven at the scalesof the original voxels, since the tissue interfaces may pass through a voxel at various levels andangles, and in addition can suffer from overfitting leading to artificial ripples in the extractedsurfaces. To guard against overestimating the curvature due to such artefacts, we have employedthe following procedure here: We estimate the curvature not only from the vertex and itssurrounding ring of nearest neighbours (yielding H and K), but also from the same vertex andthe surrounding ring of next-to-nearest neighbours (yielding H and K), i.e, from target vertexand the ring formed by the neighbours of the neighbours of the target vertex, where that ringobviously excludes the target vertex itself. We now consider the difference of these estimatesδH = H− H and δK = K− K, respectively, across all n = 81,924 vertices and use Chauvenet’scriterion to detect outliers in these differences: Given the mean µδH and standard deviationσδH of the δH, we consider as outliers those points where n · erfc(|δH−µδH |/σδH)< 0.5. Atregular points we use the H, whereas at outlier points we use whichever value is smaller, H or H.The same procedure is used to determine whether K or K should be used. This method providesa conservative estimate of the curvature suppressing local artefacts. For the particular surfaceused here, 1.4% of vertices were outliers in H, and 0.8% in K, thus the surface for the most partproved to be smooth.
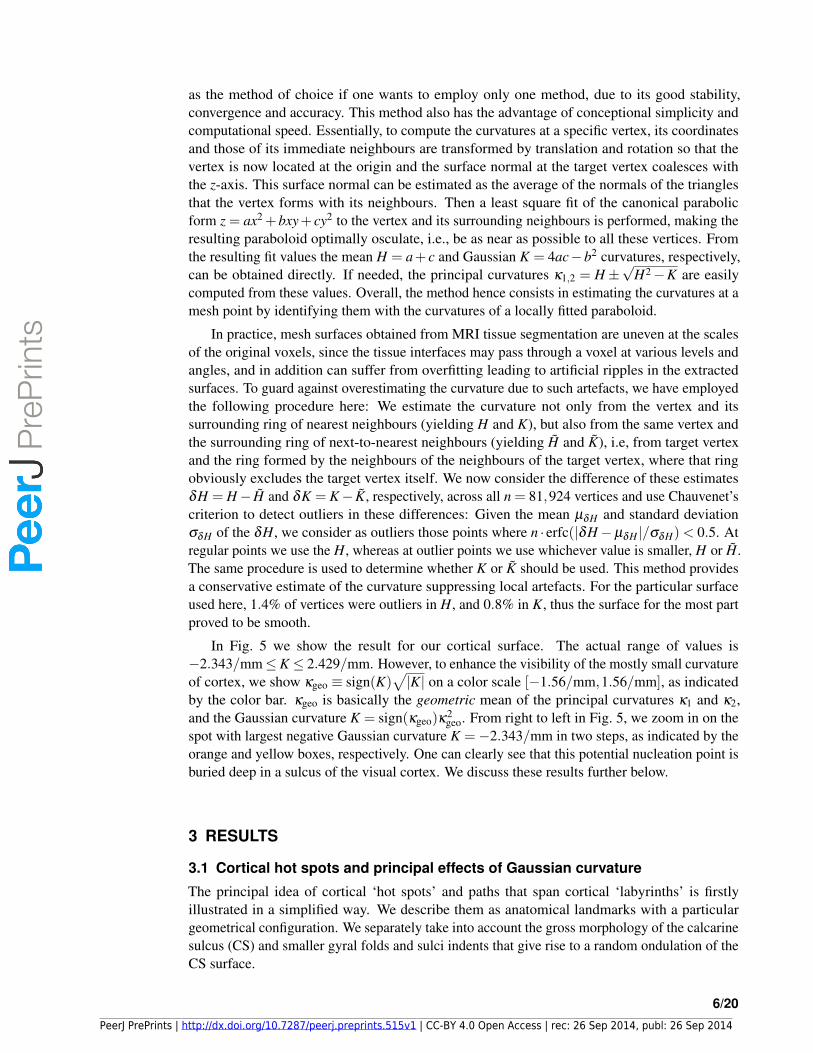
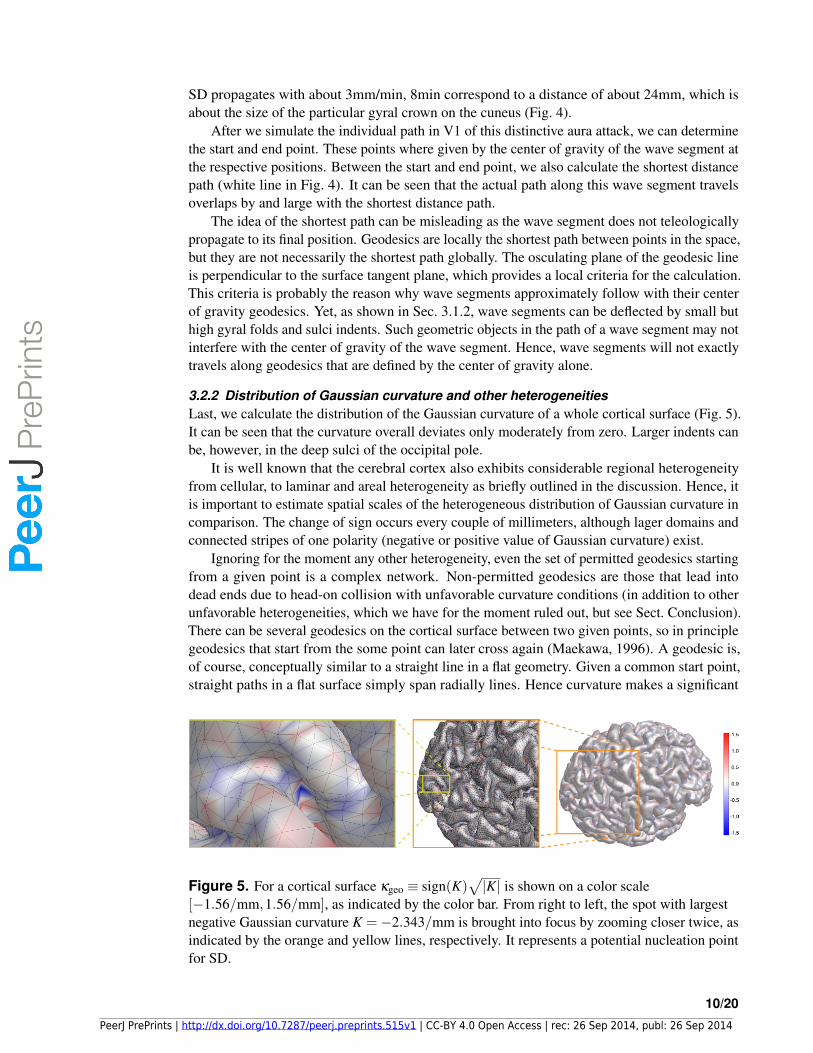
In Fig. 5 we show the result for our cortical surface. The actual range of values is−2.343/mm≤K ≤ 2.429/mm. However, to enhance the visibility of the mostly small curvatureof cortex, we show κgeo ≡ sign(K)
√|K| on a color scale [−1.56/mm,1.56/mm], as indicated
by the color bar. κgeo is basically the geometric mean of the principal curvatures κ1 and κ2,and the Gaussian curvature K = sign(κgeo)κ
2geo. From right to left in Fig. 5, we zoom in on the
spot with largest negative Gaussian curvature K =−2.343/mm in two steps, as indicated by theorange and yellow boxes, respectively. One can clearly see that this potential nucleation point isburied deep in a sulcus of the visual cortex. We discuss these results further below.
3 RESULTS
3.1 Cortical hot spots and principal effects of Gaussian curvature
The principal idea of cortical ‘hot spots’ and paths that span cortical ‘labyrinths’ is firstlyillustrated in a simplified way. We describe them as anatomical landmarks with a particulargeometrical configuration. We separately take into account the gross morphology of the calcarinesulcus (CS) and smaller gyral folds and sulci indents that give rise to a random ondulation of theCS surface.
6/20
PeerJ PrePrints | http://dx.doi.org/10.7287/peerj.preprints.515v1 | CC-BY 4.0 Open Access | rec: 26 Sep 2014, publ: 26 Sep 2014
PrePrin
ts
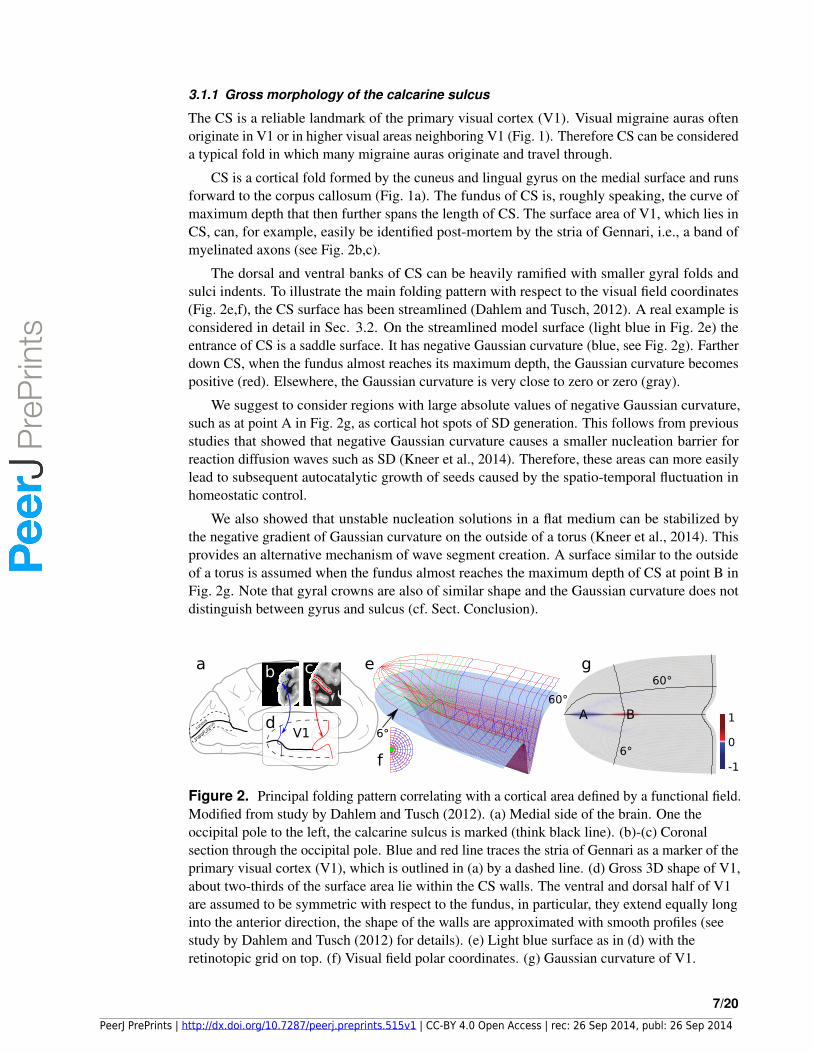
3.1.1 Gross morphology of the calcarine sulcus
The CS is a reliable landmark of the primary visual cortex (V1). Visual migraine auras oftenoriginate in V1 or in higher visual areas neighboring V1 (Fig. 1). Therefore CS can be considereda typical fold in which many migraine auras originate and travel through.
CS is a cortical fold formed by the cuneus and lingual gyrus on the medial surface and runsforward to the corpus callosum (Fig. 1a). The fundus of CS is, roughly speaking, the curve ofmaximum depth that then further spans the length of CS. The surface area of V1, which lies inCS, can, for example, easily be identified post-mortem by the stria of Gennari, i.e., a band ofmyelinated axons (see Fig. 2b,c).
The dorsal and ventral banks of CS can be heavily ramified with smaller gyral folds andsulci indents. To illustrate the main folding pattern with respect to the visual field coordinates(Fig. 2e,f), the CS surface has been streamlined (Dahlem and Tusch, 2012). A real example isconsidered in detail in Sec. 3.2. On the streamlined model surface (light blue in Fig. 2e) theentrance of CS is a saddle surface. It has negative Gaussian curvature (blue, see Fig. 2g). Fartherdown CS, when the fundus almost reaches its maximum depth, the Gaussian curvature becomespositive (red). Elsewhere, the Gaussian curvature is very close to zero or zero (gray).
We suggest to consider regions with large absolute values of negative Gaussian curvature,such as at point A in Fig. 2g, as cortical hot spots of SD generation. This follows from previousstudies that showed that negative Gaussian curvature causes a smaller nucleation barrier forreaction diffusion waves such as SD (Kneer et al., 2014). Therefore, these areas can more easilylead to subsequent autocatalytic growth of seeds caused by the spatio-temporal fluctuation inhomeostatic control.
We also showed that unstable nucleation solutions in a flat medium can be stabilized bythe negative gradient of Gaussian curvature on the outside of a torus (Kneer et al., 2014). Thisprovides an alternative mechanism of wave segment creation. A surface similar to the outsideof a torus is assumed when the fundus almost reaches the maximum depth of CS at point B inFig. 2g. Note that gyral crowns are also of similar shape and the Gaussian curvature does notdistinguish between gyrus and sulcus (cf. Sect. Conclusion).
6°
60°
6°
60°
1
0
-1
V1cu
neus
lingual
gyr
us
A B
b c
d
a e
f
g
Figure 2. Principal folding pattern correlating with a cortical area defined by a functional field.Modified from study by Dahlem and Tusch (2012). (a) Medial side of the brain. One theoccipital pole to the left, the calcarine sulcus is marked (think black line). (b)-(c) Coronalsection through the occipital pole. Blue and red line traces the stria of Gennari as a marker of theprimary visual cortex (V1), which is outlined in (a) by a dashed line. (d) Gross 3D shape of V1,about two-thirds of the surface area lie within the CS walls. The ventral and dorsal half of V1are assumed to be symmetric with respect to the fundus, in particular, they extend equally longinto the anterior direction, the shape of the walls are approximated with smooth profiles (seestudy by Dahlem and Tusch (2012) for details). (e) Light blue surface as in (d) with theretinotopic grid on top. (f) Visual field polar coordinates. (g) Gaussian curvature of V1.
7/20
PeerJ PrePrints | http://dx.doi.org/10.7287/peerj.preprints.515v1 | CC-BY 4.0 Open Access | rec: 26 Sep 2014, publ: 26 Sep 2014
PrePrin
ts

3.1.2 Single sulci indentBefore we consider in detail the influence of randomly changing negative and positive Gaussiancurvature in real cortical surfaces, we describe the influence of a single sulci indent on anotherwise flat surface. Indents rather small in extent (diameter) but relatively large altitude arenot unsusal, in particular in the deep sulci of the occipital pole. The flat surface can be thoughtof as either the dorsal or ventral bank of CS.
In Fig. 3, we show the scattering effect of a local bump, representing a small sulci indent,on a travelling stable wave segment. Whether stable wave segments were deflected by positiveor negative angles φ (Fig. 3a) depends in a systematic way on the offset d (Fig. 3b). In theexample shown in Fig. 3c-h the stable wave segment is deflected by a positive angle φ . This canintuitively be understood. The near side of the wave segment, with respect to the pump location,has to travel a longer distance and therefore falls behind. The net effect is then a turn towardsthe bump indicated by a positive angle φ . This, however, is easy explanation is only correct to amedium rage of d between value 5 and 15.
For a direct collision (d = 0) or too small an offset (d < 5), however, the stable wave segmentcan even get eradicated (Fig. 3i-q). We call a wave-bump interaction in this range that eradicatesthe wave segment a head-on collision. For example, the wave disappears a few time steps afterthe snapshot shown in Fig. 3q. A bump always causes first a negative Gaussian curvature and thenthe sign of the Gaussian curvature changes (indicated by the dashed line Fig. 3a) and the bumpsurface assumes a positive Gaussian curvature. The critical effect that causes the wave segmentto vanish is due to large size and shape variations. These in turn are due to the rapidly changinggradients in Gaussian curvature in a head-on collision. Note that the size variations continue longafter the bump is passed. This oscillation is called ‘breathing’. It indicates that wave segment isa stable focus in phase space (Strogatz, 1994). The perturbation in a head-on collision, however,has kicked the system out of the basin of attraction of the stable focus. For much smaller bumps(lower altitude) interactions even for d = 0 will only cause perturbation inside the basin ofattraction and therefore not eradicate the wave segment. These would consequently then not becalled a head-on collision, because the segment survives unchanged though it performs dampedbreathing.
Let us briefly describe the mechanism that actually destroys the wave outside the basin ofattraction. For too large an amplitude of the subsequent breathing, propagation is not possibleanymore because the wave size gets too large. The wave size shown in Fig. 3q is a last deep
a
c d e
f g ho p q
l m n
i j k
-10
0
5
10
15
-5
5 10
15
20 25
head-on b
Figure 3. Wave segments deflected by a bump. (a) Scheme with definitions of offset parameterd and deflection angle φ . (b) Deflection angle φ versus offset d. (c)-(h) Numerical simulation ofa positive deflection. (i)-(q) Numerical simulation of head-on collision with wave destruction.
8/20
PeerJ PrePrints | http://dx.doi.org/10.7287/peerj.preprints.515v1 | CC-BY 4.0 Open Access | rec: 26 Sep 2014, publ: 26 Sep 2014
PrePrin
ts
gasp close to the final frontier called propagation boundary, see the review by Zandt et al. (2015)and references therein for details. Briefly, a large wave size leads to increased threshold β byglobal inhibitory feedback described in Eq. 2. Above this well-defined value of the threshold thepropagation becomes impossible. The global inhibitory feedback could stem from dilations ofsurface vessels in regions that show no directly increased neural activity (Gao et al., 2014) andthus have higher resistance against SD invasion (cf. Sect. Conclusion).
For large offsets d, the deflection can be by negative angles φ (Fig. 3b). This can alsointuitively be understood. Only the tip at the open end experiences the geometrical change. Thischange is by a negative Gaussian curvature. Due to the diminished surface area at negativeGaussian curvature, with respect to a flat surface, the tip can more quickly recruit the tissue.This is because in front of the tip the surface area is reduced and by an effective convergence indiffusion this tip grows more than the one on the opposite end. As a result, the wave is deflectedby negative angles φ . The same effect also causes the smaller nucleation barrier at the locationof hot spots.
3.2 Cortical labyrinthsTo introduce the idea of cortical labyrinths, we use real cortical surfaces. First, we consider thecortical area V1 and a simulation of a stable wave segment on this surface. Next, we considerthe whole cortical surface with its heterogeneous distribution of Gaussian curvature.
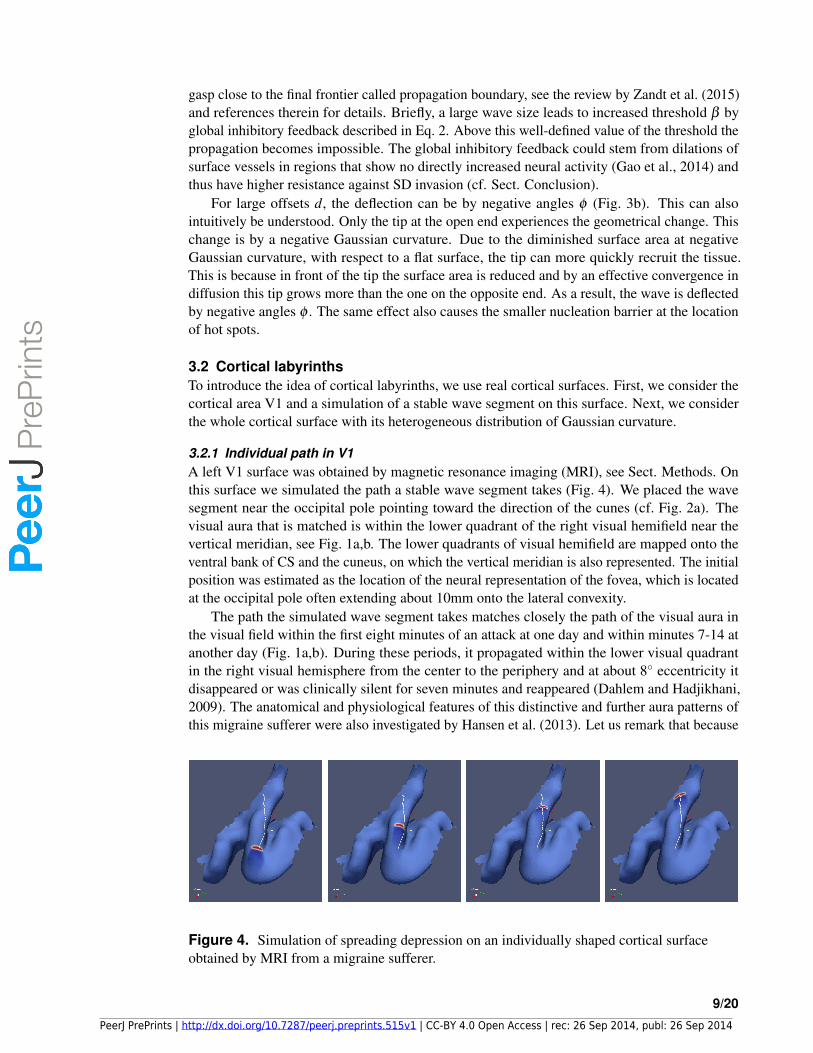
3.2.1 Individual path in V1A left V1 surface was obtained by magnetic resonance imaging (MRI), see Sect. Methods. Onthis surface we simulated the path a stable wave segment takes (Fig. 4). We placed the wavesegment near the occipital pole pointing toward the direction of the cunes (cf. Fig. 2a). Thevisual aura that is matched is within the lower quadrant of the right visual hemifield near thevertical meridian, see Fig. 1a,b. The lower quadrants of visual hemifield are mapped onto theventral bank of CS and the cuneus, on which the vertical meridian is also represented. The initialposition was estimated as the location of the neural representation of the fovea, which is locatedat the occipital pole often extending about 10mm onto the lateral convexity.
The path the simulated wave segment takes matches closely the path of the visual aura inthe visual field within the first eight minutes of an attack at one day and within minutes 7-14 atanother day (Fig. 1a,b). During these periods, it propagated within the lower visual quadrantin the right visual hemisphere from the center to the periphery and at about 8◦ eccentricity itdisappeared or was clinically silent for seven minutes and reappeared (Dahlem and Hadjikhani,2009). The anatomical and physiological features of this distinctive and further aura patterns ofthis migraine sufferer were also investigated by Hansen et al. (2013). Let us remark that because
Figure 4. Simulation of spreading depression on an individually shaped cortical surfaceobtained by MRI from a migraine sufferer.
9/20
PeerJ PrePrints | http://dx.doi.org/10.7287/peerj.preprints.515v1 | CC-BY 4.0 Open Access | rec: 26 Sep 2014, publ: 26 Sep 2014
PrePrin
ts
SD propagates with about 3mm/min, 8min correspond to a distance of about 24mm, which isabout the size of the particular gyral crown on the cuneus (Fig. 4).
After we simulate the individual path in V1 of this distinctive aura attack, we can determinethe start and end point. These points where given by the center of gravity of the wave segment atthe respective positions. Between the start and end point, we also calculate the shortest distancepath (white line in Fig. 4). It can be seen that the actual path along this wave segment travelsoverlaps by and large with the shortest distance path.
The idea of the shortest path can be misleading as the wave segment does not teleologicallypropagate to its final position. Geodesics are locally the shortest path between points in the space,but they are not necessarily the shortest path globally. The osculating plane of the geodesic lineis perpendicular to the surface tangent plane, which provides a local criteria for the calculation.This criteria is probably the reason why wave segments approximately follow with their centerof gravity geodesics. Yet, as shown in Sec. 3.1.2, wave segments can be deflected by small buthigh gyral folds and sulci indents. Such geometric objects in the path of a wave segment may notinterfere with the center of gravity of the wave segment. Hence, wave segments will not exactlytravels along geodesics that are defined by the center of gravity alone.
3.2.2 Distribution of Gaussian curvature and other heterogeneitiesLast, we calculate the distribution of the Gaussian curvature of a whole cortical surface (Fig. 5).It can be seen that the curvature overall deviates only moderately from zero. Larger indents canbe, however, in the deep sulci of the occipital pole.
It is well known that the cerebral cortex also exhibits considerable regional heterogeneityfrom cellular, to laminar and areal heterogeneity as briefly outlined in the discussion. Hence, itis important to estimate spatial scales of the heterogeneous distribution of Gaussian curvature incomparison. The change of sign occurs every couple of millimeters, although lager domains andconnected stripes of one polarity (negative or positive value of Gaussian curvature) exist.
Ignoring for the moment any other heterogeneity, even the set of permitted geodesics startingfrom a given point is a complex network. Non-permitted geodesics are those that lead intodead ends due to head-on collision with unfavorable curvature conditions (in addition to otherunfavorable heterogeneities, which we have for the moment ruled out, but see Sect. Conclusion).There can be several geodesics on the cortical surface between two given points, so in principlegeodesics that start from the some point can later cross again (Maekawa, 1996). A geodesic is,of course, conceptually similar to a straight line in a flat geometry. Given a common start point,straight paths in a flat surface simply span radially lines. Hence curvature makes a significant
Figure 5. For a cortical surface κgeo ≡ sign(K)√|K| is shown on a color scale
[−1.56/mm,1.56/mm], as indicated by the color bar. From right to left, the spot with largestnegative Gaussian curvature K =−2.343/mm is brought into focus by zooming closer twice, asindicated by the orange and yellow lines, respectively. It represents a potential nucleation pointfor SD.
10/20
PeerJ PrePrints | http://dx.doi.org/10.7287/peerj.preprints.515v1 | CC-BY 4.0 Open Access | rec: 26 Sep 2014, publ: 26 Sep 2014
PrePrin
ts

contribution to the traveling paths that can span a labyrinth of wave segments even in the absenceof other heterogeneities, which are probably at least as relevant and modify the labyrinth structurefurther.
To define the ‘cortical labyrinths’, we have to take into account the geodesics and furthereffects of the Gaussian curvature on the traveling wave segment (see Sec. 3.1.2, deflectionand head-on collisions Fig. 3) as well as regional cellular, laminar, and areal heterogeneity.Without measuring or defining all the various structures and make them amenable to numericalsimulations, we can always fall back to an operational definition by principle. We call a labyrinththe set of paths a wave segment with a given size can take starting form a particular location on thecortex. To calculate this is computationally expensive as labyrinths depend on the starting pointand wave size (defined in flat geometry). Moreover, we currently cannot include information onregional heterogeneity in necessary detail (see Sect. Conclusion).
As this is beyond the scope of this study, let us summarize and highlight the similarity to alabyrinth structure. Wave segments can only travel on fixed paths. Some of these paths will be adead end. The random ondulation to the gross cortical morphology alone will already render theparticular labyrinths an individual feature, like a fingerprint, of each migraine sufferer.
4 CONCLUSION
4.1 Regional heterogeneity in the cortexThe cerebral cortex exhibits regional heterogeneity. This not only can considerably influence thepath an SD segments takes, it also actually reveals the only information we currently have aboutthese particular paths. For both reasons, the parcelation into cortical areas as functional domainsshould be stressed among various other factors that introduce heterogeneity in the cortex.
4.1.1 Clinical manifestations of SD wave segmentsIt seems that a localized SD wave segment travels through several different cortical areas along acoordinated path in a single migraine aura attack—though from attack to attack different pathsmay be taken. This is inferred from the fact that migraine aura symptoms frequently occur inpatterns each fitting a particular spatially aligned distribution of various successively impairedcortical functions (Vincent and Hadjikhani, 2007).
A full-scale attack is characterized according to the Headache Classification Committeeof the International Headache Society by multiple sensory and/or cognitive symptoms duringthe aura phase. Each individual aura symptom can last up to 60 minutes, thus the acceptablemaximal duration for three different symptoms is 180min or a path length of 54cm. This seemsreasonable for a narrow wave segment meandering in an area of∼2000cm2 folded and ondulatedcortical surface. A segment of 0.5cm width covers only ∼1.35% of the available surface area. Incontrast, an engulfing SD with a radius of 54cm would invade 3.5 times more surface area thanis actually available.
4.1.2 Functional domains and anatomical landmarksCortical areas are defined based upon cytoarchitecture, functional studies, and subcorticalconnectivity. These factors can be independent. In the visual cortex, for example, except forV1, there is no correspondence between cytoarchitecture (Brodman) and function (defined byretinotopic mapping). Of course all these heterogeneities need to be considered in additionand in relation to Gaussian curvature when trying to estimate the set of preferred paths of SDpropagation. Moreover, sensory and motoric domains can have some relationship to the grosssulcal and gyral morphology. These factors are not independent. In particular, subcorticalconnectivity and sulcal and gyral morphology could be related by developmental mechanics(Hilgetag and Barbas, 2005). Yet, there also is substantial interindividual variability in both the
11/20
PeerJ PrePrints | http://dx.doi.org/10.7287/peerj.preprints.515v1 | CC-BY 4.0 Open Access | rec: 26 Sep 2014, publ: 26 Sep 2014
PrePrin
ts
size and location (Rajkowska and Goldman-Rakic, 1995; Thompson et al., 1996; Roland andZilles, 1998; Amunts et al., 1999).
Only in a few cases more or less precise correlations between the folding pattern andfunctional domains have been demonstrated. The most reliable relation is the calcarine sulcus(CS, see Fig. 2) as a landmark of the primary visual cortex (V1) (Stensaas et al., 1974; Gilissenand Zilles, 1996; Andrews et al., 1997). For visual areas outside V1, a purely anatomicalidentification is also quite reliable for V5, which lies at the intersection of the ascending limbof the inferior temporal sulcus and the lateral occipital sulcus (Watson et al., 1993; Walterset al., 2003). The primary auditory cortex has a clear spatial relationship with Heschl’s gyrus(Gaschler-Markefski et al., 1997; Rademacher et al., 2001). All these functional domains arerelevant in relation to migraine aura symptoms. Last, the motor cortex can be identified by theposition of the central sulcus (Lotze et al., 2000). While this is often suggested as a barrier for anengulfing SD pattern, there is evidence that also the prefrontal cortex can be affected (Schipperet al., 2012; Borsook et al., 2014).
4.1.3 Curvature, folding, and thicknessAn important fact is that with the cortical folding pattern the cytoarchitecture also varies ina systematic way. There is a crucial distinction to be made. The folding pattern is mainlydetermined by extrinsic curvature, while Gaussian curvature is intrinsic curvature. Simply said,the SD wave as an “inhabitant” of the cortical surface feels only intrinsic curvature directly.Extrinsic curvature can only indirectly, that is, via the cytoarchitecture, influence SD propagation.In other words, the effect by Gaussian curvature and by differences between gyral vs. sucalconvolutions are distinctively different.
Gyral convolutions of the cerebral cortex are thicker than sulcal ones, which is specificallydue to an increase in the thickness of the deep layers (V+VI). The increased neuron numberand increased thickness of these deep gyral layers correlate so that the density of deep layers isrelatively invariant across the cortical landscape, see study by Hilgetag and Barbas (2005) andreferences therein. If the cell density is constant in different thicknesses of deep layers, volumefraction between intra- and extracellular space and volume-to-surface-area relation should alsobe invariant. These factors determine important electropyhsiological properties of SD on acellular level (Hubel et al., 2014; Hubel and Dahlem, 2014).
Notwithstanding, cortical thickness differences have been reported in migraine sufferers intwo studies (Granziera et al., 2006; DaSilva et al., 2007) and the possible implications have beendiscussed throughly by Hadjikhani (2008), so that we can refer the interested reader for detailsto this. Briefly, focal dysplasias may render the cortex more excitable, which could then add tothe effect of negative Gaussian curvature to create hot spots. The cortical thickness changes canbe also a result of plasticity following repetitive episodes of pain, which may suggest that therecould also be protective changes in plasticity following repetitive neuromodulation.
The central point taken away from these studies on natural and abnormal variations in corticalthickness for the current study is that the approximation of the cortical sheet as a 2D surface doesnot hold in all circumstances and that the problem can ultimately only be resolved in a neuraltissue simulation that extends the requirements and constraints of circuit simulation methods ona cortical sheet (in the continuum limit neural fields) by creating a tissue coordinate system thatallow geometrical analysis (Kozloski and Wagner, 2011).
4.1.4 Cortical grade separationAnother noteworthy heterogeneity concerns the laminar structure. Studies in rat show that corticalDC shifts associated with SD can move either in layers near the cortical surface or in deepercortical layers below a border zone between layer IV and layer V (Richter and Lehmenkuhler,1993). Layer IV is the granular layer of the cortex which could have for SD an unfavorable
12/20
PeerJ PrePrints | http://dx.doi.org/10.7287/peerj.preprints.515v1 | CC-BY 4.0 Open Access | rec: 26 Sep 2014, publ: 26 Sep 2014
PrePrin
ts
high volume-to-surface-area. There is not always a strong correlation between the time courseof DC shifts in upper and lower cortical structures. It has been suggested that in human, theoccurrence of SD in upper and/or deeper cortical layers could have implications on the typeof the migraine attack (aura with headache, aura without headache or headache without aura)(Richter and Lehmenkuhler, 1993). Grade separation would add significantly to the complexityof a labyrinth structure as at-grade intersection of a non-or-all phenomenon such as SD wouldcause annihilation or merging but not bypassing cross each other. Much of the anterior cortexincluding the prefrontal cortex, however, lacks a defined layer IV, thus the labyrinth is at-gradein an agranular cortex.
4.1.5 VasculatureSD does not only cause a hemodynamic responses (Dreier, 2011). SD can also be caused byhemodynamic abnormalities and its propagation path can be changed by hemodynamic action.For example, large and correlated fluctuations originating from autonomic subnetworks havebeen suggested to occur as part of a typical tipping point behavior in the prodromal phase ofmigraine (Dahlem et al., 2014). These global fluctuations can ignite SD locally in a hot spot bycrossing there the nucleation threshold for propagation first.
Pial vessels, which distribute blood from the cerebral arteries to the penetrating arterioles,can locally block the propagation (Santos et al., 2014). The penetrating arterioles occur aboutevery 300µm and the pial surface artery network is an interconnected honeycomb-like mesh(Blinder et al., 2010). The regulation of cerebrovascular tone is coordinated by perivascularnerves, glia, and blood pressure and its hydraulic functions. Vessel dilations can propagate intothis pial mesh also mediated by fast electrical connections between endothelial cells. In fact,surface vessels show much larger dilations than their intracortical branches and this dialationcan also occur in regions that show no directly increased neural activity but are neighboringregions that do show increased activity (Gao et al., 2014). This may provide a fast and long-rangeinhibitory feedback, as described by Eq. 2.
It is also noteworthy that with laser speckle technology the cerebral blood flow was measuredin patients with malignant hemispheric stroke after hemicraniectomy. The path of SD wasvisualized and this was also suggestive of a small wave segment form (Woitzik et al., 2013).
4.2 Hot spots and labyrinth paths as target structures in stereotactic neuromod-ulation approaches
Various treatment strategies for migraine are available today. It cannot be stressed enoughthat the recommended approach based upon clinical experience is an integrated headachecare. Treatment of acute migraine attacks and prophylaxis is accompanied by education andcounselling, behavioural therapy and treatment of co-morbidities. However, with respect todrug treatment “acute treatment and preventive therapy of migraine seems to have come to ahalt recently. The last real innovation in the treatment of migraine attacks were the triptans,which were introduced 20 years ago. [...] [I]t is time to explore new avenues in the treatment ofmigraine” (Diener, 2013).
Computational models of migraine not only help to better understand this disease. They alsohelp to identify new opportunities to intervene. Our results suggest that the primary objectivein research relating SD to migraine pain should be directed to obtain a measure of the differentnoxious signatures that are transmitted into the meninges and drive the migraine-generatornetwork into the pain state, i.e., central sensitization (Fig. 6). In this context, neuromodulationis of particular interest, because computational models can identify the accessible interventionpoints. For example, for the treatment of chronic migraine (>15 headache days per month) withtranscranial direct current stimulation (tDCS) the current flow through subcortical brain regions
13/20
PeerJ PrePrints | http://dx.doi.org/10.7287/peerj.preprints.515v1 | CC-BY 4.0 Open Access | rec: 26 Sep 2014, publ: 26 Sep 2014
PrePrin
ts
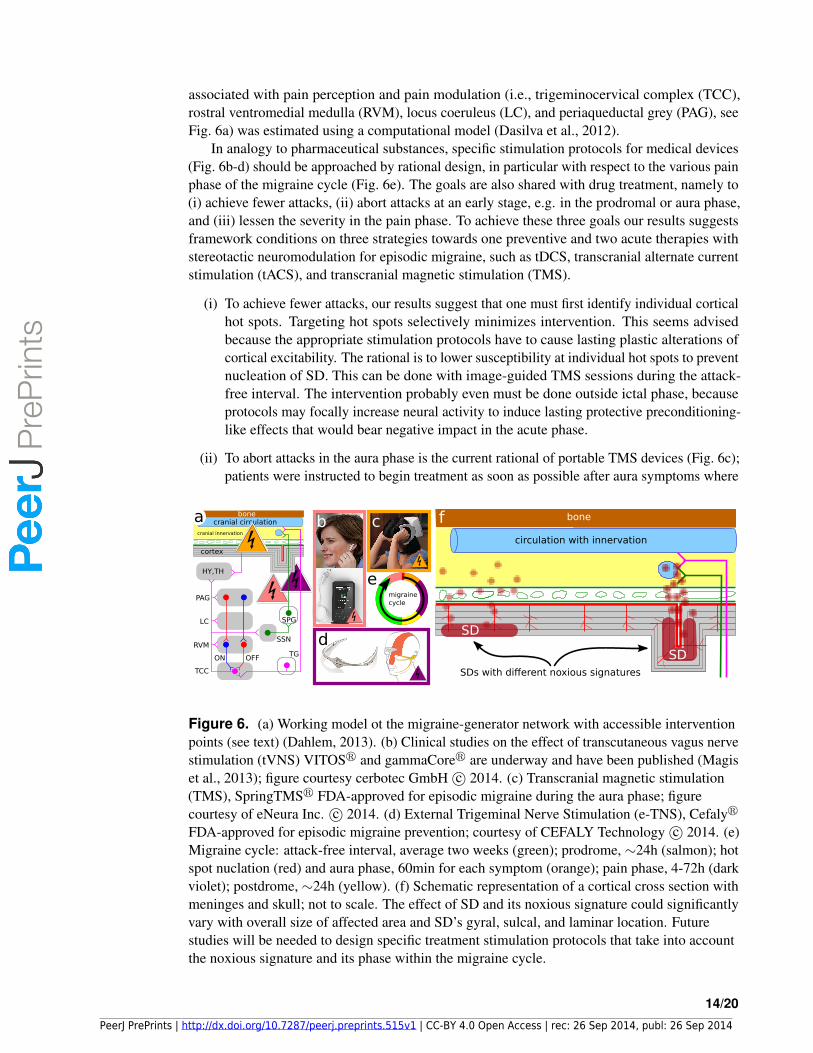
associated with pain perception and pain modulation (i.e., trigeminocervical complex (TCC),rostral ventromedial medulla (RVM), locus coeruleus (LC), and periaqueductal grey (PAG), seeFig. 6a) was estimated using a computational model (Dasilva et al., 2012).
In analogy to pharmaceutical substances, specific stimulation protocols for medical devices(Fig. 6b-d) should be approached by rational design, in particular with respect to the various painphase of the migraine cycle (Fig. 6e). The goals are also shared with drug treatment, namely to(i) achieve fewer attacks, (ii) abort attacks at an early stage, e.g. in the prodromal or aura phase,and (iii) lessen the severity in the pain phase. To achieve these three goals our results suggestsframework conditions on three strategies towards one preventive and two acute therapies withstereotactic neuromodulation for episodic migraine, such as tDCS, transcranial alternate currentstimulation (tACS), and transcranial magnetic stimulation (TMS).
(i) To achieve fewer attacks, our results suggest that one must first identify individual corticalhot spots. Targeting hot spots selectively minimizes intervention. This seems advisedbecause the appropriate stimulation protocols have to cause lasting plastic alterations ofcortical excitability. The rational is to lower susceptibility at individual hot spots to preventnucleation of SD. This can be done with image-guided TMS sessions during the attack-free interval. The intervention probably even must be done outside ictal phase, becauseprotocols may focally increase neural activity to induce lasting protective preconditioning-like effects that would bear negative impact in the acute phase.
(ii) To abort attacks in the aura phase is the current rational of portable TMS devices (Fig. 6c);patients were instructed to begin treatment as soon as possible after aura symptoms where
circulation with innervation
bone
SD
SD
f
HY,TH
SPG
SSN
TCC
PAG
LC
RVMTG
cortex
cranial circulationbone
ON OFF
cranial innervation
a
migrainecycle
b c
d
e
SDs with different noxious signatures
Figure 6. (a) Working model ot the migraine-generator network with accessible interventionpoints (see text) (Dahlem, 2013). (b) Clinical studies on the effect of transcutaneous vagus nervestimulation (tVNS) VITOSr and gammaCorer are underway and have been published (Magiset al., 2013); figure courtesy cerbotec GmbH c© 2014. (c) Transcranial magnetic stimulation(TMS), SpringTMSr FDA-approved for episodic migraine during the aura phase; figurecourtesy of eNeura Inc. c© 2014. (d) External Trigeminal Nerve Stimulation (e-TNS), Cefalyr
FDA-approved for episodic migraine prevention; courtesy of CEFALY Technology c© 2014. (e)Migraine cycle: attack-free interval, average two weeks (green); prodrome, ∼24h (salmon); hotspot nuclation (red) and aura phase, 60min for each symptom (orange); pain phase, 4-72h (darkviolet); postdrome, ∼24h (yellow). (f) Schematic representation of a cortical cross section withmeninges and skull; not to scale. The effect of SD and its noxious signature could significantlyvary with overall size of affected area and SD’s gyral, sulcal, and laminar location. Futurestudies will be needed to design specific treatment stimulation protocols that take into accountthe noxious signature and its phase within the migraine cycle.
14/20
PeerJ PrePrints | http://dx.doi.org/10.7287/peerj.preprints.515v1 | CC-BY 4.0 Open Access | rec: 26 Sep 2014, publ: 26 Sep 2014
PrePrin
ts

noticed and always within 1h of aura onset (Lipton et al., 2010). In the period afterSD is ignited, previous theoretical model studies proposed that the inevitable decay ofthe cortical patterns is critically slowed down by a bottle-neck situation (Dahlem andIsele, 2013; Dahlem et al., 2013). Our results here suggest that these patterns are bothselected and temporally stabilized by labyrinth paths. Taken together, the current twosingle pulse paradigm (for ∼0.5s, ∼30s apart) are likely to turn with a certain success ratewave segments into faster-decay paths or dead ends. Repetitive TMS with low amplitude,however, could be more effectively shorten the transient decay time. Noise during abottle-neck passage (Strogatz, 1994) induces large fluctuations allowing the dynamicalsystem to explore nearby states and faster traverse the bottle-neck passages in phase space.
(iii) To speed up the recovery from the aftermath of SD or completely suppress a long-lastingpain state (i.e., trigeminal or central sensitization) the stimulation protocol need to intervenewith the inflammatory signaling cascade from metabolically stressed neurons to trigeminalafferents in the dura (Karatas et al., 2013). Our results suggest that the cascade from thebrain paremchyma to the dura is effected by geometrical constraints (Fig. 6f). For example,if the labyrinth path is entirely in a sculus, sufficient concentrations of inflammatorymediators can be siphoned from the perivascular space into the subarachnoid space. Onemust first identify the individual cortical labyrinths to identify optimal target regions wherethe inflammatory cascade can be interrupted. In this context it is interesting to note thatdespite the gyral crown of the cortex being subjected to a larger magnetic field magnitudeduring TMS, the sulcal banks show larger cerebral blood flow responses (Krieg et al.,2013).
Strategies (ii) and (iii) describe early and on-demand interventions during the pre-ictal state.Aura symptoms can announce the pre-ictal state in about 30% of the cases. Yet these are notthe only indicators of the pre-ictal state. Also other sensory, affective, autonomic, and cognitivefunctions are altered in this phase and provide means by which migraine suffers become awareof pre-ictal ‘errors’ (Borsook et al., 2014). Strategy (i) seems more bold, as we suggest thatmigraine might be unlearned. Identifing cortical hot spots and cause plastic changes at these fociis but only first step towards electroceuticals (Famm et al., 2013) that are currently discussed tooverride pain signals or reprogram circuits from accessible intervention points (Fig. 6a).
Already, the first transcutaneous electrical nerve stimulation (TENS) device (Fig. 6d) andthe first TMS device (Fig. 6c) were FDA-approved for episodic migraine for prevention andduring the aura phase, respectively. Other neuromodulation including invasive methods areapproved only for chronic migraine. Focused ultrasound that can open the blood brain barrierin targeted regions is also discussed (Bing et al., 2014) and would provide means to targethot spots and labyrinth paths selectively by local delivery of drugs. If the next generation ofnoninvasive devices due to model-based optimization of stimulations protocols has less adverseeffects and becomes more efficient, patient groups with high frequency episodic migraine attacksand unsatisfactory treatment response will certainly be open to such a treatment.
The target structures that we suggest are like fingerprints, they are individual features ofeach migraine sufferer. The next step will be to provide individualized neural tissue simulationsdelivering the same output as clinical data. This can then serve as a test bed for exploring the useof personalized stereotactic neuromodulation.
DISCLOSURE/CONFLICT-OF-INTEREST STATEMENT
MAD has consulted for eNeura Inc in 2012.
15/20
PeerJ PrePrints | http://dx.doi.org/10.7287/peerj.preprints.515v1 | CC-BY 4.0 Open Access | rec: 26 Sep 2014, publ: 26 Sep 2014
PrePrin
ts
ACKNOWLEDGMENTS
MAD kindly acknowledges helpful discussions with Paul van Valkenburgh, John Milton, andClaus Hilgetag.
Funding Bundesministerium fur Bildung und Forschung (BMBF 01GQ1109).
REFERENCES
Abramychev, A. Y., Davydov, V., and Zykov, V. (1990). Drift of spiral waves on nonuniformlycurved surfaces. J. Exp. Theor. Phys., 70:666.
Almeida, A. C. G., Texeira, H. Z., Duarte, M. A., and Infantosi, A. F. C. (2004). Modelingextracellular space electrodiffusion during Leao’s spreading depression. IEEE Trans BiomedEng, 51(3):450–458. Comparative Study.
Amunts, K., Schleicher, A., Burgel, U., Mohlberg, H., Uylings, H. B., and Zilles, K. (1999).Broca’s region revisited: cytoarchitecture and intersubject variability. J Comp Neurol,412(2):319–341.
Andrews, T. J., Halpern, S. D., and Purves, D. (1997). Correlated size variations in human visualcortex, lateral geniculate nucleus, and optic tract. J Neurosci, 17:2859–2868.
Bangerth, W., Hartmann, R., and Kanschat, G. (2007). deal.II — a general purpose objectoriented finite element library. ACM Trans. Math. Softw., 33(4).
Bing, C., Ladouceur-Wodzak, M., Wanner, C. R., Shelton, J. M., Richardson, J. A., and Chopra,R. (2014). Trans-cranial opening of the blood-brain barrier in targeted regions using astereotaxic brain atlas and focused ultrasound energy. Journal of Therapeutic Ultrasound,2(1):13.
Blinder, P., Shih, A. Y., Rafie, C., and Kleinfeld, D. (2010). Topological basis for the robustdistribution of blood to rodent neocortex. Proceedings of the National Academy of Sciences,107(28):12670–12675.
Bode, M. and Purwins, H. G. (1995). Pattern formation in reaction-diffusion systems-dissipativesolitons in physical systems. Physica D, 86:53.
Bojak, I., Oostendorp, T. F., Reid, A. T., and Kotter, R. (2010). Connecting mean field models ofneural activity to EEG and fMRI data. Brain Topogr, 23(2):139–149.
Bojak, I., Oostendorp, T. F., Reid, A. T., and Kotter, R. (2011). Towards a model-basedintegration of co-registered electroencephalography/functional magnetic resonance imagingdata with realistic neural population meshes. Philos Trans R Soc A, 369(1952):3785–3801.
Borsook, D., Aasted, C. M., Burstein, R., and Becerra, L. (2014). Migraine mistakes errorawareness. The Neuroscientist, 20(3):291–304.
Charles, A. C. and Baca, S. M. (2013). Cortical spreading depression and migraine. Nat. Rev.Neurol.
Dahlem, M. A. (2013). Migraine generator network and spreading depression dynamics asneuromodulation targets in episodic migraine. Chaos, 23:046101.
Dahlem, M. A. and Chronicle, E. P. (2004). A computational perspective on migraine aura. Prog.Neurobiol., 74(6):351–361.
Dahlem, M. A., Graf, R., Strong, A. J., Dreier, J. P., Dahlem, Y. A., Sieber, M., Hanke, W.,Podoll, K., and Scholl, E. (2010). Two–dimensional wave patterns of spreading depolarization:retracting, re–entrant, and stationary waves. Physica D, 239:889–903.
Dahlem, M. A. and Hadjikhani, N. (2009). Migraine aura: retracting particle–like waves inweakly susceptible cortex. PLoS ONE, 4:e5007.
Dahlem, M. A. and Isele, T. M. (2013). Transient localized wave patterns and their applicationto migraine. J. Math. Neurosci, 3:7.
16/20
PeerJ PrePrints | http://dx.doi.org/10.7287/peerj.preprints.515v1 | CC-BY 4.0 Open Access | rec: 26 Sep 2014, publ: 26 Sep 2014
PrePrin
ts
Dahlem, M. A., Kurths, J., Ferrari, M. D., Aihara, K., Scheffer, M., and May, A. (2014).Understanding migraine using dynamical network biomarkers. Cephalalgia, online first.
Dahlem, M. A. and Muller, S. C. (2003). Migraine aura dynamics after reverse retinotopicmapping of weak excitation waves in the primary visual cortex. Biol. Cybern., 88:419–424.
Dahlem, M. A. and Muller, S. C. (2004). Reaction–diffusion waves in neuronal tissue and thewindow of cortical excitability. Ann. Phys., 13(7):442–449.
Dahlem, M. A., Rode, S., May, A., Fujiwara, N., Hirata, Y., Aihara, K., and Kurths, J. (2013).Towards dynamical network biomarkers in neuromodulation of episodic migraine. Transl.Neuroscie., 4(3):282–294.
Dahlem, M. A. and Tusch, J. (2012). Predicted selective increase of cortical magnification dueto cortical folding. J. Math. Neurosci., 2:14.
Dale, A. M., Fischl, B., and Sereno, M. I. (1999). Cortical surface-based analysis. I. Segmentationand surface reconstruction. NeuroImage, 9(2):179–194.
DaSilva, A. F., Granziera, C., Snyder, J., and Hadjikhani, N. (2007). Thickening in the so-matosensory cortex of patients with migraine. Neurology, 69(21):1990–1995.
Dasilva, A. F., Mendonca, M. E., Zaghi, S., Lopes, M., Dossantos, M. F., Spierings, E. L., Bajwa,Z., Datta, A., Bikson, M., and Fregni, F. (2012). tDCS-induced analgesia and electrical fieldsin pain-related neural networks in chronic migraine. Headache, 52(8):1283–1295.
Davydov, V., Morozov, V., and Davydov, N. (2000a). Ring-shaped autowaves on curved surfaces.Phys. Lett. A, 267(5):326–330.
Davydov, V. and Zykov, V. (1991). Kinematics of spiral waves on nonuniformly curved surfaces.Physica D, 49(1):71–74.
Davydov, V. and Zykov, V. (1993). Spiral autowaves in a round excitable medium. J. Exp. Theor.Phys., 76(3):414–419.
Davydov, V. A., Manz, N., Steinbock, O., and Muller, S. C. (2002). Critical properties ofexcitation waves on curved surfaces: Curvature-dependent loss of excitability. Europhys. Lett.,59:344–350.
Davydov, V. A., Manz, N., Steinbock, O., Zykov, V. S., and Muller, S. C. (2000b). Excitationfronts on a periodically modulated curved surface. Phys. Rev. Lett., 85:868–871.
Davydov, V. A., Morozov, V. G., and Davydov, N. V. (2003). Critical properties of autowavespropagating on deformed cylindrical surfaces. Physics Letters A, 307:265–268.
Diener, H.-C. (2013). Novel Approaches in Migraine Treatment. Future Medicine Ltd, London.doi:10.2217/9781780842349.
Dreier, J. P. (2011). The role of spreading depression, spreading depolarization and spreadingischemia in neurological disease. Nat. Med., 17:439–447.
Famm, K., Litt, B., Tracey, K. J., Boyden, E. S., and Slaoui, M. (2013). Drug discovery: ajump-start for electroceuticals. Nature, 496(7444):159–161.
Fischl, B., Sereno, M. I., and Dale, A. M. (1999). Cortical surface-based analysis. II. Inflation,flattening, and a surface-based coordinate system. NeuroImage, 9(2):195–207.
Gao, Y., Green, S., and Drew, P. (2014). Cortical depth dependent hemodynamics to locomotion.SfN abstract.
Gaschler-Markefski, B., Baumgart, F., Tempelmann, C., Schindler, F., Stiller, D., Heinze, H. J.,and Scheich, H. (1997). Statistical methods in functional magnetic resonance imaging withrespect to nonstationary time-series: auditory cortex activity. Magn Reson Med, 38(5):811–820.
Gilissen, E. and Zilles, K. (1996). The calcarine sulcus as an estimate of the total volumeof human striate cortex: a morphometric study of reliability and intersubject variability. JHirnforsch, 37(1):57–66.
Granziera, C., DaSilva, A. F., Snyder, J., Tuch, D. S., and Hadjikhani, N. (2006). Anatomical
17/20
PeerJ PrePrints | http://dx.doi.org/10.7287/peerj.preprints.515v1 | CC-BY 4.0 Open Access | rec: 26 Sep 2014, publ: 26 Sep 2014
PrePrin
ts
alterations of the visual motion processing network in migraine with and without aura. PLoSmedicine, 3(10):e402.
Grusser, O.-J. (1995). Migraine phosphenes and the retino-cortical magnification factor. VisionRes., 35(8):1125–1134.
Hadjikhani, N. (2008). Relevance of cortical thickness in migraine sufferers.Hansen, J. M., Baca, S. M., VanValkenburgh, P., and Charles, A. (2013). Distinctive anatom-
ical and physiological features of migraine aura revealed by 18 years of recording. Brain,136(12):3589–3595.
Hilgetag, C. C. and Barbas, H. (2005). Developmental mechanics of the primate cerebral cortex.Anatomy and embryology, 210(5-6):411–417.
Hubel, N. and Dahlem, M. A. (2014). Dynamics from seconds to hours in Hodgkin–Huxleymodel with time–dependent ion concentrations and buffer reservoirs. accepted for PLoS Comp.Biol.
Hubel, N., Scholl, E., and Dahlem, M. A. (2014). Bistable dynamics underlying excitability ofion homeostasis in neuron models. PLoS Comp. Biol., 10:e1003551.
Karatas, H., Erdener, S. E., Gursoy-Ozdemir, Y., Lule, S., Eren-Kocak, E., Sen, Z. D., andDalkara, T. (2013). Spreading depression triggers headache by activating neuronal Panx1channels. Science, 339(6123):1092–1095.
Kim, J. S., Singh, V., Lee, J. K., Lerch, J., Ad-Dab’bagh, Y., MacDonald, D., Lee, J. M., Kim,S. I., and Evans, A. C. (2005). Automated 3-D extraction and evaluation of the inner and outercortical surfaces using a Laplacian map and partial volume effect classification. NeuroImage,27(1):210–221.
Kneer, F., Scholl, E., and Dahlem, M. A. (2014). Nucleation of reaction-diffusion waves oncurved surfaces. New J. Phys., 16:053010.
Kozloski, J. and Wagner, J. (2011). An ultrascalable solution to large-scale neural tissuesimulation. Frontiers in neuroinformatics, 5.
Krieg, T. D., Salinas, F. S., Narayana, S., Fox, P. T., and Mogul, D. J. (2013). Pet-basedconfirmation of orientation sensitivity of tms-induced cortical activation in humans. Brainstimulation, 6(6):898–904.
Krischer, K. and Mikhailov, A. S. (1994). Bifurcation to traveling spots in reaction-diffusionsystems. Phys. Rev. Lett., 73(23):3165–3168.
Lipton, R. B., Dodick, D. W., Silberstein, S. D., Saper, J. R., Aurora, S. K., Pearlman, S. H.,Fischell, R. E., Ruppel, P. L., and Goadsby, P. J. (2010). Single-pulse transcranial magneticstimulation for acute treatment of migraine with aura: a randomised, double-blind, parallel-group, sham-controlled trial. Lancet Neurol., 9:373–380.
Lotze, M., Erb, M., Flor, H., Huelsmann, E., Godde, B., and Grodd, W. (2000). fMRI evaluationof somatotopic representation in human primary motor cortex. Neuroimage, 11(5 Pt 1):473–481.
Maekawa, T. (1996). Computation of shortest paths on free-form parametric surfaces. Journalof mechanical design, 118(4):499–508.
Magid, E., Soldea, O., and Rivlin, E. (2007). A comparison of gaussian and mean curvatureestimation methods on triangular meshes of range image data. Comput Vis Image Underst,107:139–159.
Magis, D., Gerard, P., and Schoenen, J. (2013). Transcutaneous vagus nerve stimulation (tvns)for headache prophylaxis: initial experience. J Headache Pain, 1(Suppl 1):P198.
Manz, N., Davydov, V., Muller, S. C., and Bar, M. (2003). Dependence of the spiral rotationfrequency on the surface curvature of reaction–diffusion systems. Phys. Lett. A, 316(5):311–316.
Manz, N. and Muller, S. (2003). Fabrication of quasi-two-dimensional, heterogeneously curved
18/20
PeerJ PrePrints | http://dx.doi.org/10.7287/peerj.preprints.515v1 | CC-BY 4.0 Open Access | rec: 26 Sep 2014, publ: 26 Sep 2014
PrePrin
ts
belousov–zhabotinsky systems. Review of scientific instruments, 74(12):5161–5166.Maselko, J. and Showalter, K. (1989). Chemical waves on spherical surfaces. Nature,
339(6226):609–611. 10.1038/339609a0.Mikhailov, A. S., Davydov, V. A., and Zykov, V. S. (1994). Complex dynamics of spiral waves
and motion of curves. Phys. D, 70(1-2):1–39.Miura, R. M., Huang, H., and Wylie, J. J. (2007). Cortical spreading depression: An enigma.
Eur. Phys. J. Spec. Top., 147(1):287–302.OpenCFD Ltd (ESI Group) (2014). OpenFOAM.Poppel, E. (1973). Fortification illusion during an attack of ophthalmic migraine. Implications
for the human visual cortex. Naturwissenschaften, 60:554–555.Postnov, D. E., Muller, F., Schuppner, R. B., and Schimansky-Geier, L. (2009). Dynamical
structures in binary media of potassium-driven neurons. Phys Rev E Stat Nonlin Soft MatterPhys, 80(3 Pt 1):031921.
Postnov, D. E., Postnov, D. D., and Schimansky-Geier, L. (2012). Self–terminating wave patternsand self–organized pacemakers in a phenomenological model of spreading depression. BrainRes., 1434:200–211.
Rademacher, J., Morosan, P., Schormann, T., Schleicher, A., Werner, C., Freund, H. J., andZilles, K. (2001). Probabilistic mapping and volume measurement of human primary auditorycortex. Neuroimage, 13(4):669–683.
Rajkowska, G. and Goldman-Rakic, P. S. (1995). Cytoarchitectonic definition of prefrontal areasin the normal human cortex: II. Variability in locations of areas 9 and 46 and relationship tothe Talairach Coordinate System. Cereb Cortex, 5(4):323–337.
Richter, F. and Lehmenkuhler, A. (1993). Spreading depression can be restricted to distinctdepths of the rat cerebral cortex. Neuroscience letters, 152(1):65–68.
Roland, P. and Zilles, K. (1998). Structural divisions and functional fields in the human cerebralcortex. Brain Res Brain Res Rev., 26:87–105.
Santos, E., Scholl, M., Sanchez-Porras, R., Dahlem, M. A., Silos, H., Unterberg, A., Dickhaus, H.,and Sakowitz, O. W. (2014). Radial, spiral and reverberating waves of spreading depolarizationoccur in the gyrencephalic brain. NeuroImage.
Schenk, C. P., Or-Guil, M., Bode, M., and Purwins, H. G. (1997). Interacting pulses in three-component reaction-diffusion systems on two-dimensional domains. Phys. Rev. Lett., 78:3781.
Schipper, S., Riederer, F., Sandor, P. S., and Gantenbein, A. R. (2012). Acute confusionalmigraine: our knowledge to date.
Smith, S. M., Jenkinson, M., Woolrich, M. W., Beckmann, C. F., Behrens, T. E., Johansen-Berg,H., Bannister, P. R., De Luca, M., Drobnjak, I., Flitney, D. E., Niazy, R. K., Saunders, J.,Vickers, J., Zhang, Y., De Stefano, N., Brady, J. M., and Matthews, P. M. (2004). Advances infunctional and structural MR image analysis and implementation as FSL. NeuroImage, 23Suppl 1:S208–219.
Stensaas, S. S., Eddington, D. K., and Dobelle, W. H. (1974). The topography and variability ofthe primary visual cortex in man. J Neurosurg, 40(6):747–755.
Stovner, L., Hagen, K., Jensen, R., Katsarava, Z., Lipton, R., Scher, A., Steiner, T., and Zwart,J. A. (2007). The global burden of headache: a documentation of headache prevalence anddisability worldwide. Cephalalgia, 27(3):193–210.
Strogatz, S. H. (1994). Nonlinear Dynamics and Chaos. Westview Press, Cambridge, MA.Thompson, P. M., Schwartz, C., Lin, R. T., Khan, A. A., and Toga, A. W. (1996). Three-
dimensional statistical analysis of sulcal variability in the human brain. J. Neurosci.,16(13):4261–4274.
Tuckwell, H. C. (1981). Simplified reaction-diffusion equations for potassium and calcium ionconcentrations during spreading cortical depression. Int. J. Neurosci., 12:95–107.
19/20
PeerJ PrePrints | http://dx.doi.org/10.7287/peerj.preprints.515v1 | CC-BY 4.0 Open Access | rec: 26 Sep 2014, publ: 26 Sep 2014
PrePrin
ts

Tuckwell, H. C. and Miura, R. M. (1978). A mathematical model for spreading corticaldepression. Biophys. J., 23:257–276.
Versteeg, H. and Malalasekera, W. (1995). An Introduction to CFD. The Finite Volume Method.Vincent, M. and Hadjikhani, N. (2007). Migraine aura and related phenomena: beyond scotomata
and scintillations. Cephalalgia, 27:1368–1377.Walters, N. B., Egan, G. F., Kril, J. J., Kean, M., Waley, P., Jenkinson, M., and Watson, J. D. G.
(2003). In vivo identification of human cortical areas using high-resolution MRI: an approachto cerebral structure-function correlation. Proc Natl Acad Sci U S A, 100(5):2981–2986.
Watson, J. D., Myers, R., Frackowiak, R. S., Hajnal, J. V., Woods, R. P., Mazziotta, J. C., Shipp,S., and Zeki, S. (1993). Area V5 of the human brain: evidence from a combined study usingpositron emission tomography and magnetic resonance imaging. Cereb Cortex, 3(2):79–94.
Wilkinson, F. (2004). Auras and other hallucinations: windows on the visual brain. Prog. BrainRes., 144:305–320.
Woitzik, J., Hecht, N., Pinczolits, A., Sandow, N., Major, S., Winkler, M. K., Weber-Carstens,S., Dohmen, C., Graf, R., Strong, A. J., et al. (2013). Propagation of cortical spreadingdepolarization in the human cortex after malignant stroke. Neurology, 80(12):1095–1102.
Zandt, B.-J., ten Haken, B., van Putten, M. J., and Dahlem, M. A. (2015). How does SpreadingDepression Spread? - Physiology and Modeling. in preparation.
20/20
PeerJ PrePrints | http://dx.doi.org/10.7287/peerj.preprints.515v1 | CC-BY 4.0 Open Access | rec: 26 Sep 2014, publ: 26 Sep 2014
PrePrin
ts