Hot Mix Asphalt Test Results Mid Review Period Briefing · PDF fileHot Mix Asphalt Test Results Mid Review Period Briefing ... a 30 degree change ... Hot Mix Asphalt Test Results Mid
69
1 Hot Mix Asphalt Test Results Mid Review Period Briefing Ron Myers Emissions Measurement Center Office of Air Quality Planning and Standards U.S. Environmental Protection Agency Research Triangle Park, NC for Coalition Against the Asphalt Plant State Environmental and Public Health Agencies Industry Hot Mix Asphalt Associations Boston, Massachusetts July 14, 1999
Hot Mix Asphalt Test ResultsMid Review Period Briefing
Ron MyersEmissions Measurement Center
Office of Air Quality Planning and StandardsU.S. Environmental Protection Agency
Research Triangle Park, NC
for
Coalition Against the Asphalt PlantState Environmental and Public Health Agencies
Industry Hot Mix Asphalt Associations
Boston, Massachusetts
July 14, 1999
2
Meeting Purpose
� Review the Program Goals and Purpose
� Improve Reviewers Understanding of TestPrograms Conducted
� Respond to Questions on the Content of theReports
� Improve the Comments Received
US_EPA
What were the pollutants of interest. What were the sources of interest. What types of facilities were of interest.
US_EPA
What test methods measure the pollutants of interest. How do some methods comlement each other. What difficulties were encountered during the testing. What were the effects of the difficulties and how were the difficulties resolved.
US_EPA
Allow commenter to focus on the areas that are of concern to them so that they can more clearly describe the issues rather than questioning some procedural or editorial item that is not clear to them but does not affect the results. Also so that EPA does not misinterpret their comments due to differences in understanding of what was done and why.
Those measured during the test programs and expanded to include other sources at plants that were not included in the test program.
4
Facility Characteristics�Production Method and rate
!California FacilityàDrum Mix Plant - 395 tphàSingle Drop - 15 to 30 secàLoad Out Interval - 1 Truck per min
!Massachusetts FacilityàBatch Mix Plant - 142 tphàMultiple drops - 3 to 4 minàLoad Out Interval - 1 Truck per 7 min
US_EPA
Loaded into trucks from silos. Capacity of plant is in excess of 500 tons/hr. Has 5 silos and load-out bays spaced at 15 ft intervals. Total tunnel length is about 183 ft. The distance from the doors to the nearest load-out bay was about 61 ft. The tunnel did not meet EPA Method 204 requiremts for 100% capture without closing the doors. The doors were not operated because one was damaged and if repaired would have significantly slowed down the plant operations. Ventilation rate for the hoods was measured at 11,000 acfm.
US_EPA
Loaded into trucks from the pug mill that mixed the asphalt cement and aggregate (no silos). Capacity of plant is estimated at 300 tons/hr but probably can not maintain this level for an extended time. Has only one load-out bay. Total tunnel length was about 100 ft. The distance from the doors to the load-out bay was about 49 ft. EPA built a temporary tunnel to enclose the load out area and ventilation system to capture the emissions. The tunnel was designed to meet EPA Method 204 requiremts for 100% capture. The doors were operated by individuals on the test team. Ventilation rate for the hood was measured at 14,300 acfm. Tail tails were installed at all openings to verify the air movement into the enclosure.
5
Hot Mix Asphalt Properties�Asphalt binder content of Product
!Binder loss on heating propertiesàCA plant - 0.169 (TFOT)àMA plant - 0.126 (TFOT)
Analysis by the RTFOT averaged 0.33% which is in the 67 percentile of the US DOT analyses done for the SHRP effort. Analyses were also performed at 25 degree F above and below the method specified and determined that at 300 degrees F, a 30 degree change in temperature changed loss on heating by a factor of 2.
US_EPA
Analysis by the RTFOT averaged 0.23% which is in the 53 percentile of the US DOT analyses done for the SHRP effort. Analyses were also performed at 25 degree F above and below the method specified and determined that at 300 degrees F, a 30 degree change in temperature changed loss on heating by a factor of 2.25.
US_EPA
This is slightly lower than the samples obtained in September 1997
US_EPA
This is about the same as was obtained in July 1998 by Bob McConnell and Ravi Nadkarni.
US_EPA
Maximum RAP usage was 30%
US_EPA
Maximum RAP usage was 10%
US_EPA
The temperature readings were still going up slowly when the truck had to leave. The maximum time to take the temperature was about 4 minutes.
6
Load Out Bay Configuration�CA plant - Permanent enclosure�MA plant - Temporary enclosure
US_EPA
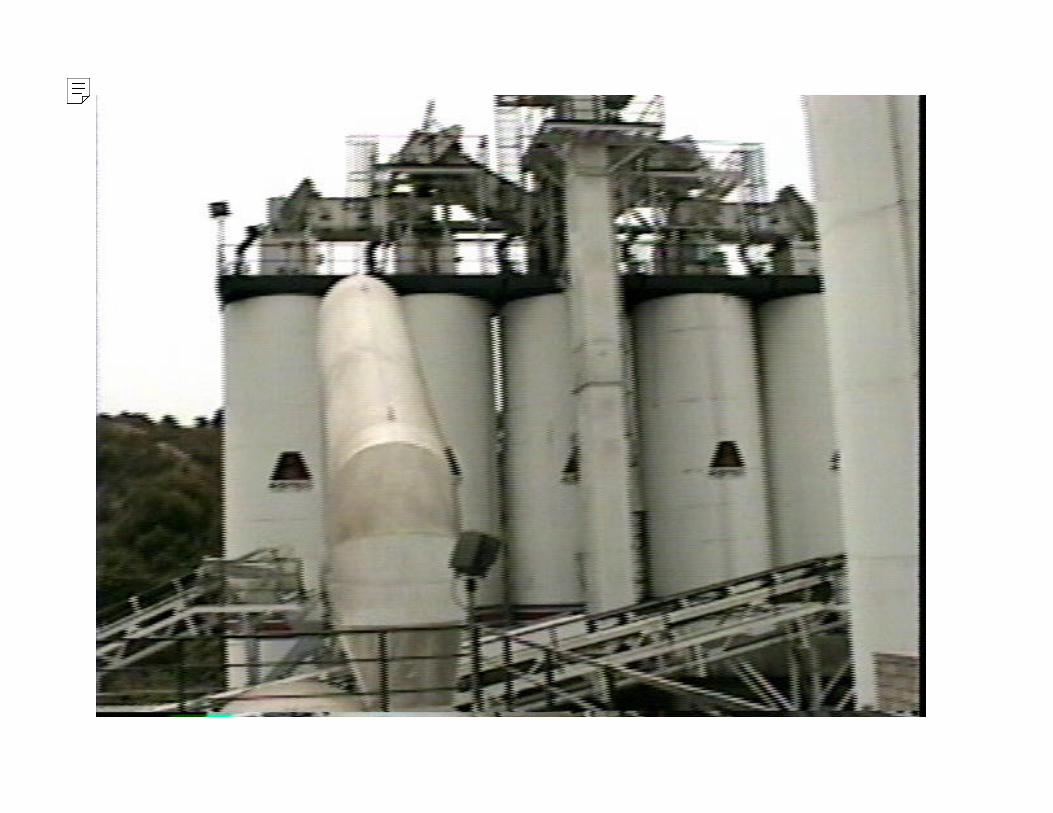
This is a view of the California facility from the production yard. The fabric filter is on the upper right, the angled duct is from the dryer and two of the five silos are on the left.
US_EPA
This is another view of the silos from the production yard. All five silos are visible. The larger duct on the left is from the dryer to the fabric filter. The square duct in the middle of the picture is the conveyer that transports the hot mix asphalt from the dryer kiln to the silow. The structure on top of the silos are conveyers that distribute the HMA to the appropriate silo. The silo test location was to the immediate right of the conveyer. The second silo from the right was the silo tested.
US_EPA
This is a picture of a truck being loaded with hot mix asphalt. The emissions can be seen. The sulfur hexafluoride (SF6) injection system can be seen on the right. Each load out station has a seperate system where nozzles inject the SF6 horizontaly and at 45 degree above and below the horizontal. This is the typical truck that was loaded.
US_EPA
This is a close up view of a truck being loaded . This is a little later in the loading operation and the emissions are more evident. In addition the SF6 injectors are more visible on the plastic pipe that supported them.
US_EPA
This is a picture of the temporary enclosure that was constructed at the Massachusetts facility. The operable doors can be seen and the red tail tails at the top of the door opening can be seen. This view is in the direction that the trucks moved through the tunnel.
US_EPA
This is a picture of the Massachusetts facility and the temporary enclosure. The cream collored structure in the center top of the picture are the hot bins and below them the pug mill. The duct to the immediate left of the structure is the conveyor that transports the hot aggregate to the top of the hot bins. The duct to the left of the conveyor is the dryer stack. The exhast constructed for the enclosure is the red duct in the lower center of the picture. The manual method sampling location is on the ground to the right of the exhaust duct.
US_EPA
This is a picture of one set of doors to the enclosure. The openings at the top and bottom of the doors are visible. The tail tails and their indication that air is entering the enclosure are also visible.
US_EPA
This is a close up of the tail tails and the opening above the doors. The air movement into the enclosure is evident from the tail tails.
US_EPA
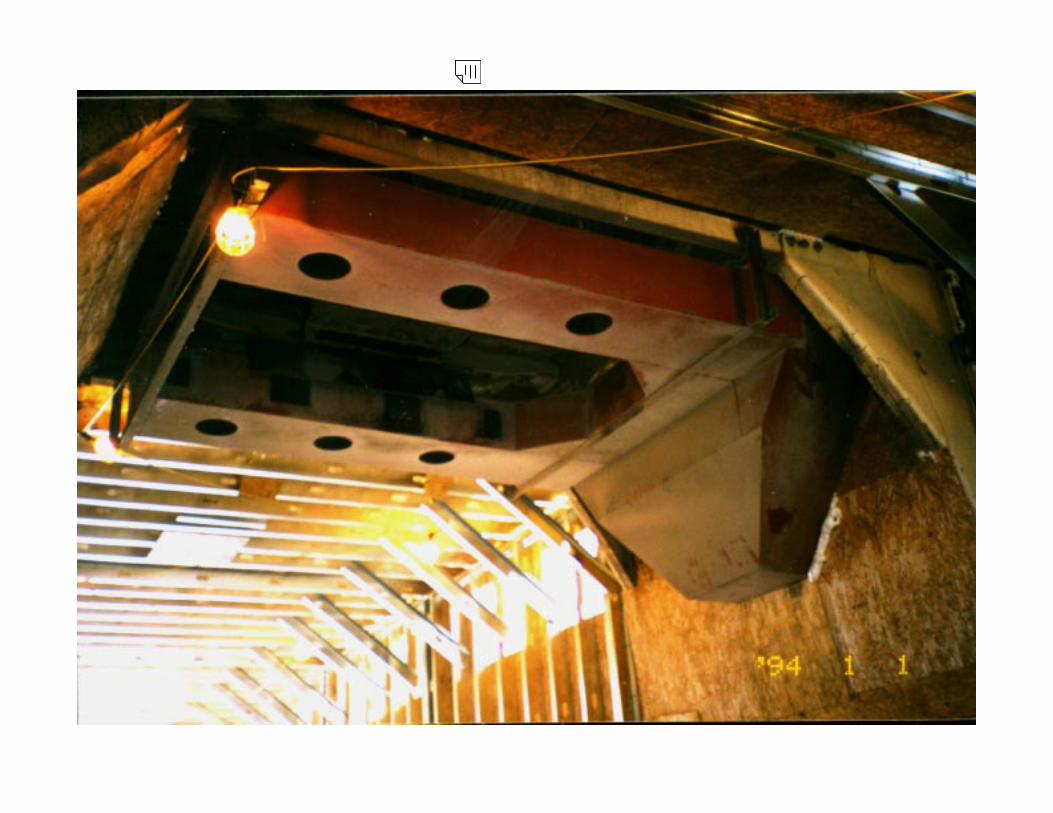
This is a picture of the capture hood built to capture emissions from the loading operation. The circular hood entrances are clearly evident on the bottom of the hood. The drop hole for the pug mill is between the two extensions.
US_EPA
This is a closer view of the capture hood. The circular hood entrances are more clearly visible. In addition, the square hood entrances are visible on the side of the hood. The square in the center of the picture is the movable door to the pug mill. This door slides to the left to create the opening where HMA drops out. The black plates on either side of the door were installed to prevent the asphalt from being thrown into the sides of the hood and into the openings. These plates were not fully sucsessful as can be seen on the far right opening and the blackening of the screen that covered the opening.
US_EPA
This is a close up of the screen covering the inside hood opening. The large asphalt coated aggregate that impacted the screens can bee seen in the photograph.
US_EPA
This is a picture of the duct from the capture hood and the manual sampling location. The small white duct in front of the tunnel exhaust stack is the duct from the truck exhaust collection system. The sampling locations are upstream from where the truck exhaust enters the enclosure ventilation system.
US_EPA
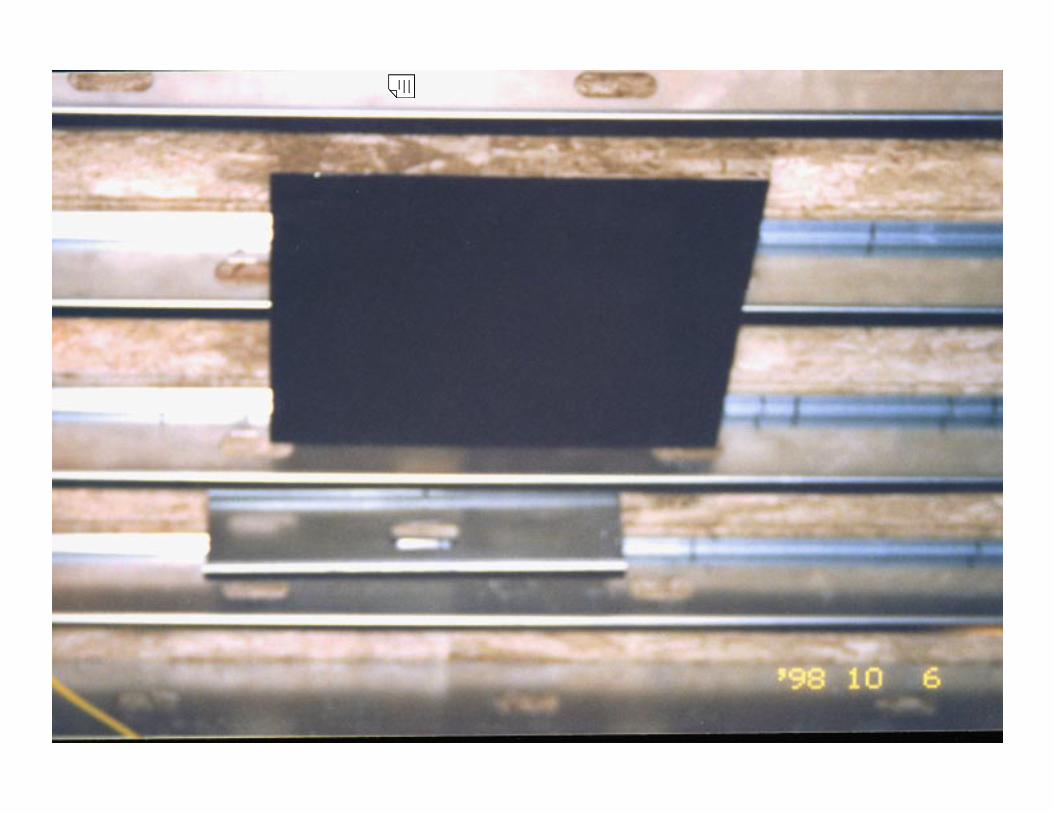
This is a picture of one of the horizontal plates and one of the verticle plates installed to collect particulate that may deposit on the cieling and support structures of the enclosure.
US_EPA
This is a picture of a truck in the enclosure and the use of the exhaust collection system. Two hoses were available for dual exhaust trucks. The exhaust from a few trucks was routed through the truck bed and could not be eliminated from the load-out collection system.
US_EPA
This is a picture of a drop at the Massachusets facility. The emissions can be seen. In addition the spread of the falling asphalt can be seen as well.
US_EPA
This is a close up of a truck drop at the Massachusets facility. This is early in a drop as evidenced by the compact falling HMA.
US_EPA
This is a picture of a batch plant HMA drop. The emissions from the drop can be seen trailing off to the right.
US_EPA
This is another view of a batch drop with the emissions trailing off to the left.
US_EPA
This shows a batch drop and the dividing of the dropping HMA by the pug mill paddles.
26
Project Goals�Quantify the totality of emissions
!truck loading operations!silo filling operations
US_EPA
This includes the total particulate and the total vaporous emissions and the speciation of these emissions into the CAAA HAP compounds.
27
Pollutant Definitions
�Particulate Species
!PM - Particulate Matter
!MCEM- Methylene Chloride ExtractableMatter is the Organic Portion of PM.
�Vaporous Species
!THC - Total Hydrocarbons are allcompounds containing Carbon andHydrogen.
28
Pollutant Definitions (cont)
� SVOHAPSemi-Volatile Organic Hazardous Air Pollutants arethose Clean Air Act Hazardous Air Pollutants withboiling point over 100(C. These compounds can existas both particulate and vapors at room temperature andpressure. SVOHAP are the subset of MCEM.
�VOHAPVolatile Organic Hazardous Air Pollutants are thoseClean Air Act Hazardous Air Pollutants with boilingpoint under 100(C. These compounds exist only as avapor at room temperature. VOHAP are a subset ofTHC.
29
Definitions of the Pollutants (cont)
� PAHPoly-cyclic Aromatic Hydrocarbons are aclass of about 100 organic compounds thatincludes a number of carcinogens. PAH are asubset of SVOHAP.
US_EPA
The CAAA lists POM's which is a much broader list of compounds.
30
Test Programs Conducted�California (Plant C)
!Truck Loading and Silo FillingàParticulate EmissionsàOrganic Particulate
ÚSVOHAPÚPAH
àParticulate DepositionàVaporous Emissions
ÚTHCÚVOHAP
àMetals
US_EPA
The emissions captured include emissions from the asphalt itself, from truck exhaust and from fugitive dust from plant activity and truck traffic.
US_EPA
This includes emissions captured from loading operations and from truck exhaust.
US_EPA
The list of HAP compouds that were looked for included over 150 individual compounds
US_EPA
Metals emissions were not measured. However, analyses of the virgin asphalt and extracted asphalt from the RAP were analyzed.
US_EPA
A seperate test run was performed without any loading of HMA to determine the background concentration of pollutants.
31
Test Programs Conducted (cont)
�Massachusetts (Plant D)!Particulate Emissions
àTotalàOrganic
!Particulate Deposition
!Vaporous EmissionsàTHC
US_EPA
A background test was not conducted. However, the unpaved roadway was wetted to reduce the fugitive dust emissions. Since the HMA aggregate is fully coated with asphalt cement, the particulate emissions from truck loading are only organic.
US_EPA
The organic emissions from truck exhaust were excluded from the enclosure.
US_EPA
The organic emissions from truck exhaust were excluded from the enclosure.
Put metal plates on cielings to collect particulate. Put plates in ducts in Calif and cleaned out whole sections of duct in Mass.
US_EPA
This is a picture of the dryer stack sampling in Calif. This was not a source of primary interest but data was collected for another EPA program. However, it shows the setup used to collect samples for FTIR analysis. The hoses comming from the middle of the stack are heat traced sampling lines that keep the vapors from condensing out. The line going to the right is going to the FTIR instrument for continuous measurement. The line going down is going to the two boxes to the left of the kneeling person. This is the concentrated sample that will be thermally desorbed and analyzed by the FTIR. In addition to concentrating the sample some interfering gases (CO2 and water vapor) are removed.
US_EPA
This is a picture of the California plant and the truck load-out sampling location. The five HMA storage silos are the ones with red and blue stripes. The tunnel exhaust is the duct that goes out of the picture to the left. The tee to the exhaust hood for silo #1 is to the right of the scaffolding leaning against the exhaust duct support. The assembled scaffolding to the right is supporting the manual sampling equipment that is at a 45 degree angle. The meter boxes are in front of the group of three people on the left. One of the independent auditors is in the yellow helmet with this group of people. The truck was used to recover and clean up the sampling equipent. The trailer behind the truck was the location of the FTIR analysis unit and the THC analyzer.
US_EPA
This is a picture of the independent auditor as he is questioning one of the sample test crew about the procedures used during the test program.
US_EPA
This is a picture of the Silo exhaust duct sampling location. The sample boxes to the left of the center of the picture is a SVOHAP sampling system.
US_EPA
This is a picture of the FTIR sample distribution console and the PC that collected the spectra from the FTIR analysis cell.
US_EPA
This is a picture of a person collecting one of the many asphalt cement samples collected for analysis during the test program. This is a picture of the Calif plant.
US_EPA
This is a picture inside the tunnel exhast duct. The deposits visible were accumulated over the four years of operation of the California plant.
US_EPA
This is a picture of one of the plates installed on the cieling at the California plant to measure particualte deposition.
US_EPA
This is a picture of the duct that was replaced to install duct for sampling of the silo emissions. The deposition of four years of operation can be seen on the inside. The deposition was recovered for quantitative laboratory analysis.
US_EPA
This picture shows the recovery of the deposition material from the plate removed from the exhaust duct.
US_EPA
This is a picture of the collection of asphalt temperatures following load-out. There was about four minutes to allow the temperature reading to be obtained. Two thermometer were use to take temperature. One was provided by CAAP and was a candy thermometer. The other was a thermocouple with a probe that could go about 18 inches into the HMA.
US_EPA
This is a picture of the CAAP thermometer. Calibration revealed that it read about 3 to 4 degrees low at 212 degrees.
45
Audit Results� Contract for Draft Audit Report Ended
September 1998
�Test Method Validation
! Method validation is seldom if ever done on first test of asource
! Method validation is very expensive and complicated
! The test methods used at the California facility were thebest methods available for the type of emissions expected. Where a test method had known limitations, additionalmethods were also performed.
US_EPA
Generally, the Auditors were satisfied that the test contractors were meeting the goals of the project and performing the emissions testing properly. However, as with all auditors they are hired to identify problems and point out areas for improvement. The check lists the auditors used to evaluate the contractors were over 200 items long. Out of this list they identified five items that they said could potentially have an effect on data quality.
US_EPA
For example, VOHAPS were performed by FTIR, Method 18, Method 0030 and by portable GC/MS.
46
Manual Testing Audit Results� Surrogate Spiking of VOST prior to Sampling
would be Better than Laboratory Spiking
! Multiple analysis methods were performed and can beused for comparison.
! Surrogate spiking is not required for VOST sampling,however the Method 18 samples were spiked.
! The portable GC/MS samples are dynamically spiked andrecovery calculations are not required.
! All of the methods used had comparable concentrations. Therefore the overall results are not compromised.
US_EPA
Because no sorbent is used between the analytical instrument.
47
Manual Testing Audit Results (cont)
� Precision & Accuracy Stated in QAPP NotEstablished for Many Compounds of Interest
! Precision and accuracy was not determined.
! The results are based upon state of the art test methods whichprovide a sound assessment of the emissions from these operations
US_EPA
Precision and accuracy determinations would require multiple concurrent sampling. This would more than double to cost of the project with little increase in the quality of the results.
48
Instrumental Method Audit Results� It was not specifically stated that MRI’s QA officer
would perform an audit by randomly selecting datato follow through the analysis and data processing.
! MRI’s QA officer performed this type of audit toeliminate the possibility of systemic transcription andcalculation errors.
! EPA also performed this type of audit and found nosystemic errors.
49
Additional Manual Method Issues
�Load Out Emissions
! PAH species above calibration range
à Although these were outside the methodcalibration range, they were within the linearresponse range of the detector and do notaffect the reliability of the results
50
Additional Manual Method Issues
�Load Out Emissions
! Only two SVOHAP/PAH runs were analyzeddue to laboratory error
à One of the reasons for collecting three samples isto accommodate a loss of one of the sampleswithout significant compromise due to lab error.
US_EPA
The collection of three runs also allows for a limited analysis to determine whether one of the samples is an outlier. Both of the runs were very consistent.
51
Additional Manual Method Issues
�Load Out Emissions
!VOHAP analyses outside 14 day windowà It was not possible to analyze in this period due to lab
difficulties. Studies indicate that little sample is lost up toas long as 30 days following collection, so these results areacceptable.
52
Additional Manual Method Issues
�Silo filling emissions
!PAH samples dilutedà The major difficulty created by sample dilution is that the
internal spikes are lost and an estimate of the samplerecovery can not be made with certainty. Recoveries basedupon spikes performed in the laboratory were used in lieuof field spikes. The overall impact is believed to be smalland does not significantly affect the results.
US_EPA
In addition, the relative concentrations of PAH and the ratios of PAH compounds to MCEM were fairly consistent.
53
Additional Manual Method Issues
�Silo filling emissions
!VOHAP analyses outside 14 day windowà It was not possible to analyze in this period due to lab
difficulties. Studies indicate that little sample is lost up toas long as 30 days following collection, so these results areacceptable.
54
Additional Instrumental Method Issues
� Toluene and Hexane by FTIR are Higher thanOther Methods
! The spectroscopist believes that for this source, the resultsfrom a method that separates compounds for analysis aresuperior to the FTIR analyses.
! The difficulties experienced by the analysis of the FTIRspectra are due to the concentration and spectralsimilarities of a large number of non-target species.
! The FTIR results are not for the individual species but forthe overall class of compounds. The overall classemissions agree with the total hydrocarbons reported.
RTP_EML
Because of the difficulties in resolving the IR spectra in the area where C5 to C9 aliphatic HC would be evaluated, the one target compound (Hexane) could not be quantified individually. For the toluene, the concentrator method did not corroborate the software evaluation of the non-concentrated samples. It is believed that other spectra confounded the spectra.
RTP_EML
This is especially the case for the reported mass of hexane. Other aliphatic HC in the C5 to C9 range have spectra similar to hexane. This is epecially the case for pentane whose spectra is visually the most similar to the spectra used obtained for the silo exhaust.
55
Emission Information
�Units of Pounds per 100,000 Tons of Product
�Results from Tests
�Whole Facility
�Individual Processes
US_EPA
The typical small HMA facility produces about 100,000 tons of product per year. A typical large facility produces about 3 to 4 times this amount. The Calif facility, which is one of the largest production facilities in the US, has produced 10 times this for the four years of operation. The use of this metric was to avoid the use of scientific terminology that may confuse some.
US_EPA
Values presented include any background, capture efficiency and deposition adjustments.
US_EPA
This is the sum total of all processes and includes the additional emissions from the production operation and the asphalt cement storage tanks. It does not include the fugitive dust emissions from aggregate handling, truck traffic, and vehicle exhaust.
US_EPA
The whole facility emissions are broken down by each process for each group of pollutants.
56
Measured Emissions(per 100,000 tons of Product)
�Particulate Emissions!Truck Loading CA 4.95 pounds!Truck Loading MA 17.5 pounds!Silo Filling CA 13.6 pounds
�Vaporous Emissions!Truck Loading CA 134 pounds!Truck Loading MA 165 pounds!Silo Filling CA 269 pounds
US_EPA
The particulate emissions are the MCEM emissions since the fugitive dust emissions are the vast majority of the inorganic emissions.
US_EPA
For the California facility, the total PM (both inorganic and organic) was the same as the MCEM (organic) emission after background concentrations were subtracted.
US_EPA
Total Hydrocarbon Emissions)
57
Measured Particulate HAP’s(per 100,000 tons of Product)
There were 19 PAH compounds measured. Naphthalene was 21% of the total. The 7 compounds identified by the International Agency for Research on Cancer (IARC) as possible carcinogens are 2% of this total.
US_EPA
Based on multiplying the concentration of metals quantified in virgin and RAP asphalt times the MCEM emissions. Nickel was the most prevalent metal.
US_EPA
There were 12 PAH compounds measured. Naphthalene was 15% of the total. The 7 compounds identified by the International Agency for Research on Cancer (IARC) as possible carcinogens are 2% of this total.
US_EPA
Based on multiplying the concentration of metals quantified in virgin and RAP asphalt times the MCEM emissions. Nickel was the most prevalent metal.
58
Measured Volatile HAP’s(per 100,000 tons of Product)
Total Facility Emissions(per 100,000 tons of Product)
�Methodology!Production
à Used Average of Drum Mix and Batch MixFactors from Draft AP-42 Section
!Loading (Truck & Silo)à Used Average of CA and MA data
!Asphalt Storageà Pollutant Concentrations are the Same as
was Measured for Silo Loading
US_EPA
Individually, production emissions are different from batch and drum mix facilities due to the differences in the processes.
US_EPA
Since there was little difference in the emissions measured at the two facilities.
US_EPA
A number of methods were used to estimate these emissions. The use of the EPA TANKS model (used for oganic liquids storage tanks) with a material with a 1000 degree F boiling point (typical listing on MSDS's) estimated less than 0.1 pound of emissions. The use of the vapor pressure properties of Nonacosane (C29H60, bp = 825 degree F)) the highest molecular weight compound found in the Handbook of Chemistry and Physics, produced emissions of 6.25 pounds per year. The use of concentration equal to the silo vent (1.7 E-6 #/dscf PM and 4.85 E-5 #/dscf VOC) as the working loss for an asphalt storage tank produced emissions of 0.28 #/yr PM and 8.08 #/yr VOC (a revision of the emissions presented in the briefing). Since the equal concentration method produced the most conservitive emissions with a reasonable scientific basis, this estimate was used. Breathing losses were estimated by using the TANKS model and selecting a compound that would cause working loss emissions to equal the concentration measured in the silo exhaust. A temperature swing of 10 degrees above and below 350 degress was used to estimate breathing losses. Breathing losses were an additional 10% of working losses.
61
Total Facility Emissions (cont)(per 100,000 tons of Product)
Particulate Emissions by Process(per 100,000 tons of Product)
� Production 3,800 pounds PM 2,600 pounds PM10
2,087 pounds PM2.5
�Load Out 11 pounds
� Silo 13.7 pounds
� Asphalt storage 0.28 pounds
63
VOC Emissions by Process(per 100,000 tons of Product)
� Production - 2,317 pounds
� Load Out - 149 pounds
� Silo - 269 pounds
� Asphalt Storage 256 pounds
US_EPA
The revised calculations estimate VOC emissions at 8.1 pounds. The basis are calculations from data in the MRI report. The VOC emissions in the report are 1.9 #/hr, 0.41 #/hr and 0.93 #/hr. The silo vent rate for these tests were 507 dscfm, 443 dscfm and 229 dscfm. Therefore the average concentration was 4.85 E-5 #/dscfm. At 5.2% asphalt, 100,000 tons of HMA requires 5200 tons of asphalt. Asphalt has a specific gravity of 1.0 (+-0.1) and 5200 tons is 166,939 cubic feet. The resulting emissions would be 8.1 pounds. These emissions are based on an estimated temperature of 325 degrees F. Should the Asphalt storage tank operate at 350 degrees F, the estimate of the emissions would increase to about 18 pounds.
64
PAH Emissions by Process(per 100,000 tons of Product)
� Production - 12.8 pounds
� Load Out - 0.27 pounds
� Silo - 0.97 pounds
� Asphalt Storage - 0.02 pounds
65
Metals Emissions by Process(per 100,000 tons of Product)
� Production - 3.7 pounds�Load Out - 0.000002 pounds� Silo - 0.000007 pounds
66
Volatile HAP Emissions by Process(per 100,000 tons of Product)
� Production - 846 pounds
� Load Out - 0.95 pounds
� Silo - 7.6 pounds
� Asphalt storage - 6.6 pounds
US_EPA
Based upon the revised VOC emissions, the asphalt storage tank emissions would be 0.28 pounds or with an operating temperature of 350 degrees F 0.63 pounds.
67
CO Emissions by Process(per 100,000 tons of Product)
� Production - 33,000 pounds� Load Out - 0 pounds� Silo - 28 pounds� Asphalt storage - 24 pounds
US_EPA
Based upon the revised VOC estimates, the CO emissions would be 0.75 pounds.
68
NOX & SO2 Emissions(per 100,000 tons of Product)
�Nitrogen Oxide!Production 2,700 pounds
�Sulfur Oxide!Production 460 pounds
69
Conclusion�Two Emission Tests Performed
�Test Reports Distributed for Review
�Comment Period Ends September 15, 1999
�Additional Meeting to be Held after Comment Period
�Test Reports will be made Final
US_EPA
Comments to be sent in writing to Bob McConnell in EPA Region I
US_EPA
To clarify any comments on the reports. During the meeting the date was tentatively set for October 19, 1999.
US_EPA
The test reports will be finalized following the meeting. Depending on the extent of comments and the effort to address the comments the report should be made final by the end of the calendar year. Following the publication of the final test report revisions to the Draft AP-42 section will begin.