hospital preparedness program region 4€¦ · exercises and evaluate their performance in relation...
TRANSCRIPT

Florida Department of Health
Hospital Preparedness Program
2002-2010
August 2011

Table of Contents
Statewide Overview .......................................................................................................... 2
Region 1.......................................................................................................................... 14
Region 2.......................................................................................................................... 23
Region 3.......................................................................................................................... 31
Region 4.......................................................................................................................... 40
Region 5.......................................................................................................................... 51
Region 6.......................................................................................................................... 62
Region 7.......................................................................................................................... 71
Palm Beach County .................................................................................................. 72
Broward County ........................................................................................................ 82
Miami-Dade County .................................................................................................. 91
Monroe County........................................................................................................ 100
Hospital Preparedness Program Overview 2002-2010 Page 1

Florida Department of Health Hospital Preparedness Program
Statewide Overview
PURPOSE OF THE REPORT The Florida Department of Health, Hospital Preparedness Program has been working to assist Florida hospitals plan for and become more prepared to respond to all-hazard emergency events. As efforts to assist with the ongoing and continuous development of capabilities and capacity continue with hospital partners, it is important to examine the progress and current status of all hazards preparedness in the hospital setting. Data compiled for this report looks at the partnership from the regional, county, and individual hospital perspective. The purpose of this report is to provide a statewide and regional overview of efforts and progress and to provide information to assist with future planning and preparedness activities.
BACKGROUND Prior to September 11, 2001, the U.S. Department of Justice (DOJ) funded law enforcement and fire rescue units to increase their capabilities to respond to terrorist incidents involving chemical, biological, and radiological agents. After September 11, DOJ expanded emergency response activities to include health and medical support.
Since 2002, hospitals have been funded by the Florida Department of Health through the U.S. Department of Health and Human Services’ (HHS) Hospital Preparedness Program (HPP). In 2007, the HHS Office of the Assistant Secretary of Preparedness and Response (ASPR) assumed responsibility for the program, previously administered by the HHS Health Resources and Services Administration. Initially there were substantial annual increases in funding for equipment, training, and exercises. Over the past three funding cycles, funding has decreased and the program is moving toward sustainment and addressing the need to target clearly defined objectives.
As a result of the changing health care environment, increased attention to hospital disaster response preparedness, and the growing need for effective partnerships, better defined expectations and measures were included in changes to hospital contracts for equipment, training, and exercises. In addition, the creation of Target Capabilities and Universal Task Lists, as part of the U.S. Department of Homeland Security’s National Response Framework (NRF), led to cooperative agreement guidance that increasingly asked hospitals to strengthen exercises and evaluate their performance in relation to these target capabilities. Florida
Hospital Preparedness Program Overview 2002-2010 Page 2

hospitals have been making progress in their preparedness capabilities and objectives in each successive year.
During the last several years, efforts were made to align the ASPR capability based objectives with disaster preparedness requirements of Florida state licensure and Joint Commission emergency management accreditation standards. This has led to a higher level of overall preparedness and aligned the various exercise requirements for hospitals.
PROGRAM OVERVIEW Recognizing the critical role of hospitals in community preparedness, in 2002, the US Department of Health and Human Services, Health Resources and Services Administration (HRSA) began offering cooperative agreement funds to state health departments to increase hospital preparedness and response to man-made and natural disasters. As a part of the Florida Department of Health (FDOH) efforts to support statewide all hazards preparedness, the department has worked with hospitals to promote increased collaboration, partnerships, and progress toward common goals.
Through funding cycle 2009-2010, more than $119 million of federal funds have been awarded to hospitals in the state using a contractual process. In 2002, when the HPP began, the emphasis was on engaging hospitals with EDs and offering them contracts based on allocation of resources at the regional and local level. Contracts were focused in three areas; equipment, training, and exercises.
The overall expenditures reflect a high level of funding for equipment. Initially there were specific equipment purchases that were identified as priority items and equipment that was needed to meet a minimum standard or level of preparedness. For the last few years, many hospitals have moved to equipment maintenance and sustainment.
Approximately $9.5 million of the funding was used by hospitals to conduct training. Almost $7.35 million more was used for exercises to test, evaluate, and improve response capacity. Early on, awareness training was needed. As the program matured training has shifted to more complex and detailed information. Similar progress is also seen with regard to exercises. In the early years, there were many scenarios and table top exercises, however, hospitals are now moving to drills, functional and full scale exercises. These exercises, along with the training, equipment, and supplies have greatly expanded hospital capacity to respond to actual disasters.
At first the focus was on contracts with individual hospitals. As we have seen the growth of hospital systems, mergers, and buyouts, some hospital systems have requested contracts with the system or with the largest or parent hospital with the smaller hospitals identified as recipients of equipment, training, or exercises. The objective of this approach is to reduce the burden of managing a contract for smaller hospitals and to leverage the purchasing power of hospital systems.
Hospital Preparedness Program Overview 2002-2010 Page 3

Florida Hospitals
The total number of hospitals in Florida has fluctuated since the beginning of this program. While this report recognizes hospitals without emergency departments and other hospital facilities such as Veteran’s Hospitals, the focus of the federal program and this report is on hospitals with emergency departments. For hospital and bed information this report uses the Florida Agency for Health Care Administration (AHCA), January 2010, Florida Hospital Bed Need Projections and Service Utilization by District Report. There are currently 208 hospitals in the state with emergency departments (EDs) with 55,182 licensed beds. An additional four hospitals that participated in the program have closed. According to information from the Florida Hospital Association, 91% percent of the current hospitals with EDs are Joint Commission accredited. The Joint Commission is an independent, not-for-profit organization which accredits and certifies more than 16,000 health care organizations and programs in the United States. The Joint Commission’s mission is “to continuously improve the safety and quality of care provided to the public through the provision of health care accreditation and related services that support performance improvement in health care organizations. Hospitals obtaining this accreditation have an emergency operations plan and all hazard emergency response capabilities.
Florida has 13 hospitals designated by the Center for Medicare and Medicaid Services as critical access hospitals. A critical access hospital, as defined in section 408.07(15), Florida Statutes, is a small rural hospital of 25 beds or less that is reimbursed for 101 percent of the cost of providing services to Medicare patients as a means to stabilize and improve access to hospital care in rural areas. A critical access hospital must provide 24 hour emergency, outpatient, and limited inpatient services, and must meet other requirements to support the services provided.1 These hospitals and 15 others in Florida are identified as Statutory Rural Hospitals.2 A rural hospital, as defined in section 395.602, Florida Statutes, is an acute care hospital licensed under Chapter 395 of the Florida Statutes, having 100 or fewer licensed beds and an emergency room which is:
1. The sole provider within a county with a population density of no greater than 100 persons per square mile;
2. An acute care hospital, in a county with a population density of no greater than 100 persons per square mile, which is at least 30 minutes of travel time, on normally traveled roads under normal traffic conditions, from any other acute care hospital within the same county;
1 Agency for Health Care Administration Facility/Provider Definitions http://www.floridahealthfinder.gov/about-ahca/facility-locator-glossary.aspx Retrieved 4/1/2011 2 Agency for Health Care Administration Facility/Provider Locator. http://www.floridahealthfinder.gov/facilitylocator/FacilitySearch.aspx . Retrieved 4/8/2011
Hospital Preparedness Program Overview 2002-2010 Page 4
3. A hospital supported by a tax district or sub district whose boundaries encompass a population of 100 persons or fewer per square mile;
4. A hospital in a constitutional charter county with a population of over 1 million persons that has imposed a local option health service tax pursuant to law and in an area that was directly impacted by a catastrophic event on August 24, 1992, for which the Governor of Florida declared a state of emergency pursuant to chapter 125, and has 120 beds or less that serves an agricultural community with an emergency room utilization of no less than 20,000 visits and a Medicaid inpatient utilization rate greater than 15 percent;
5. A hospital with a service area that has a population of 100 persons or fewer per square mile. As used in this subparagraph, the term “service area” means the fewest number of zip codes that account for 75 percent of the hospital’s discharges for the most recent 5-year period, based on information available from the hospital inpatient discharge database in the Florida Center for Health Information and Policy Analysis at the Agency for Health Care Administration; or
6. A hospital designated as a critical access hospital, as defined in s. 408.07(15).
Program Partnership Advancements
The partnership between the federal program, the state, and hospitals has continued to develop, resulting in closer communications, easier access to information, and advances in hospital all hazard preparedness. Some of the activities and achievements that have contributed to increased preparedness include:
Distribution of funding for training, exercise, and equipment
Establishment of a statewide services position to serve as liaison to the hospitals for statewide hospital assessment, information dissemination, and communication support.
Development of a webpage on the department’s Internet for sharing of information, resources and tools
Development of a webpage on the department’s Internet for hospital contract forms, instructions, tools, and related information
Compilation of resources and information to assist hospitals in establishing Mutual Aid Agreements
Development and updating of Recommended Core Competencies for Hospital Personnel
Establishment of regular communication opportunities to address questions, concerns and to share best practices
Hospital Preparedness Program Overview 2002-2010 Page 5
History of Florida Hospital Preparedness Funding and Program Milestones
2001-2002 DOJ/Florida State Domestic Security Working Group
9/11 and anthrax attacks spurred funding beyond EMS and police
Funds limited to bioterrorism hazard
Included initial purchase and drop-shipment of PPE and decontamination equipment from DOJ to 21 hospitals
No funding for training
Initiation of Hospital Emergency Incident Command System (HEICS)
2002-2003 HRSA –Total Available to Hospitals $6.1M; Total Spent $4.3M
Contracts issued from the Office of Public Health Preparedness to individual hospitals
Limited to bioterrorism hazard
Funds for equipment, training, exercises, medicines and vaccines, and communication equipment
Florida Hospital Association provided guidance for hospital needs and priorities
2003-2004 HRSA – Total Available to Hospitals $15.7M; Total Spent $11.6M
Funded more hospitals, including smaller community hospitals to purchase PPE and decontamination equipment
Funds for increased decon teams’ capability and exercise
Supported equipment, training, exercises, laboratory equipment, burns equipment and supplies, burns education, pediatric triage and treatment equipment and training, and ventilators
Initiated USF hospital exercise evaluation form
2004-2005 HRSA – Total Available to Hospitals $26.4M; Total Spent $19.2M
Funded replacement of Decon tents to ones that could be setup quickly
HEICS integrated with Decon exercises
Hospitals did internal drills and began community exercise participation
Florida experienced a series of hurricanes
Supported installation of 57 negative pressure units, ICU equipment, trauma cart equipment, triage equipment, hospital preparedness training, communications equipment, ventilators, PPE and Decontamination equipment, PPE training, exercises, laboratory equipment, burns equipment and supplies, and burns education
2005-2006 HRSA – Total Available to Hospitals $35.9M; Total Spent $28.7M (’05-‘06 and ’06-‘07 contracts were combined funding)
Use of funds for an all-hazards approach allowed
Hospital Preparedness Program Overview 2002-2010 Page 6
Hospitals continue to receive funding for ventilators, negative pressure units, burn surge equipment and training, trauma equipment, triage, laboratory equipment, ICU Equipment, and communications equipment
Piloted a web-based Event Management System in three regions
Florida again experienced several disaster events
2006-2007 HRSA – (See 2005-2006)
All-hazards approach integrated into CEMP
Florida experienced multi-county wildfires
2007-2008 ASPR – Total Available to Hospitals $19.2M; Total Spent $16.5M
Reorganization of HRSA program to HHS’s ASPR as part of the Hospital Preparedness Program
Lessons learned from Katrina were integrated; hospitals asked to exercise and evaluate their evacuation plans, mass fatality plans, interoperable communications with emergency response partners, bed tracking systems, and volunteer registration and management systems
Medical surge target capability served as the primary focus
Florida Medical Surge Capability Team formed, including Hospital Surge and Community Surge Team Members
Hospitals continue to receive funding for PPE equipment, laboratory equipment, triage equipment, negative pressure units, exercises, and ventilators
Hospitals began receiving funding for Pan Flu equipment and supplies, operating room equipment, and hospital target hardening equipment
HSEEP information and after-action reports included in exercise evaluations
2008-2009 ASPR – Total Available to Hospitals $10.3M; Total Spent $8.9M
HSEEP compliant exercises required for hospitals
Hospitals continue to receive funding for PPE and Decontamination equipment, PPE training, OR equipment, negative pressure units, and exercises
Hospitals began receiving funding for web-based Event Management System and a new Telecommunications Service Priority project (as mandated in the ASPR cooperative agreement)
2009-2010 ASPR – Total Available to Hospitals $6.5M; Total Spent $5.5M
Multi-year Training and Exercise Program required in evaluations
Hospitals received funding for equipment previously approved from all categories (PPE, labs, triage, etc.), preparedness training, and exercises
CDC – Total Available to Hospitals $2.5M; Total Spent $2.5M
H1N1 funds directed for a state ventilator cache
Hospital Preparedness Program Overview 2002-2010 Page 7
2010-2011 ASPR – Total Available to Hospitals $7.8M
DOH Health and Medical and ASPR Approved Equipment and Supplies List Guiding Principles revised
Hospital Exercise Tool revised to allow aggregate analysis for trending
Hospital Equipment list reorganized and prioritized
THE STATE AND REGIONS Florida’s domestic preparedness activities are organized into seven Regional Domestic Security Task Forces.3 The HPP data from the last nine years have been organized by region. There are variations within the regions due to the diversity of the state and different levels of resources. Regions look different due to unique partner relationships, population, geographic locations, and other factors.
The 2010 U.S. Census population for Florida is 18,801,310.4 Seventeen percent of the state is age 65 or older. Seventeen percent of persons under 65 years old have no health insurance. Seventeen percent of the population has one or more disabilities.
Florida has urban areas of high density populated by large numbers of retirees, highly populated tourist areas, and large sparsely populated rural and agricultural areas. Thirty-three of Florida’s counties are defined by Florida Statutes as being rural with a population density of less than 100 individuals per square mile. In addition numerous areas in other counties are made up of large rural areas. The latest Florida Migrant and Seasonal Farmworker Enumeration Profiles Study commissioned by the Health Resources Services Administration, September, 2000, reports that the state’s agricultural industry is second only to tourism in economic importance. According to the study there were an estimated 286,000 farmworkers and family members in the state with 31 counties having at least 1,500 farmworkers. While it may not sound obvious because they are generally thought of as urban areas, the largest populations of farmworkers were found in Palm Beach and Hillsborough counties.5
Counties in Florida face a variety of risks and hazards which can challenge hospital preparedness. The large coastal area puts the state at high risk for hurricanes and floods. According to the State of Florida Enhanced Hazard Mitigation Plan, August 2010, 59 of Florida’s counties are rated at high risk for hurricanes and 40 counties are rated high risk for flooding. The state has three operating nuclear power plants located in Citrus County, St. Lucie County
3 Florida Department of Law Enforcement RDSTF Organization. http://www.fdle.state.fl.us/Content/getdoc/949c2698-2ed4-478c-ad98-7f9a6fbb91d7/Domestic-Security-Organization.aspx 4 State population is from the 2010 US Census – Other demographic statistics are from the FDOH Vulnerable Population profiles. http://www.floridashealth.com/prepare/VulnerablePopulations.html. 5 http://www.ncfh.org/enumeration/PDF3%20Florida.pdf. Retrieved 7-13-11.
Hospital Preparedness Program Overview 2002-2010 Page 8
and Miami-Dade County. Additional hazard information and descriptions of each region are included in the regional reports.
Hospital Participation
For the purpose of this report, a participating hospital is defined as one with an emergency department that has been offered, accepted, and executed contract with the Florida Department of Health. Some of the larger hospital systems receive funds for more than one hospital in their system. When this occurs there may be one contract, however, the funds and preparedness resources are provided to other hospitals in the system. This allows the contracting hospital to leverage their purchasing power and expedite the expenditure of funds. In such cases, each hospital receiving funds directly or indirectly is included as participating.
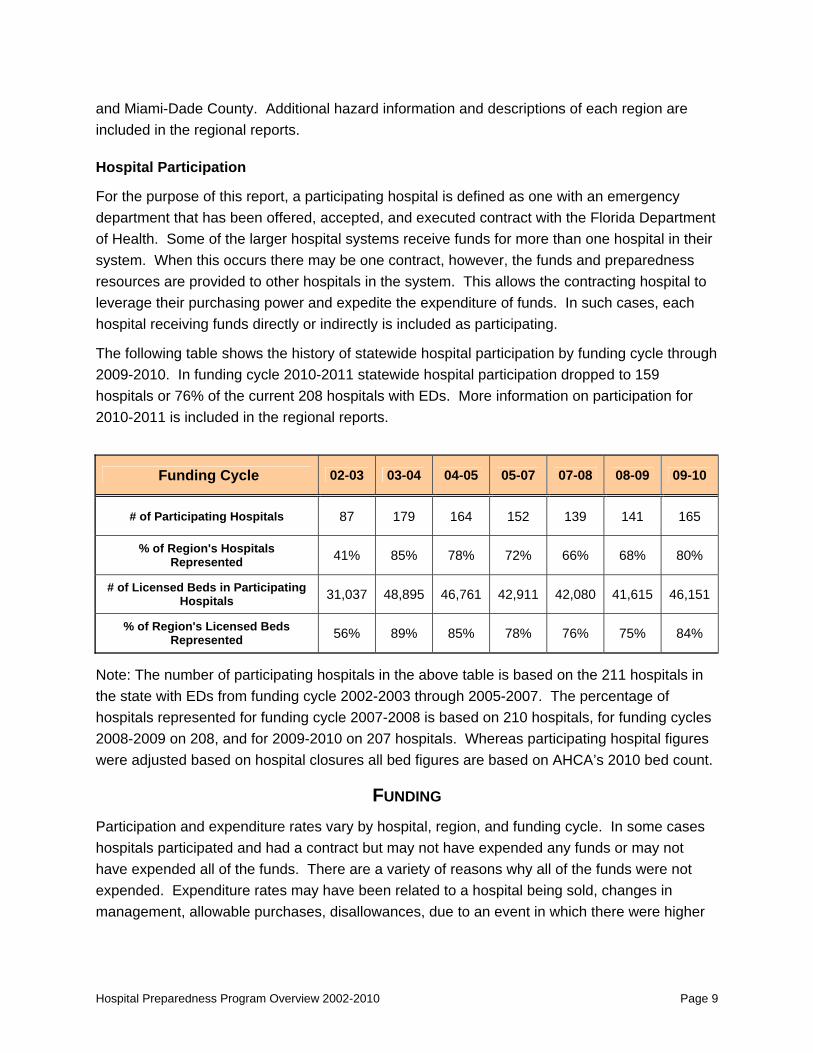
The following table shows the history of statewide hospital participation by funding cycle through 2009-2010. In funding cycle 2010-2011 statewide hospital participation dropped to 159 hospitals or 76% of the current 208 hospitals with EDs. More information on participation for 2010-2011 is included in the regional reports.
Funding Cycle 02-03 03-04 04-05 05-07 07-08 08-09 09-10
# of Participating Hospitals 87 179 164 152 139 141 165
% of Region's Hospitals Represented 41% 85% 78% 72% 66% 68% 80%
# of Licensed Beds in Participating Hospitals 31,037 48,895 46,761 42,911 42,080 41,615 46,151
% of Region's Licensed Beds Represented 56% 89% 85% 78% 76% 75% 84%
Note: The number of participating hospitals in the above table is based on the 211 hospitals in the state with EDs from funding cycle 2002-2003 through 2005-2007. The percentage of hospitals represented for funding cycle 2007-2008 is based on 210 hospitals, for funding cycles 2008-2009 on 208, and for 2009-2010 on 207 hospitals. Whereas participating hospital figures were adjusted based on hospital closures all bed figures are based on AHCA’s 2010 bed count.
FUNDING Participation and expenditure rates vary by hospital, region, and funding cycle. In some cases hospitals participated and had a contract but may not have expended any funds or may not have expended all of the funds. There are a variety of reasons why all of the funds were not expended. Expenditure rates may have been related to a hospital being sold, changes in management, allowable purchases, disallowances, due to an event in which there were higher
Hospital Preparedness Program Overview 2002-2010 Page 9

Hospital Preparedness Program Overview 2002-2010 Page 10
priorities, or other unique reason. Specific reasons could be determined with additional individual review.
The following table shows the history of Hospital Preparedness Program funds in dollars allocated and executed to, and spent by hospitals with emergency departments. Of the total funds through 2009-2010, 59% was allocated to hospitals having more than 350 beds. Information is presented by funding cycle. Funding cycles correspond with state fiscal years. One funding cycle encompassed two fiscal years (2005-2007).
Funding Cycle Total Amount Allocated
Total Amount in Executed Contract
Total Amount Spent
% of Executed Contract Funds
Spent 2002 - 2003 6,078,396 6,075,777 4,310,768 71%
2003 - 2004 15,740,191 15,736,436 11,618,554 74%
2004 - 2005 26,365,474 26,365,474 19,174,395 73%
2005 - 2007 35,949,639 35,057,246 28,681,435 82%
2007 - 2008 19,207,010 19,079,310 16,468,131 86%
2008 - 2009 10,268,480 10,268,480 8,901,982 87%
2009 - 2010 6,515,608 6,514,685 5,506,659 85%
Total All FCs 120,124,798 119,097,408 94,661,924 79%
Additional funding Information is included in the regional reports.
Programmatic Funding Categories
Data about funding and participation was gathered in four categories:
Equipment
Training
Exercises
Other
The “other” category was used to capture the funds spent on personnel, the Web-Based Event Management Software Pilot Project, and the Telecommunications Service Priority initiative.
The following table presents a statewide overview of the types of purchases by category. In most cases, the prioritization of the purchases was based on federal guidance, target capabilities of the department’s plan, and local and regional assessments.

Statewide Items Purchased in the Equipment, Training, Exercise, and other Categories
Funding Categories and Programs
FY 2002-2003
FY 2003-2004
FY 2004-2005
FY 2005-2007
FY 2007-2008
FY 2008-2009
FY 2009-2010
EQUIPMENT PPE/Decon Y Y Y Y Y Y Y
Communications Y Y Y Y Medicine and Vaccines Y
Burns Equipment and Supplies Y Y Y Laboratory Y Y Y Y
Pediatric Triage and Treatment Y Ventilators Y Y Y
ICU Y Y Trauma Carts Y Y
Negative Pressure Units Y Y Y Y Triage Y Y
Pan Flu Equipment and Supplies Y Operating Room Y Y
Hospital Critical Infrastructure Y Medical Surge Equipment and Supplies Y
TRAINING PPE/Decon Y Y Y Y Y Y
Biomedical Ventilator Maintenance Y Burns Education Y Y Y
Pediatric Triage and Treatment Y EXERCISES
Y Y Y Y Y Y Y OTHER
Personnel Y Web Based Event Mgmt Pilot Y Y
Telecommunications Service Priority Y Note: Training and Exercises funding was combined for FY2009-2010
The following tables present the total amounts spent by funding category through funding cycle 2009-2010. In funding cycle 2009-2010, training and exercise funds were combined. For purposes of these tables they have been separated and equally allocated to each category. In some of the regions additional funding was provided to other hospitals (those without EDs or Veteran’s Administration hospitals) for special projects. The tables include funds spent by other hospitals.
Hospital Preparedness Program Overview 2002-2010 Page 11

Hospital Type
Grand Total Equipment Spent
Grand Total Training Spent
Grand Total Exercises Spent
Grand Total Other Spent
Grand Total SPENT
With EDs $76,682,270 $9,443,116 $7,267,797 $1,268,741 $94,661,924
Other $278,003 $45,348 $78,324 $0 $401,674
ALL $76,960,273 $9,488,464 $7,346,120 $1,268,741 $95,063,598
The table below shows the history of funding for all hospitals (those with EDs and Others) broken out by region and funding category. While there was some fluctuation in the number of hospitals during individual funding cycles, this table represents the total number of hospitals throughout the funding cycles.
Region
Total #
of
Hospitals
2002‐2010 Total Allocated
2002‐2010 Total Executed
2002 ‐ 2010 Total Spent
2002 ‐ 2010 % Executed Spent
2002‐2010 Equipment $$
Spent
2002‐2010 Training $$
Spent
2002‐2010 Exercise $$
Spent
2002‐2010 Other $$ Spent
1 25 $11,992,042 $11,988,042 $9,562,910 79.8% $7,896,979 $890,103 $701,587 $74,2412 15 $4,909,392 $4,785,691 $3,954,199 82.6% $3,112,958 $442,479 $334,761 $64,0003 37 $14,543,386 $14,540,886 $12,205,994 83.9% $10,008,387 $1,213,281 $826,326 $158,0004 56 $23,954,977 $23,628,359 $18,666,223 79.0% $15,517,391 $1,579,517 $1,474,315 $95,0005 53 $21,771,897 $21,202,250 $16,795,353 79.2% $13,281,186 $1,846,971 $1,363,696 $303,5006 31 $9,844,578 $9,843,655 $6,927,710 70.4% $4,973,961 $1,044,833 $788,917 $120,0007 81 $33,643,826 $33,643,826 $26,951,209 80.1% $22,169,411 $2,471,281 $1,856,517 $454,000ALL 298 $120,660,098 $119,632,708 $95,063,598 79.5% $76,960,273 $9,488,464 $7,346,120 $1,268,741
CLOSING COMMENTS The department will continue to support the ongoing and continuing all hazards preparedness capabilities of hospital partners. The most important work and efforts take place at the local and regional levels as hospitals collaborate, plan, and exercise together. Local and regional level partners have the insights and connections with their hospital counterparts to effectively plan for and respond to events.
This report provides an overview. Review of the data may result in the desire to take a closer look at portions or subsets of the data for specific regions, counties, or hospitals. Regional and local staff may find multiple ways to use this information as they ask themselves:
What does this mean for my region?
What lessons can be learned?
Hospital Preparedness Program Overview 2002-2010 Page 12
Hospital Preparedness Program Overview 2002-2010 Page 13
What are the trends?
Is there follow-up needed to better understand some of the results?
What future action can be taken to maximize resources and preparedness activities?
Additional questions and recommendations may arise as a result of this initial review and compilation. Specific questions can be directed to the Bureau of Preparedness and Response, Medical Surge Team.
The department will to continue to improve the contracting process and provide hospitals with templates to make reporting and documentation less cumbersome. Regional staff will also be provided more information related to timelines, federal requirements, and Department of Financial Services requirements.
Available resources will be maintained, added to, and enhanced to ensure that program staff, contract managers, regional, and local staff all have the same information.
The shared program goal is to ensure healthcare partners are prepared for, able to respond to, and recover from any threat, natural or man-made. Events can be a single emergency temporarily disrupting services or an extended event adversely affecting a hospital’s ability to provide care, treatment, and services. The department will continue to work with hospitals in their all-hazards approach to preparedness, response, and recovery to achieve this shared goal. It is anticipated that there will continue to be challenges as the program evolves. The department and hospital partners will need to address competing priorities for limited resources as well as gaps in the level of preparedness throughout the healthcare system.

Hospital Preparedness Program Regional Domestic Security Task Force
Region 1
PROGRAM OVERVIEW This report provides a descriptive analysis of the Hospital Preparedness Program (HPP) participation and programmatic focus for Region 1. The information provides an overview of regional and county specific partnerships with local hospitals. Information is intended to provide a picture that can be used to confirm and document what is happening in the region and to assist with planning for future activities
THE REGION Region 1 is made up of ten counties, Bay, Calhoun, Escambia, Gulf, Holmes, Jackson, Okaloosa, Santa Rosa, Walton, and Washington. The 2010 U.S. Census population for this Region is 978,765.6 The smallest county is Calhoun with a population of 14,625 and the largest county is Escambia with a population of 297,619. Fifteen percent of the region’s population is age 65 or older. Fifteen percent of persons under 65 years old have no health insurance. Almost 18% of the population has one or more disabilities.
The region is demographically and economically diverse. Six of the ten counties are defined by Florida Statutes as being rural with a population density of less than 100 individuals per square mile. Eight or 29% of the state’s 28 designated rural hospitals7 are in this region. Four of these hospitals are also designated as critical access hospitals, accounting for 31% of the state’s 13 critical access hospitals.
The region has a significant agricultural industry employing seasonal and resident workers who historically have had limited access to healthcare resources. At the same time, the coastal areas of the counties attract retirees and visitors. The region also has a large military presence with Eglin Air Force Beach in Ft. Walton Beach, Tyndall Air Force Base southeast of Panama City, a Coast Guard Station in Destin, the Panama City Naval Surface Warfare Center, the Pensacola Naval Air Station, and Whiting Field Naval Air Station in Milton. Eglin and Tyndall Air Force Bases and the Pensacola Naval air station have their own medical facilities. The region’s proximity to the Alabama border can result in persons coming to or leaving Florida to receive
6 County population is from the 2010 US Census – Other demographic statistics are from the FDOH Vulnerable Population profiles. http://www.floridashealth.com/prepare/VulnerablePopulations.html. 7 Agency for Health Care Administration Facility/Provider Locator. http://www.floridahealthfinder.gov/facilitylocator/FacilitySearch.aspx . Retrieved 4/8/2011
Hospital Preparedness Program Overview 2002-2010 Page 14

healthcare services. The region is also home to a mid-sized university in Escambia County and four community colleges bringing in additional temporary residents.
According to the State of Florida Enhanced Hazard Mitigation Plan, August 2010,8 the number of counties in the region rated at high risk for hazards is:
Counties Rated
High Hazard Hazards
8 Hurricanes 6 Flooding 5 Wildfires 4 Tornados 3 Severe Storms 2 Drought; Erosion
1 Dam Failure; Landslides; Technological Events, Winter Storms, Terrorism
The large rural geographic area along with the age and diversity of the population, and the risks for hazards present the hospitals in this region a wide range of challenges for all-hazard planning and preparedness.
The region currently has19 hospitals with emergency departments (EDs), with a total 3,087 licensed beds. Information throughout this report on licensed beds is based on the Florida Agency for Health Care Administration, January 2010, Florida Hospital Bed Need Projections and Service Utilization by District report.9 There are an additional 6 hospitals without EDs. These are primarily specialty hospitals providing such services as rehabilitation and behavioral health. Among the 19 hospitals one is designated as both a Level 2 and Pediatric Trauma Center with one other is designated as a Level 2 Trauma Center.10
Seventy-four percent or 14 of the hospitals with emergency departments are Joint Commission accredited which requires an emergency operations plan and all hazards emergency response capabilities. Three of the hospitals without EDs are also Joint Commission accredited.
PARTICIPATING HOSPITALS For the purpose of this report, participation is defined as a hospital with an emergency department that has been offered, accepted, and executed a contract with the Florida Department of Health. Information is presented by funding cycle (FC). Funding cycles
8 Enhanced State Hazard Mitigation Plan 2010 http://www.floridadisaster.org/mitigation/State/Index.htm . Retrieved 5-18-11 9 While the numbers did not vary significantly over the seven funding cycles 2002-2003 to 2009-2010 can be considered estimates. 10 Agency for Health Care Administration Facility Search, http://www.floridahealthfinder.gov/facilitylocator/FacilitySearch.aspx . Retrieved 5-17-11
Hospital Preparedness Program Overview 2002-2010 Page 15

Hospital Preparedness Program Overview 2002-2010 Page 16
correspond with state fiscal years. One funding cycle encompassed two fiscal years (2005-2007).
Preliminary observations based on the data indicate:
♦ Nine of the 19 hospitals with EDs, participated in the Hospital Preparedness Program for at least seven funding cycle. Two hospitals participated in all of the eight funding cycles.
♦ Six of the 19 hospitals with EDs, participated in three or fewer funding cycles. One hospital, Jay Hospital has never participated.
♦ Hospital participation ranged from a low of six in funding cycle 2002-2003 to a high of 15 in funding cycle 2003-2004.
♦ In funding cycle 2010-2011, 12 hospitals participated, accounting for 2,374 licensed beds accounting for approximately 77% of the available hospital beds.
♦ The three largest hospitals account for 48% of the licensed beds in the region.
♦ Fourteen of the 19 hospitals in the region are part of eight hospital corporations or systems, Baptist Healthcare, HCA (Hospital Corporation of America), Sacred Heart Health System, HMA (Health Management Associates, Inc.), Calhoun Liberty Hospital Association, Inc., Healthmark Corporation, Quorum Health Resources, and Community Health Systems.11
♦ In addition to hospitals with EDs included in this analysis, HealthSouth Emerald Coast Rehabilitation Hospital received funding during the 2007-2008, 2008-2009, and 2009-2010 funding cycles for the web event management system pilot project, and for equipment and exercises. Total funding allocated and executed during the three funding cycles was $131,350 with $105,964 spent. The lower amount spent is related to funds allocated for the web event management system pilot project not being spent.
Figure 1 displays participation over eight funding cycles. The first column for each funding cycle shows the percentage of hospitals with EDs that participated. The next two columns indicate the number and percentage of the region’s licensed beds. The figure illustrates that in the first year 6 of the hospitals participated, representing 57% of the region’s licensed beds. Participation increased dramatically for the next funding cycle and then fluctuated during the following two funding cycles. There was a slow decrease in hospitals participating beginning with funding cycle 2007-2008. Participation rose again slightly for 2010-2011.
11 Florida Hospital Association, Hospital Directory, http://www.fha.org/DirectoryLookupResults. Retrieved July 1, 2011.

Figure 1: Region 1 Pattern of Participation by Funding Cycle
Pattern of Participation by Funding Cycle
32%
79%
68%
74%
63%
58%
53%
63%
57%
84%
83%
78% 82
%
75%
65%
77%
1,748
2,578
2,555
2,413 2,537
2,316
1,993
2,374
0%
10%
20%
30%
40%
50%
60%
70%
80%
90%
100%
FC 02‐03 FC 03‐04 FC 04‐05 FC 05‐07 FC 07‐08 FC 08‐09 FC 09‐10 FC 10‐11
% of H
ospitals and
Bed
s
0
500
1,000
1,500
2,000
2,500
3,000
# of Licen
sed Be
ds (2
010)
% of Region's Hospitals Represented % of Region's Licensed Beds Represented # of Licensed Beds in Participating Hospitals
Table 1 provides another way of looking at regional participation trends and includes the total number of hospitals.
Table 1: Region 1 Hospital Participation by Funding Cycle
Funding Cycle 02-03 03-04 04-05 05-07 07-08 08-09 09-10 10-11
# of Participating Hospitals 6 15 13 14 12 11 10 12
% of Region's Hospitals Represented 32% 79% 68% 74% 63% 58% 53% 63%
# of Licensed Beds in Participating Hospitals 1,748 2,578 2,555 2,413 2,537 2,316 1,993 2,374
% of Region's Licensed Beds Represented 57% 84% 83% 78% 82% 75% 65% 77%
Table 2 provides a side by side comparison of the hospitals with EDs participating in the HPP.
Hospital Preparedness Program Overview 2002-2010 Page 17
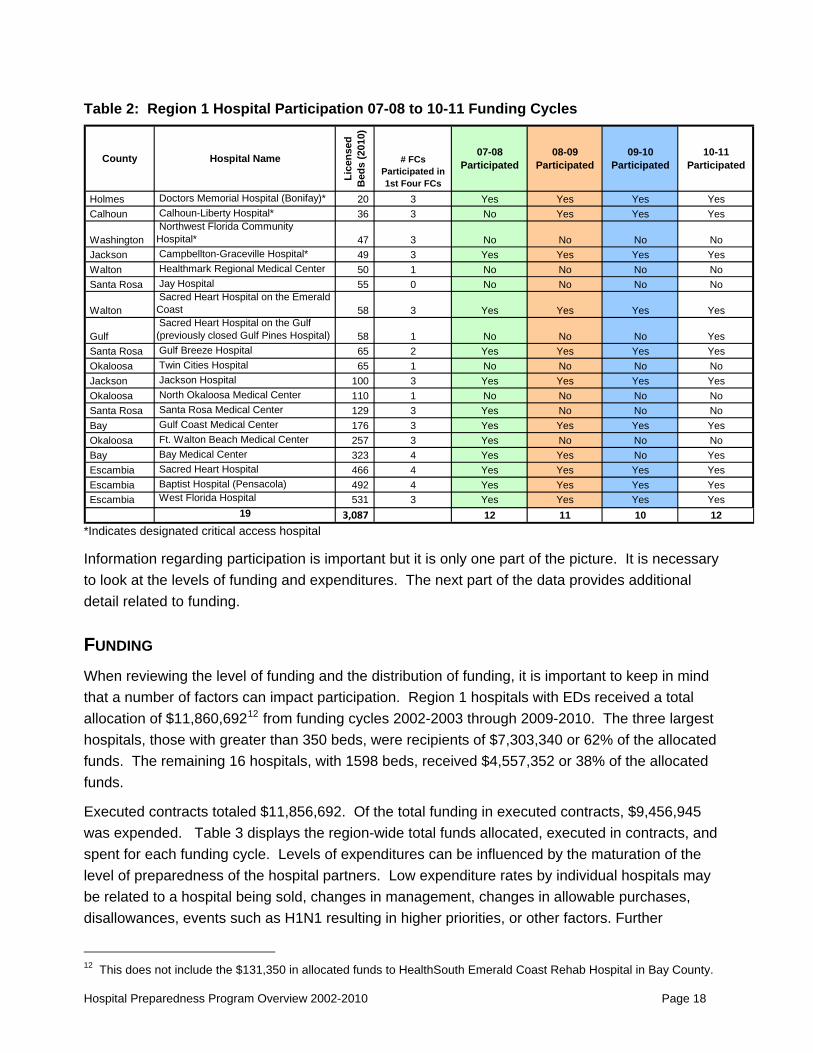
Table 2: Region 1 Hospital Participation 07-08 to 10-11 Funding Cycles
County Hospital Name
Lice
nsed
B
eds
(201
0)
# FCs Participated in 1st Four FCs
07-08 Participated
08-09 Participated
09-10 Participated
10-11 Participated
Holmes Doctors Memorial Hospital (Bonifay)* 20 3 Yes Yes Yes YesCalhoun Calhoun-Liberty Hospital* 36 3 No Yes Yes Yes
Washington Northwest Florida Community Hospital* 47 3 No No No No
Jackson Campbellton-Graceville Hospital* 49 3 Yes Yes Yes YesWalton Healthmark Regional Medical Center 50 1 No No No NoSanta Rosa Jay Hospital 55 0 No No No No
Walton Sacred Heart Hospital on the Emerald Coast 58 3 Yes Yes Yes Yes
Gulf Sacred Heart Hospital on the Gulf (previously closed Gulf Pines Hospital) 58 1 No No No Yes
Santa Rosa Gulf Breeze Hospital 65 2 Yes Yes Yes YesOkaloosa Twin Cities Hospital 65 1 No No No NoJackson Jackson Hospital 100 3 Yes Yes Yes YesOkaloosa North Okaloosa Medical Center 110 1 No No No NoSanta Rosa Santa Rosa Medical Center 129 3 Yes No No NoBay Gulf Coast Medical Center 176 3 Yes Yes Yes YesOkaloosa Ft. Walton Beach Medical Center 257 3 Yes No No NoBay Bay Medical Center 323 4 Yes Yes No YesEscambia Sacred Heart Hospital 466 4 Yes Yes Yes YesEscambia Baptist Hospital (Pensacola) 492 4 Yes Yes Yes YesEscambia West Florida Hospital 531 3 Yes Yes Yes Yes
19 3,087 12 11 10 12 *Indicates designated critical access hospital
Information regarding participation is important but it is only one part of the picture. It is necessary to look at the levels of funding and expenditures. The next part of the data provides additional detail related to funding.
FUNDING When reviewing the level of funding and the distribution of funding, it is important to keep in mind that a number of factors can impact participation. Region 1 hospitals with EDs received a total allocation of $11,860,69212 from funding cycles 2002-2003 through 2009-2010. The three largest hospitals, those with greater than 350 beds, were recipients of $7,303,340 or 62% of the allocated funds. The remaining 16 hospitals, with 1598 beds, received $4,557,352 or 38% of the allocated funds.
Executed contracts totaled $11,856,692. Of the total funding in executed contracts, $9,456,945 was expended. Table 3 displays the region-wide total funds allocated, executed in contracts, and spent for each funding cycle. Levels of expenditures can be influenced by the maturation of the level of preparedness of the hospital partners. Low expenditure rates by individual hospitals may be related to a hospital being sold, changes in management, changes in allowable purchases, disallowances, events such as H1N1 resulting in higher priorities, or other factors. Further
12 This does not include the $131,350 in allocated funds to HealthSouth Emerald Coast Rehab Hospital in Bay County.
Hospital Preparedness Program Overview 2002-2010 Page 18
individual review may be necessary to determine specific reasons and opportunities for improvement.
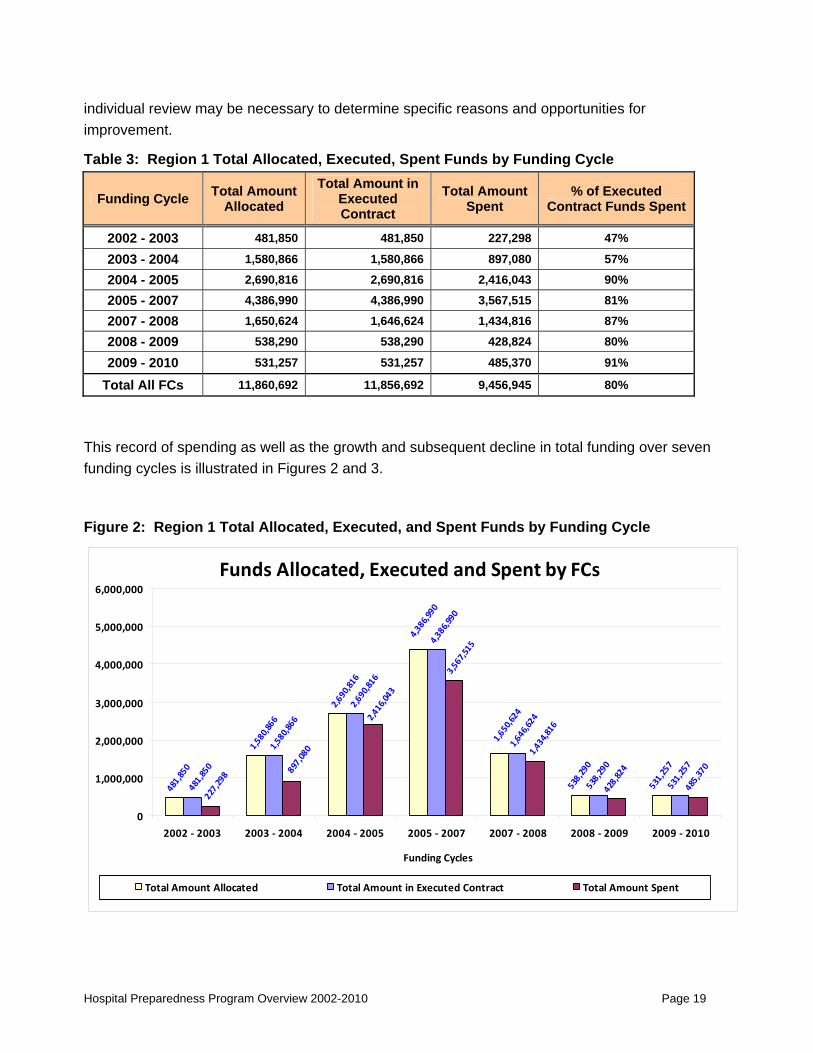
Table 3: Region 1 Total Allocated, Executed, Spent Funds by Funding Cycle
Funding Cycle Total Amount Allocated
Total Amount in Executed Contract
Total Amount Spent
% of Executed Contract Funds Spent
2002 - 2003 481,850 481,850 227,298 47%
2003 - 2004 1,580,866 1,580,866 897,080 57%
2004 - 2005 2,690,816 2,690,816 2,416,043 90%
2005 - 2007 4,386,990 4,386,990 3,567,515 81%
2007 - 2008 1,650,624 1,646,624 1,434,816 87%
2008 - 2009 538,290 538,290 428,824 80%
2009 - 2010 531,257 531,257 485,370 91%
Total All FCs 11,860,692 11,856,692 9,456,945 80%
This record of spending as well as the growth and subsequent decline in total funding over seven funding cycles is illustrated in Figures 2 and 3.
Figure 2: Region 1 Total Allocated, Executed, and Spent Funds by Funding Cycle
Funds Allocated, Executed and Spent by FCs538,290
531,257
538,290
531,257
428,824
485,370
481,850
1,580,866
2,690,816
4,386,990
1,650,624
481,850
1,580,866
2,690,816
4,386,990
1,646,624
227,298 89
7,080
2,416,043
3,567,515
1,434,816
0
1,000,000
2,000,000
3,000,000
4,000,000
5,000,000
6,000,000
2002 ‐ 2003 2003 ‐ 2004 2004 ‐ 2005 2005 ‐ 2007 2007 ‐ 2008 2008 ‐ 2009 2009 ‐ 2010
Funding Cycles
Total Amount Allocated Total Amount in Executed Contract Total Amount Spent
Hospital Preparedness Program Overview 2002-2010 Page 19

Figure 3: Region 1 Percentage of Executed Funds Spent
Percentage of Executed Contract Funds Spent47%
57%
90%
81% 87%
80%
91%
0%
10%
20%
30%
40%
50%
60%
70%
80%
90%
100%
2002 ‐ 2003 2003 ‐ 2004 2004 ‐ 2005 2005 ‐ 2007 2007 ‐ 2008 2008 ‐ 2009 2009 ‐ 2010
% of Executed Contract Funds Spent
Table 4 illustrates the percent of executed funds spent by each hospital over the seven funding cycles. Through funding cycle 2009-2010 hospitals have spent $9,456,945, or 80% of the executed contract amounts.
Table 4: Region 1 Hospitals’ Percentage of Funds Spent from Executed Contracts
More detail regarding the amount of funds allocated, executed, and spent by each hospital is available on request.
County Hospital Name
Lice
nsed
B
eds
(201
0) 02-03 Executed Contract
Spent
03-04 Executed Contract
Spent
04-05 Executed Contract
Spent
05-07 Executed Contract
Spent
07-08 Executed Contract
Spent
08-09 Executed Contract
Spent
09-10 Executed Contract
Spent
Holmes Doctors Memorial Hospital (Bonifay)* 20 73% 100% 53% 0% 61% 38%Calhoun Calhoun-Liberty Hospital* 36 50% 100% 69% 99% 100%Washington Northwest Florida Community Hospital* 47 0% 100% 0%Jackson Campbellton-Graceville Hospital* 49 100% 100% 27% 0% 100% 96%Walton Healthmark Regional Medical Center 50 78%Santa Rosa Jay Hospital 55
Walton Sacred Heart Hospital on the Emerald Coast 58 90% 56% 22% 97% 57% 69%
Gulf Sacred Heart Hospital on the Gulf (previously closed Gulf Pines Hospital) 58 0%
Santa Rosa Gulf Breeze Hospital 65 20% 92% 97% 99% 99%Okaloosa Twin Cities Hospital 65 85%Jackson Jackson Hospital 100 9% 100% 69% 96% 95% 100%Okaloosa North Okaloosa Medical Center 110 88%Santa Rosa Santa Rosa Medical Center 129 100% 100% 99% 98%Bay Gulf Coast Medical Center 176 47% 94% 42% 52% 100% 94%Okaloosa Ft. Walton Beach Medical Center 257 20% 2% 100% 0%Bay Bay Medical Center 323 78% 82% 100% 18% 24% 0%Escambia Sacred Heart Hospital 466 40% 51% 94% 98% 99% 99% 99%Escambia Baptist Hospital (Pensacola) 492 78% 41% 95% 60% 99% 100% 98%Escambia West Florida Hospital 531 64% 76% 84% 94% 95% 99%
Hospital Preparedness Program Overview 2002-2010 Page 20

*Indicates designated critical access hospital
PROGRAMMATIC FUNDING CATEGORIES Data about funding and participation was gathered in four categories:
♦ Equipment
♦ Training
♦ Exercises
♦ Other
The “other” category was used to capture the funds spent on personnel, Web-Based Event Management Software Pilot Project, and the Telecommunications Service Priority initiative.
Table 5 presents the total amounts spent across seven funding cycles. In funding cycle 2009-2010, training and exercise funds were combined. For purposes of this table they have been separated and equally allocated to each category.
Table 5: Total Funds Spent by Programmatic Category
Hospital Type
Grand Total Equipment
Spent
Grand Total Training
Spent
Grand Total Exercises
Spent Grand Total Other Spent
Grand Total SPENT
With EDs $7,839,515 $882,603 $660,587 $74,241 $9,456,945
Other $57,464 $7,500 $41,000 $0 $105,964
ALL $7,896,979 $890,103 $701,587 $74,241 $9,562,910
CLOSING COMMENTS As the Hospital Preparedness Program moves forward an important goal will be to support ongoing and continuous all hazards preparedness capabilities of hospital partners. The most important work and efforts take place at the local and regional level.
Local and regional hospital preparedness planners can apply their insights into local activities to use information in this report to build connections with local hospital partners to work, plan, and exercise together.
Additional questions to ask when reviewing this information can include:
♦ Are all of the key partners engaged in the program?
♦ Which key hospitals are missing from the local partnership and why?
♦ What can be learned from the two hospitals participating in each of the contract cycles?
Hospital Preparedness Program Overview 2002-2010 Page 21

Hospital Preparedness Program Overview 2002-2010 Page 22
♦ What factors may have lead to the low expenditure rates by some of the participating hospitals?
♦ What actions may be necessary to better support hospitals to maximize use of resources?
The shared program goal is to ensure that healthcare partners are prepared for, able to respond to, and recover from any threat, natural or man-made. The department will continue to work with hospitals in their all-hazards approach to preparedness, response, and recovery.
Hospital Preparedness Program Regional Domestic Security Task Force
Region 2
OVERVIEW This report provides a descriptive analysis of the Hospital Preparedness Program (HPP) participation and programmatic focus for Region 2. The information provides an overview of regional and county specific partnerships with local hospitals. Information is intended to provide a picture that can be used to confirm and document what is happening in the region and to assist with planning for future activities.
THE REGION Region 2 is made up of 13 counties, Columbia, Dixie, Franklin, Gadsden, Hamilton, Jefferson, Lafayette, Leon, Liberty, Madison, Suwannee, Taylor, and Wakulla. The 2010 U.S. Census population for this region is 578,294.13 The smallest county is Liberty with a population of 8,365 and the largest county is Leon with a population of 275,487. Twelve percent of the region’s population is age 65 or older. Fourteen percent of persons under 65 years old have no health insurance and 16% of the population has one or more disabilities.
The region is demographically and economically diverse. Every county in the region, except Leon, is defined by Florida Statutes as being rural with a population density of less than 100 individuals per square mile. Six of the state’s 28 designated rural hospitals14 are in this region. Three of these hospitals are also designated as critical access hospitals, accounting for 23% of the state’s 13 critical access hospitals.
The mostly rural region has a significant agricultural industry employing seasonal and resident workers who historically have had limited access to healthcare resources. The region’s close proximity to the Georgia, Alabama borders can result in persons coming to or leaving Florida for healthcare services. Leon, the one non rural county, is home to the State Legislature, two major universities and a community college bringing in a large number of temporary residents. The legislative session and sporting events associated with the universities bring in a large number of visitors throughout the year. Students may have access to healthcare through the universities and Legislators may have the resources to obtain health care. Even so, the large numbers of visitors
13 County population is from the 2010 US Census – Other demographic statistics are from the FDOH Vulnerable Population profiles. http://www.floridashealth.com/prepare/VulnerablePopulations.html. 14 Agency for Health Care Administration Facility/Provider Locator. http://www.floridahealthfinder.gov/facilitylocator/FacilitySearch.aspx . Retrieved 4/8/2011
Hospital Preparedness Program Overview 2002-2010 Page 23
and temporary residents may not have an emergency plan in place and could impact hospital surge capacity during an emergency event.
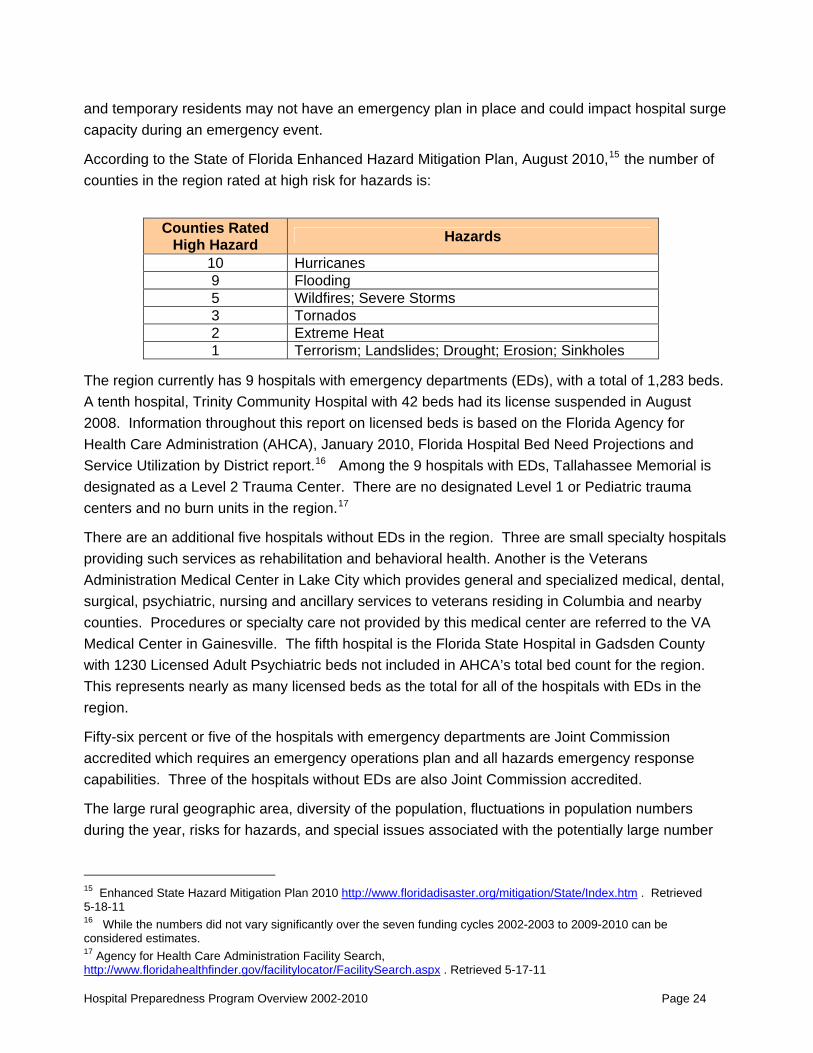
According to the State of Florida Enhanced Hazard Mitigation Plan, August 2010,15 the number of counties in the region rated at high risk for hazards is:
Counties Rated
High Hazard Hazards
10 Hurricanes 9 Flooding 5 Wildfires; Severe Storms 3 Tornados 2 Extreme Heat 1 Terrorism; Landslides; Drought; Erosion; Sinkholes
The region currently has 9 hospitals with emergency departments (EDs), with a total of 1,283 beds. A tenth hospital, Trinity Community Hospital with 42 beds had its license suspended in August 2008. Information throughout this report on licensed beds is based on the Florida Agency for Health Care Administration (AHCA), January 2010, Florida Hospital Bed Need Projections and Service Utilization by District report.16 Among the 9 hospitals with EDs, Tallahassee Memorial is designated as a Level 2 Trauma Center. There are no designated Level 1 or Pediatric trauma centers and no burn units in the region.17
There are an additional five hospitals without EDs in the region. Three are small specialty hospitals providing such services as rehabilitation and behavioral health. Another is the Veterans Administration Medical Center in Lake City which provides general and specialized medical, dental, surgical, psychiatric, nursing and ancillary services to veterans residing in Columbia and nearby counties. Procedures or specialty care not provided by this medical center are referred to the VA Medical Center in Gainesville. The fifth hospital is the Florida State Hospital in Gadsden County with 1230 Licensed Adult Psychiatric beds not included in AHCA’s total bed count for the region. This represents nearly as many licensed beds as the total for all of the hospitals with EDs in the region.
Fifty-six percent or five of the hospitals with emergency departments are Joint Commission accredited which requires an emergency operations plan and all hazards emergency response capabilities. Three of the hospitals without EDs are also Joint Commission accredited.
The large rural geographic area, diversity of the population, fluctuations in population numbers during the year, risks for hazards, and special issues associated with the potentially large number
15 Enhanced State Hazard Mitigation Plan 2010 http://www.floridadisaster.org/mitigation/State/Index.htm . Retrieved 5-18-11 16 While the numbers did not vary significantly over the seven funding cycles 2002-2003 to 2009-2010 can be considered estimates. 17 Agency for Health Care Administration Facility Search, http://www.floridahealthfinder.gov/facilitylocator/FacilitySearch.aspx . Retrieved 5-17-11
Hospital Preparedness Program Overview 2002-2010 Page 24

of clients housed in behavioral / mental health facilities could present hospitals in this region a wide range of challenges for all-hazard planning and preparedness. This region could face additional challenges during medical surge as six of the designated rural counties do not currently have a hospital and the others have a very limited number of licensed beds.
PARTICIPATING HOSPITALS For the purpose of this report, participation is defined as a hospital with an emergency department that has been offered, accepted, and executed a contract with the Florida Department of Health. Information is presented by funding cycle (FC). Funding cycles correspond with state fiscal years. One funding cycle encompassed two fiscal years (2005-2007).
Preliminary observations based on the data indicate:
♦ Six of the 10 hospitals with EDs, participated in the Hospital Preparedness Program for at least six funding cycles.
♦ The single largest hospital participated in all of the eight funding cycles and consistently expended a high percentage of allocated funds.
♦ The second largest hospital also participated in all eight funding cycles and has dramatically improved its expenditure rate in the last two funding cycles.
♦ While only five hospitals participated in funding cycle 2010-2011, they represented 85% of the licensed beds for hospitals with EDs in the region.
♦ Tallahassee Memorial Hospital in Leon County, accounted for 58% of the licensed beds and 53% of the funding for hospitals with EDs in the region.
♦ In addition to hospitals with EDs included in this analysis, the VA Medical Center in Lake City received $92,000 in 2005-2007 for equipment (PPE and Ventilators), training, and exercise. Of this amount, $80,078 was expended.
♦ Six of the current nine hospitals in the region are part of three hospital corporations or systems, HCA (Hospital Corporation of America), HMA (Health Management Associates, Inc.), and Tallahassee Memorial Healthcare, Inc.18
Figure 1 displays participation over eight funding cycles. The first column for each funding cycle shows the percentage of hospitals with EDs that participated. The next two columns indicate the number and percentage of the region’s licensed beds. The figure illustrates that in the first year 40% of the hospitals participated, representing 84% of the beds. The following funding cycle, all hospitals participated in the program. Participation declined the following funding cycle and remained somewhat consistent until 2010-2011 when participation dropped to five of the nine hospitals in the region. Two additional hospitals executed contracts for 2010-2011 but terminated their contracts early enough in the funding cycle that their funds were reallocated to other hospitals.
18 Florida Hospital Association, Hospital Directory, http://www.fha.org/DirectoryLookupResults. Retrieved July 1, 2011.
Hospital Preparedness Program Overview 2002-2010 Page 25
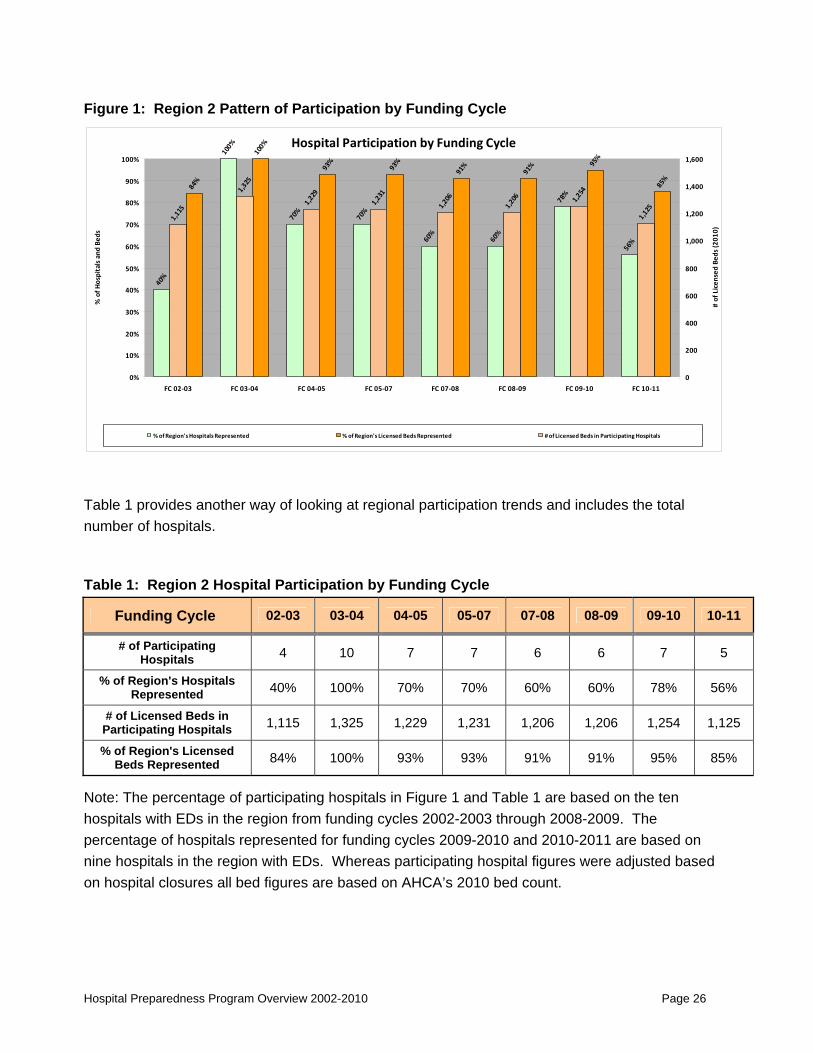
Figure 1: Region 2 Pattern of Participation by Funding Cycle
Hospital Participation by Funding Cycle40%
100%
70%
70%
60%
60%
78%
56%
84%
100%
93%
93%
91%
91% 95
%
85%
1,115
1,325
1,229
1,231
1,206
1,206 1,254
1,125
0%
10%
20%
30%
40%
50%
60%
70%
80%
90%
100%
FC 02‐03 FC 03‐04 FC 04‐05 FC 05‐07 FC 07‐08 FC 08‐09 FC 09‐10 FC 10‐11
% of H
ospitals and
Bed
s
0
200
400
600
800
1,000
1,200
1,400
1,600
# of Licen
sed Be
ds (2
010)
% of Region's Hospitals Represented % of Region's Licensed Beds Represented # of Licensed Beds in Participating Hospitals
Table 1 provides another way of looking at regional participation trends and includes the total number of hospitals.
Table 1: Region 2 Hospital Participation by Funding Cycle
Funding Cycle 02-03 03-04 04-05 05-07 07-08 08-09 09-10 10-11
# of Participating Hospitals 4 10 7 7 6 6 7 5
% of Region's Hospitals Represented 40% 100% 70% 70% 60% 60% 78% 56%
# of Licensed Beds in Participating Hospitals 1,115 1,325 1,229 1,231 1,206 1,206 1,254 1,125
% of Region's Licensed Beds Represented 84% 100% 93% 93% 91% 91% 95% 85%
Note: The percentage of participating hospitals in Figure 1 and Table 1 are based on the ten hospitals with EDs in the region from funding cycles 2002-2003 through 2008-2009. The percentage of hospitals represented for funding cycles 2009-2010 and 2010-2011 are based on nine hospitals in the region with EDs. Whereas participating hospital figures were adjusted based on hospital closures all bed figures are based on AHCA’s 2010 bed count.
Hospital Preparedness Program Overview 2002-2010 Page 26

Table 2 provides a side by side comparison of the hospitals with EDs participating in the HPP.
Table 2: Region 2 Hospital Participation 07-08 to 10-11 Funding Cycles
County Hospital Name
Lice
nsed
Bed
s (2
010)
# FCs Participated in 1st Four FCs
07-08 Participated
08-09 Participated
09-10 Participated
10-11 Participated
Gadsden Capital Regional Medical Center, Gadsden (formerly Gadsen Community Hospital) 4 1 No No No
Franklin George E. Weems Memorial Hospital* 25 2 No No No Suwannee Shands at Live Oak* 30 3 Yes Yes Yes Madison Madison County Memorial Hospital* 42 3 Yes Yes Yes Yes Hamilton Trinity Community Hospital (closed August 08) 42 2 No No No Taylor Doctors Memorial Hospital (Perry) 48 3 No No Yes Yes Columbia Lake City Medical Center 67 2 Yes Yes Yes Yes Columbia Shands at Lake Shore 99 4 Yes Yes Yes
Leon Capital Regional Medical Center(formerly Tallahassee Community Hospital) 198 4 Yes Yes Yes Yes
Leon Tallahassee Memorial Hospital 770 4 Yes Yes Yes Yes10 1,325 6 6 7 5
*Indicates designated critical access hospital.
Information regarding participation is important but it is only one part of the picture. It is necessary to look at the levels of funding and expenditures. The next part of the data provides additional detail related to funding.
FUNDING When reviewing the level and distribution of funding, it is important to keep in mind that a number of factors can impact participation. Region 2 hospitals with EDs received a total allocation of 4,817,39219 through funding cycle 2009-2010. Tallahassee Memorial Hospital, the only one with greater than 350 beds, was recipient of $2,550,304 or 53% of the allocated funds. The remaining nine hospitals, with 555 beds, received $2,267,088 or 47% of the allocated funds.
Executed contracts with hospitals with EDs totaled $4,693,691. Of the total funding in executed contracts, $3,874,121 was expended. Table 3 displays the region-wide total funds allocated, executed in contracts, and spent for each funding cycle. Levels of expenditures can be influenced by the maturation of the level of preparedness of the hospital partners. Low expenditure rates by individual hospitals may be related to a hospital being sold, changes in management, changes in allowable purchases, disallowances, events such as H1N1 resulting in higher priorities, or other factors. Further individual review may be necessary to determine specific reasons and opportunities for improvement.
19 This does not include the $92,000 in allocated funds to the VA Medical Center in Lake City.
Hospital Preparedness Program Overview 2002-2010 Page 27

Table 3: Region 2 Total Allocated, Executed, Spent Funds by Funding Cycle
Funding Cycle Total Amount Allocated
Total Amount in Executed Contract
Total Amount Spent
% of Executed Contract Funds Spent
2002 - 2003 289,387 289,387 272,492 94%
2003 - 2004 633,279 633,279 505,516 80%
2004 - 2005 1,002,087 1,002,087 813,549 81%
2005 - 2007 1,323,251 1,323,250 1,060,055 80%
2007 - 2008 699,451 575,751 475,147 83%
2008 - 2009 615,522 615,522 532,747 87%
2009 - 2010 254,415 254,415 214,616 84%
Total All FCs 4,817,392 4,693,691 3,874,121 83%
This record of spending as well as the growth and subsequent decline in total funding over seven funding cycles is illustrated in Figures 2 and 3.
Figure 2: Region 2 Total Allocated, Executed, and Spent Funds by Funding Cycle
Funds Allocated, Executed and Spent by FCs
289,387
633,279
1,002,087
1,323,251
699,451
615,522
254,415
289,387
633,279
1,002,087
1,323,250
575,751
615,522
254,415
272,492
505,516
813,549
1,060,055
475,147
532,747
214,616
0
200,000
400,000
600,000
800,000
1,000,000
1,200,000
1,400,000
1,600,000
1,800,000
2,000,000
2002 ‐ 2003 2003 ‐ 2004 2004 ‐ 2005 2005 ‐ 2007 2007 ‐ 2008 2008 ‐ 2009 2009 ‐ 2010
Funding Cycle
Total Amount Allocated Total Amount in Executed Contract Total Amount Spent
Hospital Preparedness Program Overview 2002-2010 Page 28

Figure 3: Region 2 Percentage of Executed Funds Spent
Percentage of Executed Contract Funds Spent
94%
80% 81%
80% 83% 87
%
84%
0%
10%
20%
30%
40%
50%
60%
70%
80%
90%
100%
2002 ‐ 2003 2003 ‐ 2004 2004 ‐ 2005 2005 ‐ 2007 2007 ‐ 2008 2008 ‐ 2009 2009 ‐ 2010
% of Executed Contract Funds Spent
Table 4 illustrates the percent of executed funds spent by each hospital over the seven funding cycles. Through funding cycle 2009-2010 hospitals have spent 83% of the executed contract amounts.
Table 4: Region 2 Hospitals’ Percentage of Funds Spent from Executed Contracts
More detail regarding the amount of funds allocated, executed, and spent by each hospital is available on request.
County Hospital Name
Lice
nsed
B
eds
(201
0) 02-03 Executed Contract
Spent
03-04 Executed Contract
Spent
04-05 Executed Contract
Spent
05-07 Executed Contract
Spent
07-08 Executed Contract
Spent
08-09 Executed Contract
Spent
09-10 Executed Contract
Spent
Gadsden Capital Regional Medical Center, Gadsden (formerly Gadsen Community Hospital) 4 77%
Franklin George E. Weems Memorial Hospital* 25 57% 0%Suwannee Shands at Live Oak* 30 100% 100% 68% 45% 100% 40%Madison Madison County Memorial Hospital* 42 95% 100% 100% 81% 23% 95%Hamilton Trinity Community Hospital (closed August 08) 42 69% 95%Taylor Doctors Memorial Hospital (Perry) 48 93% 100% 67% 91%Columbia Lake City Medical Center 67 98% 98% 90% 72% 68%Columbia Shands at Lake Shore 99 87% 100% 88% 75% 90% 100% 40%
Leon Capital Regional Medical Center(formerly Tallahassee Community Hospital) 198 51% 42% 56% 22% 33% 93% 100%
Leon Tallahassee Memorial Hospital 770 100% 87% 87% 85% 92% 91% 100%
*Indicates designated critical access hospital.
PROGRAMMATIC FUNDING CATEGORIES Data about funding and participation was gathered in four categories:
♦ Equipment
♦ Training
Hospital Preparedness Program Overview 2002-2010 Page 29
Hospital Preparedness Program Overview 2002-2010 Page 30
♦ Exercises
♦ Other
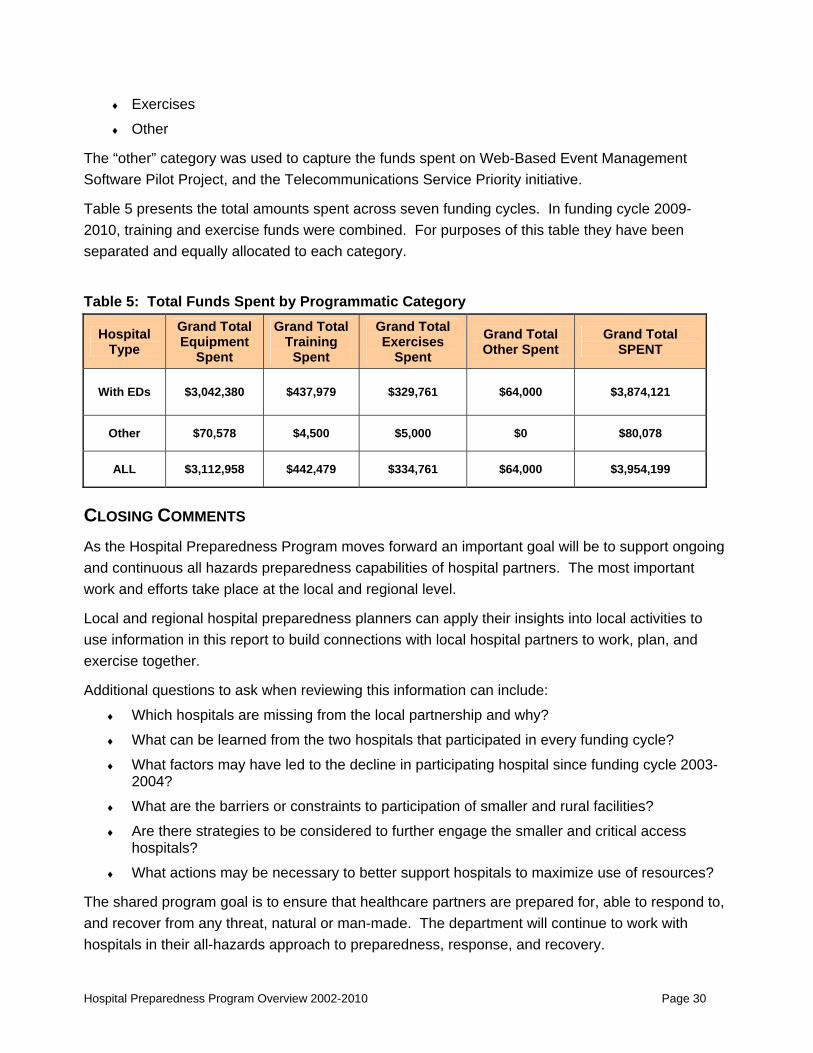
The “other” category was used to capture the funds spent on Web-Based Event Management Software Pilot Project, and the Telecommunications Service Priority initiative.
Table 5 presents the total amounts spent across seven funding cycles. In funding cycle 2009-2010, training and exercise funds were combined. For purposes of this table they have been separated and equally allocated to each category.
Table 5: Total Funds Spent by Programmatic Category
Hospital Type
Grand Total Equipment
Spent
Grand Total Training
Spent
Grand Total Exercises
Spent Grand Total Other Spent
Grand Total SPENT
With EDs $3,042,380 $437,979 $329,761 $64,000 $3,874,121
Other $70,578 $4,500 $5,000 $0 $80,078
ALL $3,112,958 $442,479 $334,761 $64,000 $3,954,199
CLOSING COMMENTS As the Hospital Preparedness Program moves forward an important goal will be to support ongoing and continuous all hazards preparedness capabilities of hospital partners. The most important work and efforts take place at the local and regional level.
Local and regional hospital preparedness planners can apply their insights into local activities to use information in this report to build connections with local hospital partners to work, plan, and exercise together.
Additional questions to ask when reviewing this information can include:
♦ Which hospitals are missing from the local partnership and why?
♦ What can be learned from the two hospitals that participated in every funding cycle?
♦ What factors may have led to the decline in participating hospital since funding cycle 2003-2004?
♦ What are the barriers or constraints to participation of smaller and rural facilities?
♦ Are there strategies to be considered to further engage the smaller and critical access hospitals?
♦ What actions may be necessary to better support hospitals to maximize use of resources?
The shared program goal is to ensure that healthcare partners are prepared for, able to respond to, and recover from any threat, natural or man-made. The department will continue to work with hospitals in their all-hazards approach to preparedness, response, and recovery.

Hospital Preparedness Program Regional Domestic Security Task Force
Region 3
PROGRAM OVERVIEW This report provides a descriptive analysis of the Hospital Preparedness Program (HPP) participation and programmatic focus for Region 3. The information provides an overview of regional and county specific partnerships with local hospitals. Information is intended to provide a picture that can be used to confirm and document what is happening in the region and to assist with planning for future activities.
THE REGION Region 3 is made up of 13 counties, Alachua, Baker, Bradford, Clay, Duval, Flagler, Gilchrist, Levy, Marion, Nassau, Putnam, St. Johns, and Union. The 2010 U.S. Census population for this region is 2,196,085.20 The smallest county is Union with a population of 15,535 and the largest county is Duval with a population of 864,263. Fifteen percent of the region’s population is age 65 or older. Thirteen percent of persons under 65 years old have no health insurance. Sixteen percent of the population has one or more disabilities.
The region is demographically and economically diverse. Seven of the 13 counties are defined by Florida Statutes as being rural with a population density of less than 100 individuals per square mile. In addition, other counties in the region are made up of large rural areas. Seven of the state’s 28 designated rural hospitals21 are in this region. Two of these hospitals are also designated as critical access hospitals, accounting for 15% of the state’s 13 critical access hospitals.
The region has a significant manufacturing and agricultural and manufacturing industry. Agricultural activity employs seasonal and resident workers who historically have had limited access to healthcare resources. The region has a large coastline and barrier islands which pose challenges if evacuation is necessary. Jacksonville, in Duval County is the largest urban center with a mix of industrial, transportation, financial services, health care, and military employment. Land-wise, Jacksonville is the largest city in the U.S.22 The region is considered a transportation hub with seaports in Fernandina Beach and Jacksonville, an international airport, railroad, and the
20 County population is from the 2010 US Census – Other demographic statistics are from the FDOH Vulnerable Population profiles. http://www.floridashealth.com/prepare/VulnerablePopulations.html. 21 Agency for Health Care Administration Facility/Provider Locator. http://www.floridahealthfinder.gov/facilitylocator/FacilitySearch.aspx . Retrieved 4/8/2011 22 Northeast Florida Regional Planning Council, http://www.nefrpc.org/aboutSub/region.htm. 5-25-2011.
Hospital Preparedness Program Overview 2002-2010 Page 31

junction of major interstates. Jacksonville also has multiple chemical storage sites. The military has a large impact on the region with the Jacksonville and Mayport naval air stations. The region’s proximity to the Georgia border can result in persons coming to or leaving Florida for healthcare services.
The region is home to two major public universities, three private colleges/universities, and three community colleges bringing in a large number of temporary residents. The University of Florida has a large campus with multiple health science programs, and research centers that are home to sensitive biological research. Sporting events associated with the universities bring in a large number of visitors throughout the year. The stadium at the University of Florida is the largest in the state with an average attendance in excess of 90,000 for football games last season. Visitors and temporary residents may not have an emergency plan in place and could impact hospital surge capacity during an emergency event.
According to the State of Florida Enhanced Hazard Mitigation Plan, August 2010,23 the number of counties in the region rated at high risk for hazards is:
Counties Rated
High Hazard Hazards
11 Hurricanes 9 Wildfires 8 Flooding 6 Tornadoes 4 Severe Storms 1 Drought, Winter Storms, Freezes, Erosion, Terrorism
The region has a diverse and well-developed health care system. Gilchrist is the only county in the region without a hospital. There are currently 22 hospitals with emergency departments (EDs), with 6,003 total licensed beds. A twenty-third hospital, Shands at AGH in Alachua County, closed in November 2009 with the majority of services, patients, staff, and volunteers moved to Shands at the University of Florida. Information throughout this report on licensed beds is based on the Florida Agency for Health Care Administration, January 2010, Florida Hospital Bed Need Projections and Service Utilization by District report.24 Hospitals include academic hospitals, the Baptist Hospital system, and the Mayo Hospital which attracts patients from other regions and states. Among the 22 hospitals two are designated as Level 1 Trauma Centers. One of these, Shands Hospital at the University of Florida also has a burn unit. There are no designated Level 2 or Pediatric Trauma Centers in the region.25
23 Enhanced State Hazard Mitigation Plan 2010 http://www.floridadisaster.org/mitigation/State/Index.htm . Retrieved 5-18-11 24 While the numbers did not vary significantly over the seven funding cycles 2002-2003 to 2009-2010 can be considered estimates. 25 Agency for Health Care Administration Facility Search, http://www.floridahealthfinder.gov/facilitylocator/FacilitySearch.aspx . Retrieved 5-17-11
Hospital Preparedness Program Overview 2002-2010 Page 32

There are an additional 14 hospitals without EDs in the region. These are primarily specialty hospitals providing such services as rehabilitation and behavioral health. One of these is the Florida State Hospital in Baker County with 1136 Licensed Adult Psychiatric beds, more licensed beds than any other hospital in the region. Another is the Malcolm Randall VA Medical Center in Alachua County with 254 licensed beds. There are also statewide Pediatric Referral Centers for Children’s Medical Services at Shands in Gainesville and Jacksonville.
Eighteen or 82% of the 22 hospitals with emergency departments are Joint Commission accredited which requires an emergency operations plan and a substantial level of all hazards emergency response capability. Seven of the hospitals without EDs are also Joint Commission accredited.
The large rural geographic area, diversity of the population, fluctuations in the population numbers during the year, risks for hazards, and special issues associated with the potentially large number of clients housed in behavioral / mental health facilities could present hospitals in this region a wide range of challenges for all-hazard planning and preparedness.
PARTICIPATING HOSPITALS For the purpose of this report, participation is defined as a hospital with an emergency department that has been offered, accepted, and executed a contract with the Florida Department of Health. Information is presented by funding cycle. Funding cycles correspond with state fiscal years. One funding cycle encompassed two fiscal years (2005-2007).
Preliminary observations based on the data indicate:
♦ Ten of the 23 hospitals with EDs, participated in all of the eight funding cycles.
♦ The six largest hospitals, accounting for 59% of the licensed beds in the region, participated in all of the eight funding cycles.
♦ Hospital participation ranged from a high of 20 in the first two funding cycles to a low of 14 in funding cycle 2008-2009.
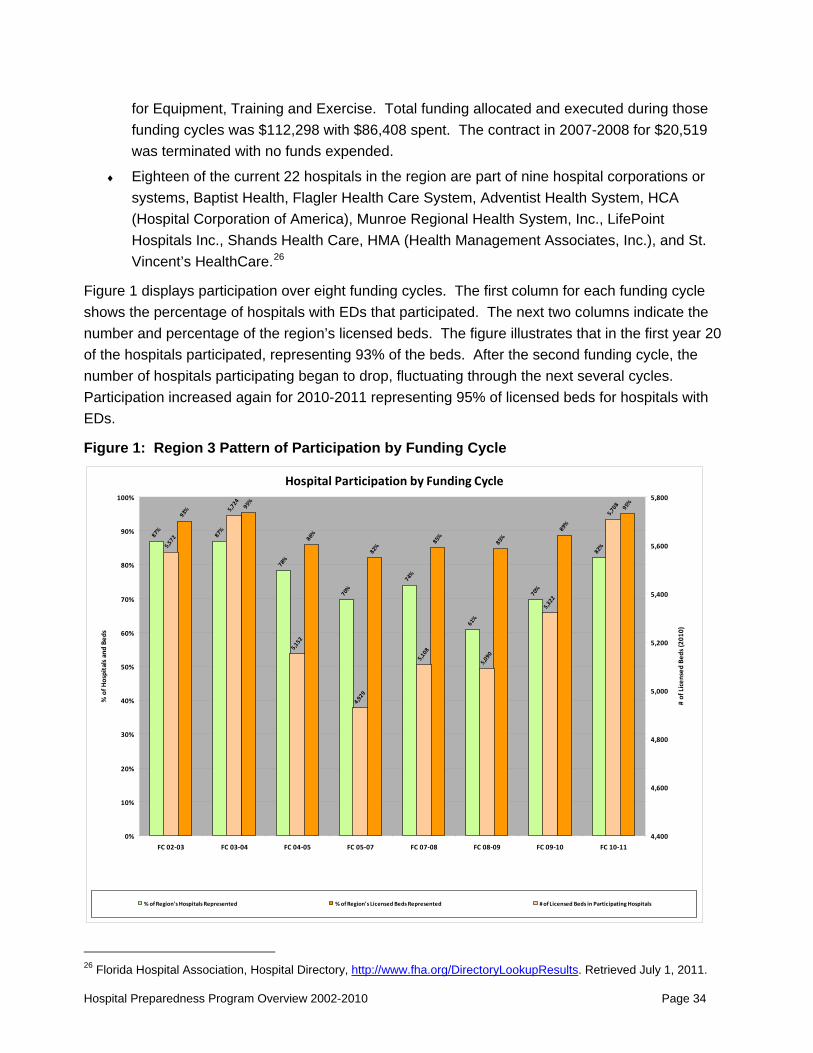
♦ In funding cycle 2010-2011, 18 hospitals participated, accounting for 95% of the licensed beds in the region.
♦ In addition to hospitals with EDs included in this analysis, Shands Duval received funding during the 2003-2004 and 2008-2009 funding cycles for Equipment, Training and Exercise. Total funding allocated and executed during those funding cycles was $30,279 with $26,835 spent.
♦ In addition to hospitals with EDs included in this analysis, Specialty Hospital Jacksonville received funding during the 2003-2004, 2004-2005 and 2005-2007 funding cycles for Equipment, Training and Exercise. Total funding allocated and executed during those funding cycles was $29,073 with $21,601 spent. None of the $4,003 allocated in 2005-2007 was spent.
♦ In addition to hospitals with EDs included in this analysis, Malcolm Randall VA Medical Center received funding during the 2004-2005, 2005-2007, and 2007-2008 funding cycles
Hospital Preparedness Program Overview 2002-2010 Page 33
for Equipment, Training and Exercise. Total funding allocated and executed during those funding cycles was $112,298 with $86,408 spent. The contract in 2007-2008 for $20,519 was terminated with no funds expended.
♦ Eighteen of the current 22 hospitals in the region are part of nine hospital corporations or systems, Baptist Health, Flagler Health Care System, Adventist Health System, HCA (Hospital Corporation of America), Munroe Regional Health System, Inc., LifePoint Hospitals Inc., Shands Health Care, HMA (Health Management Associates, Inc.), and St. Vincent’s HealthCare.26
Figure 1 displays participation over eight funding cycles. The first column for each funding cycle shows the percentage of hospitals with EDs that participated. The next two columns indicate the number and percentage of the region’s licensed beds. The figure illustrates that in the first year 20 of the hospitals participated, representing 93% of the beds. After the second funding cycle, the number of hospitals participating began to drop, fluctuating through the next several cycles. Participation increased again for 2010-2011 representing 95% of licensed beds for hospitals with EDs.
Figure 1: Region 3 Pattern of Participation by Funding Cycle
Hospital Participation by Funding Cycle
87%
87%
78%
70%
74%
61%
70%
82%
93%
95%
86%
82%
85%
85%
89%
95%
5,572
5,724
5,152
4,929
5,108
5,090
5,322
5,708
0%
10%
20%
30%
40%
50%
60%
70%
80%
90%
100%
FC 02‐03 FC 03‐04 FC 04‐05 FC 05‐07 FC 07‐08 FC 08‐09 FC 09‐10 FC 10‐11
% of H
ospitals and
Bed
s
4,400
4,600
4,800
5,000
5,200
5,400
5,600
5,800
# of Licen
sed Be
ds (2
010)
% of Region's Hospitals Represented % of Region's Licensed Beds Represented # of Licensed Beds in Participating Hospitals
26 Florida Hospital Association, Hospital Directory, http://www.fha.org/DirectoryLookupResults. Retrieved July 1, 2011.
Hospital Preparedness Program Overview 2002-2010 Page 34

Table 1 provides another way of looking at regional participation trends and includes the total number of hospitals.
Table 1: Region 3 Hospital Participation by Funding Cycle
Funding Cycle 02-03 03-04 04-05 05-07 07-08 08-09 09-10 10-11
# of Participating Hospitals 20 20 18 16 17 14 16 18
% of Region's Hospitals Represented 87% 87% 78% 70% 74% 61% 70% 82%
# of Licensed Beds in Participating Hospitals 5,572 5,724 5,152 4,929 5,108 5,090 5,322 5,708
% of Region's Licensed Beds Represented 93% 95% 86% 82% 85% 85% 89% 95%
Note: The number of participating hospitals in Figure 1 and Table 1 are based on the 23 hospitals with EDs in the region through funding cycle 2009-2010. The percentage of hospitals represented for funding cycle 2010-2011 is based on 22 hospitals in the region with EDs. Whereas participating hospital figures were adjusted based on hospital closures all bed figures are based on AHCA’s 2010 bed count.
Table 2 provides a side by side comparison of the hospitals with EDs participating in the HPP.
Table 2: Region 3 Hospital Participation 07-08 to 10-11 Funding Cycles
County Hospital Name
Lice
nsed
B
eds
(201
0)
# FCs Participated in 1st Four FCs
07-08 Participated
08-09 Participated
09-10 Participated
10-11 Participated
Alachua Shands at AGH (closed 11-09) - 4 Yes No No NoBaker Ed Fraser Memorial Hospital 25 0 No No No NoUnion Lake Butler Hospital Hand Surgery Center* 27 4 Yes Yes Yes Yes
Levy Nature Coast Regional Hospital (Tri-County Hospital) 40 3 Yes No Yes Yes
Bradford Shands Starke* 49 4 Yes Yes Yes YesNassau Baptist Medical Center Nassau 54 3 Yes Yes Yes NoMarion West Marion Community Hospital 70 3 No No No No
Flagler Florida Hospital Flagler(formerly Memorial Hospital Flagler) 99 4 Yes No No Yes
Putnam Putnam Community Hospital 141 2 No No No YesDuval Baptist Medical Center Beaches 146 2 No No No NoDuval Baptist Medical Center South 192 3 Yes No Yes YesMarion Ocala Regional Medical Center 200 4 No No No YesDuval Mayo Hospital 214 1 Yes Yes Yes YesClay Orange Park Medical Center 252 4 Yes Yes Yes YesDuval St. Luke's Hospital 313 3 No Yes Yes YesSt. Johns Flagler Hospital 316 4 Yes Yes Yes YesAlachua North Florida Regional Medical Center 325 2 Yes Yes Yes YesMarion Munroe Regional Medical Center 421 4 Yes Yes Yes YesDuval Memorial Hospital Jacksonville 425 4 Yes Yes Yes YesDuval St. Vincent's Medical Center 528 4 Yes Yes Yes YesDuval Baptist Medical Center (Jacksonville) 619 4 Yes Yes Yes YesDuval Shands Jacksonville 695 4 Yes Yes Yes YesAlachua Shands UF 852 4 Yes Yes Yes Yes
23 6,003 17 14 16 18 *Indicates designated critical access hospital
Hospital Preparedness Program Overview 2002-2010 Page 35

Information regarding participation is important but it is only one part of the picture. It is necessary to look at the levels of funding and expenditures. The next part of the data provides additional detail related to funding.
FUNDING When reviewing the level of funding and the distribution of funding, it is important to keep in mind that a number of factors can impact participation. Region 3 hospitals with EDs received a total allocation of $14,371,73727 through funding cycle 2009-2010. The six largest hospitals, those with greater than 350 beds, were recipients of 70% or $10,011,719 of the allocated funds. The remaining 17 hospitals, with 2,463 beds, received $4,360,018 or 30% of the allocated funds.
Executed contracts totaled $14,369,237. Of the total funding in executed contracts, 84% was expended. Table 3 displays the region-wide total funds allocated, executed in contracts, and spent for each funding cycle. Levels of expenditures can be influenced by the maturation of the level of preparedness of the hospital partners. Low expenditure rates by individual hospitals may be related to a hospital being sold, changes in management, changes in allowable purchases, disallowances, events such as H1N1 resulting in higher priorities, or other factors. Further individual review may be necessary to determine specific reasons and opportunities for improvement.
Table 3: Region 3 Total Allocated, Executed, Spent Funds by Funding Cycle
Funding Cycle Total Amount Allocated
Total Amount in Executed
Contract
Total Amount Spent
% of Executed Contract Funds Spent
2002 - 2003 740,386 737,886 519,056 70%
2003 - 2004 1,856,386 1,856,386 1,524,584 82%
2004 - 2005 4,292,495 4,292,495 3,519,672 82%
2005 - 2007 3,644,942 3,644,942 3,153,096 87%
2007 - 2008 2,515,346 2,515,346 2,156,818 86%
2008 - 2009 588,603 588,603 547,897 93%
2009 - 2010 733,579 733,579 650,027 89%
Total All FCs 14,371,737 14,369,237 12,071,149 84%
This record of spending as well as the growth and subsequent decline in total funding over seven funding cycles is illustrated in Figures 2 and 3.
27 This does not include the $171,650 in allocated funds to Shands and Specialty Hospitals in Duval County and the Malcolm Randall VA Medical Center in Alachua County.
Hospital Preparedness Program Overview 2002-2010 Page 36
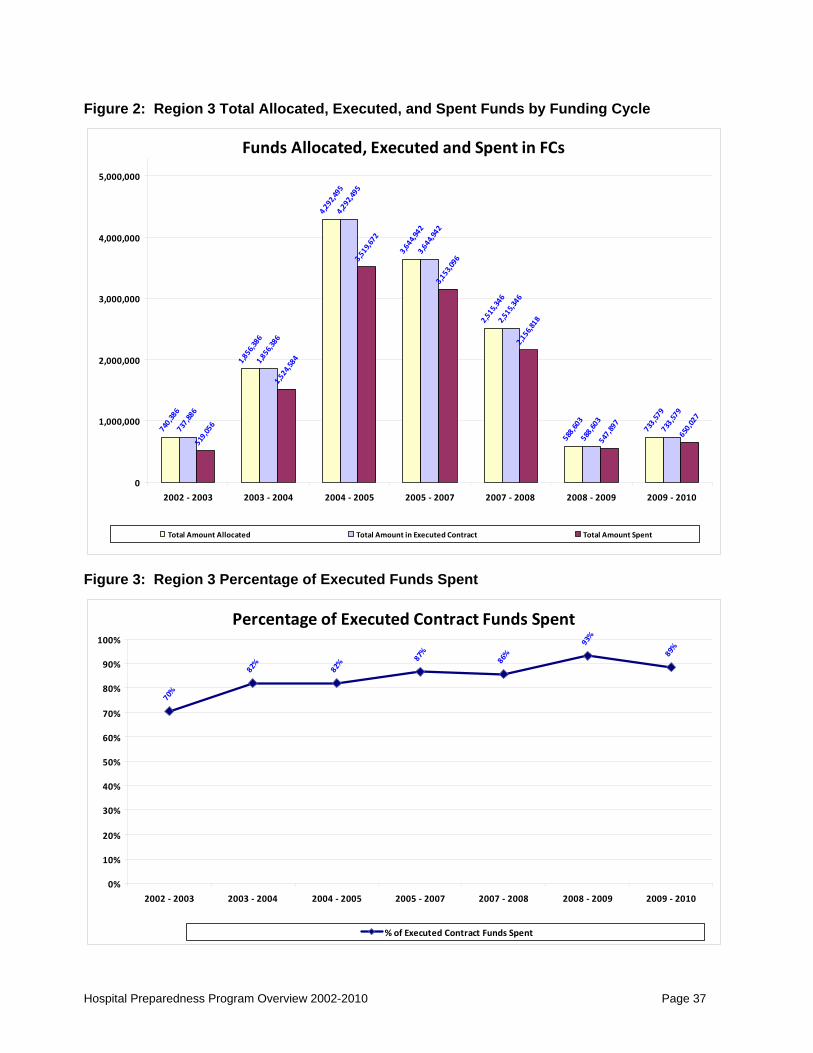
Figure 2: Region 3 Total Allocated, Executed, and Spent Funds by Funding Cycle
Funds Allocated, Executed and Spent in FCs 740,386
1,856,386
4,292,495
3,644,942
2,515,346
588,603
733,579
737,886
1,856,386
4,292,495
3,644,942
2,515,346
588,603
733,579
519,056
1,524,584
3,519,672
3,153,096
2,156,818
547,897
650,027
0
1,000,000
2,000,000
3,000,000
4,000,000
5,000,000
2002 ‐ 2003 2003 ‐ 2004 2004 ‐ 2005 2005 ‐ 2007 2007 ‐ 2008 2008 ‐ 2009 2009 ‐ 2010
Total Amount Allocated Total Amount in Executed Contract Total Amount Spent
Figure 3: Region 3 Percentage of Executed Funds Spent
Percentage of Executed Contract Funds Spent
70%
82%
82%
87%
86%
93%
89%
0%
10%
20%
30%
40%
50%
60%
70%
80%
90%
100%
2002 ‐ 2003 2003 ‐ 2004 2004 ‐ 2005 2005 ‐ 2007 2007 ‐ 2008 2008 ‐ 2009 2009 ‐ 2010
% of Executed Contract Funds Spent
Hospital Preparedness Program Overview 2002-2010 Page 37
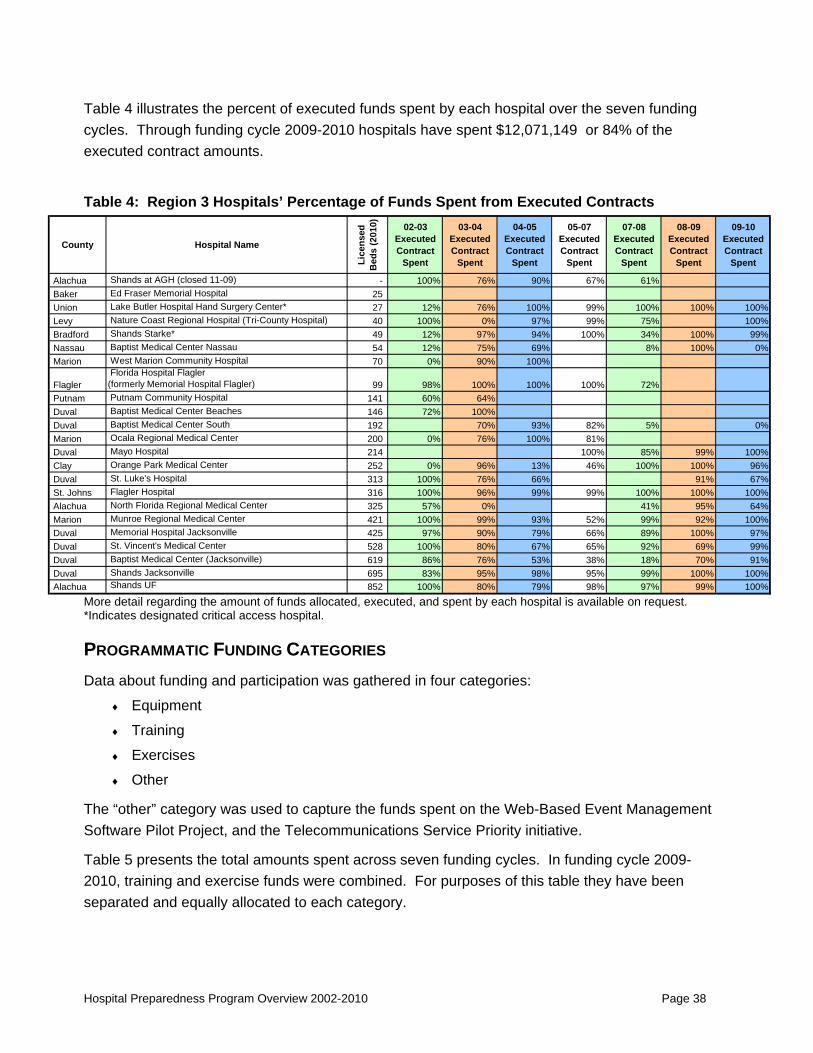
Table 4 illustrates the percent of executed funds spent by each hospital over the seven funding cycles. Through funding cycle 2009-2010 hospitals have spent $12,071,149 or 84% of the executed contract amounts.
Table 4: Region 3 Hospitals’ Percentage of Funds Spent from Executed Contracts
County Hospital Name
Lice
nsed
B
eds
(201
0) 02-03 Executed Contract
Spent
03-04 Executed Contract
Spent
04-05 Executed Contract
Spent
05-07 Executed Contract
Spent
07-08 Executed Contract
Spent
08-09 Executed Contract
Spent
09-10 Executed Contract
Spent
Alachua Shands at AGH (closed 11-09) - 100% 76% 90% 67% 61%Baker Ed Fraser Memorial Hospital 25 Union Lake Butler Hospital Hand Surgery Center* 27 12% 76% 100% 99% 100% 100% 100%Levy Nature Coast Regional Hospital (Tri-County Hospital) 40 100% 0% 97% 99% 75% 100%Bradford Shands Starke* 49 12% 97% 94% 100% 34% 100% 99%Nassau Baptist Medical Center Nassau 54 12% 75% 69% 8% 100% 0%Marion West Marion Community Hospital 70 0% 90% 100%
Flagler Florida Hospital Flagler(formerly Memorial Hospital Flagler) 99 98% 100% 100% 100% 72%
Putnam Putnam Community Hospital 141 60% 64%Duval Baptist Medical Center Beaches 146 72% 100%Duval Baptist Medical Center South 192 70% 93% 82% 5% 0%Marion Ocala Regional Medical Center 200 0% 76% 100% 81%Duval Mayo Hospital 214 100% 85% 99% 100%Clay Orange Park Medical Center 252 0% 96% 13% 46% 100% 100% 96%Duval St. Luke's Hospital 313 100% 76% 66% 91% 67%St. Johns Flagler Hospital 316 100% 96% 99% 99% 100% 100% 100%Alachua North Florida Regional Medical Center 325 57% 0% 41% 95% 64%Marion Munroe Regional Medical Center 421 100% 99% 93% 52% 99% 92% 100%Duval Memorial Hospital Jacksonville 425 97% 90% 79% 66% 89% 100% 97%Duval St. Vincent's Medical Center 528 100% 80% 67% 65% 92% 69% 99%Duval Baptist Medical Center (Jacksonville) 619 86% 76% 53% 38% 18% 70% 91%Duval Shands Jacksonville 695 83% 95% 98% 95% 99% 100% 100%Alachua Shands UF 852 100% 80% 79% 98% 97% 99% 100%
More detail regarding the amount of funds allocated, executed, and spent by each hospital is available on request. *Indicates designated critical access hospital.
PROGRAMMATIC FUNDING CATEGORIES Data about funding and participation was gathered in four categories:
♦ Equipment
♦ Training
♦ Exercises
♦ Other
The “other” category was used to capture the funds spent on the Web-Based Event Management Software Pilot Project, and the Telecommunications Service Priority initiative.
Table 5 presents the total amounts spent across seven funding cycles. In funding cycle 2009-2010, training and exercise funds were combined. For purposes of this table they have been separated and equally allocated to each category.
Hospital Preparedness Program Overview 2002-2010 Page 38
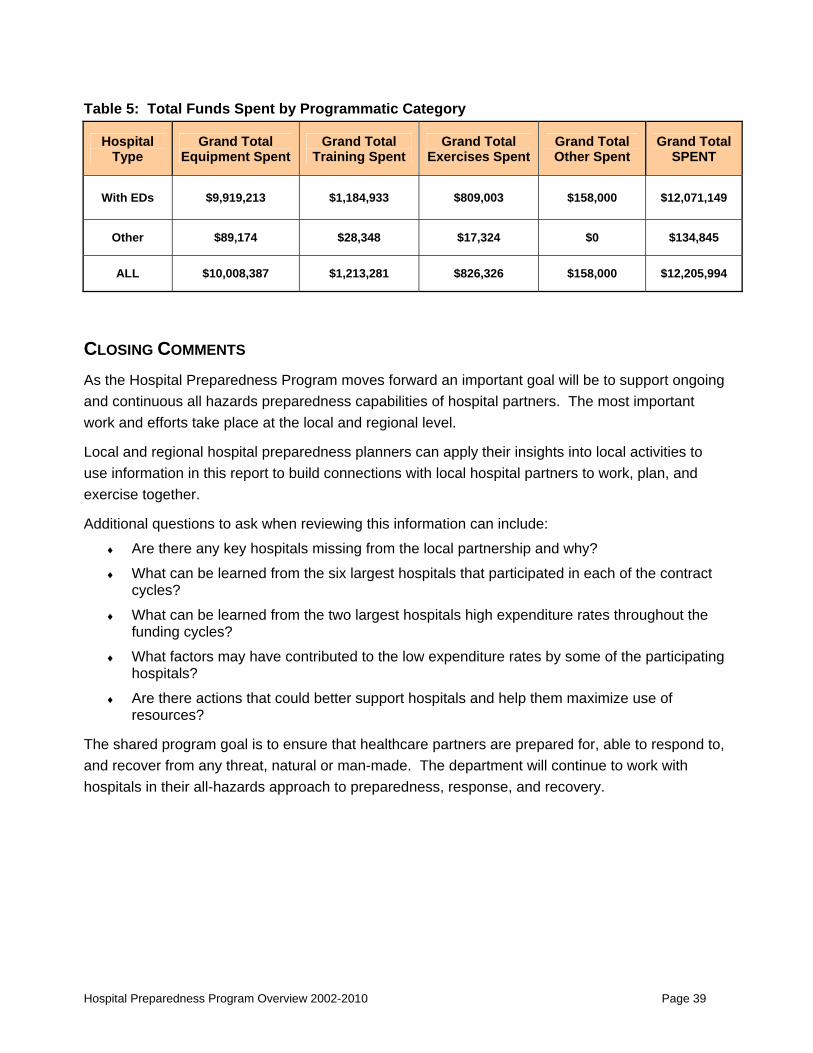
Hospital Preparedness Program Overview 2002-2010 Page 39
Table 5: Total Funds Spent by Programmatic Category
Hospital Type
Grand Total Equipment Spent
Grand Total Training Spent
Grand Total Exercises Spent
Grand Total Other Spent
Grand Total SPENT
With EDs $9,919,213 $1,184,933 $809,003 $158,000 $12,071,149
Other $89,174 $28,348 $17,324 $0 $134,845
ALL $10,008,387 $1,213,281 $826,326 $158,000 $12,205,994
CLOSING COMMENTS As the Hospital Preparedness Program moves forward an important goal will be to support ongoing and continuous all hazards preparedness capabilities of hospital partners. The most important work and efforts take place at the local and regional level.
Local and regional hospital preparedness planners can apply their insights into local activities to use information in this report to build connections with local hospital partners to work, plan, and exercise together.
Additional questions to ask when reviewing this information can include:
♦ Are there any key hospitals missing from the local partnership and why?
♦ What can be learned from the six largest hospitals that participated in each of the contract cycles?
♦ What can be learned from the two largest hospitals high expenditure rates throughout the funding cycles?
♦ What factors may have contributed to the low expenditure rates by some of the participating hospitals?
♦ Are there actions that could better support hospitals and help them maximize use of resources?
The shared program goal is to ensure that healthcare partners are prepared for, able to respond to, and recover from any threat, natural or man-made. The department will continue to work with hospitals in their all-hazards approach to preparedness, response, and recovery.

Hospital Preparedness Program Regional Domestic Security Task Force
Region 4
PROGRAM OVERVIEW This report provides a descriptive analysis of the Hospital Preparedness Program (HPP) participation and programmatic focus for Region 4. The information provides an overview of regional and county specific partnerships with local hospitals. Information is intended to provide a picture that can be used to confirm and document what is happening in the region and to assist with planning for future activities.
THE REGION Region 4 is made up of eight counties, Citrus, Hardee, Hernando, Hillsborough, Pasco, Pinellas, Polk, and Sumter. The 2010 U.S. Census population for this region is 3,647,725. The smallest county is Hardee with a population of 27,731 and the largest county is Hillsborough with a population of 1,229,226.28 Nineteen percent of the region’s population is age 65 or older. More than 15% of the region’s residents under 65 years of age have no health insurance. Nineteen percent of the population have one or more disabilities.
The region is demographically and economically diverse. Two of the eight counties are defined by Florida Statutes as being rural with a population density of less than 100 individuals per square mile. In addition, other counties in the region include rural areas. Florida Hospital Wauchula in Hardee County is one of the state’s 13 designated critical access hospitals.29
The region has a significant agricultural sector employing a large number of farm workers who historically have had limited access to healthcare services. At the same time the region attracts a large number of retirees. According to the Florida Department of Elder Affairs 2010 County Profiles, five of the counties have a population age 65 or older greater than 20%, with nearly one-third of the population in Citrus and Sumter counties age 65 and older.
The region also has two major urban areas, St Petersburg and Tampa that have numerous sporting and cultural events. The St. Petersburg area has many retirees and high rise housing. Most recently there has been an influx of young upwardly mobile professionals and significant urban renewal of downtown areas. Tampa is home to a large performing arts center hosting many events. Ybor City hosts many cultural events such as Gasparilla Day. The area is dependent on bridges and causeways to connect the highly populated beaches to the cities. These factors along
28 County population is from the 2010 US Census - Other demographic statistics are from FDOH Vulnerable Population profiles. http://www.floridashealth.com/prepare/VulnerablePopulations.html. 29 Agency for Health Care Administration Facility/Provider Locator. http://www.floridahealthfinder.gov/facilitylocator/FacilitySearch.aspx . Retrieved 4/8/2011
Hospital Preparedness Program Overview 2002-2010 Page 40
with the heavily traveled major traffic corridor between Tampa and Orlando could place additional burdens on the area if evacuations are necessary.
The region is home to a public university, eight private colleges and three community colleges bringing in temporary residents who may not have an emergency plan in place. The region also has a significant military presence with a Coast Guard Air Station in Pinellas County and MacDill Air Force Base in Hillsborough County. The air force base is home to mission partners with all branches of services represented. The base has a medical clinic and provides primary care but there are no on-base emergency medical services available. The region has an operating nuclear power plant located in Citrus County.
This region is at high risk for hurricanes and severe storms. The large coastal area, and the high hurricane risk puts the area at risk for storm surge. According to the State of Florida Enhanced Hazard Mitigation Plan, August 2010,30 the number of counties in the region rated at high risk for hazards is:
Counties Rated High Hazard Hazards
7 Hurricanes 6 Severe Storms 4 Flooding, Tornadoes, Wildfires 3 Freezes, Sinkholes 2 Drought, Winter Storms 1 Extreme Heat, Erosion,
The age and diversity of the population and risks for hazards present the hospitals in this region a wide range of challenges for all-hazard preparedness.
The region currently has 43 hospitals with emergency departments (EDs). These hospitals have a reported 11,266 licensed beds. Information throughout this report on licensed beds is based on the Florida Agency for Health Care Administration, January 2010, Florida Hospital Bed Need Projections and Service Utilization by District report.31 Among the 43 hospitals with EDs, there is one designated as a Level I Trauma Center with a burn unit, and three Level II Trauma Centers, one of which is also a designated as a Pediatric Trauma Center.32
There are an additional 11 hospitals in the region without EDs. These are primarily specialty hospitals providing such services as long-term acute care, rehabilitation, cancer treatment, behavioral health, and children’s services. The region also has a Veteran’s Administration hospital in Tampa (Hillsborough) and in St. Petersburg (Pinellas).
30 Enhanced State Hazard Mitigation Plan 2010 http://www.floridadisaster.org/mitigation/State/Index.htm . Retrieved 5-18-11 31 While the number of hospitals beds did not vary significantly over the seven funding cycles, 2002-2003 to 2009-2010 can be considered estimates. 32 Agency for Health Care Administration Facility Search, http://www.floridahealthfinder.gov/facilitylocator/FacilitySearch.aspx . Retrieved 5-17-11
Hospital Preparedness Program Overview 2002-2010 Page 41
Ninety-one percent or 39 of the hospitals with emergency departments are Joint Commission accredited which requires an emergency operations plan and all hazards emergency response capabilities. Ten of the hospitals without EDs are also Joint Commission accredited.
PARTICIPATING HOSPITALS For the purpose of this report, participation is defined as a hospital with an emergency department that has been offered, accepted, and executed a contract with the Florida Department of Health. Some of the larger hospital systems receive funds for more than one hospital in their system. When this occurs there may be one contract, however, the funds and preparedness resources are provided to other hospitals in the system. This allows the contracting hospital to leverage their purchasing power and expedite the expenditure of funds. In such cases, each hospital receiving funds directly or indirectly has been counted as participating.
Information is presented by funding cycle (FC). Funding cycles correspond with state fiscal years. One funding cycle encompassed two fiscal years (2005-2007).
Preliminary observations based on the data indicate:
♦ Each off the 42 hospitals with EDs participated in the Hospital Preparedness Program for at least one funding cycle. The 43rd hospital did not open until February 2010.
♦ Hospital participation ranged from a low of 13 in funding cycle 2002-2003 to a high of 39 in funding cycles 2003-2004.
♦ In funding cycle 2010-2011, 27 hospitals participated, accounting for 7,760 beds.
♦ The 10 largest hospitals, those with more than 350 beds, constitute 54% of the licensed beds for the region.
♦ Five of the six largest hospitals participated in each funding cycle.
♦ In addition to hospitals with EDs included in this analysis, during the funding cycles of 2005-2007 and 2007-2008, the James Haley Veteran’s Administration Medical Center, in Tampa, received executed contracts totaling $85,000 for equipment, training, and exercises as part of a special project. However, only $44,214 of the funding was expended.
♦ Forty-one of the 43 hospitals in the region are part of 15 hospital corporations or systems, All Children’s Health System, Bayfront Health System, HCA (Hospital Corporation of America), Hernando HealthCare, Citrus Memorial Health System, Adventist Health System, Community Health Systems, Bay Care/Morton Plant Mease Healthcare, Bay Care/St Joseph’s/Baptist Healthcare; Bay Care/St Anthony’s Healthcare, Iasis Healthcare, HMA (Health Management Associates, Inc.), Mid Florida Medical Services, Hernando Health Care, and Central Florida Health Alliance33
33 Florida Hospital Association, Hospital Directory, http://www.fha.org/DirectoryLookupResults. Retrieved July 1, 2011.
Hospital Preparedness Program Overview 2002-2010 Page 42
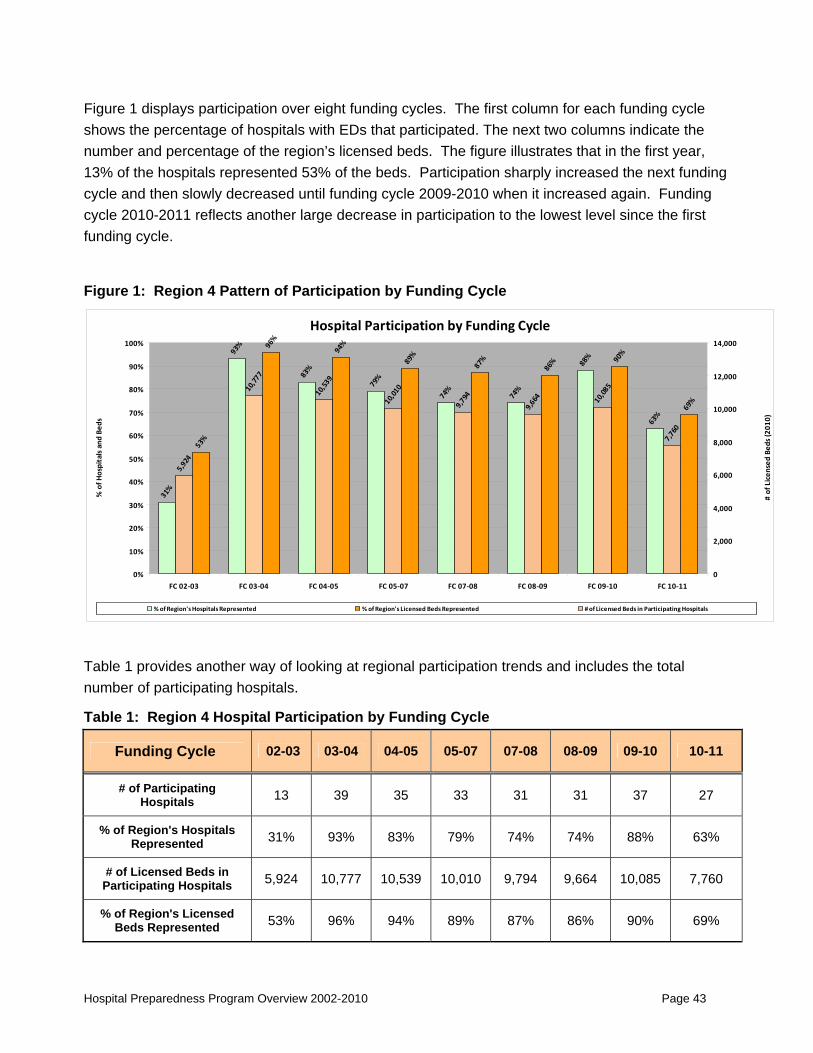
Figure 1 displays participation over eight funding cycles. The first column for each funding cycle shows the percentage of hospitals with EDs that participated. The next two columns indicate the number and percentage of the region’s licensed beds. The figure illustrates that in the first year, 13% of the hospitals represented 53% of the beds. Participation sharply increased the next funding cycle and then slowly decreased until funding cycle 2009-2010 when it increased again. Funding cycle 2010-2011 reflects another large decrease in participation to the lowest level since the first funding cycle.
Figure 1: Region 4 Pattern of Participation by Funding Cycle
Hospital Participation by Funding Cycle
31%
93%
83%
79%
74%
74%
88%
63%
53%
96%
94%
89%
87%
86% 90
%
69%
5,924
10,777
10,539
10,010
9,794
9,664 10,085
7,760
0%
10%
20%
30%
40%
50%
60%
70%
80%
90%
100%
FC 02‐03 FC 03‐04 FC 04‐05 FC 05‐07 FC 07‐08 FC 08‐09 FC 09‐10 FC 10‐11
% of H
ospitals and
Bed
s
0
2,000
4,000
6,000
8,000
10,000
12,000
14,000
# of Licen
sed Be
ds (2
010)
% of Region's Hospitals Represented % of Region's Licensed Beds Represented # of Licensed Beds in Participating Hospitals
Table 1 provides another way of looking at regional participation trends and includes the total number of participating hospitals.
Table 1: Region 4 Hospital Participation by Funding Cycle
Funding Cycle 02-03 03-04 04-05 05-07 07-08 08-09 09-10 10-11
# of Participating Hospitals 13 39 35 33 31 31 37 27
% of Region's Hospitals Represented 31% 93% 83% 79% 74% 74% 88% 63%
# of Licensed Beds in Participating Hospitals 5,924 10,777 10,539 10,010 9,794 9,664 10,085 7,760
% of Region's Licensed Beds Represented 53% 96% 94% 89% 87% 86% 90% 69%
Hospital Preparedness Program Overview 2002-2010 Page 43
Note the percentage of participating hospitals in Figure 1 and Table 1 is based on the 42 hospitals with EDs in the region from funding cycles 2002-2003 through 2009-2010. The percentage of hospitals for funding cycle 2010-2011 is based on the 43 hospitals with EDs currently in the region. Whereas participating hospital figures were adjusted based on hospital openings all bed figures are based on AHCA’s 2010 bed count.
Table 2, on the next page, provides a side by side comparison of the hospitals with EDs participating in the HPP. Hospitals marked “yes” participated either through an individual contract or as part of a system or master contract.
Hospital Preparedness Program Overview 2002-2010 Page 44

Table 2: Region 4 Hospital Participation 07-08 to 10-11 Funding Cycles
County Hospital Name
Lice
nsed
Bed
s (2
010)
# FCs Participated in 1st Four FCs
07-08 Participated
08-09 Participated
09-10 Participated
10-11 Participated
Hillsborough St. Joseph's Children's Hospital (formerly Tampa Children's Hospital) - 1 No No Yes No
Hillsborough St. Joseph's Hospital North (Opened 2-15-10) - 0 No No No NoHillsborough St. Joseph's Womens Hospital - 1 No No Yes NoHardee Florida Hospital Wachula* 44 4 Yes Yes Yes NoPolk Regency Medical Center 61 1 No No No No
Polk Bartow Memorial Hospital (Bartow Regional Medical Center) 72 2 Yes Yes Yes Yes
Hillsborough South Bay Hospital 112 3 No Yes Yes YesHernando Brooksville Regional Hospital 120 3 Yes Yes Yes YesPasco Pasco Regional Medical Center 120 3 Yes Yes Yes NoHillsborough University Community Hospital - Carrollwood 120 3 Yes Yes Yes Yes
Pasco North Bay Medical Center (Morton Plant North Bay Hospital) 122 2 No No Yes Yes
Hernando Spring Hill Regional Hospital 124 1 No No Yes YesCitrus Seven Rivers Regional Medical Center 128 4 Yes Yes Yes NoPinellas Mease Hospital Dunedin 143 1 No No Yes YesHillsborough South Florida Baptist Hospital 147 3 Yes Yes Yes Yes
Pasco Florida Hospital Zephyrhills(formerly East Pasco Medical Center) 154 3 Yes Yes Yes Yes
Polk Lake Wales Medical Center 160 3 Yes Yes Yes YesPinellas Edward White Hospital 167 3 Yes Yes Yes NoPinellas Helen Ellis Memorial Hospital 168 3 Yes Yes Yes YesHillsborough Memorial Hospital Tampa 180 3 Yes Yes Yes YesPolk Heart of Florida Regional Medical Center 194 3 Yes Yes Yes YesCitrus Citrus Memorial Hospital 198 3 No No No YesSumter The Villages Regional Hospital 198 2 No No Yes No
Pinellas Largo - Indian Rocks (formerly Sun Coast Hospital) 200 3 Yes No No No
Hillsborough Town & Country Hospital 201 1 Yes Yes Yes YesHernando Oak Hill Hospital 214 4 No Yes Yes YesPinellas All Children's Hospital 216 3 Yes Yes Yes YesPinellas St. Petersburg General Hospital 219 2 Yes Yes Yes NoPinellas Largo Medical Center 256 3 Yes No No NoPinellas Northside Hospital and Heart Institute 288 3 Yes Yes Yes YesPasco Regional Medical Center Bayonet Point 290 4 Yes Yes Yes YesPinellas Mease Hospital Countryside 300 3 No No Yes YesPinellas Palms of Pasadena Hospital 307 3 Yes Yes Yes YesPasco Community Hospital of New Port Richey 389 3 Yes Yes Yes NoPinellas St. Anthony's Hospital 395 3 Yes Yes Yes YesHillsborough Brandon Regional Hospital 407 2 Yes Yes Yes NoPolk Winter Haven Hospital 466 4 Yes Yes No NoHillsborough University Community Hospital 475 4 Yes Yes Yes YesPinellas Bayfront Medical Center 502 4 Yes Yes Yes YesPinellas Morton Plant Hospital 687 4 Yes Yes Yes YesPolk Lakeland Regional Medical Center 851 4 Yes Yes Yes NoHillsborough St. Joseph's Hospital 883 4 Yes Yes Yes YesHillsborough Tampa General Hospital 988 4 Yes Yes Yes Yes
43 11,266 31 31 37 27 *Indicates designated critical access hospital
Information regarding participation is important but it is only one part of the picture. It is necessary to look at levels of funding and expenditures. The next part of the data provides additional detail related to funding.
Hospital Preparedness Program Overview 2002-2010 Page 45

FUNDING When reviewing the level of funding and the distribution of funding, it is important to keep in mind that a number of factors can impact participation. Region 4 hospitals with EDs received a total allocation of $23,869,977 through funding cycle 2009-2010.34 The ten largest hospitals, those with greater than 350 beds, were recipients of $13,585,518 or 57% of the allocated funds. The remaining 33 hospitals received $10,284,459 or 43% of the allocated funds.
Executed contracts totaled $23,543,359. Of the total funding in executed contracts, $18,622,010 was expended. Table 3 displays the region-wide total funds allocated, executed in contracts, and spent for each funding cycle. Levels of expenditures can be influenced by the maturation of the level of preparedness of the hospital partners. Low expenditure rates by individual hospitals may be related to a hospital being sold, changes in management, changes in allowable purchases, disallowances, events such as H1N1 resulting in higher priorities, or other factors. Further individual review may be necessary to determine specific reasons and opportunities for improvement.
Table 3: Region 4 Total Allocated, Executed, Spent Funds by Funding Cycle
Funding Cycle Total Amount Allocated
Total Amount in Executed Contract
Total Amount Spent
% of Executed Contract Funds Spent
2002 - 2003 1,186,375 1,186,256 864,988 73%
2003 - 2004 3,179,392 3,179,392 2,297,664 72%
2004 - 2005 5,604,093 5,604,093 4,149,906 74%
2005 - 2007 7,334,572 7,008,072 5,896,291 84%
2007 - 2008 3,183,785 3,183,785 2,830,622 89%
2008 - 2009 2,140,905 2,140,905 1,784,373 83%
2009 - 2010 1,240,856 1,240,856 798,165 64%
Total All FCs 23,869,977 23,543,359 18,622,010 79%
The record of spending as well as the growth and subsequent decline in funding over the seven funding cycles is illustrated in Figures 2 and 3.
34 This does not include the $85,000 in allocated funds during FYs 05-07 and 07-08 to the James Haley VA Medical Center.
Hospital Preparedness Program Overview 2002-2010 Page 46

Figure 2: Region 4 Total Allocated, Executed, and Spent Funds by Funding Cycle
Funds Allocated, Executed and Spent by FCs1,186,375
3,179,392
5,604,093
7,334,572
3,183,785
2,140,905
1,240,856
1,186,256
3,179,392
5,604,093
7,008,072
3,183,785
2,140,905
1,240,856
864,988
2,297,664
4,149,906
5,896,291
2,830,622
1,784,373
798,165
0
1,000,000
2,000,000
3,000,000
4,000,000
5,000,000
6,000,000
7,000,000
8,000,000
9,000,000
10,000,000
2002 ‐ 2003 2003 ‐ 2004 2004 ‐ 2005 2005 ‐ 2007 2007 ‐ 2008 2008 ‐ 2009 2009 ‐ 2010
Total Amount Allocated Total Amount in Executed Contract Total Amount Spent
Figure 3: Region 4 Percentage of Executed Funds Spent by Funding Cycle
Percentage of Executed Contract Funds Spent
73%
72% 74%
84%
89%
83%
64%
0%
10%
20%
30%
40%
50%
60%
70%
80%
90%
100%
2002 ‐ 2003 2003 ‐ 2004 2004 ‐ 2005 2005 ‐ 2007 2007 ‐ 2008 2008 ‐ 2009 2009 ‐ 2010
% of Executed Contract Funds Spent
Hospital Preparedness Program Overview 2002-2010 Page 47
Hospital Preparedness Program Overview 2002-2010 Page 48
Table 4 on the next page illustrates the percent of executed funds spent by each hospital over the seven funding cycles. Through funding cycle 2009-2010 hospitals have spent 79% of the executed contract amounts.
In funding cycle 2009-2010 three hospital systems elected to take one contract for its hospital partners in Region 4. Table 4 notes which hospitals participated by receiving funds and preparedness resources through a hospital with a master contract. The expenditure rate for the hospital receiving the contract reflects the overall expenditure for all participating hospitals.
System partner hospitals that participated in a master contract are noted as follows: ♦ SJH = St Josephs Hospital ♦ MPH = Morton Plant Hospital ♦ LRMC = Funded through a Region 5 contract with Leesburg Regional Medical Center

Table 4: Region 4 Hospitals’ Percentage of Funds Spent from Executed Contracts
County Hospital Name
Lice
nsed
B
eds
(201
0)
02-03 Executed Contract
Spent
03-04 Executed Contract
Spent
04-05 Executed Contract
Spent
05-07 Executed Contract
Spent
07-08 Executed Contract
Spent
08-09 Executed Contract
Spent
09-10 Executed Contract
Spent
Hillsborough St. Joseph's Children's Hospital (formerly Tampa Children's Hospital) - 0% SJH
Hillsborough St. Joseph's Hospital North (Opened 2-15-10) - Hillsborough St. Joseph's Womens Hospital - 0% SJHHardee Florida Hospital Wachula* 44 74% 83% 100% 82% 86% 100% 0%Polk Regency Medical Center 61 40%
Polk Bartow Memorial Hospital (Bartow Regional Medical Center) 72 100% 100% 100% 100%
Hillsborough South Bay Hospital 112 88% 74% 77% 99% 100%Hernando Brooksville Regional Hospital 120 100% 84% 95% 85% 98% 0%Pasco Pasco Regional Medical Center 120 78% 100% 63% 100% 100% 100%Hillsborough University Community Hospital - Carrollwood 120 47% 96% 100% 98% 44% 100%
Pasco North Bay Medical Center (Morton Plant North Bay Hospital) 122 65% 95% MPH
Hernando Spring Hill Regional Hospital 124 100% 0%Citrus Seven Rivers Regional Medical Center 128 97% 89% 29% 95% 99% 0% 82%Pinellas Mease Hospital Dunedin 143 71% MPHHillsborough South Florida Baptist Hospital 147 86% 100% 94% 93% 69% 91%
Pasco Florida Hospital Zephyrhills(formerly East Pasco Medical Center) 154 100% 80% 84% 98% 12% 0%
Polk Lake Wales Medical Center 160 86% 48% 21% 28% 74% 48%Pinellas Edward White Hospital 167 67% 97% 96% 98% 100% 0%Pinellas Helen Ellis Memorial Hospital 168 0% 0% 58% 53% 40% 99%Hillsborough Memorial Hospital Tampa 180 0% 77% 72% 93% 100% 99%Polk Heart of Florida Regional Medical Center 194 86% 78% 75% 88% 100% 51%Citrus Citrus Memorial Hospital 198 0% 73% 41%Sumter The Villages Regional Hospital 198 100% 0% LRMCPinellas Largo - Indian Rocks (formerly Sun Coast Hospital) 200 0% 93% 28% 74%Hillsborough Town & Country Hospital 201 0% 97% 77% 92%Hernando Oak Hill Hospital 214 18% 0% 99% 38% 27% 0%Pinellas All Children's Hospital 216 94% 100% 92% 96% 56% 100%Pinellas St. Petersburg General Hospital 219 99% 100% 87% 100% 36%Pinellas Largo Medical Center 256 78% 57% 68% 92%Pinellas Northside Hospital and Heart Institute 288 79% 47% 89% 97% 100% 0%Pasco Regional Medical Center Bayonet Point 290 88% 62% 28% 50% 19% 100% 95%Pinellas Mease Hospital Countryside 300 75% 90% 44% MPHPinellas Palms of Pasadena Hospital 307 73% 70% 58% 53% 0% 100%Pasco Community Hospital of New Port Richey 389 95% 98% 63% 53% 100% 98%Pinellas St. Anthony's Hospital 395 94% 32% 98% 82% 66% 62%Hillsborough Brandon Regional Hospital 407 25% 48% 97% 100% 97%Polk Winter Haven Hospital 466 100% 45% 60% 93% 60% 69%Hillsborough University Community Hospital 475 53% 37% 30% 21% 98% 67% 100%Pinellas Bayfront Medical Center 502 100% 74% 87% 94% 85% 99% 0%Pinellas Morton Plant Hospital 687 84% 71% 66% 36% 87% 61% 65%Polk Lakeland Regional Medical Center 851 100% 26% 94% 91% 74% 96% 89%Hillsborough St. Joseph's Hospital 883 22% 99% 67% 98% 99% 88% 80%Hillsborough Tampa General Hospital 988 90% 88% 52% 100% 98% 68% 97%
More detail regarding the amount of funds allocated, executed, and spent by each hospital is available on request. *Indicates designated critical access hospital
PROGRAMMATIC FUNDING CATEGORIES Data about funding and participation was gathered in four categories:
♦ Equipment ♦ Training ♦ Exercises ♦ Other
Hospital Preparedness Program Overview 2002-2010 Page 49
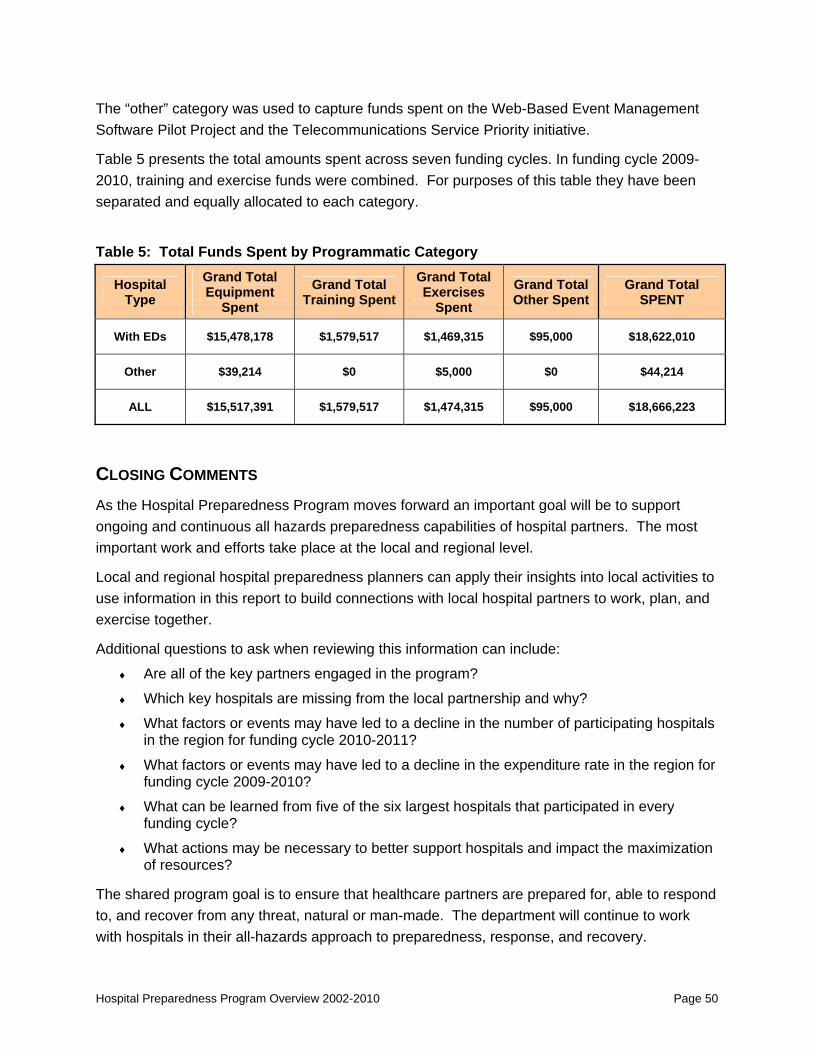
The “other” category was used to capture funds spent on the Web-Based Event Management Software Pilot Project and the Telecommunications Service Priority initiative.
Table 5 presents the total amounts spent across seven funding cycles. In funding cycle 2009-2010, training and exercise funds were combined. For purposes of this table they have been separated and equally allocated to each category.
Table 5: Total Funds Spent by Programmatic Category
Hospital Type
Grand Total Equipment
Spent Grand Total
Training Spent Grand Total Exercises
Spent Grand Total Other Spent
Grand Total SPENT
With EDs $15,478,178 $1,579,517 $1,469,315 $95,000 $18,622,010
Other $39,214 $0 $5,000 $0 $44,214
ALL $15,517,391 $1,579,517 $1,474,315 $95,000 $18,666,223
CLOSING COMMENTS As the Hospital Preparedness Program moves forward an important goal will be to support ongoing and continuous all hazards preparedness capabilities of hospital partners. The most important work and efforts take place at the local and regional level.
Local and regional hospital preparedness planners can apply their insights into local activities to use information in this report to build connections with local hospital partners to work, plan, and exercise together.
Additional questions to ask when reviewing this information can include:
♦ Are all of the key partners engaged in the program?
♦ Which key hospitals are missing from the local partnership and why?
♦ What factors or events may have led to a decline in the number of participating hospitals in the region for funding cycle 2010-2011?
♦ What factors or events may have led to a decline in the expenditure rate in the region for funding cycle 2009-2010?
♦ What can be learned from five of the six largest hospitals that participated in every funding cycle?
♦ What actions may be necessary to better support hospitals and impact the maximization of resources?
The shared program goal is to ensure that healthcare partners are prepared for, able to respond to, and recover from any threat, natural or man-made. The department will continue to work with hospitals in their all-hazards approach to preparedness, response, and recovery.
Hospital Preparedness Program Overview 2002-2010 Page 50

Hospital Preparedness Program Regional Domestic Security Task Force
Region 5
PROGRAM OVERVIEW This report provides a descriptive analysis of the Hospital Preparedness Program (HPP) participation and programmatic focus for Region 5. The information provides an overview of regional and county specific partnerships with local hospitals. Information is intended to provide a picture that can be used to confirm and document what is happening in the region and to assist with planning for future activities.
THE REGION Region 5 is made up of nine counties, Brevard, Indian River, Lake, Martin, Orange, Osceola, St Lucie, Seminole, and Volusia. The 2010 U.S. Census population for this Region is 3,734,515.35 The smallest county is Martin with a population of 146,318 and the largest county is Orange with a population of 1,145,956. Seventeen percent of the region’s population is age 65 or older. Almost 16% of persons under 65 years old have no health insurance. Sixteen percent of the population has one or more disabilities.
The region is demographically and economically diverse. Although none of the counties are defined as rural by Florida Statutes, portions of five counties in the region contain rural areas with agricultural industries that employ seasonal and resident workers. These workers, historically have had limited access to healthcare resources. The Orlando metropolitan areas main economic base is tourism, with multiple major theme parks and numerous other attractions. Orlando has the second largest convention center in the US. Visit Orlando reports more than 51 million visitors in 2010 with nearly 3.7 million being international visitors. To accommodate visitors there are a large number of hotels, restaurants and one of the busiest airports in the US. Port Canaveral is one of the busiest cruise ports in the world. Home to three cruise lines it handles 2,722,751 cruise passengers a year.36 Other coastal communities like Daytona are also host to many special events like bike week and the Daytona 500 bring in a large number of visitors. Historically aerospace businesses around the Kennedy Space Center in Brevard County played a key role and were a significant boost to the economy creating many jobs and attracting tourists. The eminent/impending shut down of the shuttle program will have
35 County population is from the 2010 US Census – Other demographic statistics are from the FDOH Vulnerable Population profiles. http://www.floridashealth.com/prepare/VulnerablePopulations.html. 36 http://www.portcanaveral.com/index2.php p 25.
Hospital Preparedness Program Overview 2002-2010 Page 51

an adverse effect on employment and business. The region also has an operating nuclear power plant located in St. Lucie County.
Hurricanes are the major risk for this region given the extensive Atlantic coastline of over 170 miles and many highly/densely populated communities with manufactured homes. Many of the homes and communities on the A1A corridor do not meet current building codes. In 2004 large segments of the A1A corridor and communities were devastated. According to the State of Florida Enhanced Hazard Mitigation Plan, August 2010,37 the number of counties in the region rated at high risk for hazards is:
Counties Rated High Hazard Hazards
9 (all counties) Hurricanes 5 Flooding 3 Tornadoes 2 Wildfires, Sinkholes 1 Drought
The diversity of the population, the high risk for hurricanes and flooding, and the large number of visitors, who may or may not have access to health care services, may not know where to go for assistance, and may not use English as their primary language, present hospitals in the region with a wide range of challenges for all-hazard preparedness.
The region currently has 37 hospitals with emergency departments (EDs), with a total 9,320 licensed beds. Information throughout this report on licensed beds is based on the Florida Agency for Health Care Administration, January 2010, Florida Hospital Bed Need Projections and Service Utilization by District report.38 There are an additional 16 hospitals without EDs. These are primarily specialty hospitals providing such services as long-term acute care, rehabilitation, and behavioral health. Among the 37 hospitals one is designated as a Level 1 Trauma Center with a burn unit, and three are designated Level II Trauma Centers.39 The region is also home to one Veteran’s Administration Hospital in Orlando.
Thirty-four or 92% of the hospitals are Joint Commission accredited which requires an emergency operations plan and all hazards emergency response capabilities. Five of the hospitals without EDs are also Joint Commission accredited.
37 Enhanced State Hazard Mitigation Plan 2010 http://www.floridadisaster.org/mitigation/State/Index.htm . Retrieved 5-18-11 38 While the numbers did not vary significantly over the seven funding cycles 2002-2003 to 2009-2010 can be considered estimates. 39 Agency for Health Care Administration Facility Search, http://www.floridahealthfinder.gov/facilitylocator/FacilitySearch.aspx . Retrieved 5-17-11
Hospital Preparedness Program Overview 2002-2010 Page 52
PARTICIPATING HOSPITALS For the purpose of this report, participation is defined as a hospital with an emergency department that has been offered, accepted, and executed a contract with the Florida Department of Health. Some of the larger hospital systems receive funds for more than one hospital in their system. When this occurs there may be one contract, however, the funds and preparedness resources are provided to other hospitals in the system. This allows the contracting hospital to leverage their purchasing power and expedite the expenditure of funds. In such cases, each hospital receiving funds directly or indirectly has been counted as participating.
Information is presented by funding cycle (FC). Funding cycles correspond with state fiscal years. One funding cycle encompassed two fiscal years (2005-2007).
Preliminary observations based on the data indicate:
♦ Each of the 37 hospitals with EDs participated in the Hospital Preparedness Program for at least one funding cycle.
♦ Thirteen of the hospitals, including the four largest hospitals in the region participated in all eight funding cycles.
♦ Hospital participation ranged from a low of 14 in funding cycle 2002-2003 to a high of 35 in funding cycles 2003-2004.
♦ In funding cycle 2010-2011, 32 hospitals participated, accounting for 8,475 beds.
♦ The five largest hospitals, those with more than 350 beds, constitute 35% of the licensed beds for the Region.
♦ In addition to hospitals with EDs included in this analysis, during the 2003-2004 funding cycle Lucerne Pavilion part of Orlando Regional, received an executed contract totaling $10,301 for equipment and exercises as part of a special project. However, only $6,573 was expended for ventilators.
♦ Thirty-three of the 37 hospitals in the region are part of eight hospital corporations or systems, Orlando Health, Health First Inc., HCA (Hospital Corporation of America), Adventist Health System, Halifax Health System, Central Florida Health Alliance, Martin Memorial Health Systems, and HMA (Health Management Associates, Inc.).40
Figure 1 displays participation over eight funding cycles. The first column for each funding cycle shows the percentage of hospitals with EDs that participated. The next two columns indicate the number and percentage of the region’s licensed beds. The figure illustrates that in the first year 38% of the hospitals participated, representing 56% of the beds. The second funding cycle
40 Florida Hospital Association, Hospital Directory, http://www.fha.org/DirectoryLookupResults. Retrieved July 1, 2011.
Hospital Preparedness Program Overview 2002-2010 Page 53

had very high participation. After that, participation began to decline increasing again in funding cycle 2008-2009. Participation declined again slightly for 2010-2011.
*Please note that this table does not reflect the full picture of what occurred in the region during funding cycles 2005-2007 and 2007-2008. During those funding cycles, hospitals within a larger system may have received benefits and participated through sharing of funds provided to a main hospital within that system. Because these hospitals were not specified as participating in contract language they are not reflected in Figure 1, Table 1, and Table 2 as a participating hospital. Regional information reports that 33 hospitals benefited from HPP funding during each of those funding cycles.
Figure 1: Region 5 Pattern of Participation by Funding Cycle*
Hospital Participation by Funding Cycle
38%
95%
89%
78%
62%
86%
92%
86%
56%
96%
95%
86%
70%
90%
94%
91%
5,246
8,949
8,888
7,978
6,526
8,367 8,785
8,475
0%
10%
20%
30%
40%
50%
60%
70%
80%
90%
100%
FC 02‐03 FC 03‐04 FC 04‐05 FC 05‐07 FC 07‐08 FC 08‐09 FC 09‐10 FC 10‐11
% of H
ospitals and
Bed
s
0
1,000
2,000
3,000
4,000
5,000
6,000
7,000
8,000
9,000
10,000
# of Licen
sed Be
ds (2
010)
% of Region's Hospitals Represented % of Region's Licensed Beds Represented # of Licensed Beds in Participating Hospitals
Table 1 provides another way of looking at regional participation trends and includes the total number of hospitals.
Hospital Preparedness Program Overview 2002-2010 Page 54
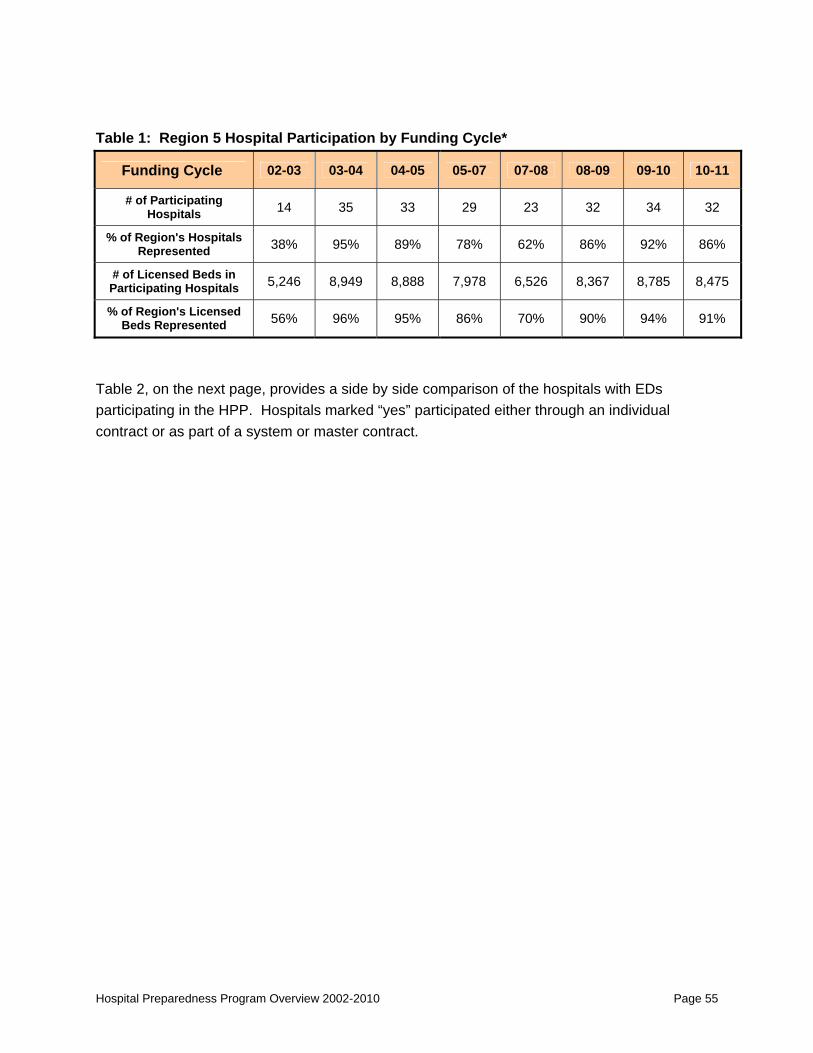
Table 1: Region 5 Hospital Participation by Funding Cycle*
Funding Cycle 02-03 03-04 04-05 05-07 07-08 08-09 09-10 10-11
# of Participating Hospitals 14 35 33 29 23 32 34 32
% of Region's Hospitals Represented 38% 95% 89% 78% 62% 86% 92% 86%
# of Licensed Beds in Participating Hospitals 5,246 8,949 8,888 7,978 6,526 8,367 8,785 8,475
% of Region's Licensed Beds Represented 56% 96% 95% 86% 70% 90% 94% 91%
Table 2, on the next page, provides a side by side comparison of the hospitals with EDs participating in the HPP. Hospitals marked “yes” participated either through an individual contract or as part of a system or master contract.
Hospital Preparedness Program Overview 2002-2010 Page 55

Table 2: Region 5 Hospital Participation 07-08 to 10-11 Funding Cycles*
County Hospital Name
Lice
nsed
Bed
s (2
010) # FCs
Participated in 1st Four
FCs
07-08 Participated
08-09 Participated
09-10 Participated
10-11 Participated
Orange Florida Hospital Apopka 50 2 Yes Yes Yes YesVolusia Halifax Medical Center - Port Orange 80 1 No Yes Yes YesOsceola Florida Hospital Kissimmee 83 2 No Yes Yes Yes
Osceola St. Cloud Regional Medical Center (formerly Orlando Regional St. Cloud) 84 2 Yes Yes Yes Yes
Martin Martin Memorial Hospital South 100 3 No Yes Yes Yes
Lake South Lake Hospital 104 3 Yes No Yes No
Volusia Bert Fish Medical Center 112 3 No Yes Yes YesOsceola Florida Hospital Celebration 112 2 No Yes Yes Yes
Brevard Wuesthoff Health Systems - Melbourne 115 3 No No No NoVolusia Florida Hospital Oceanside 119 2 Yes Yes Yes Yes
Indian River Sebastian River Medical Center 129 2 Yes Yes No NoVolusia Florida Hospital Fish Memorial 139 2 Yes Yes Yes YesBrevard Cape Canaveral Hospital 150 3 Yes Yes Yes YesBrevard Palm Bay Community Hospital 152 3 No Yes Yes YesVolusia Florida Hospital Deland 156 3 Yes Yes Yes YesOrange Health Central 171 4 Yes Yes Yes YesLake Florida Hospital Waterman 204 4 Yes Yes Yes YesSeminole South Seminole Hospital 206 3 No No Yes NoBrevard Parrish Medical Center 210 4 Yes Yes Yes YesOrange Florida Hospital East Orlando 225 2 No Yes Yes Yes
Seminole Central Florida Regional Hospital 226 4 Yes Yes Yes YesSt. Lucie St. Lucie Medical Center 229 3 Yes Yes Yes YesOsceola Osceola Regional Medical Center 235 3 Yes Yes Yes Yes
Orange Dr. P Philips Hospital (formerly Orlando Regional Sand Lake) 237 3 No No Yes Yes
Martin Martin Memorial Medical Center 244 4 Yes Yes Yes Yes
Volusia
Florida Hospital Memorial Medical (previously Florida Hospital Ormond, formerly Memorial Ormond Beach) 277 4 Yes Yes Yes Yes
Brevard Wuesthoff Health Systems - Rockledge 291 2 No No No No
Lake Leesburg Regional Medical Center 294 4 Yes Yes Yes Yes
Orange Florida Hospital Winter Park (Winter Park Memorial Hospital) 297 2 No Yes Yes Yes
Indian River Indian River Memorial Hospital (Indian River Medical Center) 335 4 Yes Yes Yes Yes
Seminole Florida Hospital Altamonte 341 2 No Yes Yes YesSt. Lucie Lawnwood Regional Medical Center 341 4 Yes Yes Yes Yes
Orange Arnold Palmer Hospital for Children & Women Arnold Palmer Medical Center) 443 3 No Yes Yes Yes
Brevard Holmes Regional Medical Center 514 4 Yes Yes Yes Yes
Orange
Orlando Health (original allocation to Orlando Regional Medical Center which is part of the Orlando Health System) 581 4 Yes Yes Yes Yes
Volusia Halifax Medical Center 654 4 Yes Yes Yes YesOrange Florida Hospital Orlando 1,080 4 Yes Yes Yes Yes
- 37 9,320 23 32 34 32
Hospital Preparedness Program Overview 2002-2010 Page 56

Information regarding participation is important but it is only one part of the picture. It is necessary to look at the levels of funding and expenditures. The next part of the data provides additional detail related to funding.
FUNDING When reviewing the level of funding and the distribution of funding, it is important to keep in mind that a number of factors can impact participation. Region 5 hospitals with EDs received a total allocation of $21,761,59641 through funding cycle 2009-2010. The 5 largest hospitals, those with greater than 350 beds, were recipients of $12,126,519 or 55.7% of the allocated funds. The remaining 32 hospitals, with 6,048 beds, received $9,983,520 or 44.3% of the allocated funds.
Executed contracts totaled $21,191,949. Of the total funding in executed contracts, $16,788,780 was expended. Table 3 displays the region-wide total funds allocated, executed in contracts, and spent for each funding cycle. Levels of expenditures can be influenced by the maturation of the level of preparedness of the hospital partners. Low expenditure rates by individual hospitals may be related to a hospital being sold, changes in management, changes in allowable purchases, disallowances, events such as H1N1 resulting in higher priorities, or other factors. Further individual review may be necessary to determine specific reasons and opportunities for improvement.
Table 3: Region 5 Total Allocated, Executed, Spent Funds by Funding Cycle
Funding Cycle Total Amount Allocated
Total Amount in Executed Contract
Total Amount Spent
% of Executed Contract Funds Spent
2002 - 2003 1,096,958 1,096,958 894,704 82%
2003 - 2004 2,858,610 2,854,855 2,570,095 90%
2004 - 2005 4,358,155 4,358,155 3,374,073 77%
2005 - 2007 7,110,184 6,544,291 4,540,399 69%
2007 - 2008 2,985,158 2,985,158 2,540,696 85%
2008 - 2009 2,111,767 2,111,767 1,797,794 85%
2009 - 2010 1,240,764 1,240,764 1,071,019 86%
Total All FCs 21,761,596 21,191,949 16,788,780 79%
This record of spending as well as the growth and decline in total funding over seven funding cycles is illustrated in Figures 2 and 3.
41 This does not include the $10,301 in allocated funds during funding cycle 2003-2004 to Lucerne Pavilion part of Orlando Regional
Hospital Preparedness Program Overview 2002-2010 Page 57
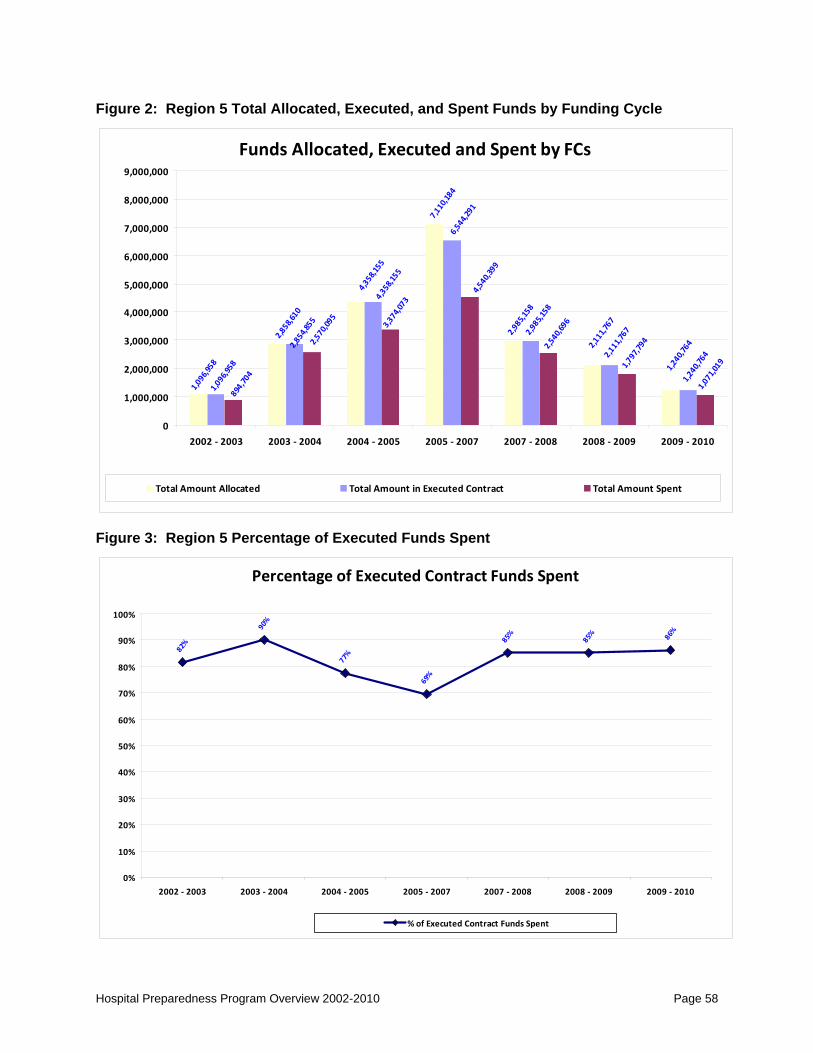
Figure 2: Region 5 Total Allocated, Executed, and Spent Funds by Funding Cycle
Funds Allocated, Executed and Spent by FCs
1,096,958
2,858,610
4,358,155
7,110,184
2,985,158
2,111,767
1,240,764
1,096,958
2,854,855
4,358,155
6,544,291
2,985,158
2,111,767
1,240,764
894,704
2,570,095
3,374,073
4,540,399
2,540,696
1,797,794
1,071,019
0
1,000,000
2,000,000
3,000,000
4,000,000
5,000,000
6,000,000
7,000,000
8,000,000
9,000,000
2002 ‐ 2003 2003 ‐ 2004 2004 ‐ 2005 2005 ‐ 2007 2007 ‐ 2008 2008 ‐ 2009 2009 ‐ 2010
Total Amount Allocated Total Amount in Executed Contract Total Amount Spent
Figure 3: Region 5 Percentage of Executed Funds Spent
Percentage of Executed Contract Funds Spent
82%
90%
77%
69%
85%
85% 86%
0%
10%
20%
30%
40%
50%
60%
70%
80%
90%
100%
2002 ‐ 2003 2003 ‐ 2004 2004 ‐ 2005 2005 ‐ 2007 2007 ‐ 2008 2008 ‐ 2009 2009 ‐ 2010
% of Executed Contract Funds Spent
Hospital Preparedness Program Overview 2002-2010 Page 58
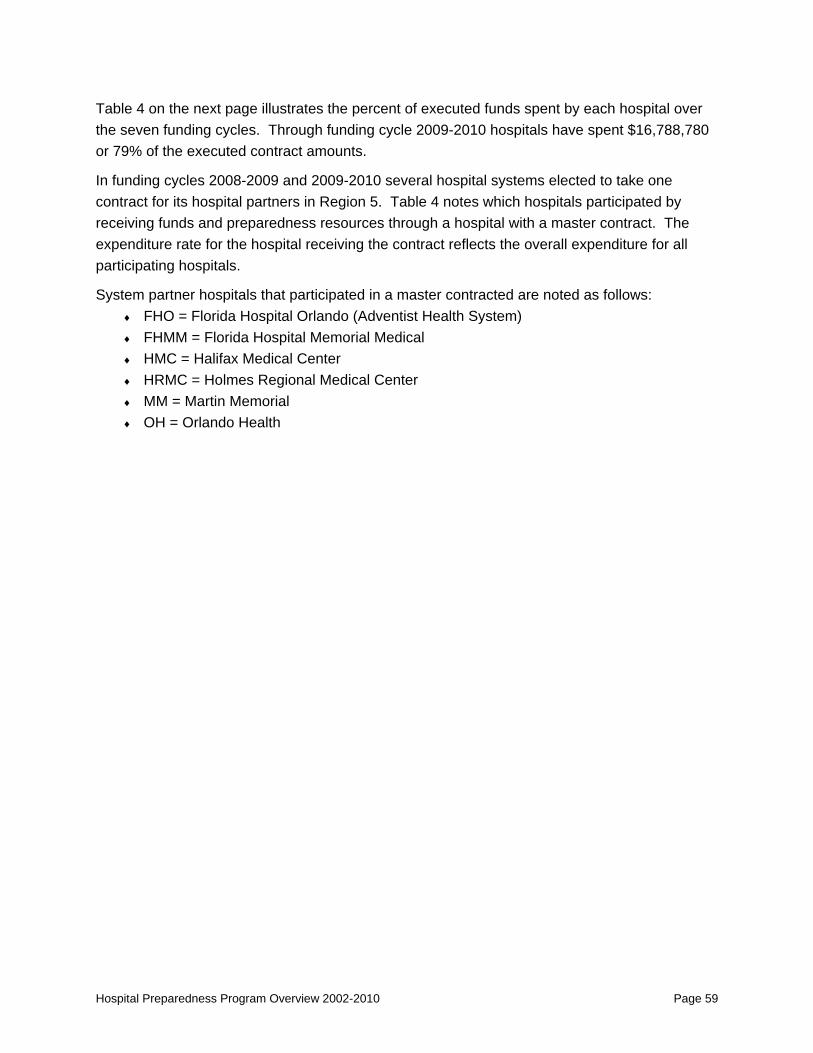
Table 4 on the next page illustrates the percent of executed funds spent by each hospital over the seven funding cycles. Through funding cycle 2009-2010 hospitals have spent $16,788,780 or 79% of the executed contract amounts.
In funding cycles 2008-2009 and 2009-2010 several hospital systems elected to take one contract for its hospital partners in Region 5. Table 4 notes which hospitals participated by receiving funds and preparedness resources through a hospital with a master contract. The expenditure rate for the hospital receiving the contract reflects the overall expenditure for all participating hospitals.
System partner hospitals that participated in a master contracted are noted as follows: ♦ FHO = Florida Hospital Orlando (Adventist Health System) ♦ FHMM = Florida Hospital Memorial Medical ♦ HMC = Halifax Medical Center ♦ HRMC = Holmes Regional Medical Center ♦ MM = Martin Memorial ♦ OH = Orlando Health
Hospital Preparedness Program Overview 2002-2010 Page 59

Table 4: Region 5 Hospitals’ Percentage of Funds Spent from Executed Contracts
County Hospital Name
Lice
nsed
B
eds
(201
0) 02-03 Executed Contract
Spent
03-04 Executed Contract
Spent
04-05 Executed Contract
Spent
05-07 Executed Contract
Spent
07-08 Executed Contract
Spent
08-09 Executed Contract
Spent
09-10 Executed Contract
Spent
Orange Florida Hospital Apopka 50 100% 8% 0% FHO FHO Volusia Halifax Medical Center - Port Orange 80 100% HMC 94% Osceola Florida Hospital Kissimmee 83 100% 100% FHO FHO
Osceola St. Cloud Regional Medical Center (formerly Orlando Regional St. Cloud) 84 72% 0% 100% 100% 0%
Martin Martin Memorial Hospital South 100 93% 100% 0% MM 100%
Lake South Lake Hospital 104 100% 89% 53% 76% 90% Volusia Bert Fish Medical Center 112 94% 100% 0% 98% 82% Osceola Florida Hospital Celebration 112 100% 100% FHO FHO Brevard Wuesthoff Health Systems - Melbourne 115 81% 0% 100% 0% Volusia Florida Hospital Oceanside 119 100% 57% 100% FHMM FHMM Indian River Sebastian River Medical Center 129 89% 12% 70% 0% 0% Volusia Florida Hospital Fish Memorial 139 48% 100% 92% 37% 95% Brevard Cape Canaveral Hospital 150 90% 69% 38% 100% HRMC HRMC Brevard Palm Bay Community Hospital 152 48% 93% 31% HRMC HRMC Volusia Florida Hospital Deland 156 91% 100% 87% 78% 90% 71% Orange Health Central 171 0% 92% 100% 95% 80% 100% 100% Lake Florida Hospital Waterman 204 99% 88% 0% 24% 100% 0% 100% Seminole South Seminole Hospital 206 64% 77% 75% OH Brevard Parrish Medical Center 210 79% 84% 100% 85% 100% 100% 95% Orange Florida Hospital East Orlando 225 100% 100% FHO FHO Seminole Central Florida Regional Hospital 226 80% 32% 31% 100% 100% 100% 0% St. Lucie St. Lucie Medical Center 229 98% 100% 0% 0% 97% 0% Osceola Osceola Regional Medical Center 235 99% 100% 97% 94% 100% 95%
Orange Dr. P Philips Hospital (formerly Orlando Regional Sand Lake) 237 96% 100% 100% OH
Martin Martin Memorial Medical Center 244 81% 100% 100% 0% 99% 63% MM
Volusia Florida Hospital Ormond, formerly Memorial Ormond Beach) 277 100% 96% 38% 53% 94% 100% 97%
Brevard Wuesthoff Health Systems - Rockledge 291 100% 100% 0% Lake Leesburg Regional Medical Center 294 84% 72% 100% 59% 76% 100% 78%
Orange Florida Hospital Winter Park (Winter Park Memorial Hospital) 297 100% 100% FHO FHO
Indian River Indian River Memorial Hospital (Indian River Medical Center) 335 97% 97% 49% 53% 71% 100% 39%
Seminole Florida Hospital Altamonte 341 100% 55% FHO FHO St. Lucie Lawnwood Regional Medical Center 341 100% 82% 0% 0% 75% 57% 94%
Orange Arnold Palmer Hospital for Children & Women Arnold Palmer Medical Center) 443 64% 77% 100% OH OH
Brevard Holmes Regional Medical Center 514 100% 98% 96% 95% 100% 99% 94%
Orange
Orlando Health (original allocation to Orlando Regional Medical Center which is part of the Orlando Health System) 581 69% 88% 60% 97% 97% 99% 100%
Volusia Halifax Medical Center 654 82% 99% 100% 85% 85% 100% 99% Orange Florida Hospital Orlando 1,080 71% 100% 79% 54% 80% 72% 100% More detail regarding the amount of funds allocated, executed, and spent by each hospital is available on request.
PROGRAMMATIC FUNDING CATEGORIES Data about funding and participation was gathered in four categories:
♦ Equipment
♦ Training
Hospital Preparedness Program Overview 2002-2010 Page 60
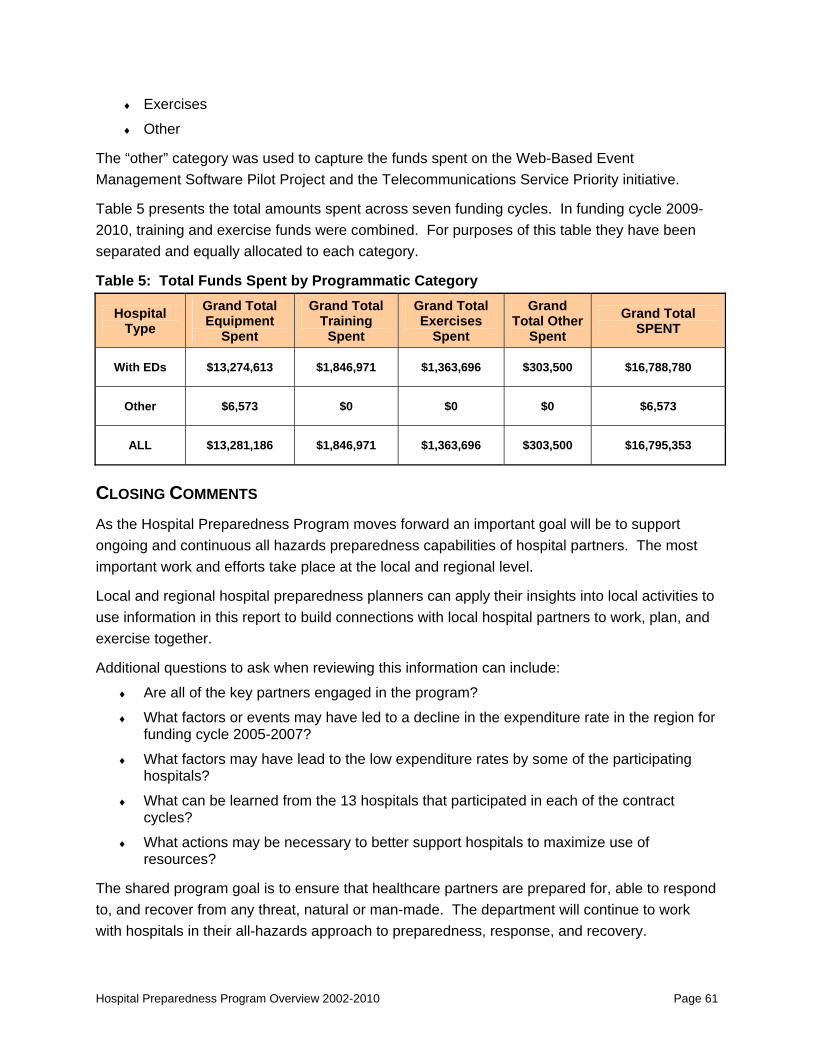
Hospital Preparedness Program Overview 2002-2010 Page 61
♦ Exercises
♦ Other
The “other” category was used to capture the funds spent on the Web-Based Event Management Software Pilot Project and the Telecommunications Service Priority initiative.
Table 5 presents the total amounts spent across seven funding cycles. In funding cycle 2009-2010, training and exercise funds were combined. For purposes of this table they have been separated and equally allocated to each category.
Table 5: Total Funds Spent by Programmatic Category
Hospital Type
Grand Total Equipment
Spent
Grand Total Training
Spent
Grand Total Exercises
Spent
Grand Total Other
Spent Grand Total
SPENT
With EDs $13,274,613 $1,846,971 $1,363,696 $303,500 $16,788,780
Other $6,573 $0 $0 $0 $6,573
ALL $13,281,186 $1,846,971 $1,363,696 $303,500 $16,795,353
CLOSING COMMENTS As the Hospital Preparedness Program moves forward an important goal will be to support ongoing and continuous all hazards preparedness capabilities of hospital partners. The most important work and efforts take place at the local and regional level.
Local and regional hospital preparedness planners can apply their insights into local activities to use information in this report to build connections with local hospital partners to work, plan, and exercise together.
Additional questions to ask when reviewing this information can include:
♦ Are all of the key partners engaged in the program?
♦ What factors or events may have led to a decline in the expenditure rate in the region for funding cycle 2005-2007?
♦ What factors may have lead to the low expenditure rates by some of the participating hospitals?
♦ What can be learned from the 13 hospitals that participated in each of the contract cycles?
♦ What actions may be necessary to better support hospitals to maximize use of resources?
The shared program goal is to ensure that healthcare partners are prepared for, able to respond to, and recover from any threat, natural or man-made. The department will continue to work with hospitals in their all-hazards approach to preparedness, response, and recovery.
Hospital Preparedness Program Regional Domestic Security Task Force
Region 6
PROGRAM OVERVIEW This report provides a descriptive analysis of the Hospital Preparedness Program (HPP) participation and programmatic focus for Region 6. The information provides an overview of regional and county specific partnerships with local hospitals. Information is intended to provide a picture that can be used to confirm and document what is happening in the region and to assist with planning for future activities.
THE REGION Region 6 is made up of 10 counties, Charlotte, Collier, Desoto, Glades, Hendry, Highlands, Lee, Manatee, Okeechobee, and Sarasota. The 2010 U.S. Census population for this Region is 2,028,201.42 The smallest county is Glades with a population of 12,884 and the largest county is Lee with a population of 618,754. This region has a large population of elders and retirees. Twenty-six percent of the population is age 65 or older, well above the national average of 13% or the state average of 17%. Four percent of the region’s population is age 85 or older, also above the state average of 2.6%. Nineteen percent of persons under 65 years old have no health insurance. Sixteen percent of the population has one or more disabilities.
The region is demographically and economically diverse. Five of the 10 counties are defined by Florida Statutes as being rural with a population density of less than 100 individuals per square mile. In addition, other counties in the region have rural segments. Three of the state’s 28 designated rural hospitals are in this region.43 One of these, Hendry Regional Medical Center is also designated as one of the state’s 13 critical access hospitals.
Five of the counties border the Gulf of Mexico and account for the largest portion of the region’s population and urban area. The region has an international airport in Lee County and one of the largest ports in the state. Port Manatee is the closest US deepwater seaport to the Panama Canal.
42 County population is from the 2010 US Census – Other demographic statistics are from the FDOH Vulnerable Population profiles. http://www.floridashealth.com/prepare/VulnerablePopulations.html. 43 Agency for Health Care Administration Facility/Provider Locator. http://www.floridahealthfinder.gov/facilitylocator/FacilitySearch.aspx . Retrieved 4/8/2011
Hospital Preparedness Program Overview 2002-2010 Page 62

The region attracts many tourists and winter residents. According to the Southwest Florida Regional Planning Council, which serves six of the 10 counties in this region, population can grow as much as 30 percent during the winter. The region also has three community colleges, three private colleges, and one public university adding to the potential number of temporary residents. The large number of temporary residents and tourists may not have an emergency plan in place and may or may not have access to healthcare services. The region’s non-urban areas have significant agricultural activity with three growing seasons each year. This industry employs seasonal and resident workers who historically have had limited access to healthcare resources.
The region is at high risk for hurricanes. According to the State of Florida Enhanced Hazard Mitigation Plan, August 2010,44 the number of counties in the region rated at high risk for hazards is:
Counties Rated
High Hazard Hazards
10 (all counties) Hurricanes 6 Tornadoes; Wildfires 5 Flooding 4 Severe Storms 2 Drought; Freezes, Erosion
1 Extreme Heat, Winter Storms, Sinkholes, Terrorism, Technological Events
Collier county ranks at high risk for 11 of the 17 hazards ranked in the plan, more than any other county in the state.
There are currently 25 hospitals with emergency departments (EDs), with 5,946 total licensed beds. A 26th hospital, Southwest Regional Medical Center in Lee County closed in early 2009. Information throughout this report on licensed beds is based on the Florida Agency for Health Care Administration, January 2010, Florida Hospital Bed Need Projections and Service Utilization by District report.45 Lee Memorial is designated as Level 2 Trauma Center. There are no designated Level 1 or Pediatric Trauma Centers or Hospitals with burn units in the region.46
44 Enhanced State Hazard Mitigation Plan 2010 http://www.floridadisaster.org/mitigation/State/Index.htm . Retrieved 5-18-11 45 While the numbers did not vary significantly over the seven funding cycles 2002-2003 to 2009-2010 can be considered estimates. 46 Agency for Health Care Administration Facility Search, http://www.floridahealthfinder.gov/facilitylocator/FacilitySearch.aspx . Retrieved 5-17-11
Hospital Preparedness Program Overview 2002-2010 Page 63

There are an additional five hospitals without EDs in the region. These are primarily specialty hospitals providing such services as long-term acute care, rehabilitation, eating and chemical dependency treatment, and behavioral health.
Twenty-four of the 25 hospitals with emergency departments are Joint Commission accredited which requires an emergency operations plan and a substantial level of all hazards emergency response capability. One of the hospitals without EDs is also Joint Commission accredited.
The large rural geographic area, age and diversity of the population, large fluctuations in the population numbers during the year, and high risks for hazards, present hospitals in this region a wide range of challenges for all-hazard planning and preparedness.
PARTICIPATING HOSPITALS For the purpose of this report, participation is defined as a hospital with an emergency department that has been offered, accepted, and executed a contract with the Florida Department of Health. Some of the larger hospital systems receive funds for more than one hospital in their system. When this occurs there may be one contract, however, the funds and preparedness resources are provided to other hospitals in the system. This allows the contracting hospitals to leverage their purchasing power and expedite the expenditure of funds. In such cases, each hospital receiving funds directly or indirectly has been counted as participating.
Information is presented by funding cycle (FC). Funding cycles correspond with state fiscal years. One funding cycle encompassed two fiscal years (2005-2007).
Preliminary observations based on the data indicate:
♦ Each of the 26 hospitals with EDs participated in the Hospital Preparedness Program for at least two funding cycles.
♦ Seven of the hospitals participated in all eight funding cycles.
♦ Hospital participation ranged from a low of ten in funding cycle 2002-2003 to a high of 24 in funding cycle 2009-2010.
♦ In funding cycle 2010-2011, 21 hospitals participated, accounting for 5,291 beds.
♦ The five largest hospitals accounted for 2,392 or 40% of the hospitals with EDs licensed beds in the region.
♦ All funds allocated in the region went to hospitals with emergency departments.
♦ Twenty-four of the current 25 hospitals in the region are part of seven hospital corporations or systems,47 HCA (Hospital Corporation of America), HMA (Health
47 Florida Hospital Association, Hospital Directory, http://www.fha.org/DirectoryLookupResults. Retrieved July 1, 2011.
Hospital Preparedness Program Overview 2002-2010 Page 64

Management Associates, Inc.), Adventist Health System, Lee Memorial Health System, Quorum Health Resources, Universal Health Services, Inc., and NCH Healthcare System.
Figure 1 displays participation over eight funding cycles. The first column for each funding cycle shows the percentage of hospitals with EDs that participated. The next two columns indicate the number and percentage of the Region’s licensed beds. The figure illustrates that in the first year ten of the hospitals participated, representing 2,407 of the beds. Participation fluctuated during the next funding cycles, reaching its highest participation for 2009-2010. Participation decreased again for funding cycle 2010-2011.
Figure 1: Region 6 Pattern of Participation by Funding Cycle
Hospital Participation by Funding Cycle
38%
77%
69%
88%
73%
69%
96%
84%
40%
83%
73%
90%
72%
69%
96%
89%
2,407
4,910
4,361
5,366
4,287
4,115
5,727
5,291
0%
10%
20%
30%
40%
50%
60%
70%
80%
90%
100%
FC 02‐03 FC 03‐04 FC 04‐05 FC 05‐07 FC 07‐08 FC 08‐09 FC 09‐10 FC 10‐11
% of H
ospitals and
Bed
s
0
1,000
2,000
3,000
4,000
5,000
6,000
7,000
# of Licen
sed Be
ds (20
10)
% of Region's Hospitals Represented % of Region's Licensed Beds Represented # of Licensed Beds in Participating Hospitals
Table 1 provides another way of looking at regional participation trends and includes the total number of hospitals.
Table 1: Region 6 Hospital Participation by Funding Cycle
Funding Cycle 02-03 03-04 04-05 05-07 07-08 08-09 09-10 10-11
# of Participating Hospitals 10 20 18 23 19 18 24 21
% of Region's Hospitals Represented 38% 77% 69% 88% 73% 69% 96% 84%
# of Licensed Beds in Participating Hospitals 2,407 4,910 4,361 5,366 4,287 4,115 5,727 5,291
% of Region's Licensed Beds Represented 40% 83% 73% 90% 72% 69% 96% 89%
Hospital Preparedness Program Overview 2002-2010 Page 65
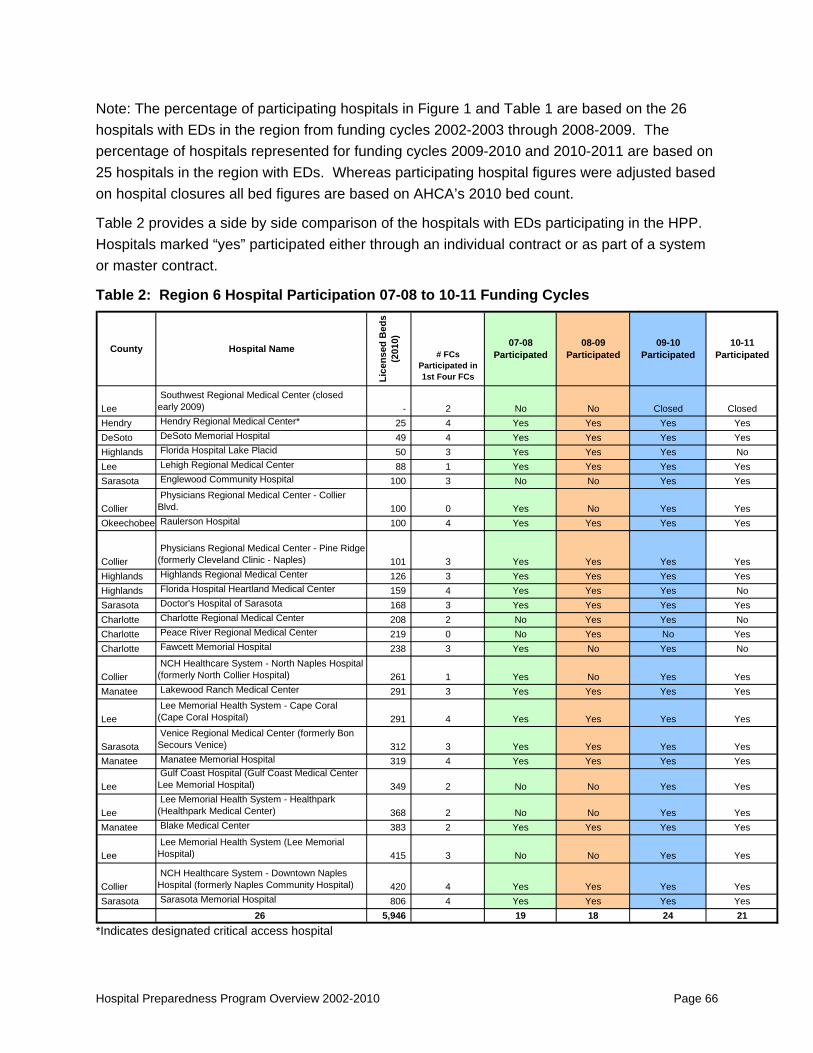
Note: The percentage of participating hospitals in Figure 1 and Table 1 are based on the 26 hospitals with EDs in the region from funding cycles 2002-2003 through 2008-2009. The percentage of hospitals represented for funding cycles 2009-2010 and 2010-2011 are based on 25 hospitals in the region with EDs. Whereas participating hospital figures were adjusted based on hospital closures all bed figures are based on AHCA’s 2010 bed count.
Table 2 provides a side by side comparison of the hospitals with EDs participating in the HPP. Hospitals marked “yes” participated either through an individual contract or as part of a system or master contract.
Table 2: Region 6 Hospital Participation 07-08 to 10-11 Funding Cycles
County Hospital Name
Lice
nsed
Bed
s (2
010)
# FCs Participated in 1st Four FCs
07-08 Participated
08-09 Participated
09-10 Participated
10-11 Participated
Lee Southwest Regional Medical Center (closed early 2009) - 2 No No Closed Closed
Hendry Hendry Regional Medical Center* 25 4 Yes Yes Yes YesDeSoto DeSoto Memorial Hospital 49 4 Yes Yes Yes YesHighlands Florida Hospital Lake Placid 50 3 Yes Yes Yes NoLee Lehigh Regional Medical Center 88 1 Yes Yes Yes YesSarasota Englewood Community Hospital 100 3 No No Yes Yes
Collier Physicians Regional Medical Center - Collier Blvd. 100 0 Yes No Yes Yes
Okeechobee Raulerson Hospital 100 4 Yes Yes Yes Yes
Collier Physicians Regional Medical Center - Pine Ridge(formerly Cleveland Clinic - Naples) 101 3 Yes Yes Yes Yes
Highlands Highlands Regional Medical Center 126 3 Yes Yes Yes YesHighlands Florida Hospital Heartland Medical Center 159 4 Yes Yes Yes NoSarasota Doctor's Hospital of Sarasota 168 3 Yes Yes Yes YesCharlotte Charlotte Regional Medical Center 208 2 No Yes Yes NoCharlotte Peace River Regional Medical Center 219 0 No Yes No YesCharlotte Fawcett Memorial Hospital 238 3 Yes No Yes No
Collier NCH Healthcare System - North Naples Hospital(formerly North Collier Hospital) 261 1 Yes No Yes Yes
Manatee Lakewood Ranch Medical Center 291 3 Yes Yes Yes Yes
Lee Lee Memorial Health System - Cape Coral (Cape Coral Hospital) 291 4 Yes Yes Yes Yes
Sarasota Venice Regional Medical Center (formerly Bon Secours Venice) 312 3 Yes Yes Yes Yes
Manatee Manatee Memorial Hospital 319 4 Yes Yes Yes Yes
Lee Gulf Coast Hospital (Gulf Coast Medical Center Lee Memorial Hospital) 349 2 No No Yes Yes
Lee Lee Memorial Health System - Healthpark (Healthpark Medical Center) 368 2 No No Yes Yes
Manatee Blake Medical Center 383 2 Yes Yes Yes Yes
Lee Lee Memorial Health System (Lee Memorial Hospital) 415 3 No No Yes Yes
Collier NCH Healthcare System - Downtown Naples Hospital (formerly Naples Community Hospital) 420 4 Yes Yes Yes Yes
Sarasota Sarasota Memorial Hospital 806 4 Yes Yes Yes Yes26 5,946 19 18 24 21
*Indicates designated critical access hospital
Hospital Preparedness Program Overview 2002-2010 Page 66
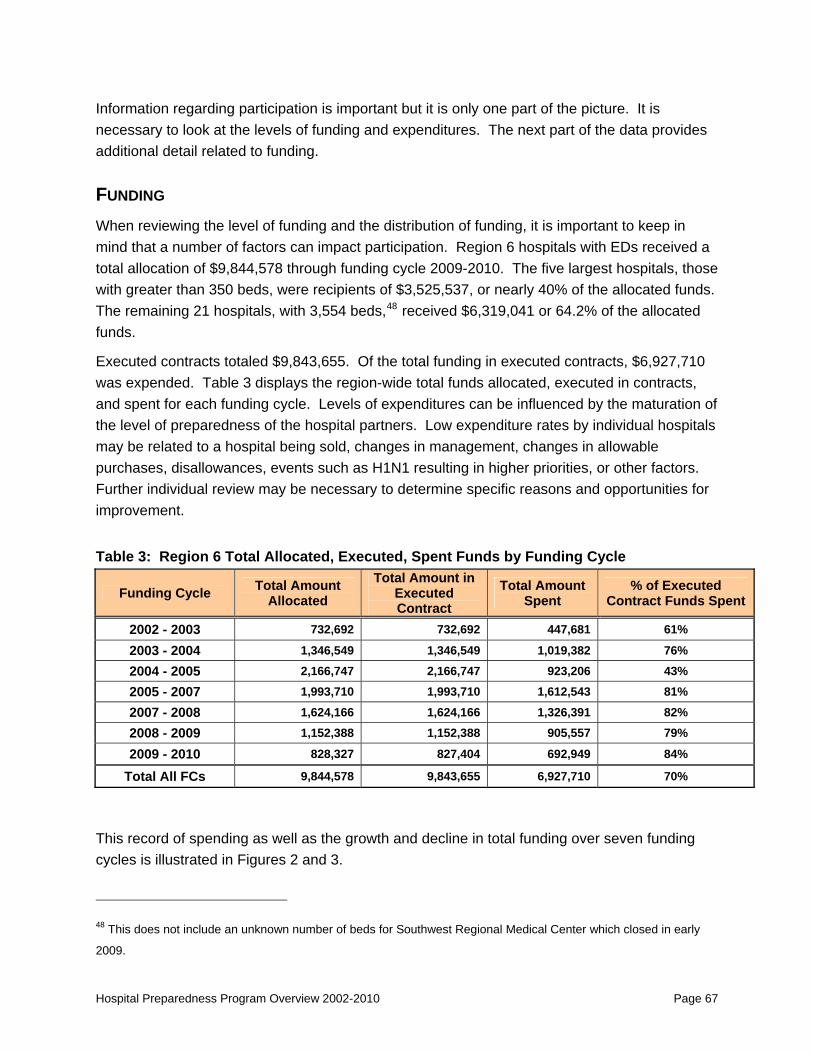
Information regarding participation is important but it is only one part of the picture. It is necessary to look at the levels of funding and expenditures. The next part of the data provides additional detail related to funding.
FUNDING When reviewing the level of funding and the distribution of funding, it is important to keep in mind that a number of factors can impact participation. Region 6 hospitals with EDs received a total allocation of $9,844,578 through funding cycle 2009-2010. The five largest hospitals, those with greater than 350 beds, were recipients of $3,525,537, or nearly 40% of the allocated funds. The remaining 21 hospitals, with 3,554 beds,48 received $6,319,041 or 64.2% of the allocated funds.
Executed contracts totaled $9,843,655. Of the total funding in executed contracts, $6,927,710 was expended. Table 3 displays the region-wide total funds allocated, executed in contracts, and spent for each funding cycle. Levels of expenditures can be influenced by the maturation of the level of preparedness of the hospital partners. Low expenditure rates by individual hospitals may be related to a hospital being sold, changes in management, changes in allowable purchases, disallowances, events such as H1N1 resulting in higher priorities, or other factors. Further individual review may be necessary to determine specific reasons and opportunities for improvement.
Table 3: Region 6 Total Allocated, Executed, Spent Funds by Funding Cycle
Funding Cycle Total Amount Allocated
Total Amount in Executed Contract
Total Amount Spent
% of Executed Contract Funds Spent
2002 - 2003 732,692 732,692 447,681 61%
2003 - 2004 1,346,549 1,346,549 1,019,382 76%
2004 - 2005 2,166,747 2,166,747 923,206 43%
2005 - 2007 1,993,710 1,993,710 1,612,543 81%
2007 - 2008 1,624,166 1,624,166 1,326,391 82%
2008 - 2009 1,152,388 1,152,388 905,557 79%
2009 - 2010 828,327 827,404 692,949 84%
Total All FCs 9,844,578 9,843,655 6,927,710 70%
This record of spending as well as the growth and decline in total funding over seven funding cycles is illustrated in Figures 2 and 3.
48 This does not include an unknown number of beds for Southwest Regional Medical Center which closed in early
2009.
Hospital Preparedness Program Overview 2002-2010 Page 67
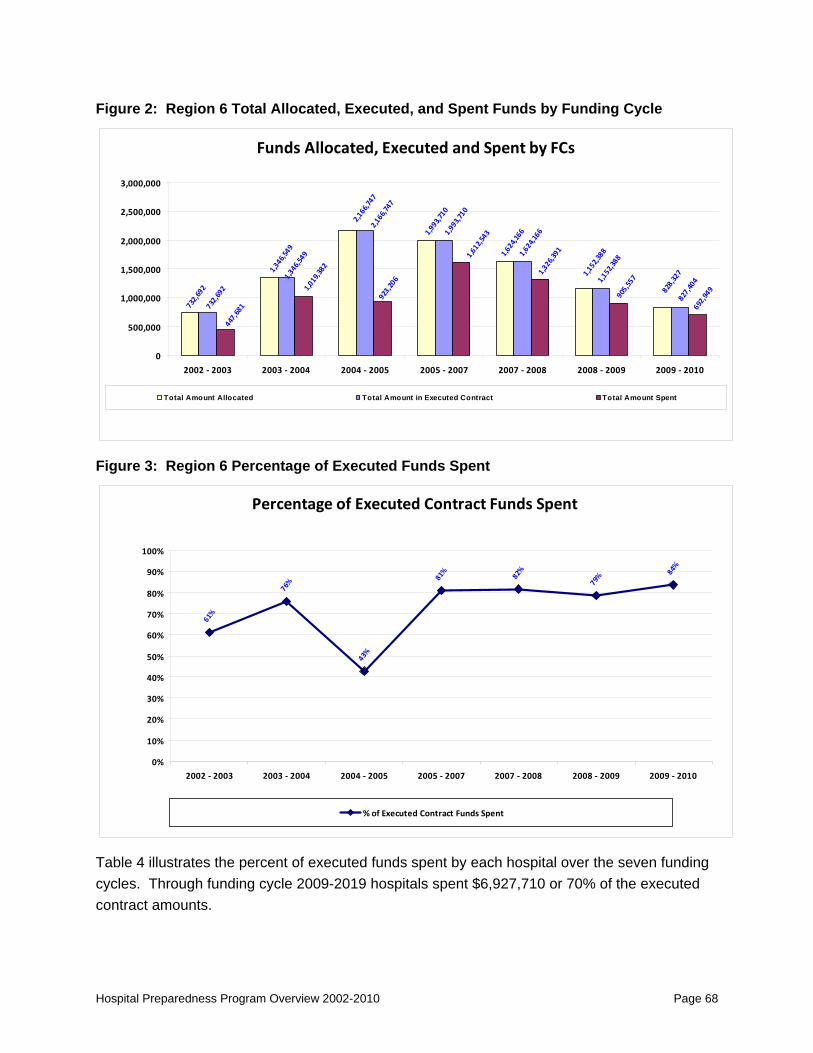
Figure 2: Region 6 Total Allocated, Executed, and Spent Funds by Funding Cycle
Funds Allocated, Executed and Spent by FCs
732,692
1,346,549
2,166,747
1,993,710
1,624,166
1,152,388
828,327
732,692
1,346,549
2,166,747
1,993,710
1,624,166
1,152,388
827,404
447,681
1,019,382
923,206
1,612,543
1,326,391
905,557
692,949
0
500,000
1,000,000
1,500,000
2,000,000
2,500,000
3,000,000
2002 ‐ 2003 2003 ‐ 2004 2004 ‐ 2005 2005 ‐ 2007 2007 ‐ 2008 2008 ‐ 2009 2009 ‐ 2010
Total Amount Allocated Total Amount in Executed Contract Total Amount Spent
Figure 3: Region 6 Percentage of Executed Funds Spent
Percentage of Executed Contract Funds Spent
61%
76%
43%
81%
82%
79%
84%
0%
10%
20%
30%
40%
50%
60%
70%
80%
90%
100%
2002 ‐ 2003 2003 ‐ 2004 2004 ‐ 2005 2005 ‐ 2007 2007 ‐ 2008 2008 ‐ 2009 2009 ‐ 2010
% of Executed Contract Funds Spent
Table 4 illustrates the percent of executed funds spent by each hospital over the seven funding cycles. Through funding cycle 2009-2019 hospitals spent $6,927,710 or 70% of the executed contract amounts.
Hospital Preparedness Program Overview 2002-2010 Page 68

In funding cycle 2009-2010 three hospital systems elected to take one contract for its hospital partners in Region 5. Table 4 notes which hospitals participated by receiving funds and preparedness resources through a hospital with a master contract. The expenditure rate for the hospital receiving the contract reflects the overall expenditure for all participating hospitals.
System partner hospitals that participated in a master contracted are noted as follows: ♦ LMHS = Lee Memorial Health System ♦ NCH = NCH Health Care System ♦ PRMC = Physicians Regional Medical Center (HMA)
Table 4: Region 6 Hospitals’ Percentage of Funds Spent from Executed Contracts
County Hospital Name
Lice
nsed
B
eds
(201
0) 02-03 Executed Contract
Spent
03-04 Executed Contract
Spent
04-05 Executed Contract
Spent
05-07 Executed Contract
Spent
07-08 Executed Contract
Spent
08-09 Executed Contract
Spent
09-10 Executed Contract
Spent
Lee Southwest Regional Medical Center (closed early 2009) - 0% 41%
Hendry Hendry Regional Medical Center* 25 21% 94% 37% 0% 0% 100% 100%DeSoto DeSoto Memorial Hospital 49 99% 69% 25% 97% 71% 100% 100%Highlands Florida Hospital Lake Placid 50 92% 96% 100% 61% 100% 100%Lee Lehigh Regional Medical Center 88 70% 98% 82% 100%Sarasota Englewood Community Hospital 100 100% 71% 0% 0%Collier Physicians Regional Medical Center - Collier Blvd. 100 66% PRMCOkeechobee Raulerson Hospital 100 69% 91% 0% 100% 72% 92% 100%
Collier Physicians Regional Medical Center - Pine Ridge(formerly Cleveland Clinic - Naples) 101 100% 67% 100% 26% 100% 0%
Highlands Highlands Regional Medical Center 126 0% 0% 82% 98% 59% 100%Highlands Florida Hospital Heartland Medical Center 159 21% 70% 0% 94% 24% 66% 100%Sarasota Doctor's Hospital of Sarasota 168 71% 65% 95% 91% 93% 100%Charlotte Charlotte Regional Medical Center 208 0% 91% 0% 0%Charlotte Peace River Regional Medical Center 219 0%Charlotte Fawcett Memorial Hospital 238 98% 97% 91% 39% 0%
Collier NCH Healthcare System - North Naples Hospital(formerly North Collier Hospital) 261 55% 100% NCH
Manatee Lakewood Ranch Medical Center 291 0% 93% 90% 97% 97% 76%
Lee Lee Memorial Health System - Cape Coral (Cape Coral Hospital) 291 94% 100% 86% 96% 100% 73% LMHS
Sarasota Venice Regional Medical Center (formerly Bon Secours Venice) 312 100% 7% 100% 96% 100% 99%
Manatee Manatee Memorial Hospital 319 100% 79% 68% 88% 89% 90% 100%
Lee Gulf Coast Hospital (Gulf Coast Medical Center Lee Memorial Hospital) 349 100% 32% LMHS
Lee Lee Memorial Health System - Healthpark (Healthpark Medical Center) 368 92% 100% LMHS
Manatee Blake Medical Center 383 97% 58% 81% 84% 98%
Lee Lee Memorial Health System (Lee Memorial Hospital) 415 67% 19% 99% 100%
Collier
NCH Healthcare System - Downtown Naples Hospital (formerly Naples Community Hospital) 420 74% 31% 55% 0% 99% 89% 93%
Sarasota Sarasota Memorial Hospital 806 58% 0% 15% 95% 94% 82% 100% More detail regarding the amount of funds allocated, executed, and spent by each hospital is available on request. *Indicates designated critical access hospital.
PROGRAMMATIC FUNDING CATEGORIES Data about funding and participation was gathered in four categories:
♦ Equipment
♦ Training
Hospital Preparedness Program Overview 2002-2010 Page 69

Hospital Preparedness Program Overview 2002-2010 Page 70
♦ Exercises
♦ Other
The “other” category was used to capture the funds spent on the Web-Based Event Management Software Pilot Project and the Telecommunications Service Priority initiative.
Table 5 presents the total amounts spent across seven funding cycles. In funding cycle 2009-2010, training and exercise funds were combined. For purposes of this table they have been separated and equally allocated to each category.
Table 5: Total Funds Spent by Programmatic Category
Hospital Type
Grand Total Equipment
Spent
Grand Total Training
Spent
Grand Total Exercises
Spent
Grand Total Other Spent
Grand Total SPENT
With EDs $4,973,961 $1,044,833 $788,917 $120,000 $6,927,710
Other $0 $0 $0 $0 $0
ALL $4,973,961 $1,044,833 $788,917 $120,000 $6,927,710
CLOSING COMMENTS As the Hospital Preparedness Program moves forward an important goal will be to support ongoing and continuous all hazards preparedness capabilities of hospital partners. The most important work and efforts take place at the local and regional level.
Local and regional hospital preparedness planners can apply their insights into local activities to use information in this report to build connections with local hospital partners to work, plan, and exercise together.
Additional questions to ask when reviewing this information can include:
♦ Are all of the key partners engaged in the program?
♦ What factors may have led to the low expenditure rate in funding cycle 2004-2005 and the increased expenditure rate in 2009-2010?
♦ What factors may have led to the number of hospitals in the most recent funding cycles with 0% expenditure rates?
♦ What can be learned from the two largest hospitals that participated in every funding hospital?
♦ What actions may be necessary to better support hospitals to maximize use of resources?
The shared program goal is to ensure that health care partners are prepared for, able to respond to, and recover from any threat, natural or man-made. The department will continue to work with hospitals in their all-hazards approach to preparedness, response, and recovery.

Hospital Preparedness Program Regional Domestic Security Task Force
Region 7 Florida’s domestic preparedness activities are organized into seven regions. Region 7 is made up of four counties, Palm Beach, Broward, Miami-Dade, and Monroe.
The 2010 U.S. Census population for this region is 5,637,725.49 Sixteen percent of persons in the region are age 65 or older. Twenty-two percent of persons under age 65 have no health insurance and eighteen percent have one or more disabilities. The region currently has 53 hospitals with emergency departments.
While often considered one major metropolis, the large populations and the diversity of the counties and their response partners make each county unique. It is important to look at the counties individually. The attached reports describe the efforts of each county and the county specific partnerships with local hospitals.
The following table is a summary of overall funding and expenditures for this region.
Funding Cycle Total Amount Allocated
Total Amount in Executed Contract
Total Amount Spent
% of Executed Contract Funds
Spent
2002 - 2003 1,550,748 1,550,748 1,084,549 70%
2003 - 2004 4,285,109 4,285,109 2,804,232 65%
2004 - 2005 6,251,082 6,251,082 3,977,946 64%
2005 - 2007 10,155,991 10,155,992 8,851,536 87%
2007 - 2008 6,548,481 6,548,481 5,703,640 87%
2008 - 2009 3,121,005 3,121,005 2,904,791 93%
2009 - 2010 1,686,410 1,686,410 1,594,514 95%
Total All FCs 33,598,826 33,598,826 26,921,209 80%
Counties will continue to work toward enhancing regional partnerships in their all-hazards approach to preparedness, response, and recovery.
See attached reports for Palm Beach, Broward, Miami-Dade and Monroe Counties.
49 County population is from the 2010 US Census - Other demographic statistics are from FDOH Vulnerable Population profiles. http://www.floridashealth.com/prepare/VulnerablePopulations.html.
Hospital Preparedness Program Overview 2002-2010 Page 71
Hospital Preparedness Program Regional Domestic Security Task Force Region 7
Palm Beach County
PROGRAM OVERVIEW This report provides a descriptive analysis of the participation and programmatic focus of the Hospital Preparedness Program (HPP) in Palm Beach County. The information provides an overview of county specific partnerships with local hospitals. Information is intended to provide a picture that can be used to confirm and document what is happening in the county and to assist with planning for future activities.
THE COUNTY Palm Beach County is bordered on the east by 45 miles of Atlantic Ocean coastline, north by Martin County, south by Broward County and west by Hendry County and Lake Okeechobee. It is made up of urban, suburban, and rural environments. Urban and suburban areas are arrayed along the coast, with rural, primarily agricultural sections, in the western part of the county. The coastal barrier communities tend to be more affluent and English speaking. The western areas of the county includes the agricultural Glades area and farms along State Road 7 containing extensive Spanish and Creole speaking populations. Agricultural industries employ seasonal and resident workers. The farm worker population can peak at over 10,000 persons during the harvest season. Historically, these workers have been medically underserved with limited access to healthcare resources.
The 2010 U.S. Census population for this county is 1,320,134.50 It is the 3rd most populous county in the state. Twenty-one percent of the population is age 65 or older. This is considerably higher than the state average of 17%. Persons age 85 or older make up almost 4% of the population. This is also higher than the statewide average of 2.6%.
The population is ethnically diverse. Twenty-one percent of the population is foreign born. Almost 25% speak a language other than English at home. Although Palm Beach is considered a highly educated and wealthy county, with more than 31% of the population having a Bachelor’s degree or higher and the mean income being higher than the national average, 11.5% of the population lives below poverty level.51
50 County population is from the 2010 US Census - Other demographic statistics are from FDOH Vulnerable Population profiles. http://www.floridashealth.com/prepare/VulnerablePopulations.html. 51 Language and Income data from US Census Bureau Fact Sheet http://factfinder.census.gov/home/saff/main.html?_lang=en Retrieved 7-21-11.
Hospital Preparedness Program Overview 2002-2010 Page 72

In addition to the diversity of the economy and population, Palm Beach County is subject to unique threats which could present hospitals with a wide range of challenges for all-hazard preparedness.
• According to the State of Florida Enhanced Hazard Mitigation Plan, August 2010,52 Palm Beach County is rated at high risk for hurricanes.
• Although Palm Beach County and the Treasure Coast have limited vulnerability to storm surge, even a minimal hurricane would put the barrier islands and the immediate coastline under water. 53
• The Herbert Hoover Dike, a 140 mile perimeter around Lake Okeechobee (720 sq miles), has been classified as a high-risk dam (1 of 6 high-risk dams of a total of 202 dams in the United States). A threat could lead to potential evacuation of up to 40,000 persons from South Bay, Pahokee, and Belle Glade, including 3,000 inmates from a correctional facility, staff and patients from Lakeside Hospital (70 beds), and other healthcare providers (clinics and long term care facilities) in the area.
• The Port of Palm Beach is the 4th largest container port in Florida and the 18th busiest in the U.S., in addition to serving as a terminal for a cruise ship line.
• Palm Beach County would serve as a host county for evacuees in case of a St. Lucie Nuclear Power Plant radiological emergency, or weather emergency in other regions of the state.
• The county has an international airport and has a large influx of visitors, who may not have an emergency plan in place. In 2009, more than 3.6 million visitors came to Palm Beach County.54 To accommodate these visitors there are a large number of hotels, restaurants, and a convention center.
• The county has a large number of temporary residents during the winter and throughout the year, attending the universities and colleges.
• There are 146 mobile home parks in the county. During the winter months, more than 50% are occupied by senior citizens.
• The county is well known for tourism and agriculture, but in recent years there has been significant development in manufacturing and technology businesses.55 Two major biotechnology groups conduct research in the northern part of the county.
52 Enhanced State Hazard Mitigation Plan 2010 http://www.floridadisaster.org/mitigation/State/Index.htm . Retrieved 5-18-11 53 http://www.palmbeachpost.com/storm/content/storm/about/history/qa.html 54 Report on Palm Beach County Tourism, p.4. http://www.pbcgov.com/touristdevelopment/pdf/FYTD08_09-5_Year_Average.pdf Accessed 3/14/11. 55 p. 4, “In Motion – Comprehensive Economic Development Strategy 2007 – 2012”, Treasure Coast Regional Planning Council http://www.tcrpc.org/departments/CEDS%202007-2012.pdf
Hospital Preparedness Program Overview 2002-2010 Page 73

The county currently has 13 hospitals with emergency departments (EDs), with a total 3,760 licensed beds. Information throughout this report on licensed beds is based on the Florida Agency for Health Care Administration, January 2010, Florida Hospital Bed Need Projections and Service Utilization by District report.56
Lakeside Medical Center in Belle Glade is designated as a rural hospital. Palm Beach County is also fortunate to have two Level II Trauma Centers. Both are also designated as Pediatric Trauma Hospitals. 57 There are four additional hospitals without EDs and other healthcare facilities such as a Veterans Administration Medical Center. The additional hospitals are primarily specialty hospitals including A.G. Holley Hospital that cares for difficult-to-treat tuberculosis patients for the entire state and long-term acute care, rehabilitation, and behavioral health facilities. All of the hospitals with EDs are Joint Commission accredited which requires an emergency operations plan and all hazards emergency response capabilities. Two of the hospitals without EDs are also Joint Commission accredited.
Palm Beach County has a model disaster health care coalition, the Healthcare Emergency Response Coalition of Palm Beach County (HERC).58 The HERC is focused on hospital preparedness, response, and recovery within the context of a continuum of care healthcare system. The coalition has a diverse membership of emergency response partners including the county health department, county emergency management, law enforcement, fire-rescue, blood banks, kidney dialysis coalition, mental health and crisis intervention support, school health, and others. The coalition has developed mutual aid agreements and common response protocols and purchased common communication devices and disaster equipment. It continues to conduct shared disaster training and exercise opportunities. The coalition supports for-profit and not-for profit corporate hospitals, community rural and urban facilities, and a federal level hospital. HERC has been recognized as a model program by the Centers for Disease Control and Prevention and the National Association of County and City Health Officials. The coalition has also published a resource book entitled “Establishing a Healthcare Emergency Response Coalition.”
Participating Hospitals
For the purpose of this report, participation is defined as a hospital, with an ED, that has been offered, accepted, and executed a contract with the Florida Department of Health. Information is presented by funding cycle (FC). Funding cycles correspond with state fiscal years and one funding cycle encompassed two fiscal years (2005 – 2007).
56 While the number of hospitals beds did not vary significantly over the seven funding cycles, 2002-2003 to 2009-2010 can be considered estimates. 57 Agency for Health Care Administration Facility Search, http://www.floridahealthfinder.gov/facilitylocator/FacilitySearch.aspx . Retrieved 5-17-11 58 http://www.pbcms.org/herc
Hospital Preparedness Program Overview 2002-2010 Page 74
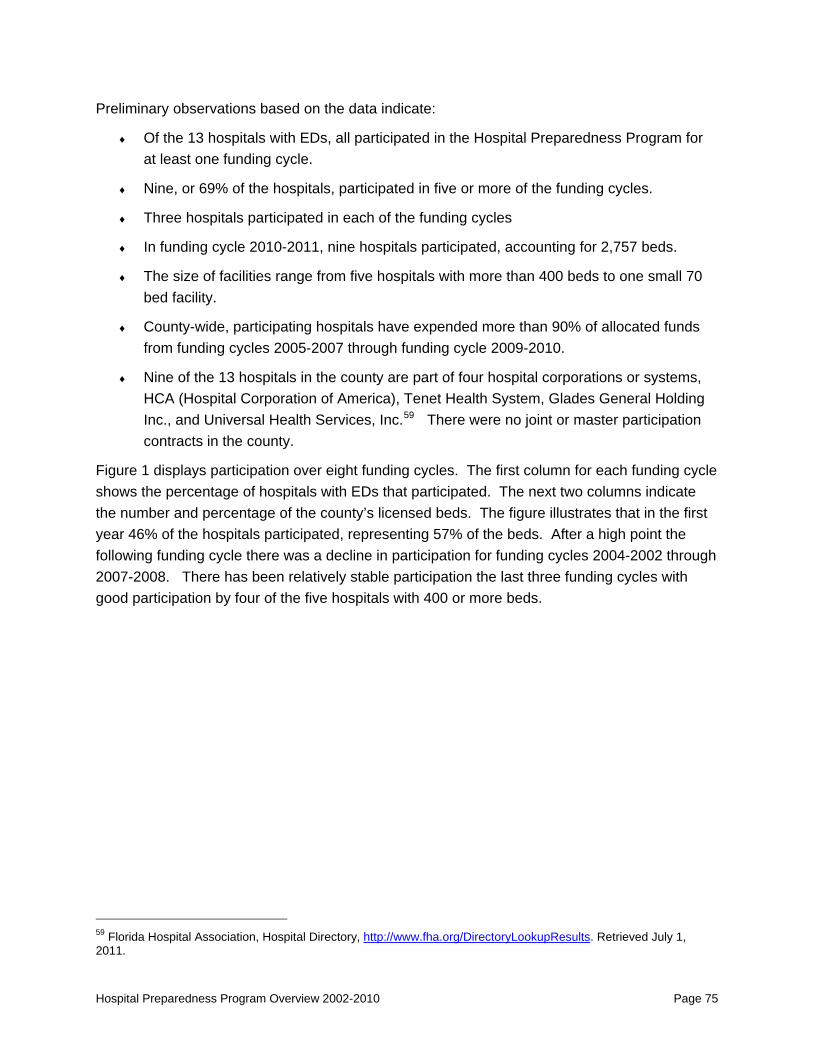
Preliminary observations based on the data indicate:
♦ Of the 13 hospitals with EDs, all participated in the Hospital Preparedness Program for at least one funding cycle.
♦ Nine, or 69% of the hospitals, participated in five or more of the funding cycles.
♦ Three hospitals participated in each of the funding cycles
♦ In funding cycle 2010-2011, nine hospitals participated, accounting for 2,757 beds.
♦ The size of facilities range from five hospitals with more than 400 beds to one small 70 bed facility.
♦ County-wide, participating hospitals have expended more than 90% of allocated funds from funding cycles 2005-2007 through funding cycle 2009-2010.
♦ Nine of the 13 hospitals in the county are part of four hospital corporations or systems, HCA (Hospital Corporation of America), Tenet Health System, Glades General Holding Inc., and Universal Health Services, Inc.59 There were no joint or master participation contracts in the county.
Figure 1 displays participation over eight funding cycles. The first column for each funding cycle shows the percentage of hospitals with EDs that participated. The next two columns indicate the number and percentage of the county’s licensed beds. The figure illustrates that in the first year 46% of the hospitals participated, representing 57% of the beds. After a high point the following funding cycle there was a decline in participation for funding cycles 2004-2002 through 2007-2008. There has been relatively stable participation the last three funding cycles with good participation by four of the five hospitals with 400 or more beds.
59 Florida Hospital Association, Hospital Directory, http://www.fha.org/DirectoryLookupResults. Retrieved July 1, 2011.
Hospital Preparedness Program Overview 2002-2010 Page 75
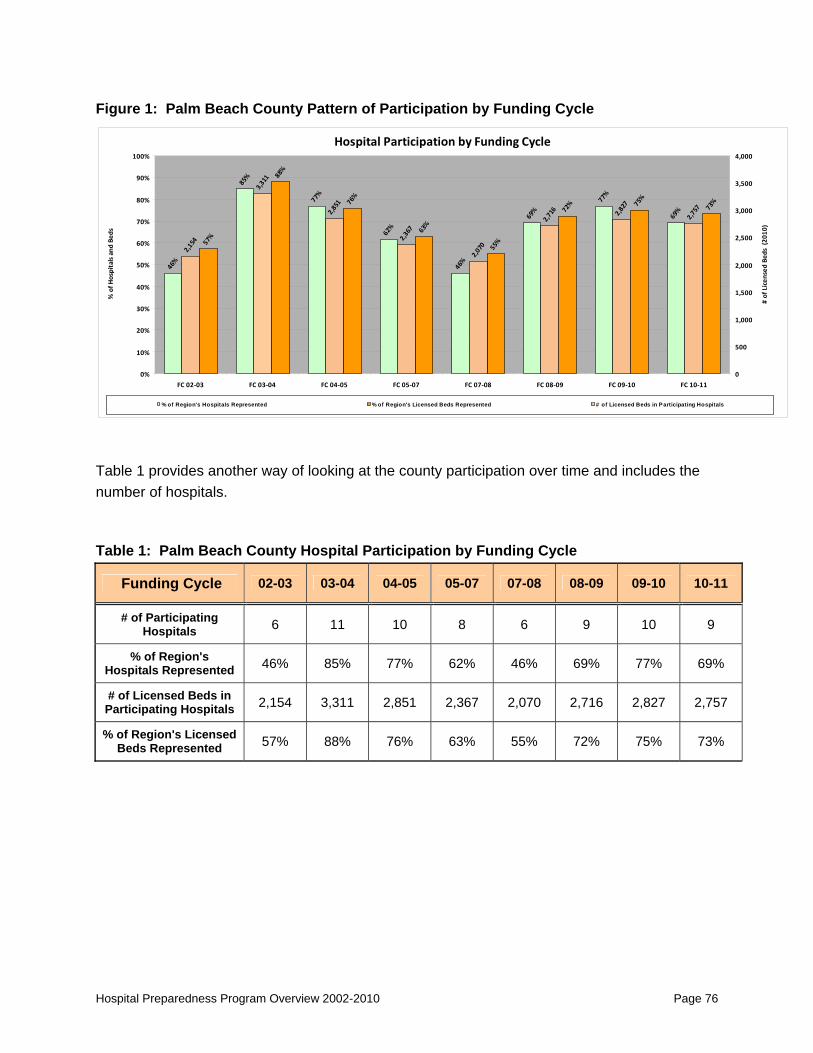
Figure 1: Palm Beach County Pattern of Participation by Funding Cycle
Hospital Participation by Funding Cycle
46%
85%
77%
62%
46%
69%
77%
69%
57%
88%
76%
63%
55%
72% 75%
73%
2,154
3,311
2,851
2,367
2,070
2,716 2,827
2,757
0%
10%
20%
30%
40%
50%
60%
70%
80%
90%
100%
FC 02‐03 FC 03‐04 FC 04‐05 FC 05‐07 FC 07‐08 FC 08‐09 FC 09‐10 FC 10‐11
% of H
ospitals and
Bed
s
0
500
1,000
1,500
2,000
2,500
3,000
3,500
4,000
# of Licen
sed Be
ds (20
10)
% of Region's Hospitals Represented % of Region's Licensed Beds Represented # of Licensed Beds in Participating Hospitals
Table 1 provides another way of looking at the county participation over time and includes the number of hospitals.
Table 1: Palm Beach County Hospital Participation by Funding Cycle
Funding Cycle 02-03 03-04 04-05 05-07 07-08 08-09 09-10 10-11
# of Participating Hospitals 6 11 10 8 6 9 10 9
% of Region's Hospitals Represented 46% 85% 77% 62% 46% 69% 77% 69%
# of Licensed Beds in Participating Hospitals 2,154 3,311 2,851 2,367 2,070 2,716 2,827 2,757
% of Region's Licensed Beds Represented 57% 88% 76% 63% 55% 72% 75% 73%
Hospital Preparedness Program Overview 2002-2010 Page 76

Table 2 provides a side by side comparison of the hospitals with EDs participating in the HPP.
Table 2: Palm Beach County Hospital Participation 07-08 to 10-11 Funding Cycles
County Hospital Name
Lice
nsed
Bed
s (2
010)
# FCs Participated in 1st Four FCs
07-08 Participated
08-09 Participated
09-10 Participated
10-11 Participated
Palm Beach Lakeside Medical Center (formerly Glades General Hospital) 70 3 No Yes Yes No
Palm Beach Wellington Regional Medical Center 158 2 Yes Yes Yes YesPalm Beach Jupiter Medical Center 163 4 Yes Yes Yes YesPalm Beach Palms West Hospital 175 2 No Yes Yes YesPalm Beach West Boca Medical Center 195 3 No No Yes YesPalm Beach Palm Beach Gardens Medical Center 199 1 No No No NoPalm Beach Columbia Hospital 250 2 No No Yes YesPalm Beach Good Samaritan Medical Center 333 2 Yes Yes No No
Palm Beach Boca Raton Community Hospital (Boca Raton Regional Hospital) 400 4 No No Yes Yes
Palm Beach Bethesda Hospital 401 1 No Yes No NoPalm Beach JFK Medical Center 460 3 Yes Yes Yes YesPalm Beach St. Mary's Medical Center 463 4 Yes Yes Yes YesPalm Beach Delray Medical Center 493 4 Yes Yes Yes Yes
13 3,760 6 9 10 9
Information regarding participation is important but it is only one part of the picture. It is necessary to look at the levels of funding and expenditures. The next part of the data provides additional detail related to funding.
FUNDING When reviewing the level of funding and the distribution of funding, it is important to keep in mind that a number of factors can impact participation. Palm Beach County hospitals with EDs received a total allocation and executed contracts of $7,185,163 through funding cycle 2009-2010. The five largest hospitals, with 2,217 beds, accounted for $5,551,160, or 77.3% of the allocated funds. The remaining eight hospitals, with 1,543 beds received $1,634,003 or almost 22.7% of the allocated funds. Of the total funding in executed contracts $5,978,116 was expended.
Table 3 displays the total funds allocated, executed in contracts, and spent for each funding cycle. Individual levels of expenditures can be influenced by the maturation of the level of preparedness of the hospital partners and other factors. Beginning with funding cycle 2005-2007, Palm Beach County has had an excellent record of expenditure. Further individual review may be desired to determine specific opportunities for improvement and best practices.
Hospital Preparedness Program Overview 2002-2010 Page 77
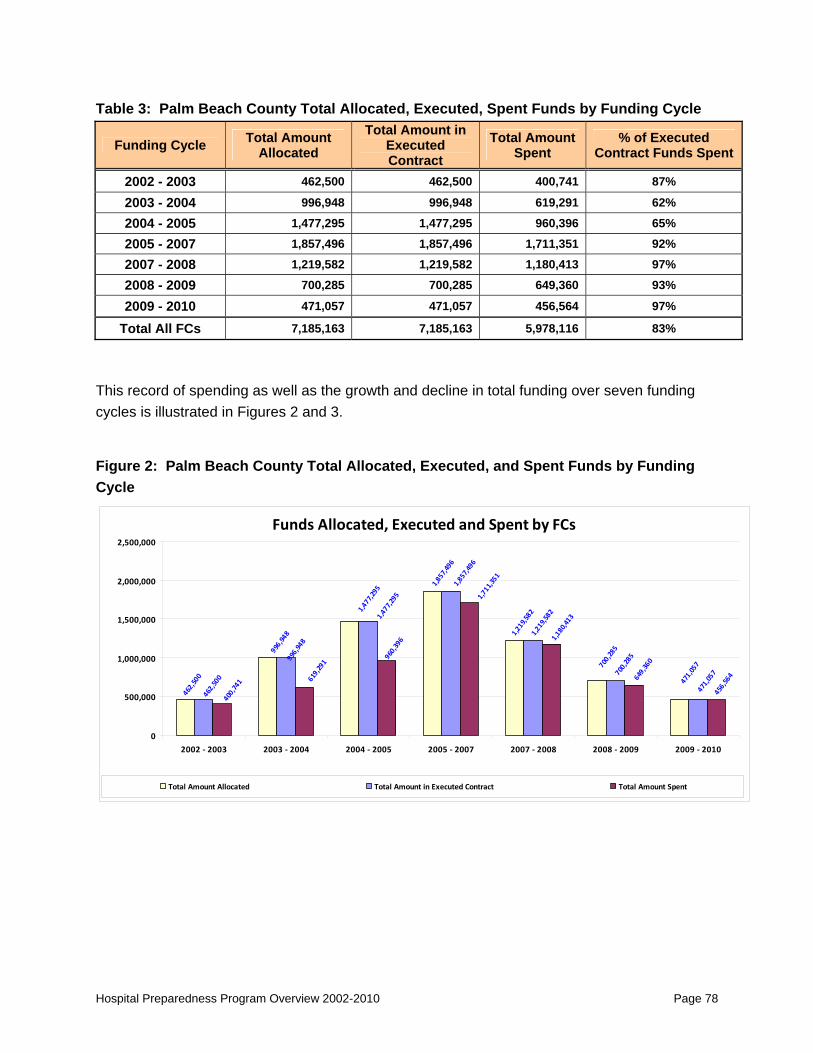
Table 3: Palm Beach County Total Allocated, Executed, Spent Funds by Funding Cycle
Funding Cycle Total Amount Allocated
Total Amount in Executed Contract
Total Amount Spent
% of Executed Contract Funds Spent
2002 - 2003 462,500 462,500 400,741 87%
2003 - 2004 996,948 996,948 619,291 62%
2004 - 2005 1,477,295 1,477,295 960,396 65%
2005 - 2007 1,857,496 1,857,496 1,711,351 92%
2007 - 2008 1,219,582 1,219,582 1,180,413 97%
2008 - 2009 700,285 700,285 649,360 93%
2009 - 2010 471,057 471,057 456,564 97%
Total All FCs 7,185,163 7,185,163 5,978,116 83%
This record of spending as well as the growth and decline in total funding over seven funding cycles is illustrated in Figures 2 and 3.
Figure 2: Palm Beach County Total Allocated, Executed, and Spent Funds by Funding Cycle
Funds Allocated, Executed and Spent by FCs
462,500
996,948
1,477,295 1,8
57,496
1,219,582
700,285
471,057
462,500
996,948
1,477,295
1,857,496
1,219,582
700,285
471,057
400,741 61
9,291
960,396
1,711,351
1,180,413
649,360
456,564
0
500,000
1,000,000
1,500,000
2,000,000
2,500,000
2002 ‐ 2003 2003 ‐ 2004 2004 ‐ 2005 2005 ‐ 2007 2007 ‐ 2008 2008 ‐ 2009 2009 ‐ 2010
Total Amount Allocated Total Amount in Executed Contract Total Amount Spent
Hospital Preparedness Program Overview 2002-2010 Page 78
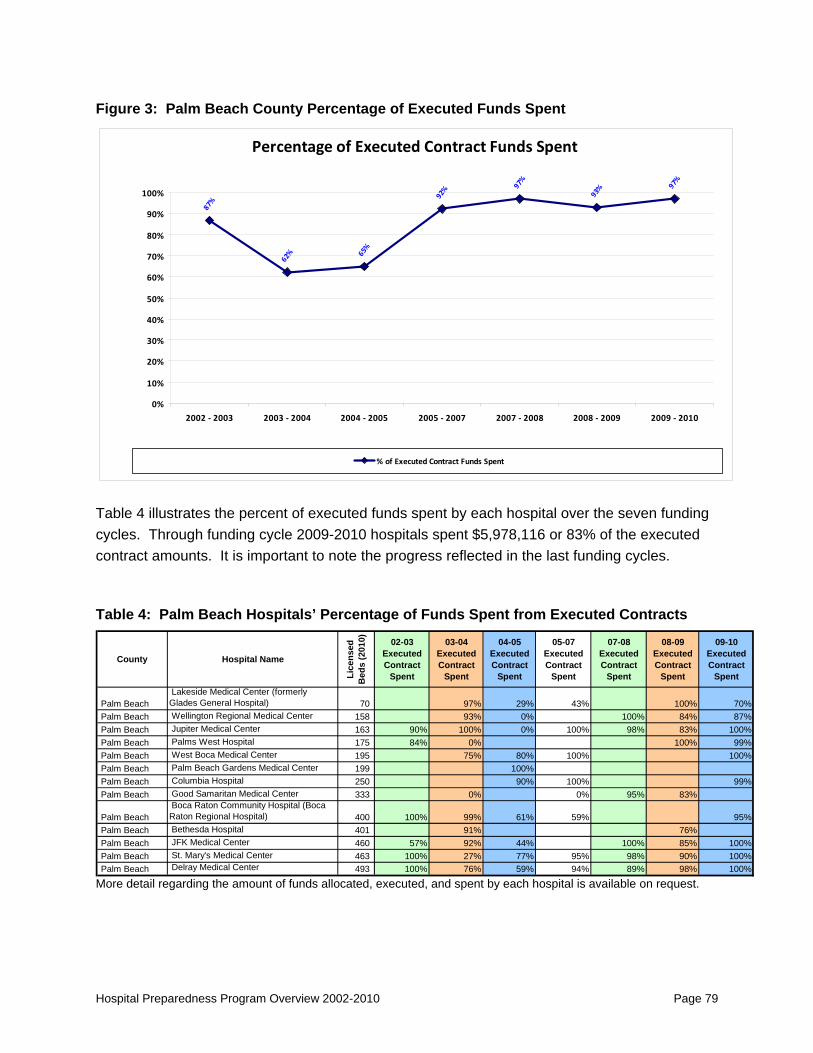
Figure 3: Palm Beach County Percentage of Executed Funds Spent
Percentage of Executed Contract Funds Spent
87%
62% 65%
92% 97
%
93% 97
%
0%
10%
20%
30%
40%
50%
60%
70%
80%
90%
100%
2002 ‐ 2003 2003 ‐ 2004 2004 ‐ 2005 2005 ‐ 2007 2007 ‐ 2008 2008 ‐ 2009 2009 ‐ 2010
% of Executed Contract Funds Spent
Table 4 illustrates the percent of executed funds spent by each hospital over the seven funding cycles. Through funding cycle 2009-2010 hospitals spent $5,978,116 or 83% of the executed contract amounts. It is important to note the progress reflected in the last funding cycles.
Table 4: Palm Beach Hospitals’ Percentage of Funds Spent from Executed Contracts
County Hospital Name
Lice
nsed
B
eds
(201
0) 02-03 Executed Contract
Spent
03-04 Executed Contract
Spent
04-05 Executed Contract
Spent
05-07 Executed Contract
Spent
07-08 Executed Contract
Spent
08-09 Executed Contract
Spent
09-10 Executed Contract
Spent
Palm Beach Lakeside Medical Center (formerly Glades General Hospital) 70 97% 29% 43% 100% 70%
Palm Beach Wellington Regional Medical Center 158 93% 0% 100% 84% 87%Palm Beach Jupiter Medical Center 163 90% 100% 0% 100% 98% 83% 100%Palm Beach Palms West Hospital 175 84% 0% 100% 99%Palm Beach West Boca Medical Center 195 75% 80% 100% 100%Palm Beach Palm Beach Gardens Medical Center 199 100%Palm Beach Columbia Hospital 250 90% 100% 99%Palm Beach Good Samaritan Medical Center 333 0% 0% 95% 83%
Palm Beach Boca Raton Community Hospital (Boca Raton Regional Hospital) 400 100% 99% 61% 59% 95%
Palm Beach Bethesda Hospital 401 91% 76%Palm Beach JFK Medical Center 460 57% 92% 44% 100% 85% 100%Palm Beach St. Mary's Medical Center 463 100% 27% 77% 95% 98% 90% 100%Palm Beach Delray Medical Center 493 100% 76% 59% 94% 89% 98% 100%
More detail regarding the amount of funds allocated, executed, and spent by each hospital is available on request.
Hospital Preparedness Program Overview 2002-2010 Page 79
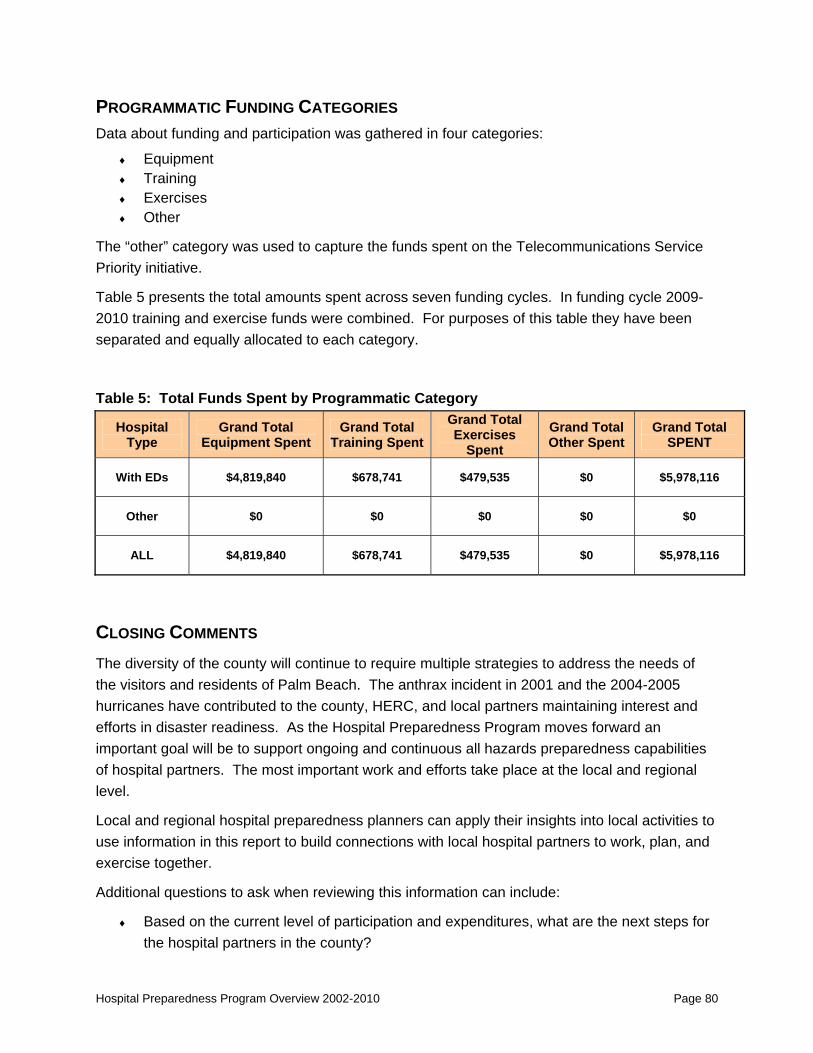
PROGRAMMATIC FUNDING CATEGORIES Data about funding and participation was gathered in four categories:
♦ Equipment ♦ Training ♦ Exercises ♦ Other
The “other” category was used to capture the funds spent on the Telecommunications Service Priority initiative.
Table 5 presents the total amounts spent across seven funding cycles. In funding cycle 2009-2010 training and exercise funds were combined. For purposes of this table they have been separated and equally allocated to each category.
Table 5: Total Funds Spent by Programmatic Category
Hospital Type
Grand Total Equipment Spent
Grand Total Training Spent
Grand Total Exercises
Spent Grand Total Other Spent
Grand Total SPENT
With EDs $4,819,840 $678,741 $479,535 $0 $5,978,116
Other $0 $0 $0 $0 $0
ALL $4,819,840 $678,741 $479,535 $0 $5,978,116
CLOSING COMMENTS The diversity of the county will continue to require multiple strategies to address the needs of the visitors and residents of Palm Beach. The anthrax incident in 2001 and the 2004-2005 hurricanes have contributed to the county, HERC, and local partners maintaining interest and efforts in disaster readiness. As the Hospital Preparedness Program moves forward an important goal will be to support ongoing and continuous all hazards preparedness capabilities of hospital partners. The most important work and efforts take place at the local and regional level.
Local and regional hospital preparedness planners can apply their insights into local activities to use information in this report to build connections with local hospital partners to work, plan, and exercise together.
Additional questions to ask when reviewing this information can include:
♦ Based on the current level of participation and expenditures, what are the next steps for the hospital partners in the county?
Hospital Preparedness Program Overview 2002-2010 Page 80

Hospital Preparedness Program Overview 2002-2010 Page 81
♦ How can the critical level of response and commitment be sustained especially in the face of reduced allocations?
♦ What can be learned from the recent history of high expenditure rates?
♦ Are there gaps to be addressed during the next funding cycle?
♦ What actions may be necessary to better support hospitals to maximize use of resources?
The shared program goal is to ensure that healthcare partners are prepared for, able to respond to, and recover from any threat, natural or man-made. The department will continue to work with hospitals in their all-hazards approach to preparedness, response, and recovery.

Hospital Preparedness Program Regional Domestic Security Task Force Region 7
Broward County
PROGRAM OVERVIEW This report provides a descriptive analysis of the participation and programmatic focus of the Hospital Preparedness Program (HPP) in Broward County. The information provides an overview of county specific partnerships with local hospitals. Information is intended to provide a picture that can be used to confirm and document what is happening in the county and to assist with planning for future activities.
BROWARD COUNTY Broward County stretches west, from the 24 miles of Atlantic beaches, 45 miles to the center of the Everglades. The coastline is made up of high density urban and suburban environments. Although comprised of 1,197 square miles of land, 787 square miles of Broward County lie within the Everglades Conservation Area. The Seminole Tribe of Florida is headquartered in the county and the Miccosukee Indian reservation has land in western Broward County and in Miami-Dade County.
The 2010 U.S. Census population for this county is 1,748,066.60 It is the second most populous county in the state. Fourteen percent of the population is age 65 or older. While this is considerably lower than the state average of 17%, persons age 85 or older make up almost 2.7% of the population. This is just slightly higher than the statewide average of 2.6%. Seventeen percent of persons under 65 years old have no health insurance. Seventeen percent of the population has one or more disabilities.
The population is ethnically diverse. Greater than 29% of the population is foreign born. Almost Thirty-five percent speak a language other than English at home. Twenty-three percent of the county population is Hispanic or Latino. Although Broward County is considered an educated and wealthy county, with more than 29% of the population having a Bachelor’s degree or higher and the per capita income being higher than the national average, 11.7% of the population lives below poverty level.61
60 County population is from the 2010 US Census - Other demographic statistics are from FDOH Vulnerable Population profiles. http://www.floridashealth.com/prepare/VulnerablePopulations.html. 61 Language and Income data from US Census Bureau Fact Sheet http://factfinder.census.gov/home/saff/main.html?_lang=en Retrieved 7-22-11.
Hospital Preparedness Program Overview 2002-2010 Page 82

Broward County faces multiple threats. According to the State of Florida Enhanced Hazard Mitigation Plan, August 2010,62 Broward County is rated at high risk for hurricanes, flooding, severe storms, and tornados. A 2010 report by the Weather Channel lists Miami/Ft Lauderdale as the number one top hurricane vulnerable and overdue cities in the nation.63 The county is in the 50 miles Emergency Planning Zone for Turkey Point Nuclear Power facility in Miami-Dade County. There are 45 facilities in the county that use or produce toxic chemicals above thresholds that can be a threat to the population. There are three underground petroleum pipelines. Hazardous materials are transported through the county by two major rail lines, I-95, the Florida Turnpike, and marine pathways. In addition to the 17 cruise lines that currently embark from Port Everglades, the port is one of the United States' top container ports. More than 5,300 ships call at the port annually and waterborne commerce exceeds 23 million tons.64 The port has 264 storage tanks of petroleum with a storage capacity of 10 million barrels.
In 2009, 10.6 million visitors came to Broward County; 2,270,000 were from outside the US. There were 3.2 million cruise ship embarkations and nearly 22.7 million passenger arrivals at the international airport.65 To accommodate these visitors there are a large number of hotels, restaurants and a convention center. The county has a large number of temporary residents during the winter and an accredited private university, college, and community college that bring in temporary residents throughout the year. The large number of visitors may not have an emergency plan in place, may not have access to health care services, may not know where to go for assistance, and may not use English as their primary language.
The diversity of the economy and population, high risk factors, and large number of high-rises along the coastline, present hospitals in the county with a wide range of challenges for all-hazard preparedness.
The county currently has 16 hospitals with emergency departments (EDs), with a total 5,510 licensed beds. An additional hospital closed in 2008. Information throughout this report on licensed beds is based on the Florida Agency for Health Care Administration, January 2010, Florida Hospital Bed Need Projections and Service Utilization by District report.66
62 Enhanced State Hazard Mitigation Plan 2010 http://www.floridadisaster.org/mitigation/State/Index.htm . Retrieved 5-18-11 63 The weather channel. Top 5 Hurricane Vulnerable & Overdue Cities. Updated September 24, 2010. http://www.weather.com/outlook/weather-news/news/articles/top5-most-vulnerable-overdue-hurricane-cities_2010-07-14?page=6 64 About Port Everglades. www.porteverglades.org Retrieved 7-22-11. 65 Greater Fort Lauderdale Convention and Visitors Bureau http://www.sunny.org/articles/index.cfm?action=view&articleID=942&menuID=110. Retrieved 7-22-11. 66 While the number of hospitals beds did not vary significantly over the seven funding cycles, 2002-2003 to 2009-2010 can be considered estimates.
Hospital Preparedness Program Overview 2002-2010 Page 83
Broward County is fortunate to have one Level II Trauma Center and two Level I Trauma Centers. 67 There are eight additional hospitals without EDs. The additional hospitals are primarily specialty hospitals providing such services as rehabilitation behavioral health. All of the hospitals with EDs are Joint Commission accredited which requires an emergency operations plan and all hazards emergency response capabilities. Six of the hospitals without EDs are also Joint Commission accredited. The county also has an active disaster health care coalition, Broward County Healthcare Coalition (BCHC)68.
Participating Hospitals
For the purpose of this report, participation is defined as a hospital, with an ED, that has been offered, accepted, and executed a contract with the Florida Department of Health. Information is presented by funding cycle (FC). Funding cycles correspond with state fiscal years and one funding cycle encompassed two fiscal years (2005 – 2007).
Preliminary observations based on the data indicate:
♦ Three hospitals including the two largest hospitals in the county participated in each of the funding cycles.
♦ In funding cycle 2010-2011, all hospitals with EDs participated in the program.
♦ Five hospitals have more than 400 beds with two of the hospitals having more than 700 beds.
♦ All funds in the county were allocated to hospitals with Emergency Departments.
♦ County-wide, participating hospitals expended 96% of allocated funds during funding cycles 2008-2009 and 2009-2010.
♦ Fourteen of the current 16 hospitals in the county are part of four hospital corporations or systems, North Broward Hospital District, South Broward Hospital District, Tenet, and HCA (Hospital Corporation of America)69 There were no joint or master participation contracts in the county.
Figure 1 displays participation over eight funding cycles. The first column for each funding cycle shows the percentage of hospitals with EDs that participated. The next two columns indicate the number and percentage of the county’s licensed beds. The figure illustrates that in the first year 35% of the hospitals participated, representing 53% of the beds. Participation reached a
67 Agency for Health Care Administration Facility Search, http://www.floridahealthfinder.gov/facilitylocator/FacilitySearch.aspx . Retrieved 5-17-11 68 http://browardchd.org/BCHC.aspx 69 Florida Hospital Association, Hospital Directory, http://www.fha.org/DirectoryLookupResults. Retrieved July 1, 2011.
Hospital Preparedness Program Overview 2002-2010 Page 84

high point in funding cycle 2004-2005. Participation dropped slightly but remained relatively stable through 2009-2010. For 2010-2011 all hospitals in the county with EDs participated.
Figure 1: Broward County Pattern of Participation by Funding Cycle
Hospital Participation by Funding Cycle
35%
76%
88%
76%
76% 81
%
75%
100%
53%
84%
92%
88%
84%
83%
70%
100%
2,928
4,613
5,051
4,860
4,606
4,569
3,862
5,510
0%
10%
20%
30%
40%
50%
60%
70%
80%
90%
100%
FC 02‐03 FC 03‐04 FC 04‐05 FC 05‐07 FC 07‐08 FC 08‐09 FC 09‐10 FC 10‐11
% of H
ospitals and
Bed
s
0
1,000
2,000
3,000
4,000
5,000
6,000
# of Licen
sed Be
ds (2
010)
% of Region's Hospitals Represented % of Region's Licensed Beds Represented # of Licensed Beds in Participating Hospitals
Table 1 provides another way of looking at the county participation over time and includes the number of hospitals.
Table 1: Broward County Hospital Participation by Funding Cycle
Funding Cycle 02-03 03-04 04-05 05-07 07-08 08-09 09-10 10-11
# of Participating Hospitals 6 13 15 13 13 13 12 16
% of Region's Hospitals Represented 35% 76% 88% 76% 76% 81% 75% 100%
# of Licensed Beds in Participating Hospitals 2,928 4,613 5,051 4,860 4,606 4,569 3,862 5,510
% of Region's Licensed Beds Represented 53% 84% 92% 88% 84% 83% 70% 100%
Note: The number of participating hospitals in Figure 1 and Table 1 are based on the 17 hospitals with EDs in the region through funding cycle 2007-2008. The percentage of hospitals represented for funding cycles 2008-2009 through 2010-2011 is based on 16 hospitals in the region with EDs. Whereas participating hospital figures were adjusted based on hospital closures all bed figures are based on AHCA’s 2010 bed count.
Hospital Preparedness Program Overview 2002-2010 Page 85

Table 2 provides a side by side comparison of the hospitals with EDs participating in the HPP.
Table 2: Broward County Hospital Participation 07-08 to 10-11 Funding Cycles
County Hospital Name
Lice
nsed
Bed
s (2
010)
# FCs Participated in 1st Four FCs
07-08 Participated
08-09 Participated
09-10 Participated
10-11 Participated
Broward North Ridge Medical Center (closed 5-08) - 1 No Closed Closed ClosedBroward Cleveland Clinic Hospital 155 2 No Yes Yes YesBroward Memorial Hospital Miramar 178 2 No No Yes YesBroward Coral Springs Medical Center 200 3 Yes Yes Yes YesBroward Imperial Point Medical Center 204 3 Yes Yes Yes YesBroward Northwest Medical Center 215 2 Yes Yes Yes YesBroward Westside Regional Medical Center 224 2 Yes Yes Yes YesBroward Plantation General Hospital 264 3 Yes Yes Yes Yes
Broward Memorial Regional Hospital South (previously Hollywood Medical Center) 280 1 Yes Yes Yes Yes
Broward Memorial Hospital Pembroke 301 3 Yes Yes No YesBroward Memorial Hospital West 304 4 Yes No Yes YesBroward University Hospital and Medical Center 317 3 Yes Yes No YesBroward North Broward Medical Center 409 4 Yes Yes Yes Yes
Broward
North Shore Medical Center - FMC Campus (previously Florida Medical Center until 6/1/09) 459 2 Yes No No Yes
Broward Holy Cross Hospital 571 4 No Yes No YesBroward Memorial Regional Hospital 713 4 Yes Yes Yes YesBroward Broward General Medical Center 716 4 Yes Yes Yes Yes
17 5,510 13 13 12 16
Information regarding participation is important but it is only one part of the picture. It is necessary to look at the levels of funding and expenditures. The next part of the data provides additional detail related to funding.
FUNDING When reviewing the level of funding and the distribution of funding, it is important to keep in mind that a number of factors can impact participation. Broward County hospitals with EDs received a total allocation and executed contracts of $15,238,780 through funding cycle 2009-2010. The five largest hospitals, with 2,868 beds, accounted for $8,907,359, or 58.5% of the allocated funds. The remaining twelve hospitals, with 2,642 beds70 received $6,331,421 41.5% of the allocated funds. Of the total funding in executed contracts $12,595,058 was expended.
Table 3 displays the total funds allocated, executed in contracts, and spent for each funding cycle. Individual levels of expenditures can be influenced by the maturation of the level of preparedness of the hospital partners and other factors. Broward County had an excellent
70 This does not include an unknown number of beds for North Ridge Medical Center which closed in early 2008.
Hospital Preparedness Program Overview 2002-2010 Page 86

record of expenditure during the most recent funding cycles. Further individual review may be desired to determine specific opportunities for improvement and best practices.
Table 3: Broward County Total Allocated, Executed, Spent Funds by Funding Cycle
Funding Cycle Total Amount Allocated
Total Amount in Executed Contract
Total Amount Spent
% of Executed Contract Funds Spent
2002 - 2003 462,500 462,500 343,468 74%
2003 - 2004 1,525,196 1,525,196 986,071 65%
2004 - 2005 2,077,153 2,077,153 1,555,588 75%
2005 - 2007 5,122,394 5,122,394 4,243,545 83%
2007 - 2008 3,509,427 3,509,427 3,024,535 86%
2008 - 2009 1,897,757 1,897,757 1,825,037 96%
2009 - 2010 644,353 644,353 616,813 96%
Total All FCs 15,238,780 15,238,780 12,595,058 83%
This record of spending as well as the growth and decline in total funding over seven funding cycles is illustrated in Figures 2 and 3.
Figure 2: Broward County Total Allocated, Executed, and Spent Funds by Funding Cycle
Funds Allocated, Executed and Spent by FCs
462,500
1,525,196 2,077,153
5,122,394
3,509,427
1,897,757
644,353
462,500
1,525,196 2,077,153
5,122,394
3,509,427
1,897,757
644,353
343,468 98
6,071
1,555,588
4,243,545
3,024,535
1,825,037
616,813
0
1,000,000
2,000,000
3,000,000
4,000,000
5,000,000
6,000,000
7,000,000
2002 ‐ 2003 2003 ‐ 2004 2004 ‐ 2005 2005 ‐ 2007 2007 ‐ 2008 2008 ‐ 2009 2009 ‐ 2010
Total Amount Allocated Total Amount in Executed Contract Total Amount Spent
Hospital Preparedness Program Overview 2002-2010 Page 87
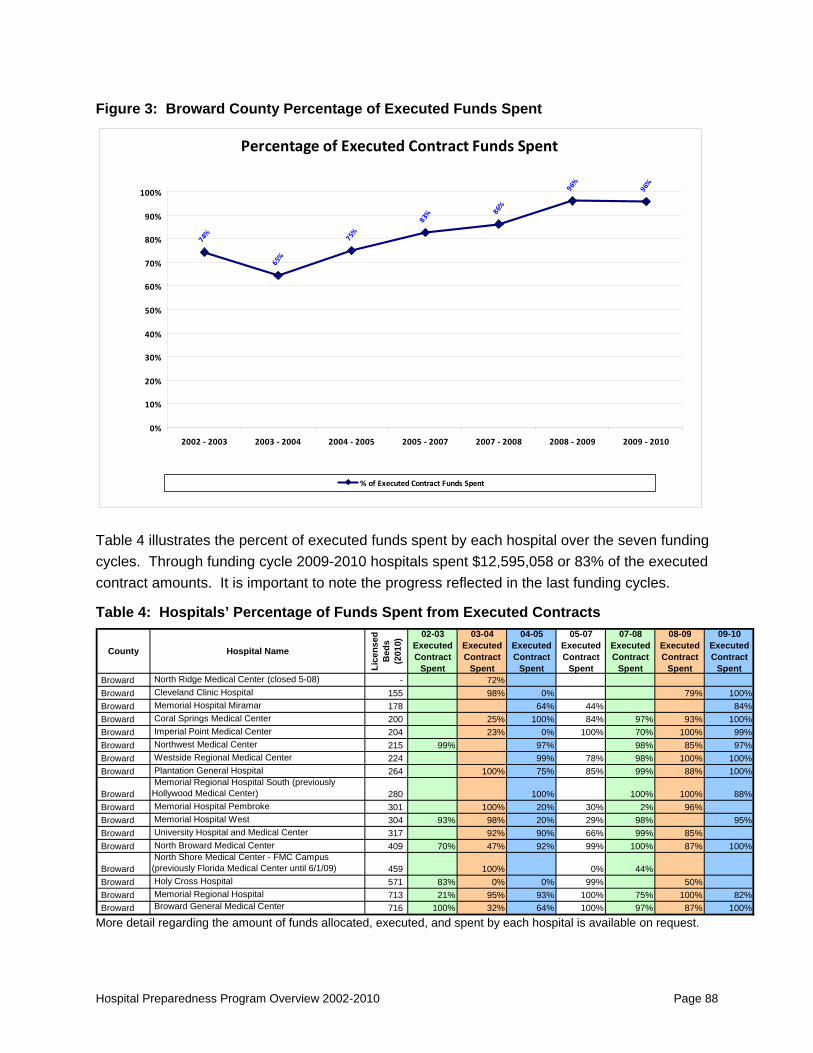
Figure 3: Broward County Percentage of Executed Funds Spent
Percentage of Executed Contract Funds Spent
74%
65%
75%
83% 86
%
96%
96%
0%
10%
20%
30%
40%
50%
60%
70%
80%
90%
100%
2002 ‐ 2003 2003 ‐ 2004 2004 ‐ 2005 2005 ‐ 2007 2007 ‐ 2008 2008 ‐ 2009 2009 ‐ 2010
% of Executed Contract Funds Spent
Table 4 illustrates the percent of executed funds spent by each hospital over the seven funding cycles. Through funding cycle 2009-2010 hospitals spent $12,595,058 or 83% of the executed contract amounts. It is important to note the progress reflected in the last funding cycles.
Table 4: Hospitals’ Percentage of Funds Spent from Executed Contracts
County Hospital Name
Lice
nsed
B
eds
(201
0)
02-03 Executed Contract
Spent
03-04 Executed Contract
Spent
04-05 Executed Contract
Spent
05-07 Executed Contract
Spent
07-08 Executed Contract
Spent
08-09 Executed Contract
Spent
09-10 Executed Contract
SpentBroward North Ridge Medical Center (closed 5-08) - 72%Broward Cleveland Clinic Hospital 155 98% 0% 79% 100%Broward Memorial Hospital Miramar 178 64% 44% 84%Broward Coral Springs Medical Center 200 25% 100% 84% 97% 93% 100%Broward Imperial Point Medical Center 204 23% 0% 100% 70% 100% 99%Broward Northwest Medical Center 215 99% 97% 98% 85% 97%Broward Westside Regional Medical Center 224 99% 78% 98% 100% 100%Broward Plantation General Hospital 264 100% 75% 85% 99% 88% 100%
Broward Memorial Regional Hospital South (previously Hollywood Medical Center) 280 100% 100% 100% 88%
Broward Memorial Hospital Pembroke 301 100% 20% 30% 2% 96%Broward Memorial Hospital West 304 93% 98% 20% 29% 98% 95%Broward University Hospital and Medical Center 317 92% 90% 66% 99% 85%Broward North Broward Medical Center 409 70% 47% 92% 99% 100% 87% 100%
Broward North Shore Medical Center - FMC Campus (previously Florida Medical Center until 6/1/09) 459 100% 0% 44%
Broward Holy Cross Hospital 571 83% 0% 0% 99% 50%Broward Memorial Regional Hospital 713 21% 95% 93% 100% 75% 100% 82%Broward Broward General Medical Center 716 100% 32% 64% 100% 97% 87% 100%
More detail regarding the amount of funds allocated, executed, and spent by each hospital is available on request.
Hospital Preparedness Program Overview 2002-2010 Page 88

PROGRAMMATIC FUNDING CATEGORIES Data about funding and participation was gathered in four categories:
♦ Equipment ♦ Training ♦ Exercises ♦ Other
The “other” category was used to capture the funds spent on the Web-Based Event Management Software Pilot Project and the Telecommunications Service Priority initiative.
Table 5 presents the total amounts spent across seven funding cycles. In funding cycle 2009-2010 training and exercise funds were combined. For purposes of this table they have been separated and equally allocated to each category.
Table 5: Total Funds Spent by Programmatic Category
Hospital Type
Grand Total Equipment
Spent
Grand Total Training
Spent
Grand Total Exercises
Spent Grand Total Other Spent
Grand Total SPENT
With EDs $10,223,016 $1,095,981 $824,061 $452,000 $12,595,058
Other $0 $0 $0 $0 $0
ALL $10,223,016 $1,095,981 $824,061 $452,000 $12,595,058
CLOSING COMMENTS As the Hospital Preparedness Program moves forward an important goal will be to support ongoing and continuous all hazards preparedness capabilities of hospital partners through funding and other collaborative partnerships. The most important work and efforts take place at the local and regional level.
Local and regional hospital preparedness planners can apply their insights into local activities to use information in this report to build connections with local hospital partners to work, plan, and exercise together.
Additional questions to ask when reviewing this information can include:
♦ Based on the current level of participation and expenditures, what are the next steps for the hospital partners in the county?
♦ How can the critical level of response and commitment be sustained especially in the face of reduced allocations?
Hospital Preparedness Program Overview 2002-2010 Page 89

Hospital Preparedness Program Overview 2002-2010 Page 90
♦ What can be learned from the recent history of high expenditure rates?
♦ What can be learned from the renewed participation of some of the larger hospitals during the 2010-2011 funding cycle.
♦ Are there gaps to be addressed during the next funding cycle?
♦ What actions may be necessary to better support hospitals to maximize use of resources?
The shared program goal is to ensure that healthcare partners are prepared for, able to respond to, and recover from any threat, natural or man-made. The department will continue to work with hospitals in their all-hazards approach to preparedness, response, and recovery.
Hospital Preparedness Program Regional Domestic Security Task Force Region 7
Miami-Dade County
PROGRAM OVERVIEW This report provides a descriptive analysis of the participation and programmatic focus of the Hospital Preparedness Program (HPP) in Miami-Dade County. The information provides an overview of county specific partnerships with local hospitals. Information is intended to provide a picture that can be used to confirm and document what is happening in the county and to assist with planning for future activities.
MIAMI-DADE COUNTY Miami-Dade County is home to 35 incorporated cities and many unincorporated areas. The northern, central, and eastern portions of the county are heavily urbanized with many high rises along the coastline, and downtown Miami. The Redland and Homestead areas in the south are primarily agricultural and sparsely populated. The western portion of the county extends into the Everglades National Park populated only by a Miccosukee Tribal village.
The 2010 U.S. Census population for this county is 2,496,435.71 Miami-Dade is the most populous county in the state and the 8th most populous in the US.72 Fourteen percent of Miami-Dade’s residents are age 65 or older, lower than the statewide average of 17%. Almost 18% of the population lives below poverty level and 17% of persons under 65 years old have no health insurance. Nineteen percent of the population has one or more disabilities. The population is ethnically diverse. Forty-nine percent of the population is foreign born.73 Fifty-nine percent speak Spanish as their primary language.74
According to the State of Florida Enhanced Hazard Mitigation Plan, August 2010,75 Miami-Dade County is rated at high risk for hurricanes, flooding, and severe storms. A 2010 report bthe Weather Channel lists Miami/Ft Lauderdale as the number one top hurricane vulnerable aoverdue cities in the nation. These hazards could disrupt services and possibly require patient evacuations. During a hurricane, Miami-Dade also needs to be prepared to take in evacuees from Monroe County.
y nd
71 County population and ethnicity data is from the 2010 US Census - Other demographic statistics are from FDOH Vulnerable Population profiles. http://www.floridashealth.com/prepare/VulnerablePopulations.html. 72 http://www.census.gov/popest/counties/tables/CO-EST2009-07.csv. 73 US Census Bureau Fact Sheet http://factfinder.census.gov/home/saff/main.html?_lang=en Retrieved 7-18-11. 74 http://www.mla.org/map_data, Based on 2000 census data, responses to the question, "Does this person speak a language other than English at home?" 75 Enhanced State Hazard Mitigation Plan 2010 http://www.floridadisaster.org/mitigation/State/Index.htm . Retrieved 5-18-11
Hospital Preparedness Program Overview 2002-2010 Page 91
The Turkey Point Nuclear Power Plant south of Miami has a twin reactor and operates five power-generating units. This site is the largest generating station in Florida and is the sixth largest power plant in the United States.
Historically, the two mainstays of Miami-Dade’s economy have been tourism and shipping. In recent years there has been continuing development of manufacturing, technology, and service businesses.76 The county is also home to a number of corporate headquarters. The Port of Miami is one of the top container ports in the US, with more than 1,706 ship calls annually. It is a major distribution hub and serves as a cruise ship destination with 4,150,000 passengers reported in 2010.77 The port could potentially be an entry for infectious diseases, smuggling, terrorism, or marine incidents.
In 2009, 11,935,900 visitors came to Miami-Dade County, 5,684,400 from outside the US.78 To accommodate these visitors there are a large number of hotels, restaurants, a convention center, three stadiums, two sports and entertainment arenas, two horse tracks and one speedway. The county is home to five professional sports teams and six universities and colleges.
The diversity of the economy and population, the high risk for hurricanes, flooding, severe storms, the large number of high-rises, and the large number of visitors, who may or may not have access to health care services, may not know where to go for assistance, and may not use English as their primary language, present hospitals in the county with a wide range of challenges for all-hazard preparedness.
The county currently has 21 hospitals with emergency departments (EDs), with a total 8,747 licensed beds. Information throughout this report on licensed beds is based on the Florida Agency for Health Care Administration, January 2010, Florida Hospital Bed Need Projections and Service Utilization by District report.79
Miami-Dade County is also fortunate to have one Level I Trauma Center with a burn unit and one Pediatric Trauma Center.80 There are an additional 14 hospitals without EDs. These are primarily specialty hospitals providing such services as long-term acute care, rehabilitation, and behavioral health. One is a Veterans Administration Medical Center. Twenty of the 21 hospitals with EDs are Joint Commission accredited which requires an emergency operations plan and all
76 p. 4, “In Motion – Comprehensive Economic Development Strategy 2007 – 2012”, Treasure Coast Regional Planning Council http://www.tcrpc.org/departments/CEDS%202007-2012.pdf 77 http://www.miamidade.gov/portofmiami/business-port-statistics.asp 2009. 78 Greater Miami Convention and Visitors Bureau http://www.gmcvb.com/, http://www.miamiandbeaches.com/Pictures/WebRpt/Annual%202009%20Visitor%20Profile.pdf, p. 5. Retrieved 3/14/11. 79 While the number of hospitals beds did not vary significantly over the seven funding cycles, 2002-2003 to 2009-2010 can be considered estimates. 80 Agency for Health Care Administration Facility Search, http://www.floridahealthfinder.gov/facilitylocator/FacilitySearch.aspx . Retrieved 5-17-11
Hospital Preparedness Program Overview 2002-2010 Page 92

hazards emergency response capabilities. Ten of the hospitals without EDs are also Joint Commission accredited.
The county has an active disaster health care coalition, Miami-Dade County Hospital Preparedness Consortium (MDCHPC),81 which provides a forum for sharing information and plans, coordinating training or exercises, and developing mutual aid arrangements.
PARTICIPATION For the purpose of this report, participation is defined as a hospital with an emergency department that has been offered, accepted, and executed a contract with the Florida Department of Health. For funding cycles 2007-2008, 2008-2009 and 2009-2010 Baptist Health South Florida received funds for more than one hospital in its system. While there was one master contract, funds and preparedness resources were provided to other hospitals in the system. This allows the contracting hospital to leverage purchasing power and expedite the expenditure of funds. In such cases, each hospital receiving funds directly or indirectly has been counted as participating.
Information is presented by funding cycle (FC). Funding cycles correspond with state fiscal years. One funding cycle encompassed two fiscal years (2005-2007).
Preliminary observations based on the data indicate:
♦ Participation has been inconsistent ranging from a low of six hospitals in funding cycle 2008-2009 to a high of16 in funding cycle 2010-2011.
♦ In FY 2010-2011, 16 hospitals participated, accounting for 7,107 or 81% of the county’s licensed beds.
♦ The largest hospital with 1,498 licensed beds has participated in each of the funding cycles.
♦ The majority (12) of hospitals in the county have more than 350 beds. Three of these hospitals are very large with more than 600 licensed beds.
♦ In addition to hospitals with EDs included in this analysis, during funding cycle 2004-2005, the VA Medical Center in Miami was allocated $15,000 for PPE equipment and training. None of these funds were spent. In funding cycle 2008-2009 the Miami Jewish Home & Hospital for the Aged was allocated and spent $20,000 for PPE equipment and training and $10,000 for exercises.
♦ Seventeen of the 21 hospitals in the county are part of seven hospital corporations or systems, HCA East Florida Division (Hospital Corporation of America), Baptist Health South Florida, Tenet Health System, Jackson Health System, Metropolitan Health
81 http://www.mdchospitals.org/
Hospital Preparedness Program Overview 2002-2010 Page 93
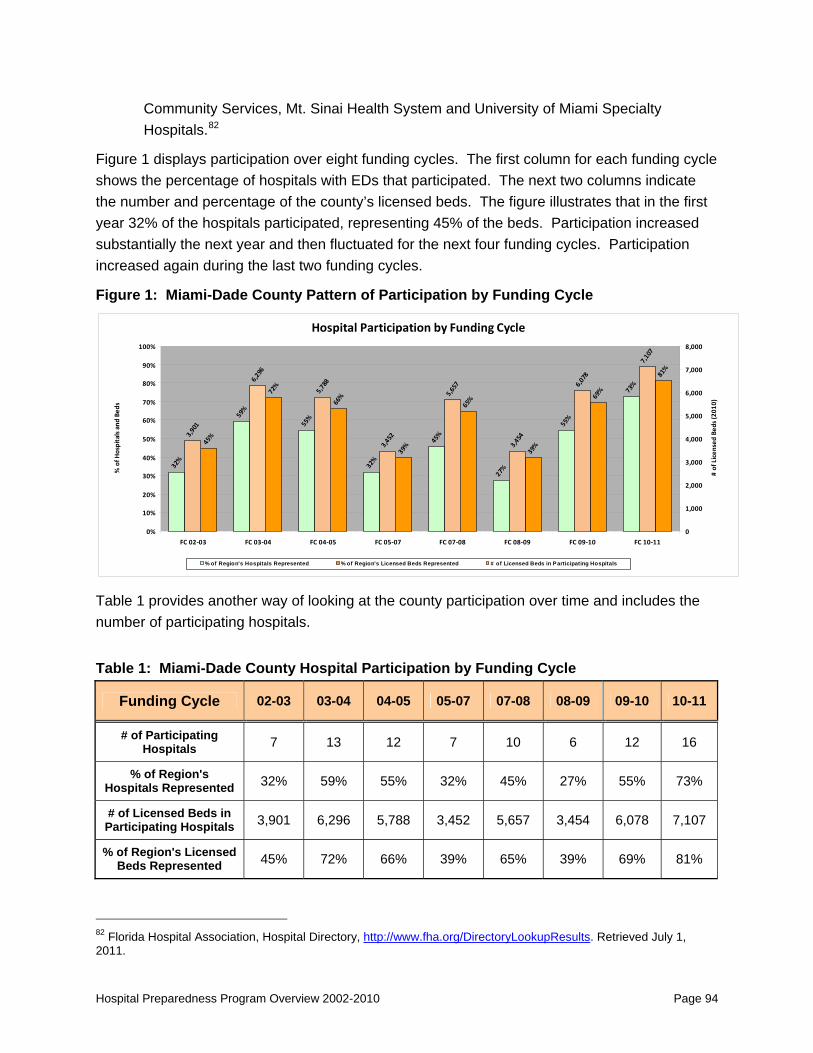
Community Services, Mt. Sinai Health System and University of Miami Specialty Hospitals.82
Figure 1 displays participation over eight funding cycles. The first column for each funding cycle shows the percentage of hospitals with EDs that participated. The next two columns indicate the number and percentage of the county’s licensed beds. The figure illustrates that in the first year 32% of the hospitals participated, representing 45% of the beds. Participation increased substantially the next year and then fluctuated for the next four funding cycles. Participation increased again during the last two funding cycles.
Figure 1: Miami-Dade County Pattern of Participation by Funding Cycle
Hospital Participation by Funding Cycle
32%
59%
55%
32%
45%
27%
55%
73%
45%
72%
66%
39%
65%
39%
69%
81%
3,901
6,296
5,788
3,452
5,657
3,454
6,078
7,107
0%
10%
20%
30%
40%
50%
60%
70%
80%
90%
100%
FC 02‐03 FC 03‐04 FC 04‐05 FC 05‐07 FC 07‐08 FC 08‐09 FC 09‐10 FC 10‐11
% of H
ospitals and
Bed
s
0
1,000
2,000
3,000
4,000
5,000
6,000
7,000
8,000
# of Licen
sed Be
ds (2
010)
% of Region's Hospitals Represented % of Region's Licensed Beds Represented # of Licensed Beds in Participating Hospitals
Table 1 provides another way of looking at the county participation over time and includes the number of participating hospitals.
Table 1: Miami-Dade County Hospital Participation by Funding Cycle
Funding Cycle 02-03 03-04 04-05 05-07 07-08 08-09 09-10 10-11
# of Participating Hospitals 7 13 12 7 10 6 12 16
% of Region's Hospitals Represented 32% 59% 55% 32% 45% 27% 55% 73%
# of Licensed Beds in Participating Hospitals 3,901 6,296 5,788 3,452 5,657 3,454 6,078 7,107
% of Region's Licensed Beds Represented 45% 72% 66% 39% 65% 39% 69% 81%
82 Florida Hospital Association, Hospital Directory, http://www.fha.org/DirectoryLookupResults. Retrieved July 1, 2011.
Hospital Preparedness Program Overview 2002-2010 Page 94

Table 2 provides a side by side comparison of the participation of hospitals with EDs participating in the HPP. Hospitals marked “yes” participated either through an individual contract or as part of a system or master contract.
Table 2: Miami-Dade County Hospital Participation 07-08 to 10-11 Funding Cycles
County Hospital Name
Lice
nsed
Bed
s (2
010) # FCs
Participated in 1st Four FCs
07-08 Participated
08-09 Participated
09-10 Participated
10-11 Participated
Miami-Dade Westchester General Hospital 125 0 No No No NoMiami-Dade Homestead Hospital 142 2 Yes Yes Yes YesMiami-Dade Larkin Community Hospital 142 1 No No No Yes
Miami-Dade Metropolitan Hospital of Miami (formerly Pan American Medical Center) 146 2 No No No No
Miami-Dade Jackson South Community Hospital 199 3 No No Yes YesMiami-Dade Coral Gables Hospital 247 0 No No Yes YesMiami-Dade Palms Springs General Hospital 247 1 No No No NoMiami-Dade Doctors Hospital (Coral Gables) 281 0 Yes No Yes YesMiami-Dade Miami Children's Hospital 289 4 Yes Yes Yes YesMiami-Dade North Shore Medical Center 357 0 No No No YesMiami-Dade Palmetto General Hospital 360 2 No No No NoMiami-Dade Hialeah Hospital 378 3 Yes Yes Yes Yes
Miami-Dade Jackson North Medical Center (formerly Parkway Regional Medical Center) 382 3 No No Yes Yes
Miami-Dade Aventura Hospital 407 2 Yes No No YesMiami-Dade Kendall Regional Medical Center 412 3 No No No YesMiami-Dade South Miami Hospital 467 2 Yes Yes Yes YesMiami-Dade Mercy 473 1 No No No No
Miami-Dade University of Miami Hospital (formerly Cedars Medical Center) 560 3 Yes No Yes Yes
Miami-Dade Baptist Hospital of Miami 680 1 Yes Yes Yes YesMiami-Dade Mt. Sinai Medical Center 955 2 Yes No Yes Yes
Miami-Dade Jackson Memorial Hospital Ryder Trauma Center 1,498 4 Yes Yes Yes Yes
21 8,747 10 6 12 16
Information regarding participation is important but it is only one part of the picture. It is necessary to look at the levels of funding and expenditures. The next part of the data provides additional detail related to funding.
FUNDING When reviewing the level of funding and the distribution of funding, it is important to keep in mind that a number of factors can impact participation. Miami-Dade County hospitals with EDs received a total allocation and executed contracts of $10,436,201 through funding cycle 2009-2010.83 The twelve largest hospitals, those with greater than 350 beds, were recipients of $7,488,547, or nearly 72% of the allocated funds. The remaining nine hospitals, with a total of
83 This does not include the $30,000 allocated to the Miami Jewish Home and Hospital for the Aged or the $15,000 allocated to the VA Medical Center.
Hospital Preparedness Program Overview 2002-2010 Page 95

1,818 beds, received $2,947,653 or approximately 28% of the allocated funds. Of the total funding in executed contracts, $7,881,999 was expended.
Table 3 displays the total funds allocated, executed in contracts, and spent for each funding cycle. Levels of expenditures can be influenced by the maturation of the level of preparedness of the hospital partners. Low expenditure rates by individual hospitals may be related to a hospital being sold, changes in management, changes in allowable purchases, disallowances, events such as H1N1 resulting in higher priorities, or other factors. Further individual review may be necessary to determine specific reasons and opportunities for improvement.
Table 3: Miami-Dade County Total Allocated, Executed, Spent Funds by Funding Cycle
Funding Cycle Total Amount Allocated
Total Amount in Executed Contract
Total Amount Spent
% of Executed Contract Funds Spent
2002 - 2003 551,250 551,250 284,000 52%
2003 - 2004 1,587,756 1,587,756 1,123,085 71%
2004 - 2005 2,404,299 2,404,299 1,259,255 52%
2005 - 2007 3,077,961 3,077,961 2,835,734 92%
2007 - 2008 1,794,972 1,794,972 1,498,691 83%
2008 - 2009 498,963 498,963 406,523 81%
2009 - 2010 521,000 521,000 474,711 91%
Total All FCs 10,436,201 10,436,201 7,881,999 76%
This record of spending as well as the growth and decline in total funding over seven funding cycles is illustrated in Figures 2 and 3.
Figure 2: Miami-Dade County Total Allocated, Executed, and Spent by Funding Cycle
Funds Allocated, Executed and Spent by FCs
551,250
1,587,756
2,404,299
3,077,961
1,794,972
498,963
521,000
551,250
1,587,756
2,404,299
3,077,961
1,794,972
498,963
521,000
284,000
1,123,085
1,259,255
2,835,734
1,498,691
406,523
474,711
0
500,000
1,000,000
1,500,000
2,000,000
2,500,000
3,000,000
3,500,000
4,000,000
2002 ‐ 2003 2003 ‐ 2004 2004 ‐ 2005 2005 ‐ 2007 2007 ‐ 2008 2008 ‐ 2009 2009 ‐ 2010
Total Amount Allocated Total Amount in Executed Contract Total Amount Spent
Hospital Preparedness Program Overview 2002-2010 Page 96

Figure 3: Miami-Dade County Percentage of Executed Funds Spent
Percentage of Executed Contract Funds Spent
52%
71%
52%
92%
83%
81%
91%
0%
10%
20%
30%
40%
50%
60%
70%
80%
90%
100%
2002 ‐ 2003 2003 ‐ 2004 2004 ‐ 2005 2005 ‐ 2007 2007 ‐ 2008 2008 ‐ 2009 2009 ‐ 2010
% of Executed Contract Funds Spent
Table 4 illustrates the percent of executed funds spent by each hospital over the seven funding cycles. Through funding cycle 2009-2010 hospitals spent $7,881,999 or 76% of the executed contract amounts.
In funding cycles 2007-2008, 2008-2009 and 2009-2010 Baptist Health South Florida (BHS) elected to take one system contract for its hospital partners. Table 4 notes which hospitals participated by receiving funds and preparedness resources through these master contracts. In 2007-2008 the system contract served Doctors Hospital in Coral Gables and Mariner's Hospital in Monroe County. The expenditure rate for Doctors Hospital reflects expenditures for both hospitals. For funding cycle 2008-2009 and 2009-2010, the expenditure rate listed for Baptist Hospital Miami reflects the overall expenditure for other participating hospitals shown in Table 4 as part BHS.
Hospital Preparedness Program Overview 2002-2010 Page 97

Table 4: Miami-Dade Hospitals’ Percentage of Funds Spent from Executed Contracts
County Hospital Name
Lice
nsed
B
eds
(201
0) 02-03 Executed Contract
Spent
03-04 Executed Contract
Spent
04-05 Executed Contract
Spent
05-07 Executed Contract
Spent
07-08 Executed Contract
Spent
08-09 Executed Contract
Spent
09-10 Executed Contract
Spent
Miami-Dade Westchester General Hospital 125 Miami-Dade Homestead Hospital 142 65% 0% 100% BHS BHSMiami-Dade Larkin Community Hospital 142 85%
Miami-Dade Metropolitan Hospital of Miami (formerly Pan American Medical Center) 146 59% 0%
Miami-Dade Jackson South Community Hospital 199 44% 0% 70% BHSMiami-Dade Coral Gables Hospital 247 28%Miami-Dade Palms Springs General Hospital 247 75%Miami-Dade Doctors Hospital (Coral Gables) 281 94% BHSMiami-Dade Miami Children's Hospital 289 71% 100% 69% 93% 46% 72% 92%Miami-Dade North Shore Medical Center 357 Miami-Dade Palmetto General Hospital 360 96% 100%Miami-Dade Hialeah Hospital 378 91% 100% 87% 94% 100% 100%
Miami-Dade Jackson North Medical Center (formerly Parkway Regional Medical Center) 382 51% 0% 0% BHS
Miami-Dade Aventura Hospital 407 93% 0% 94%Miami-Dade Kendall Regional Medical Center 412 69% 98% 98%Miami-Dade South Miami Hospital 467 35% 0% 99% BHS BHSMiami-Dade Mercy 473 0%
Miami-Dade University of Miami Hospital (formerly Cedars Medical Center) 560 10% 0% 0% 0% 9
Miami-Dade Baptist Hospital of Miami 680 0% 93% 100% 100%Miami-Dade Mt. Sinai Medical Center 955 96% 69% 45% 100%
Miami-Dade Jackson Memorial Hospital Ryder Trauma Center 1,498 100% 83% 42% 100% 96% 86% 89%
8%
More detail regarding the amount of funds allocated, executed, and spent by each hospital is available on request.
PROGRAMMATIC FUNDING CATEGORIES Data about funding and participation was gathered in four categories: ♦ Equipment ♦ Training ♦ Exercises ♦ Other
The “other” category was used to capture the funds spent on the Telecommunications Service Priority initiative.
Table 5 presents the total amounts spent across seven funding cycles. In funding cycle 2009-2010, training and exercise funds were combined. For purposes of this table they have been separated and equally allocated to each category.
Hospital Preparedness Program Overview 2002-2010 Page 98
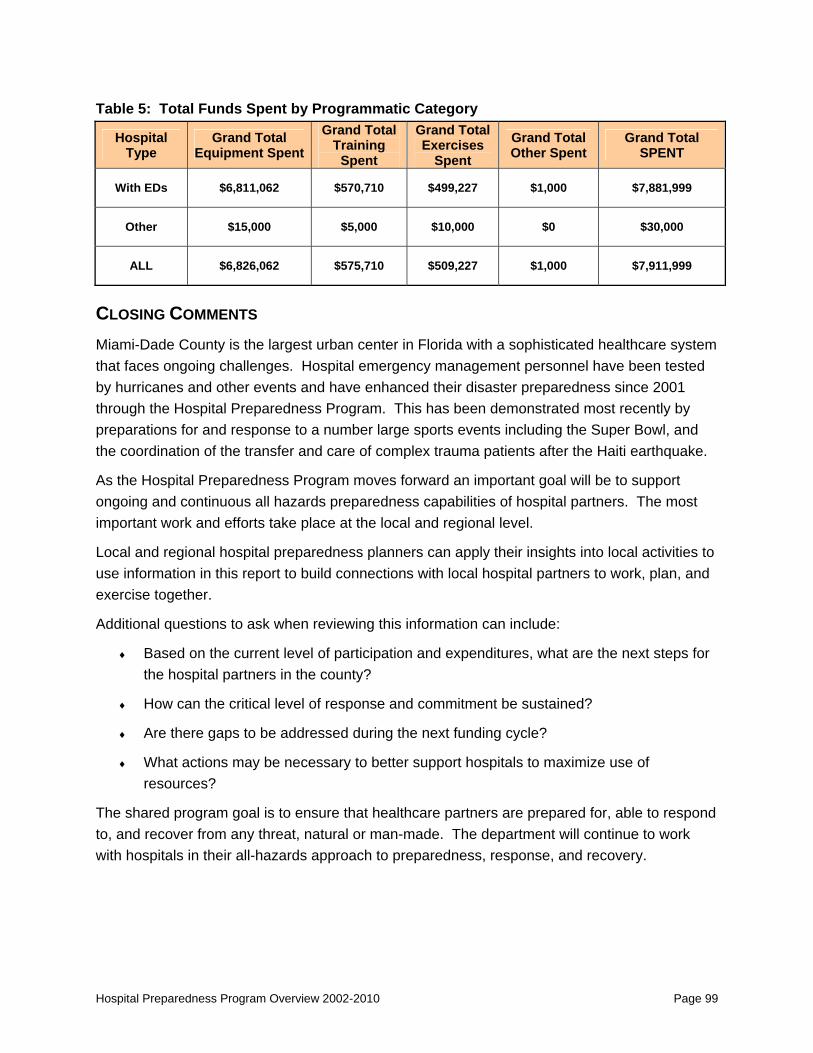
Hospital Preparedness Program Overview 2002-2010 Page 99
Table 5: Total Funds Spent by Programmatic Category
Hospital Type
Grand Total Equipment Spent
Grand Total Training
Spent
Grand Total Exercises
Spent Grand Total Other Spent
Grand Total SPENT
With EDs $6,811,062 $570,710 $499,227 $1,000 $7,881,999
Other $15,000 $5,000 $10,000 $0 $30,000
ALL $6,826,062 $575,710 $509,227 $1,000 $7,911,999
CLOSING COMMENTS Miami-Dade County is the largest urban center in Florida with a sophisticated healthcare system that faces ongoing challenges. Hospital emergency management personnel have been tested by hurricanes and other events and have enhanced their disaster preparedness since 2001 through the Hospital Preparedness Program. This has been demonstrated most recently by preparations for and response to a number large sports events including the Super Bowl, and the coordination of the transfer and care of complex trauma patients after the Haiti earthquake.
As the Hospital Preparedness Program moves forward an important goal will be to support ongoing and continuous all hazards preparedness capabilities of hospital partners. The most important work and efforts take place at the local and regional level.
Local and regional hospital preparedness planners can apply their insights into local activities to use information in this report to build connections with local hospital partners to work, plan, and exercise together.
Additional questions to ask when reviewing this information can include:
♦ Based on the current level of participation and expenditures, what are the next steps for the hospital partners in the county?
♦ How can the critical level of response and commitment be sustained?
♦ Are there gaps to be addressed during the next funding cycle?
♦ What actions may be necessary to better support hospitals to maximize use of resources?
The shared program goal is to ensure that healthcare partners are prepared for, able to respond to, and recover from any threat, natural or man-made. The department will continue to work with hospitals in their all-hazards approach to preparedness, response, and recovery.
Hospital Preparedness Program Regional Domestic Security Task Force Region 7
Monroe County
PROGRAM OVERVIEW This report provides a descriptive analysis of the participation and programmatic focus of the Hospital Preparedness Program (HPP) in Monroe County. The information provides an overview of county specific partnerships with local hospitals. The information is intended to provide a picture that can be used to confirm and document what is happening in the county and to assist with planning for future activities.
THE COUNTY Monroe County is quite different from the other three counties in RDSTF 7. The County has over 300 miles of coastline with numerous islands and barrier islands which are densely populated. Although the majority of the land is in the SW Everglades, 99% of the population lives in the Florida Keys. While the Keys stretch 220 miles from Key Largo to the Dry Tortugas, the population lives along the 120 mile stretch from North Key Largo to Key West. Geographically the Keys are in a high risk location for hurricanes and storm surge. This is coupled with a very difficult evacuation process due to limitations with the “Overseas Highway,” bridges and channels. Hospitals and other health and medical providers are generally instructed to initiate evacuation 72 hours prior to landfall of a Category 3 or greater hurricane.
Monroe County is defined by Florida Statutes as being a rural county with a population density of less than 100 individuals per square mile. The county includes medically underserved areas.84 The 2010 U.S. Census population for this county is 73,09085. Eighteen percent of the population is age 65 or older. More than 21% of persons under age 65 are uninsured and 22% of the population has one or more disabilities. Although one of the wealthiest counties in the state in per capita income,86 it has poorer citizens as well. Over eight thousand or more than10% of the population have incomes below the poverty level. The population is racially diverse, with 15% foreign born.87 Sixteen percent speak Spanish as their primary language.88
84 Health Council of South Florida, Inc., 2010 District 11 Health Profile. http://www.healthcouncil.org/healthprofiles.asp 85 County population is from the 2010 US Census - Other demographic statistics are from FDOH Vulnerable Population profiles. http://www.floridashealth.com/prepare/VulnerablePopulations.html. 86 Based on 2008 income, http://www.eflorida.com/profiles/CountyReport.asp?CountyID=25&Display=all. 87 http://www.city-data.com/county/Monroe_County-FL.html. 88 http://www.mla.org/map_data, Based on 2000 census data, responses to the question, "Does this person speak a language other than English at home?"
Hospital Preparedness Program Overview 2002-2010 Page 100

The county’s economy is based on tourism.89 It is estimated that annual visitors can reach 2,000,000. Residents and visitors are attracted to the beaches and water recreation. This includes world class fishing in Florida Bay, which is protected by the Everglades National Park and contains numerous islets or keys. To accommodate these visitors there are a number of hotels, lodgings and restaurants, as well as, tours. Given the county’s isolated geography, population characteristics of residents and visitors, economy and hurricane hazard, hospitals face a wide range of challenges in order to be prepared for all hazard incidents. As a result of the high volume of visitors, it is not uncommon to have large numbers of additional people for whom English is not the primary language. These visitors, may or may not have access to health care services, and may not know where to go for assistance. They may also be unfamiliar with being prepared for hurricanes and may not have the knowledge and resources necessary for evacuation. Monroe County is also susceptible to mass migration of immigrants illegally trying to enter the U.S. There were 28 landings documented in the first 4 months of 2011.90
The county currently has 3 hospitals with emergency departments (EDs), with a total 218 licensed beds. Information throughout this report on licensed beds is based on the Florida Agency for Health Care Administration, January 2010, Florida Hospital Bed Need Projections and Service Utilization by District report.91 All three of the hospitals are Joint Commission accredited which requires an emergency operations plan and a substantial level of all hazards emergency response capability. Mariners and Fisherman’s Hospitals are designated as critical access hospitals. There is also one additional small hospital without an emergency department and two small assisted living facilities with a total 24 resident capacity.
PARTICIPATION For the purpose of this report, participation is defined as a hospital that has been offered, accepted, and executed a contract with the Florida Department of Health.
Information is presented by funding cycle. Funding cycles correspond with state fiscal years and one funding cycle encompassed two fiscal years (2005-2007).
Here are some observations about Monroe County hospitals’ participation.
♦ All three hospitals participated in at least 4 of the 8 funding years. ♦ In funding cycles 2007-2008, 2009-2010, and 2010-2011 Mariners Hospital participated
as part of a Baptist Health South Florida master contract.
89 http://www.monroecounty-fl.gov/index.aspx?NID=27. 90 Keynews.com. Summer seas draw migrants to Keys. May 16, 2011. 91 While the number of hospitals beds did not vary significantly over the seven funding cycles, 2002-2003 to 2009-2010 can be considered estimates.
Hospital Preparedness Program Overview 2002-2010 Page 101
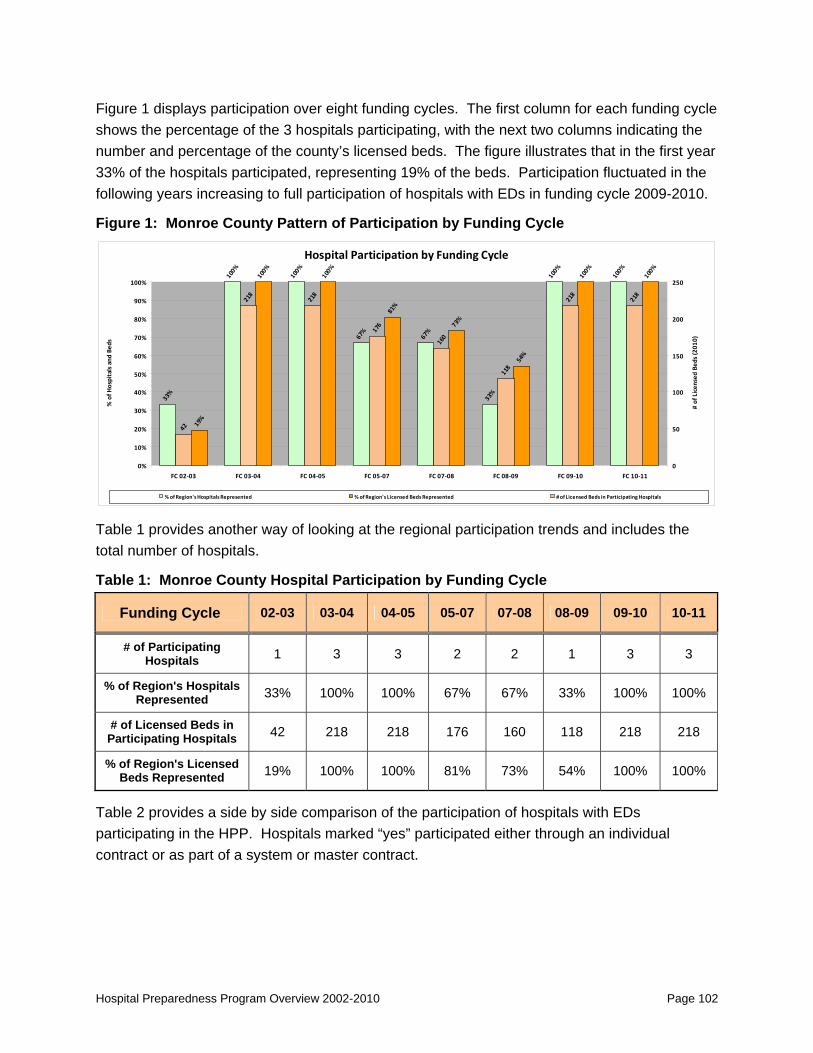
Figure 1 displays participation over eight funding cycles. The first column for each funding cycle shows the percentage of the 3 hospitals participating, with the next two columns indicating the number and percentage of the county’s licensed beds. The figure illustrates that in the first year 33% of the hospitals participated, representing 19% of the beds. Participation fluctuated in the following years increasing to full participation of hospitals with EDs in funding cycle 2009-2010.
Figure 1: Monroe County Pattern of Participation by Funding Cycle
Hospital Participation by Funding Cycle
33%
100%
100%
67%
67%
33%
100%
100%
19%
100%
100%
81%
73%
54%
100%
100%
42
218
218
176
160
118
218
218
0%
10%
20%
30%
40%
50%
60%
70%
80%
90%
100%
FC 02‐03 FC 03‐04 FC 04‐05 FC 05‐07 FC 07‐08 FC 08‐09 FC 09‐10 FC 10‐11
% of H
ospitals and
Bed
s
0
50
100
150
200
250
# of Licen
sed Be
ds (2
010)
% of Region's Hospitals Represented % of Region's Licensed Beds Represented # of Licensed Beds in Participating Hospitals
Table 1 provides another way of looking at the regional participation trends and includes the total number of hospitals.
Table 1: Monroe County Hospital Participation by Funding Cycle
Funding Cycle 02-03 03-04 04-05 05-07 07-08 08-09 09-10 10-11
# of Participating Hospitals 1 3 3 2 2 1 3 3
% of Region's Hospitals Represented 33% 100% 100% 67% 67% 33% 100% 100%
# of Licensed Beds in Participating Hospitals 42 218 218 176 160 118 218 218
% of Region's Licensed Beds Represented 19% 100% 100% 81% 73% 54% 100% 100%
Table 2 provides a side by side comparison of the participation of hospitals with EDs participating in the HPP. Hospitals marked “yes” participated either through an individual contract or as part of a system or master contract.
Hospital Preparedness Program Overview 2002-2010 Page 102

Table 2: Monroe County Hospital Participation 07-08 to 10-11 Funding Cycles
County Hospital Name
Lice
nsed
Bed
s (2
010) # FCs
Participated in 1st Four FCs
07-08 Participated
08-09 Participated
09-10 Participated
10-11 Participated
Monroe Mariners Hospital* 42 3 Yes No Yes YesMonroe Fishermen's Hospital* 58 3 No No Yes Yes
Monroe Lower Florida Keys Medical Center 118 3 Yes Yes Yes Yes3 218 2 1 3 3
*Indicates designated critical access hospital
Information regarding participation is important but it is only one part of the picture. It is necessary to look at the levels of funding and expenditures. The next part of the data provides additional detail related to funding.
FUNDING When reviewing the level of funding and the distribution of funding, it is important to keep in mind that a number of factors can impact participation. Monroe County hospitals with EDs received a total allocation of $738,681 through funding cycle 2009-2010. Of the total funding in executed contracts, $466,037 was expended. Table 3 displays the county wide total funds allocated, executed in contracts and, spent for each funding cycle. Levels of expenditures can be influenced by the maturation of the level of preparedness of the hospital partners. While expenditure rates increased dramatically during the last two funding cycles, low expenditure rates by individual hospitals earlier in the program may be related to a variety of factors. Further individual review may be necessary to determine specific reasons and additional opportunities for improvement.
Table 3: Monroe County Total Allocated, Executed, Spent Funds by Funding Cycle
Funding Cycle Total Amount Allocated
Total Amount in Executed Contract
Total Amount Spent
% of Executed Contract Funds Spent
2002 - 2003 74,498 74,498 56,339 76%
2003 - 2004 175,209 175,209 75,786 43%
2004 - 2005 292,334 292,334 202,707 69%
2005 - 2007 98,140 98,140 60,907 62%
2007 - 2008 24,500 24,500 0 0%
2008 - 2009 24,000 24,000 23,872 99%
2009 - 2010 50,000 50,000 46,426 93%
Total All FCs 738,681 738,681 466,037 63%
This record of spending as well as the growth and decline in total funding over seven funding cycles is illustrated in Figures 2 and 3.
Hospital Preparedness Program Overview 2002-2010 Page 103
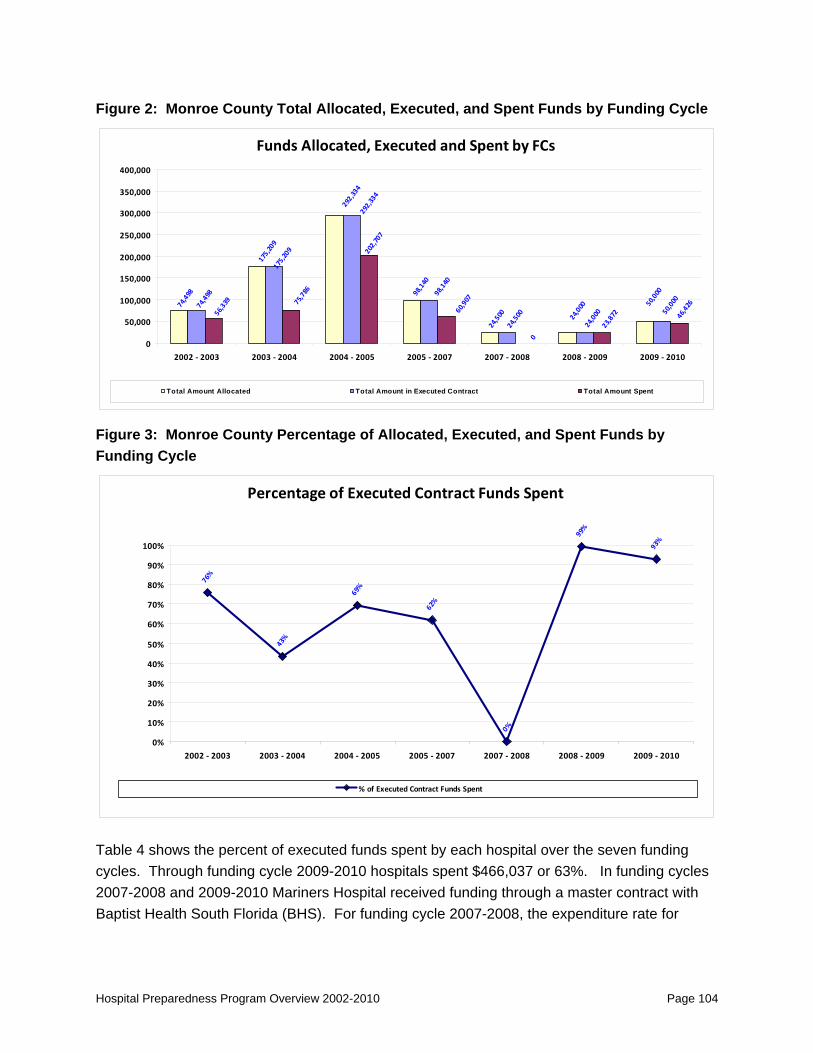
Figure 2: Monroe County Total Allocated, Executed, and Spent Funds by Funding Cycle
Funds Allocated, Executed and Spent by FCs
74,498
175,209
292,334
98,140
24,500 24,000 50
,000
74,498
175,209
292,334
98,140
24,500
24,000 50
,000
56,339 75,786
202,707
60,907
0
23,872 46,426
0
50,000
100,000
150,000
200,000
250,000
300,000
350,000
400,000
2002 ‐ 2003 2003 ‐ 2004 2004 ‐ 2005 2005 ‐ 2007 2007 ‐ 2008 2008 ‐ 2009 2009 ‐ 2010
Total Amount Allocated Total Amount in Executed Contract Total Amount Spent
Figure 3: Monroe County Percentage of Allocated, Executed, and Spent Funds by Funding Cycle
Percentage of Executed Contract Funds Spent
76%
43%
69%
62%
0%
99%
93%
0%
10%
20%
30%
40%
50%
60%
70%
80%
90%
100%
2002 ‐ 2003 2003 ‐ 2004 2004 ‐ 2005 2005 ‐ 2007 2007 ‐ 2008 2008 ‐ 2009 2009 ‐ 2010
% of Executed Contract Funds Spent
Table 4 shows the percent of executed funds spent by each hospital over the seven funding cycles. Through funding cycle 2009-2010 hospitals spent $466,037 or 63%. In funding cycles 2007-2008 and 2009-2010 Mariners Hospital received funding through a master contract with Baptist Health South Florida (BHS). For funding cycle 2007-2008, the expenditure rate for
Hospital Preparedness Program Overview 2002-2010 Page 104
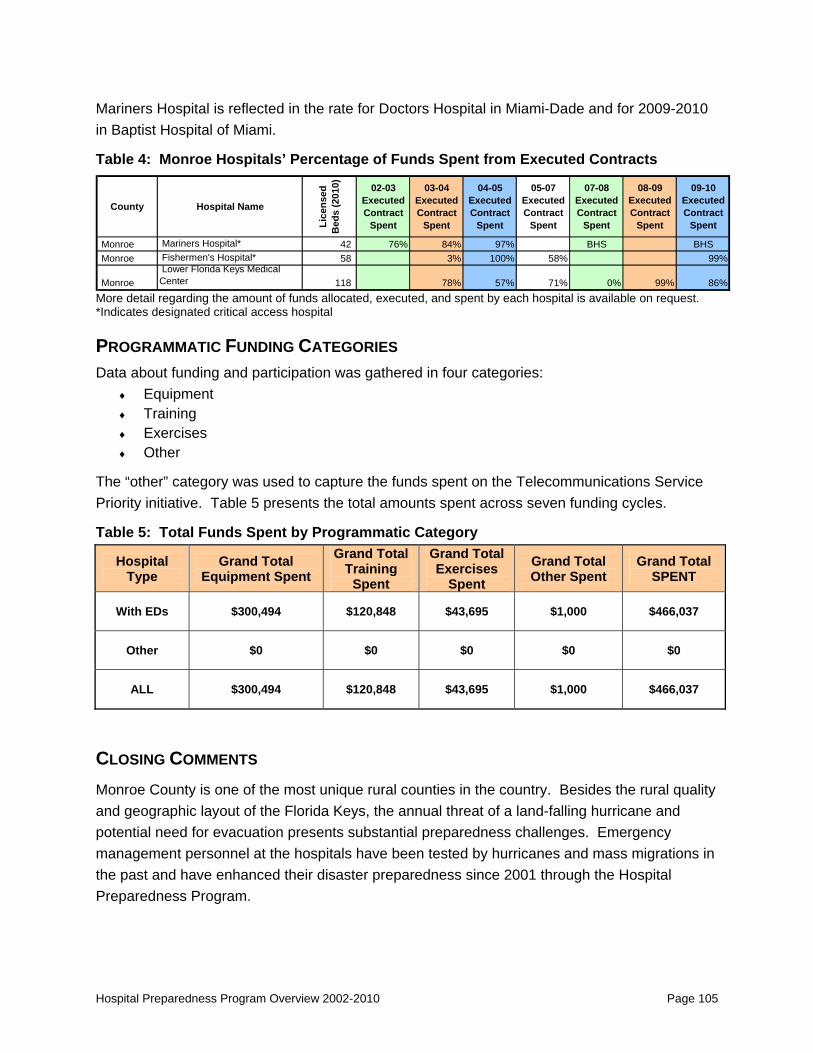
Mariners Hospital is reflected in the rate for Doctors Hospital in Miami-Dade and for 2009-2010 in Baptist Hospital of Miami.
Table 4: Monroe Hospitals’ Percentage of Funds Spent from Executed Contracts
County Hospital Name
Lice
nsed
B
eds
(201
0) 02-03 Executed Contract
Spent
03-04 Executed Contract
Spent
04-05 Executed Contract
Spent
05-07 Executed Contract
Spent
07-08 Executed Contract
Spent
08-09 Executed Contract
Spent
09-10 Executed Contract
Spent
Monroe Mariners Hospital* 42 76% 84% 97% BHS BHSMonroe Fishermen's Hospital* 58 3% 100% 58% 99%
Monroe Lower Florida Keys Medical Center 118 78% 57% 71% 0% 99% 86%
More detail regarding the amount of funds allocated, executed, and spent by each hospital is available on request. *Indicates designated critical access hospital
PROGRAMMATIC FUNDING CATEGORIES Data about funding and participation was gathered in four categories:
♦ Equipment ♦ Training ♦ Exercises ♦ Other
The “other” category was used to capture the funds spent on the Telecommunications Service Priority initiative. Table 5 presents the total amounts spent across seven funding cycles.
Table 5: Total Funds Spent by Programmatic Category
Hospital Type
Grand Total Equipment Spent
Grand Total Training
Spent
Grand Total Exercises
Spent Grand Total Other Spent
Grand Total SPENT
With EDs $300,494 $120,848 $43,695 $1,000 $466,037
Other $0 $0 $0 $0 $0
ALL $300,494 $120,848 $43,695 $1,000 $466,037
CLOSING COMMENTS Monroe County is one of the most unique rural counties in the country. Besides the rural quality and geographic layout of the Florida Keys, the annual threat of a land-falling hurricane and potential need for evacuation presents substantial preparedness challenges. Emergency management personnel at the hospitals have been tested by hurricanes and mass migrations in the past and have enhanced their disaster preparedness since 2001 through the Hospital Preparedness Program.
Hospital Preparedness Program Overview 2002-2010 Page 105

Hospital Preparedness Program Overview 2002-2010 Page 106
As the Hospital Preparedness Program moves forward an important goal will be to support ongoing and continuous all hazards preparedness capabilities of hospital partners. The most important work and efforts take place at the local and regional level.
Local and regional hospital preparedness planners can apply their insights into local activities to use information in this report to build connections with local hospital partners to work, plan, and exercise together.
Additional questions to ask when reviewing this information can include:
♦ Based on the current level of participation and expenditures, what are the next steps for the hospital partners in the county?
♦ How can the critical level of response and commitment be sustained?
♦ Are there gaps to be addressed during the next funding cycle?
The shared program goal is to ensure that healthcare partners are prepared for, able to respond to, and recover from any threat, natural or man-made. The department will continue to work with hospitals in their all-hazards approach to preparedness, response, and recovery.