hospital capacity, patient flow, and emergency department
TRANSCRIPT

Hospital Capacity, Patient Flow, and Emergency Department Use in New Jersey i
The Institute for Health, Health Care Policy and Aging Research
Hospital Capacity, Patient Flow, and
Emergency Department Use in New Jersey
Derek DeLia, Ph.D.
A Report to the New Jersey Department of Health
and Senior Services
September 2007
June 2007

Rutgers Center for State Health Policy, September 2007 ii

Hospital Capacity, Patient Flow, and Emergency Department Use in New Jersey iii
The Institute for Health, Health Care Policy and Aging Research
Hospital Capacity, Patient Flow, and
Emergency Department Use in New Jersey
Derek DeLia, Ph.D.
A Report to the New Jersey Department of Health
and Senior Services
September 2007
June 2007

Rutgers Center for State Health Policy, September 2007 iv

Hospital Capacity, Patient Flow, and Emergency Department Use in New Jersey v
Acknowledgements
The author gratefully acknowledges helpful comments and contributions received from a
number of officials and staff within the Department of Health and Senior Services including
David Gruber, Barbara Montana, Vince Yarmlak, and John Hazel. The report also benefited from
comments and conversations with Bruce Siegel at George Washington University. Finally,
important contributions were made by Cecilia Huang, Karen Jaffee, Joel Cantor, and Jeff Abramo
at the Rutgers Center for State Health Policy.

Rutgers Center for State Health Policy, September 2007 vi

Hospital Capacity, Patient Flow, and Emergency Department Use in New Jersey vii
Table of Contents
Executive Summary .................................................................................................................................. ix Introduction ......................................................................................................................................... .…..1 Literature Review ……………………………………………………………………………………… ..2
Data Analysis …………………………………………………………………………….... …………....14
Case Studies……………………………….…………………………………………………..………....35
Discussion ………………………………………………………………………………………………..46
Conclusion ................................................................................................................................................ 54
Appendix ................................................................................................................................................... 55
Endnotes.................................................................................................................................................... 59
References................................................................................................................................................. 61

Rutgers Center for State Health Policy, September 2007 viii

Hospital Capacity, Patient Flow, and Emergency Department Use in New Jersey ix
Hospital Capacity, Patient Flow, and Emergency Department
Use in New Jersey
Derek DeLia, Ph.D.
Executive Summary
In response to concern about growing utilization of hospital emergency departments
(ED’s) and its implications for hospital surge capacity, the New Jersey Department of Health and
Senior Services (NJDHSS) commissioned the study “Emergency Department Utilization and
Surge Capacity in New Jersey” to be conducted by the Rutgers Center for State Health Policy
(CSHP). This document is the third and final project report. It includes quantitative analysis of
recent trends in ED utilization, hospital occupancy, ambulance diversion, and potentially
avoidable hospital use in New Jersey (NJ). Using a case study approach, it also provides
qualitative analysis of patient flow management and surge capacity planning for hospitals in the
state.
After a slight drop in 2004, total ED visits in NJ resumed their previously rising trend in
2005, ending the year with 3.36 million visits statewide (compared to 2.67 million in 1998). ED
visits per capita followed a similar pattern and ended 2005 with 385 visits per 1,000 residents
(compared to 329 visits per 1,000 residents in 1998). Growth in ED visits is more rapid in regions
of the state that have experienced more rapid population growth, especially the Central West.
But on a per capita basis, the South and Northeast regions of the state had the highest rates of
ED use throughout the study period, 1998-2005.
Part of the rise in ED utilization is attributable to conditions and medical episodes that
may have been avoided through better access to primary care. A growing number of inpatient
admissions through the ED are for ambulatory care sensitive (ACS) conditions, such as asthma
and congestive heart failure. These admissions, which grew from 158,480 in 2003 to 186,284 in

Rutgers Center for State Health Policy, September 2007 x
2005, accounted for 31% of all ED admissions in 2005. In 2004, the state began collecting detailed
data on ED visits that did not lead to admission. Based on these data, the number of potentially
avoidable treat-and-release ED visits grew slightly from 1.15 million in 2004 to 1.24 million in
2005, accounting for 47% and 48% of all treat-and-release ED visits, respectively.
Following the national trend, the hospital sector in NJ experienced declines in capacity
(i.e., maintained beds) and inpatient utilization (i.e., inpatient days) from 1998 to 2005. Annual
occupancy rates at the state and regional levels fluctuated around 70% during this time. Annual
occupancy rates for intensive care and critical care units were higher than overall hospital
occupancy during this period but usually remained below 85% leaving at least 15% of capacity
available for unexpected patient volume.
However, these annual occupancy figures give a misleading picture of the alignment
between the supply and demand for hospital services. Every year, individual hospitals as well as
groups of hospitals within the same geographic region experience recurring periods of very high
occupancy followed by periods of low occupancy. During peak periods, hospital capacity in NJ
appears to be extremely constrained. On 47 days in 2005, more than 95% of all maintained beds in
the state were occupied. This number increased from 29 days in 2004 and 11 days in 2003. On
these days, there would be almost no immediate surge capacity available to respond to a major
emergency such as a natural disaster or terrorist attack without displacing existing patients. On
more than ¾ of the days in 2003 through 2005, the state had less than 500 empty staffed beds
available per million residents, which is a surge capacity benchmark developed by the federal
Health Resources and Services Administration. Failure to meet the benchmark is more common
in some parts of the state than others. The Northwest region of NJ stands out as being the most
likely to have a limited number of empty beds relative to population.
The likelihood of experiencing high occupancy is quite varied among hospitals in the
state. In 2005, for example, 26 facilities spent more than half of the year at or above 95%
occupancy of staffed beds. Other facilities experienced very high occupancy much less

Hospital Capacity, Patient Flow, and Emergency Department Use in New Jersey xi
frequently if at all. Yet closure of these lower-occupancy facilities could potentially overload
remaining hospitals, especially during their peak periods. The majority of informants from case
study hospitals (5 out of 7 sites), which are representative of these higher-occupancy facilities,
expressed substantial reservations about their ability to treat additional patients from closing
hospitals. Since 1995, seventeen general care hospitals have closed in NJ and more closures are
currently under consideration. While continued consolidation may be appropriate in some areas,
the ability of remaining hospitals to absorb additional volume will eventually diminish as more
closures occur.
The frequency of ambulance diversion in NJ underscores the stress on capacity that is
often experienced by hospitals in the state. Data from December 2006 and January 2007 reveal
that, on average, an ambulance diversion occurs once every hour in NJ. This is similar to an often
cited national statistic that there is a hospital on diversion about once every minute in the U.S.
Moreover, the reported number of diversions in NJ is likely an undercount, since participation in
the state’s diversion alert system (used in this report) is not universal. Although ambulances may
sometimes override hospitals’ diversion requests, these requests provide a clear signal that the
hospital staff does not feel completely ready to treat additional patients.
All of the case study participants agreed that better management of patient flow is crucial
to avoid ambulance diversion and ED overcrowding more generally. Yet they varied substantially
in the scale, scope, and success of their efforts. An important determinant of success in
minimizing bottlenecks in the ED (and throughout the hospital) is the extent to which hospitals
are able to coordinate across “silos” within the facility. Hospitals that have been successful are
able to communicate information rapidly across units and respond quickly when a particular area
is reaching capacity. Other hospitals, while attempting to do this, report a greater number of
problems in achieving this level of coordination. Some of the more crucial areas of concern
include ability to track patients through the entire hospital in real time, coordinating discharge

Rutgers Center for State Health Policy, September 2007 xii
schedules with the incoming volume of inpatients, and coordinating use of resources between
elective surgery and ED patients.
Despite the challenges faced on a daily basis, most case study participants felt that their
facilities were reasonably well prepared to respond to a mass casualty disaster or pandemic. All
case facilities have disaster management plans that include use of ordinarily non-clinical areas
for patient overflow and plans for early discharge of existing patients during a surge. Some of
these plans have been tested in exercises or in some cases applied to actual events that have
occurred in their areas (e.g., small plane crash, building fire). However, reflecting conditions
across the nation, coordination among hospitals that do not belong to a common system appears
to be less developed.
Case study hospitals vary in the way they manage potentially avoidable utilization. Some
have developed “fast track” systems to separate emergent from other cases in the ED. Two inner
city facilities have responded to a large volume of ambulatory care sensitive utilization by
developing elaborate case management and chronic disease management systems within the ED
itself. While this is a clear departure from the traditional role of the ED, these facilities have
decided that community need and patient preference have made this departure necessary. In the
words of one participant, these actions represent the “wave of the future” in ED care.
NJ hospitals have also become important providers of care for mental health and
substance abuse patients, particularly through the ED. However, case study hospitals have found
it much more difficult to provide care for these patients. In contrast to their general acceptance
of primary care patients in the ED, study participants expressed concern that their facilities are
unable to provide the needed services for these patients. Patients with mental illness are
described as being especially difficult to treat in the ED. ED staffing and physical space are not
set up to provide mental health services. This sometimes affects the care of other patients as
those requiring mental healthcare draw the attention of multiple clinicians and sometimes make
other patients feel uncomfortable. Ultimately, a general desire was expressed for health policy

Hospital Capacity, Patient Flow, and Emergency Department Use in New Jersey xiii
initiatives that would shift these patients out of acute care hospitals and into more appropriate
settings.
Like their counterparts nationwide, hospitals in NJ face periodic stress on capacity,
which often manifests itself in the form of delayed care in the emergency department (ED).
These recurrent strains on capacity, more so than annualized occupancy rates, should be
considered in evaluating the adequacy of hospital capacity in a particular community. Stress on
hospitals can be understood and managed in terms of factors that affect the flow of patients
through the ED. Hospitals have a great deal of ability to improve patient flow through established
techniques of operations management.
However, a variety of broader health system issues limits the extent to which hospitals
can control their patient flow. Trends in ED use are heavily influenced by the inability of patients
to gain access to primary and other specialized care (especially mental health) outside the
hospital. Streamlining patient flow through the ED is often hampered by the longstanding
disparity in reimbursement for elective surgeries versus other hospital services, which makes it
costly to disrupt elective surgery schedules. In the absence of broader health system reform,
hospitals will have to find ways to serve an expanding range of patients in a constrained
environment. Public policy efforts to assist hospitals in this task would benefit from regular
surveillance of hospital patient flow measures and other efficiency indicators.

Rutgers Center for State Health Policy, September 2007 xiv
Hospital Capacity, Patient Flow, and Emergency Department Use in New Jersey 1
Hospital Capacity, Patient Flow, and Emergency
Department Use in New Jersey
Derek DeLia, Ph.D.
Introduction
Emergency department (ED) utilization has been growing rapidly in the United States,
overall and per capita (McCaig and Burt, 2004; Cunningham and May, 2003). Much of this growth
is associated with ED visits for conditions that are either non-emergent or treatable in primary
care settings (Cunningham and May, 2003). This trend has implications beyond the ED as it
signals problems or dissatisfaction with the performance and accessibility of local primary care
delivery systems (Billings, Parikh, and Mijanovich, 2000-a).
In 2006, the Institute of Medicine (IOM) released a report describing serious problems
confronting hospital ED’s across the nation (Institute of Medicine, 2006). These include various
signs of overcrowding such as diversion of ambulances to other hospitals, patients “boarding” in
the ED until an inpatient bed becomes available, and excessive wait times for care. The regular
occurrence of ED overcrowding raises concern about the hospital sector’s ability to respond to a
mass casualty event such as a terrorist attack or natural disaster. Overcrowded ED’s also create
an environment where medical errors are more likely and overall quality of care is below its
potential (JCAHO, 2004).
In response to concern about potential problems facing ED’s in New Jersey (NJ), the New
Jersey Department of Health and Senior Services (NJDHSS) commissioned the study
“Emergency Department Utilization and Surge Capacity in New Jersey” to be conducted by the
Rutgers Center for State Health Policy (CSHP). This document is the third and final project
report. The first report documented trends in ED utilization and hospital bed capacity in NJ
(DeLia, 2005). It also reviewed the national literature on ED utilization and overcrowding. The

Rutgers Center for State Health Policy, September 2007 2
second report analyzed potentially avoidable ambulatory care provided in the ED and potentially
avoidable admissions that came through the ED (DeLia, 2006-a).
This report updates analysis from the first two reports and provides additional
information about ambulance diversion and the management of patient flow through the ED. The
report has four sections. The first provides an updated review of the literature on ED utilization,
hospital crowding, and patient flow management. The second section provides analysis of ED
utilization, hospital capacity, and ambulance diversion in NJ. The third section summarizes
findings from a series of case studies that determined how hospital ED’s and Federally Qualified
Health Centers (FQHC’s) in NJ manage patient flow and coordinate emergency and non-
emergency services. The final section provides implications and conclusions.
Literature Review
ED Input, Throughput, and Output
It is now well recognized that the ability to provide service in the ED depends on multiple
factors, most of which originate in other parts of the hospital or healthcare sector. To understand
how these factors affect ED operations, Asplin et al. (2003) developed a conceptual model that
consists of three components: ED input, throughput, and output.
ED input consists of any “condition, event, or system characteristic that contributes to
demand for ED services.” Input includes demand for emergency care, urgent care, and safety net
care. Hospital ED’s across the nation have seen an increase in the demand for all three types of
care in recent years (McCaig and Nawar, 2006). Much of this demand occurs in rapidly growing
metropolitan areas such as Phoenix, AZ and Miami, FL (Bazzoli et al., 2006). The phenomenon of
suburban sprawl may exacerbate the effects of population growth on ED crowding. Suburban
growth is associated with increasing rates of automobile accidents, but ED and trauma care
resources are typically insufficient in these areas and lag behind population growth (Millard,

Hospital Capacity, Patient Flow, and Emergency Department Use in New Jersey 3
2007). This places even greater demands on urban ED’s and trauma hospitals. In addition,
hospital ED’s experience an increase in demand when a nearby hospital closes its ED or ceases
operations altogether (Sun et al., 2006).
A major contributor to the growth in ED visits overall is use of the ED for non-urgent
care. This care is most frequently associated with the uninsured and patients covered by
Medicaid who often face barriers to primary care. However, the majority of growth in non-urgent
ED visits in recent years has occurred among the privately insured (Cunningham and May, 2003).
Although conclusive studies do not exist, this growth is thought to be associated with a number
of factors including difficulties in making physician appointments, the desire to receive
immediate service without an appointment, and the desire to have tests and other procedures
done in a single location.1 There is also some evidence that physicians will refer patients to the
ED in ambiguous cases, after hours, to avoid liability risks, or when they do not have the ability
to perform recommended tests in their offices (Berenson et al., 2003; Studdert et al., 2005).
In addition, a large number of people in the U.S. are aging and living longer with complex
diseases such as congestive heart failure, obstructive pulmonary disorder, kidney failure, and
HIV-AIDS (Derlet and Richards, 2000). These conditions often generate acute episodes that lead
to both avoidable and non-avoidable ED visits.
While clinicians and researchers often classify ED use as avoidable or non-emergent,
these judgments are generally difficult for patients to make. One study found that 82% of patients
with non-urgent conditions believe their situation was urgent (Gill and Riley, 1996).
Misinterpretations of urgency can work in the other direction as well. A nationwide survey of ED
patients found that 5% of patients who viewed their condition as non-urgent were subsequently
hospitalized (Young et al., 1996). Although many patients realize that non-urgent care is available
in the ED (Guttman et al., 2003), gray areas in the judgment of urgency remain important factors
in the volume and composition of ED input.

Rutgers Center for State Health Policy, September 2007 4
ED throughput focuses on the length of time patients spend in the ED. Throughput
includes triage, placement, and initial evaluation as well as diagnostic testing and treatments
provided in the ED. Throughput is often determined by the cohesiveness of caregiver teams and
the efficiency of processes used in the ED. Yet a number of broader factors can also add time to
patient stays in the ED. As mentioned above, there is a growing number of individuals with
chronic and complex illnesses who often come to the ED for evaluation and treatment.
Individuals with multiple illnesses and comorbidities affect ED throughput by increasing the time
and number of clinicians required to address medical concerns. As well, ED’s with large numbers
of non-English speaking patients in their service areas can experience throughput delays due to
communication barriers and delays in obtaining language services.
Hospital ED’s are treating a rising number of patients with mental health (Larkin et al.,
2004) and substance abuse (McDonald et al., 2004) diagnoses. A number of ED physicians have
attributed this rise to a decrease in the number of psychiatric beds and decreased funding for
mental healthcare (ACEP, 2004). Patients with these diagnoses often require time-intensive
treatment that directly affects ED throughput. Moreover, mental health and substance abuse are
often listed as secondary diagnoses, which complicate the treatment of other medical conditions.
Growth in the number of “observation stays” in the ED can also affect throughput. A
growing number of ED’s contain observation areas to evaluate patients who may require
inpatient admission but alternatively may be sent home if their condition stabilizes within 24
hours. For example, a patient with a severe episode of asthma may avoid an inpatient admission
by remaining in an ED observation unit for 6 to 8 hours before stabilizing and returning home
(Derlet and Richards, 2000). These observation stays have become increasingly common for
several reasons that are related to reimbursement and technological advances (Coffey et al,
2002). As a result, more resource-intensive care is being provided in the ED. This intensity of care
places additional demand on ED resources that make it difficult to provide rapid evaluation and

Hospital Capacity, Patient Flow, and Emergency Department Use in New Jersey 5
treatment of other patients. However, observation units also free up resources that would have
been used in other hospital areas had the patient been admitted.
In teaching hospitals, ED throughput can be slowed down by the need to train residents
in emergency medicine. It has been shown in other contexts that residents often generate
inefficiencies by ordering more tests and processing patients more slowly than experienced
physicians (Kuttner, 1999; DeLia, Duck, and Cantor, 2003). This may be especially problematic in
the ED where the urgency of many conditions and the need to streamline patient flow require
rapid decision making. Despite the inefficiencies, training the next generation of physicians
remains an important mission of teaching hospitals. As a result, there is a need to balance
potentially conflicting goals of training and efficiency in the ED.
ED output refers to the discharge of patients from the ED to the next phase of care as
appropriate. Depending on the medical circumstances, the next phase may involve admission to
the hospital, transfer to a psychiatric hospital, or release from the ED with a prescription of
follow-up care from an ambulatory care provider. The inability of the healthcare system to
provide the next phase of care often manifests itself in the form of bottlenecks in the ED and
ultimately ED overcrowding.
One of the most commonly cited output bottlenecks facing the ED is the lack of available
inpatient beds, especially intensive care unit (ICU) and telemetry beds (Bazzoli et al., 2003; GAO,
2003; Lewin Group, 2002; Derlet et al., 2001; Derlet and Richards, 2000). Lack of needed beds has
been traced to hospital downsizing efforts in the 1980’s and early 1990’s. In an effort to drive out
expensive excess capacity, hospitals took beds out of service and closed entire units or facilities.
But as occupancy rates exceed 85-90%, the ability of hospitals to match the demand for inpatient
care with available beds diminishes rapidly (Forster et al., 2003; Bagust et al, 1999). This
mismatch between supply and demand for beds can lead to patient boarding or ambulance
diversion.

Rutgers Center for State Health Policy, September 2007 6
While bed shortages can be severe, they are not necessarily persistent. Analysis of data
from NJ found that hospitals routinely go through periods of extremely high occupancy followed
by periods of low occupancy (DeLia, 2006-b). During periods of high occupancy, these hospitals
often fail to meet federal benchmarks for the number of empty beds required to respond to a
mass casualty emergency. But given the existence of recurring periods of low occupancy, better
anticipation and management of variability in the demand for hospital care may play a large role
in alleviating ED overcrowding. (This idea is developed further below.) Bottlenecks in the
placement of patients into sub-acute facilities may also disrupt the flow of patients through the
ED and other hospital units.
Even when beds are available, staffing for those beds is often scarce. Hospitals across the
nation have been struggling to fill vacancies in the face of a nationwide shortage of nurses (U.S.
Department of Health and Human Services, 2002). Hospitals also struggle to recruit specialist
physicians who will work on-call to care for patients in the ED (American College of Emergency
Physicians, 2006-a). In the past, specialists would spend time on-call as part of gaining and
maintaining their admitting privileges, while also accessing a source of paying patients. But today
specialists have other opportunities to work for better pay during more convenient hours in
specialty hospitals and outpatient surgery centers. These opportunities make it difficult for
hospitals to place too many demands on specialists who often generate substantial revenues
through elective surgeries. Since the ED is a high-risk environment, concern about malpractice
liability is another factor that dissuades specialists from making themselves available on-call to
the ED. Liability issues may be especially salient in NJ, as the American College of Emergency
Physicians recently gave the state an F for its malpractice environment in its National Report
Card on Emergency Care (ACEP, 2006).
Length of stay in the ED may be increased by the need to arrange follow-up care for
patients. Alternatively, ED clinicians may provide additional services with the anticipation that
follow-up care will not be available, particularly for the uninsured and other underserved
Hospital Capacity, Patient Flow, and Emergency Department Use in New Jersey 7
patients. In some cases, emergency physicians will simply admit patients if appropriate
outpatient care cannot be arranged (Asplin et al., 2003). Also, failure to obtain post-ED follow-up
care may lead to repeat visits affecting ED input as well as output.
Measurement of ED Overcrowding
Although the problem has been well documented, rigorous measures of ED overcrowding
are not fully developed and universally available for research and evaluation. At issue is the
reliability of overcrowding measures across facilities and regulatory jurisdictions. For example,
ambulance diversion is often taken as a sign of an overcrowded ED. However, hospitals have
different criteria for going on divert status. In some parts of the nation, hospitals can divert
ambulances simply to avoid additional patients that have been diverted from other hospitals in
an apparent gaming of the system (IOM, 2006). The incentives to practice “defensive diversion”
are quite strong, as the ED is often a source of uncompensated hospital admissions among the
uninsured. Yet in other parts of the nation, such as Fresno County, CA (Anderson, 2003) and
Memphis, TN (EMS Insider, 2003), ambulance diversion has been banned entirely. Other
crowding indicators such as “excessive waiting times” also suffer from lack of standardization.
To generate consensus and standardization of ED overcrowding measures, Solberg et al.
(2003) received funding from the federal Agency for Healthcare Quality and Research (AHRQ) to
convene an expert panel who reviewed a list of 113 potential measures. Using the
input/throughput/output framework described above, the authors narrowed the original list to 38
measures (15 input, 9 throughput, and 14 output). Some of these measures such as hospital
census and occupancy rates can be calculated with existing administrative databases. Many
others require much more detailed data about hospital processes. Examples include patient
waiting time from registration to provider contact, EMS waiting time at the hospital, and the ED
occupancy rate defined as the number of registered ED patients divided by the number of staffed
treatment areas at a specific point in time. Since this information is typically contained in

Rutgers Center for State Health Policy, September 2007 8
hospitals’ internal information systems, it is possible to create a statewide reporting and
surveillance database to monitor ED overcrowding. The major challenge of doing so would
involve the creation of common measures and definitions and coordination of data reporting
across hospitals.
Management of Patient Flow
For some hospitals, the alleviation of overcrowding may involve additional capacity,
staffing, or physical space. However, there is a well-developed school of thought, which argues
that these extensive and generally costly approaches should not be tried until a hospital has fully
evaluated and optimized the flow of patients though the ED and related units. This school
emphasizes that adding new capacity to an inefficient system may just create larger facilities that
remain overcrowded. This situation occurred at Albert Einstein Medical Center in Philadelphia,
PA. After doubling the capacity of its ED, the hospital still diverted ambulances 100 to 150 hours
each month due to bottlenecks in other parts of the hospital (Greene, 2007).
Several national organizations have invested substantial resources to promote
improvements in hospital patient flow. These include the Joint Commission on Accreditation of
Healthcare Organizations (JCAHO), the Institute for Healthcare Initiatives (IHI), the Robert
Wood Johnson’s Urgent Matters Program, and the American College of emergency Physicians.
Some hospitals have worked independently with private consultants to optimize patient flow.
These efforts have generated a growing menu of strategies that hospitals may adapt and apply.
Hospitals have few options to affect ED input as this is typically driven by unexpected
emergencies and patient access to other sites of care in non-emergencies. Therefore, most
patient flow strategies focus on streamlining throughput and output. Although controlled studies
are rare, recent reports by the IOM (2006) and JCAHO (2004) document a number of promising
avenues that hospitals may pursue.

Hospital Capacity, Patient Flow, and Emergency Department Use in New Jersey 9
For example, one innovative throughput strategy is known as zone nursing. Typically,
nurses treat ED patients randomly as they arrive. This results in nurses moving to and from
different areas with little control over their workflow. Under zone nursing, nurses are assigned to
specific areas to minimize the distance and time required to treat multiple patients. The general
concept of “zone co-location” is now being tested at Boston Medical Center, which has achieved
early success with zone nursing (Wilson and Nguyen, 2004). Other promising throughput
strategies include “fast tracking” non-urgent patients to lower levels of care, streamlining ED
patient registration, and dedicated support for lab work and clinical consults ordered by ED
clinicians.
Many other strategies focus on improving ED output by streamlining patient flow in other
units of the hospital. This may be done through coordinated bed management where a “bed czar”
or patient flow team constantly monitors the flow of patients through all units of the hospital.
These individuals may use a variety of unit assessment tools such as “traffic light systems” to
coordinate operations across units. For example, a unit operating at less than or equal to 85% of
its capacity would signal green to allow patients to flow in as directed. If occupancy exceeds
85%, the unit will signal yellow, which means it will accept more patients but may soon run out of
capacity. A signal of orange would indicate utilization just below capacity. At this stage, the
patient flow leader would move to quickly direct more resources (e.g. nurses) to the unit. A
signal of red would indicate the unit is operating at full capacity. At this stage, no new patients
would be accepted until additional resources are added or existing patients are moved to another
area. After implementing this model, Luther Midelfort, a Mayo Health Systems hospital in Eau
Claire, WI, saw a steady shifting of unit codes from red to green during a six-month pilot
(JCAHO, 2004).
Other output strategies rely on more sophisticated tools from operations research. For
example, researchers have highlighted the need to manage variation in the demand for hospital
care. This research emphasizes a distinction between “natural” and “artificial” variation (Litvak,
Rutgers Center for State Health Policy, September 2007 10
Buerhaus, Davidoff et al., 2005; Litvak, Long, Cooper et al., 2001). Natural variation is the result
of random processes that are beyond the hospital’s control. Examples include traffic accidents
and heart attacks. Although these processes are random, they occur repeatedly and can be
forecasted to some degree with statistical models. In contrast, artificial variation is the result of
processes that are often overlooked but within the control of the hospital. The most common
example is the scheduling of elective surgery. To meet the needs of surgeons, surgeries are often
scheduled in heavily loaded “blocks” Monday through Thursday. During these times, elective
surgeries compete with the ED for surgical, critical care, and recovery resources. This
competition can lead to a cycle of ambulance diversion and cancelled surgeries as the supply of
these resources are outstripped by demand. In the case of naturally varying patient demand,
tools from mathematical queuing theory can be used to forecast and prevent these bottlenecks
from occurring. However, since the scheduling of surgeries is not truly random (i.e., artificial),
these tools do not apply.
Instead some hospitals have tried to minimize the artificial variability in their patient
loads by smoothing out their elective surgery schedules. This involves a reduction in scheduled
surgeries Monday through Thursday and an increase Friday through Sunday. This approach was
illustrated by a demonstration at Boston Medical Center, which took place between April 1 and
September 30, 2004 (Urgent Matters, 2004). During the same months in 2003, BMC performed 157
emergency surgeries and 334 elective surgeries were cancelled or delayed due to the unexpected
demand for emergency surgeries. Based on this prior experience, the demonstration team
calculated that it could almost always meet the demand for emergency surgery without
disrupting previously scheduled ones by keeping one operating room in reserve for emergencies.
The results of the demonstration were viewed as highly successful. From April 1 to
September 30 of 2004, 159 emergency surgeries were performed at BMC (compared to 157 during
the same period in 2003) and only 2 elective surgeries were disrupted (compared to 334 during
the same period in 2003).

Hospital Capacity, Patient Flow, and Emergency Department Use in New Jersey 11
This approach required a great deal of cooperation from surgeons who were asked to
dramatically change their usual method of scheduling surgeries. Under the usual method, which
is common for many hospitals, surgeons would “own” blocks of time in an operating room each
week and would schedule patients into these blocks as needed. Under the new method, surgeons
worked with a group of schedulers who would coordinate when and in which room elective
surgeries would take place on an as-needed basis. It remains to be seen whether other facilities
would be able coordinate its surgeons and hospital staff to achieve similar results.
A variety of less sophisticated strategies are also promising for reducing ED output
bottlenecks. These include the following:
Minimize discharge waiting times by rescheduling physicians’ discharge rounds when
occupancy rates increase,
Use housekeeping SWAT teams to clean and prepare beds as soon as patients are
discharged instead of cleaning all empty beds in an entire unit on a pre-set schedule,
Use discharge lounges where patients can complete paperwork, receive follow-up
instructions, and wait for transportation without occupying an inpatient bed.
Despite their potential, methods to improve patient flow are not universally implemented
by hospitals. This may be expected as many methods are fairly new and have not been
demonstrated on a large scale. However, other factors may stand in the way of patient flow
improvement even as best practices are disseminated. While patient flow management is
essentially a hospital-wide enterprise, the consequences of suboptimal flow tend to be
concentrated in the ED, and therefore, hidden from other parts of the hospital. As a result,
decision makers in other areas may not perceive patient flow as an urgent problem. Also,
hospital reimbursement may create incentives that work against efforts to optimize patient flow
and minimize ED overcrowding (IOM, 2006).
Scheduled surgeries are typically the most profitable services provided by hospitals
(Ginsburg and Grossman, 2005). In contrast, admissions through the ED often involve uninsured

Rutgers Center for State Health Policy, September 2007 12
patients or patients in need of less profitable services (e.g., treatment for pneumonia). Patient
flow improvement measures that disrupt elective surgery schedules may induce surgeons and
their patients to take their business elsewhere. Similarly, unclogging the ED may open more
avenues for money-losing cases to enter the hospital.
The IOM recently called on the JCAHO to strengthen existing standards to “sharply
reduce and ultimately eliminate ED crowding, (patient) boarding, and (ambulance) diversion
(IOM, 2006).” Nevertheless, recommendations like these have faced strong opposition and
remain controversial. At one time the JCAHO considered an accreditation standard that would
have banned the practice of patient boarding in the ED. It also drafted requirements for better
coordination with Emergency Medical Services (EMS) and other agencies to minimize
ambulance diversion. While these initiatives were supported by emergency physicians, they were
not strongly endorsed by hospital executives and associations (Morissey, 2004). In the end,
JCAHO revised its directives to emphasize patient flow through the entire hospital while
removing specific directives about ED overcrowding.
As mentioned above, some jurisdictions have acted independently to ban ambulance
diversion on their own. Others have developed their own systems to better coordinate EMS
response when hospitals are on diversion and have set uniform standards for when diversion is
appropriate. In NJ, hospitals can voluntarily participate in a statewide ambulance diversion alert
system. Data from that system is analyzed in the next section of the report.
Hospital Surge Capacity
The prevalence of hospital overcrowding raises concern about the capacity of hospitals
to treat a sudden surge of patients that may arise from a disaster or pandemic. An entire planning
and research apparatus has been created to address these issues, which has accelerated its work
since the terrorist attacks of September 11, 2001. Recent evaluations have suggested that
hospitals are better prepared to respond to disasters since 9/11 but still remain below the level
Hospital Capacity, Patient Flow, and Emergency Department Use in New Jersey 13
that is required (IOM, 2006; Schur et al., 2004). While it is beyond the scope of this report to fully
survey the disaster planning literature, it is useful to review the findings on hospital surge
capacity in light of the conditions currently affecting ED utilization and patient flow on a daily
basis.
An important aspect of surge capacity is the availability of beds to treat a sudden surge of
patients. As a planning benchmark, the Health Services and Resources Administration (HRSA)
has set a surge capacity standard of 500 beds immediately available for every million people
living in an area (AHRQ, 2004). In NJ, the number of empty staffed beds often fails to meet this
standard, while the standard typically is met in terms of licensed beds (DeLia, 2006-b). There has
been no national study of this issue.
Given the difficulties involved maintaining large amounts of excess capacity, a major
patient surge will require hospitals to expand well beyond their normal capacity by creating
additional patient treatment areas. This may involve placing beds or stretchers into cafeterias
and conference rooms or the use of specialized tents and mobile facilities that can be placed near
the hospital building. Although most hospitals have plans in place to ramp up surge capacity in
this way, a survey of hospitals in 2003 found that 39% had no developed plans to do so (Niska and
Burt, 2005). The IOM report also raised specific concerns about limitations in the availability of
negative pressure rooms to prevent the spread of airborne pathogens as well as shortages of
equipment such as mechanical ventilators and decontamination showers.2
During a major disaster, hospitals may create surge capacity by rearranging existing
patterns of care. The quickest and easiest way of doing this would involve postponing elective
procedures and redirecting patients seeking non-urgent care. A more difficult, but potentially
important, action involves altering the standards of care that patients receive. Under ordinary
circumstances, hospitals give priority to the most critical patients first. But when responding to a
disaster, hospitals may need to change priorities. After convening a panel of experts in
healthcare, medicine, emergency management, and bioethics, the AHRQ issued a

Rutgers Center for State Health Policy, September 2007 14
recommendation that healthcare providers responding to a mass casualty event should focus on
the goal of maximizing the number of lives saved (AHRQ, 2005). The recommendation explicitly
recognizes that this will prevent healthcare providers from “doing everything possible to save a
life” as they economize scarce resources during a surge. The agency recommends further that
public and private planners develop triage systems and legal frameworks to implement this
recommendation as part of disaster planning activities.
The AHRQ has also sponsored research to eventually assist hospitals in the process of
“reverse triage” during a mass casualty event. This research is designed to guide hospitals that
need to discharge patients early in an effort to create surge capacity for incoming patients
(Kelen, Kraus, McCarthy et al., 2006). Preliminary analysis has identified five patient disposition
categories ranked by risk of adverse medical consequences resulting from early discharge. These
categories can be used to compare the risks associated with early discharge to the risks
associated with inadequate capacity to treat a surge of patients.
Data Analysis
This section of the report provides updated analysis of ED utilization and inpatient surge
capacity in New Jersey. First annual trends in hospital utilization, occupancy, and potentially
avoidable ED use are analyzed. Then daily variation in hospital occupancy rates and surge
capacity is analyzed. Data are obtained from Uniform Billing (UB-92) records and Acute Care
Hospital (ACH) Cost Reports from 1998 to 2005. Due to limitations in data availability, analysis of
patients who were treated and released from the ED is restricted to 2004 and 2005 and analysis of
daily variation is retricted to the years 2003 through 2005. For certain analyses (noted below),
data are obtained from Quarterly Hospital Utilization (B-2) Reports and the U.S. Census Bureau.
Since trends from 1998-2003 were analyzed in the first project report, this report emphasizes
changes since 2003.

Hospital Capacity, Patient Flow, and Emergency Department Use in New Jersey 15
2.67 2.80 2.903.06 3.13 3.25 3.22 3.36
1998 1999 2000 2001 2002 2003 2004 2005
This section concludes with a brief analysis of recent ambulance diversion activity in NJ
in December 2006 and January 2007. As noted above, ambulance diversion is not a pure measure
of hospital overcrowding since the criteria for diversion varies across hospitals. Nevertheless,
ambulance diversion remains an important indicator of hospitals’ ability to manage their patient
flow and a clear barrier to healthcare access. Data on ambulance diversion is obtained from the
Jemstat system, which the NJ Office of Emergency Medical Services (EMS) makes available to
hospitals and the EMS community to share real time information about diversion activity.
Although participation in Jemstat is not universal, the data provide a snapshot of the frequency
of ambulance diversion among Jemstat participants and a sampling of reasons for its occurrence.
Annual trends
After rising steadily from 1998 to 2003, total ED visits in NJ fell slightly in 2004 (Figure 1).
In 2005, these visits rebounded to 3.36 million representing the highest annual volume of ED
visits for the study period.
Figure 1: Total ED Visits in NJ (in millions), 1998-2005
Source: Acute Care Hospital (ACH) Annual Cost Report

Rutgers Center for State Health Policy, September 2007 16
329 343 344 360 364 376 371 385
1998 1999 2000 2001 2002 2003 2004 2005
From 2003 to 2005, the NJ population grew by 1% but total ED visits grew by 3%. As a
result, ED visits per 1,000 population reached its highest level of the study period in 2005 despite
a drop in 2004 (Figure 2).
Figure 2: ED Visits per 1,000 Residents in NJ, 1998-2005
Sources: Acute Care Hospital (ACH) Annual Cost Report, U.S. Census Bureau
Growth in ED visits varies by region of the state. As in previous reports, regions are
defined according to the state’s Hospital Emergency Response and Medical Information System
(HERMIS). Specifically, the state is divided into five non-overlapping regions as follows:
1. Northeast: Bergen, Passaic, Essex, and Hudson Counties
2. Northwest: Sussex, Warren, and Morris Counties
3. Central East: Middlesex, Union, Monmouth, and Ocean Counties
4. Central West: Mercer, Hunterdon, and Somerset Counties
5. South: Burlington, Camden, Gloucester, Salem, Cumberland, Atlantic, and Cape May
Counties
Since the total number of ED visits also varies by region, Figure 3 shows the percentage
change in these visits since 1998. The level of visits is set at 100 for each region in 1998 and the

Hospital Capacity, Patient Flow, and Emergency Department Use in New Jersey 17
40
60
80
100
120
140
160
1998 1999 2000 2001 2002 2003 2004 2005
Northeast Northwest Central East Central West South
data points for the remaining years show the percentage change relative to that base year.
Although the Northeast accounts for the largest share of ED visits (33% in 2005), it experienced
the slowest growth among the HERMIS regions in recent years and even declined slightly in 2004
(Figure 3). In contrast, ED visits in the Central West region grew rapidly in 2003 and continued
growing through 2005. As a result, this region’s share of statewide ED visits grew from 7.1% in
1998 to 8.4% in 2005. ED visits in other regions grew at roughly the same pace as the state overall.
Figure 3: Percentage Change in ED Visits by Region of NJ, 1998-2005
Sources: Acute Care Hospital (ACH) Annual Cost Report, U.S. Census Bureau
ED visits patterns are driven partly by differences in population growth across the
HERMIS regions (Table 1). With some exceptions, most regions grew at a slow and steady pace
during the study period. Growth in the Northeast, which is the most heavily populated region,

Rutgers Center for State Health Policy, September 2007 18
flattened out after 2002. The Central West, which led the state in ED visit growth, also led in total
population growth. This region’s population grew at rate of approximately 1.5% per year
compared to 1.1% for the state overall.
Table 1: New Jersey Population in Millions, 1998-2005 1998 1999 2000 2001 2002 2003 2004 2005
New Jersey 8.12 8.14 8.41 8.51 8.59 8.64 8.70 8.72
Northeast 2.65 2.64 2.78 2.79 2.80 2.80 2.81 2.80
Northwest 0.70 0.71 0.72 0.73 0.73 0.74 0.75 0.75
Central East 2.31 2.33 2.40 2.44 2.47 2.49 2.51 2.52
Central West 0.74 0.75 0.77 0.78 0.80 0.80 0.81 0.82
South 1.71 1.72 1.75 1.77 1.79 1.80 1.82 1.84
Source: U.S. Census Bureau
Population-based rates of ED use also vary by region (Figure 4). Throughout the study
period, the Northeast and the South had the highest rates of ED use per 1,000 residents. The
Central West and Northwest had the lowest. Regions with smaller rates of use had faster growth
in these rates so that by 2005, the difference in per capita ED use between the highest and lowest
regions became smaller. In addition, the trend in per capita ED use has been moving slowly
upward for all regions.

Hospital Capacity, Patient Flow, and Emergency Department Use in New Jersey 19
0
50
100
150
200
250
300
350
400
450
1 2 3 4 5 6 7 8
Northeast Northwest Central East Central West South
Figure 4: ED Visits per 1,000 Residents by Region of NJ, 1998-2005
Sources: Acute Care Hospital (ACH) Annual Cost Report, U.S. Census Bureau
The composition of ED visits varies between those that led to inpatient admission and
those where patients were treated and released the same day (Table 2). Almost half of all treat-
and-release ED visits were attributable to privately insured patients followed by self-
pay/uninsured who account for almost one-fourth of these visits. In contrast, almost half of all
admissions through the ED are attributable to Medicare patients followed by the privately
insured who account for approximately one-third of these admissions. These percentages are
similar to those reported for prior years (DeLia, 2006-a).
Medicaid utilization appears fairly low in these data. This may reflect miscoding in the UB
data as Medicaid managed care patients are often coded as being enrolled in a private HMO.
Although the UB system added fields for Medicare and Medicaid HMO’s in 2003, the fields appear
to be underutilized. Therefore, Medicaid (and to a lesser extent Medicare) utilization is probably
understated and private insurance overstated in these data.

Rutgers Center for State Health Policy, September 2007 20
Table 2: ED Volume in NJ by Expected Payer, 2005 Treat-and-release ED visits Inpatient admissions through
the ED
Total Potentially
avoidable
Total Potentially
avoidable
Total volume 2,591,647 1,246,740 595,716 186,284
Percentage of volume by
expected payer
Private insurance a 49% 50% 32% 27%
Medicaid b 9% 11% 6% 6%
Medicare b 12% 11% 48% 57%
Uninsured/self-pay 23% 25% 11% 9%
Other c 7% 4% 3% 1%
Source: NJ Uniform Billing (UB-92) Records a Private insurance includes HMO’s, commercial indemnity plans, and Blue Cross Blue Shield Plans. b Patients in Medicaid and Medicare HMO’s may be classified as private insurance. c Other insurance is a residual category that includes most frequently worker’s Compensation and No Fault Insurance as well as government programs such as CHAMPUS and Veteran’s Administration Health Coverage.
A growing number of inpatient admissions through the ED are potentially avoidable
(Figure 5). Potentially avoidable admissions are measured as admissions for ambulatory care
sensitive (ACS) conditions (Billings et al., 1993; DeLia, 2004). These admissions are typically
avoidable when patients have access to timely and effective primary care (e.g., asthma,
congestive heart failure). From 1998 through 2003, ACS admissions as a percentage of total ED
admissions remained approximately constant at about 28%. This percentage rose to 31% in 2004
and remained at that level in 2005.

Hospital Capacity, Patient Flow, and Emergency Department Use in New Jersey 21
0
30,000
60,000
90,000
120,000
150,000
180,000
210,000
1998 1999 2000 2001 2002 2003 2004 2005
Num
ber o
f adm
issi
ons
0%
5%
10%
15%
20%
25%
30%
35%
Per
cent
age
of a
dmis
sion
s
Potentially avoidable hospitalizations through the EDPercentage of admissions through the ED that are potentially avoidable
Figure 5: Potentially Avoidable Hospital Admissions through the ED in NJ, 1998-2005
Source: NJ Uniform Billing (UB-92) Records
A large volume of patients treated and released from the ED also present with conditions
that are either avoidable or treatable outside of the ED (Figure 6). These conditions are defined
as those falling into one of the following three categories as defined by Billings, Parikh, and
Mijanovich (2000-b): non-emergent, emergent/primary care treatable, or emergent ED care
needed but preventable/avoidable.3 Although the volume of potentially avoidable treat-and-
release ED visits grew from 2004 to 2005, they have remained almost constant as a percentage of
total treat-and-release ED volume. Specifically, just under half of all treat-and-release patients
come to the ED with conditions that are amenable to primary care.

Rutgers Center for State Health Policy, September 2007 22
0
200,000
400,000
600,000
800,000
1,000,000
1,200,000
1,400,000
2004 2005
Num
ber o
f vis
its
0%
10%
20%
30%
40%
50%
60%
Per
cent
age
of v
isits
Potentially avoidable ED visitsPercentage of total ED visits that are potentially avoidable
Figure 6: Potentially Avoidable Treat and Release ED Visits in NJ, 2004-2005
Source: NJ Uniform Billing (UB-92) Records
The composition of potentially avoidable ED visits and admissions is similar to that for
total volume. One exception is that Medicare patients account for a larger percentage of ACS
admissions through the ED than total ED admissions.
In recent years, the ED has grown in importance as a source of inpatient admissions for
NJ hospitals. In 1998, 50% of all inpatient admissions in NJ originated in the ED (Figure 5). By
2003, this percentage had increased to 55%. This increase continued in the following two years so
that by 2005, 58% of all admissions came via the ED.

Hospital Capacity, Patient Flow, and Emergency Department Use in New Jersey 23
50% 51% 52% 54% 55% 55% 56% 58%
1998 1999 2000 2001 2002 2003 2004 2005
Figure 5: Percentage of Total Inpatient Admissions Originating in the ED in NJ, 1998-2005
Source: NJ Uniform Billing (UB-92) Records
As described above, the availability of inpatient beds has been identified as one of the
drivers of ED overcrowding. Prior research has shown that maintained beds rather than licensed
beds are much more important as a limiting factor in providing capacity for inpatient care
(DeLia, 2005; DeLia, 2006-b). Therefore, capacity analysis in this section stresses the use of
maintained instead of licensed beds.
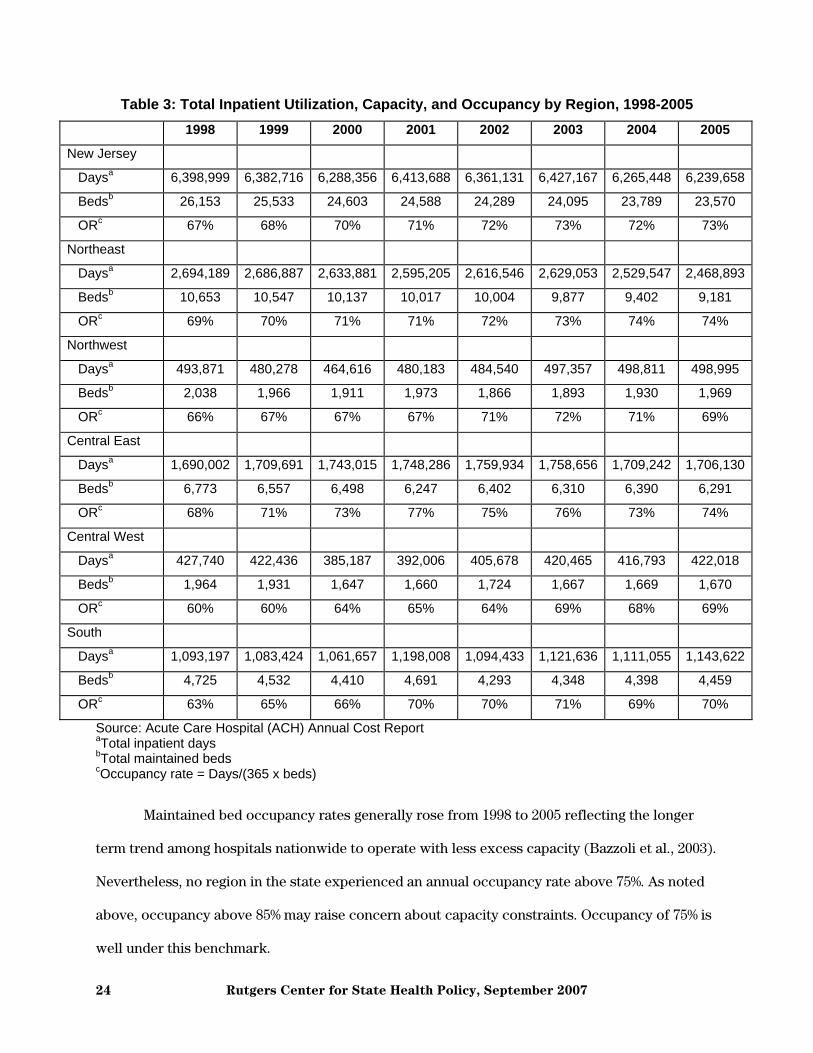
Table 3 shows annual changes in inpatient utilization, capacity, and occupancy by region
of NJ from 1998 to 2005. With a few exceptions, the Table generally shows a contraction in
capacity (i.e., maintained beds) and use of inpatient care (i.e. patient days). This contraction
reflects a combination of factors including reductions in length-of-stay, shifting of inpatient
procedures to an outpatient basis, hospital closures, and downsizing in remaining hospitals.
During the study period, 13 hospitals closed in NJ (Accenture, 2006). Closures occurred most
often in the Northeast (6) followed by the South (4) and the Central East (3). No other regions
experienced a hospital closure from 1998 to 2005. Interestingly, the Central West, which did not
experience any closures during this time, experienced the greatest reduction in maintained beds
(i.e., a decrease of 15%).
Rutgers Center for State Health Policy, September 2007 24
Table 3: Total Inpatient Utilization, Capacity, and Occupancy by Region, 1998-2005 1998 1999 2000 2001 2002 2003 2004 2005
New Jersey
Daysa 6,398,999 6,382,716 6,288,356 6,413,688 6,361,131 6,427,167 6,265,448 6,239,658
Bedsb 26,153 25,533 24,603 24,588 24,289 24,095 23,789 23,570
ORc 67% 68% 70% 71% 72% 73% 72% 73%
Northeast
Daysa 2,694,189 2,686,887 2,633,881 2,595,205 2,616,546 2,629,053 2,529,547 2,468,893
Bedsb 10,653 10,547 10,137 10,017 10,004 9,877 9,402 9,181
ORc 69% 70% 71% 71% 72% 73% 74% 74%
Northwest
Daysa 493,871 480,278 464,616 480,183 484,540 497,357 498,811 498,995
Bedsb 2,038 1,966 1,911 1,973 1,866 1,893 1,930 1,969
ORc 66% 67% 67% 67% 71% 72% 71% 69%
Central East
Daysa 1,690,002 1,709,691 1,743,015 1,748,286 1,759,934 1,758,656 1,709,242 1,706,130
Bedsb 6,773 6,557 6,498 6,247 6,402 6,310 6,390 6,291
ORc 68% 71% 73% 77% 75% 76% 73% 74%
Central West
Daysa 427,740 422,436 385,187 392,006 405,678 420,465 416,793 422,018
Bedsb 1,964 1,931 1,647 1,660 1,724 1,667 1,669 1,670
ORc 60% 60% 64% 65% 64% 69% 68% 69%
South
Daysa 1,093,197 1,083,424 1,061,657 1,198,008 1,094,433 1,121,636 1,111,055 1,143,622
Bedsb 4,725 4,532 4,410 4,691 4,293 4,348 4,398 4,459
ORc 63% 65% 66% 70% 70% 71% 69% 70%
Source: Acute Care Hospital (ACH) Annual Cost Report aTotal inpatient days bTotal maintained beds cOccupancy rate = Days/(365 x beds)
Maintained bed occupancy rates generally rose from 1998 to 2005 reflecting the longer
term trend among hospitals nationwide to operate with less excess capacity (Bazzoli et al., 2003).
Nevertheless, no region in the state experienced an annual occupancy rate above 75%. As noted
above, occupancy above 85% may raise concern about capacity constraints. Occupancy of 75% is
well under this benchmark.
Hospital Capacity, Patient Flow, and Emergency Department Use in New Jersey 25
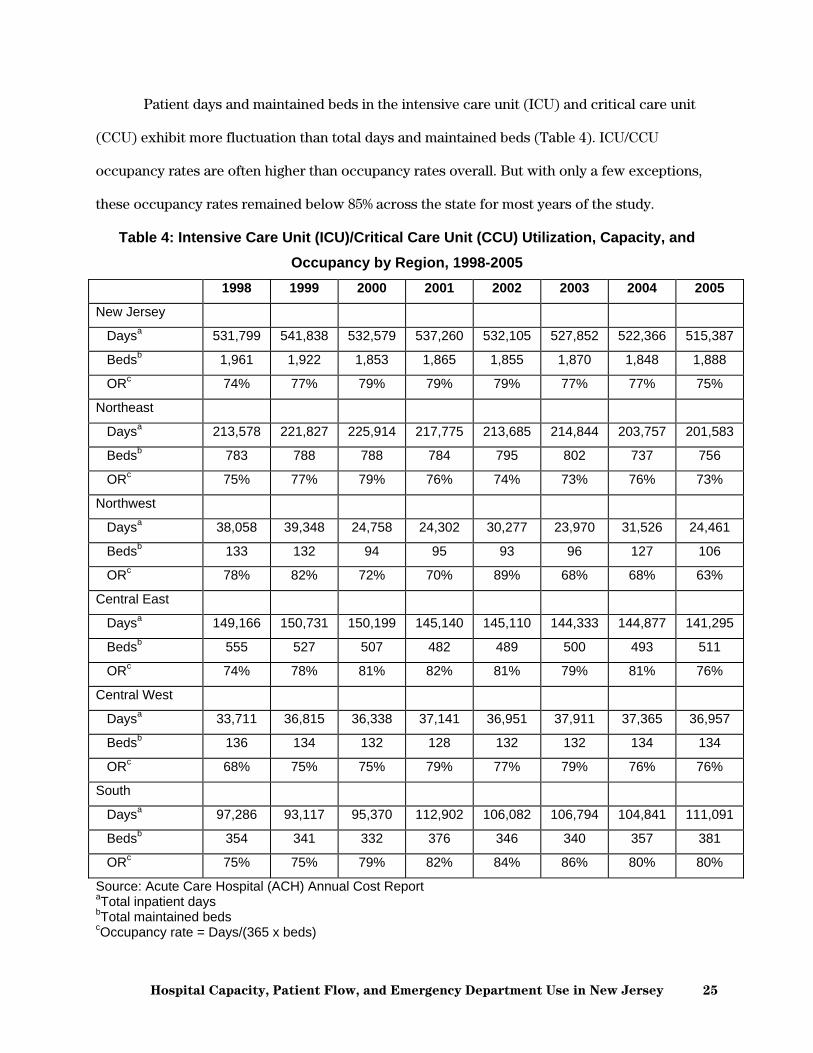
Patient days and maintained beds in the intensive care unit (ICU) and critical care unit
(CCU) exhibit more fluctuation than total days and maintained beds (Table 4). ICU/CCU
occupancy rates are often higher than occupancy rates overall. But with only a few exceptions,
these occupancy rates remained below 85% across the state for most years of the study.
Table 4: Intensive Care Unit (ICU)/Critical Care Unit (CCU) Utilization, Capacity, and Occupancy by Region, 1998-2005
1998 1999 2000 2001 2002 2003 2004 2005
New Jersey
Daysa 531,799 541,838 532,579 537,260 532,105 527,852 522,366 515,387
Bedsb 1,961 1,922 1,853 1,865 1,855 1,870 1,848 1,888
ORc 74% 77% 79% 79% 79% 77% 77% 75%
Northeast
Daysa 213,578 221,827 225,914 217,775 213,685 214,844 203,757 201,583
Bedsb 783 788 788 784 795 802 737 756
ORc 75% 77% 79% 76% 74% 73% 76% 73%
Northwest
Daysa 38,058 39,348 24,758 24,302 30,277 23,970 31,526 24,461
Bedsb 133 132 94 95 93 96 127 106
ORc 78% 82% 72% 70% 89% 68% 68% 63%
Central East
Daysa 149,166 150,731 150,199 145,140 145,110 144,333 144,877 141,295
Bedsb 555 527 507 482 489 500 493 511
ORc 74% 78% 81% 82% 81% 79% 81% 76%
Central West
Daysa 33,711 36,815 36,338 37,141 36,951 37,911 37,365 36,957
Bedsb 136 134 132 128 132 132 134 134
ORc 68% 75% 75% 79% 77% 79% 76% 76%
South
Daysa 97,286 93,117 95,370 112,902 106,082 106,794 104,841 111,091
Bedsb 354 341 332 376 346 340 357 381
ORc 75% 75% 79% 82% 84% 86% 80% 80%
Source: Acute Care Hospital (ACH) Annual Cost Report aTotal inpatient days bTotal maintained beds cOccupancy rate = Days/(365 x beds)

Rutgers Center for State Health Policy, September 2007 26
0%
20%
40%
60%
80%
100%
1/1/
2003
3/1/
2003
5/1/
2003
7/1/
2003
9/1/
2003
11/1
/200
3
1/1/
2004
3/1/
2004
5/1/
2004
7/1/
2004
9/1/
2004
11/1
/200
4
1/1/
2005
3/1/
2005
5/1/
2005
7/1/
2005
9/1/
2005
11/1
/200
5
Day of the year
Stat
ewid
e ho
spita
l occ
upan
cy ra
te
Occupancy rate based on licensed beds Occupancy rate based on maintained beds
Daily Variation in Hospital Utilization The analysis above suggests that a fair amount of hospital surge capacity exists across all
regions of NJ. However, that analysis is based on annual occupancy rates that do not reflect day-
to-day variation in hospital use. Figure 6 shows statewide occupancy rates for all NJ hospitals
combined for each day of the year from 2003 to 2005. The numerator in the occupancy rate is the
number of inpatients occupying a bed on each day. Separate calculations are done with
maintained beds and licensed bed in the denominator. Although daily inpatient use can be
measured using UB-92 data, bed supply data are available on a quarterly basis only in Hospital
Utilization (B-2) Reports. Therefore, the corresponding quarterly number is used to approximate
the daily number of beds. While this adds some error to the occupancy measures, the error is
likely to be small since hospital beds usually do not vary substantially within quarters, especially
relative to inpatient census.
Figure 6: Daily Variation in Statewide Hospital Occupancy Rates: Licensed Versus Maintained Beds, 2003-2005
Sources: NJ Uniform Billing (UB-92) records and Quarterly Hospital Utilization (B-2) Reports

Hospital Capacity, Patient Flow, and Emergency Department Use in New Jersey 27
Figure 6 shows wide variation in day-to-day occupancy rates. When measured in terms of
licensed beds, occupancy rates fluctuate mostly between 60% and 80%. At the end of the year,
occupancy rates fall precipitously as many fewer elective procedures are scheduled during this
time. Daily occupancy rates measured with maintained beds tell a different story. These
occupancy rates are concentrated between 80% and 100%. In many cases, maintained bed
occupancy exceeds 90% and on some days the number of inpatients exceeds the number of
maintained beds statewide (i.e., occupancy exceeds 100%). It is not clear from these data what
happens to patients when occupancy exceeds 100%. These data may reflect boarding of patients
waiting for a bed. Alternatively, they may reflect the transition of patients in and out of the same
bed on the same day. For example, one patient may be discharged in the morning and another
patient admitted to the same bed in the afternoon. In this case, the data used in this analysis
would count two patients in the same bed on the same day. In either case, statewide occupancy
above 100% indicates very crowded conditions in the hospital sector.
Table 5 shows in more detail how often maintained beds are at high occupancy NJ and in
the five HERMIS regions. All parts of the state spent a substantial part of each year with very
limited excess capacity in terms of maintained beds. Although the percentage of days at very
high occupancy fluctuated from year to year, no region showed a steady pattern of increasing or
decreasing time at high occupancy. However, the Northwest stands out for spending the most
time of the year at very high occupancy levels, while the Central West rarely exceeds the 85%
benchmark.

Rutgers Center for State Health Policy, September 2007 28
Table 5: Daily Variation in Hospital Occupancy Ratesa by Region, 2003-2005 2003 2004 2005
New Jersey
Average daily occupancy rate 85% 86% 85%
Percentage of days with occupancy rate ≥ 0.85 62% 65% 62%
Percentage of days with occupancy rate ≥ 0.90 32% 37% 28%
Percentage of days with occupancy rate ≥ 0.95 3% 8% 13%
Northeast
Average daily occupancy rate 85% 87% 87%
Percentage of days with occupancy rate ≥ 0.85 62% 69% 67%
Percentage of days with occupancy rate ≥ 0.90 39% 46% 41%
Percentage of days with occupancy rate ≥ 0.95 11% 19% 19%
Northwest
Average daily occupancy rate 92% 90% 89%
Percentage of days with occupancy rate ≥ 0.85 77% 74% 71%
Percentage of days with occupancy rate ≥ 0.90 66% 58% 52%
Percentage of days with occupancy rate ≥ 0.95 47% 32% 25%
Central East
Average daily occupancy rate 86% 86% 85%
Percentage of days with occupancy rate ≥ 0.85 66% 67% 64%
Percentage of days with occupancy rate ≥ 0.90 39% 33% 29%
Percentage of days with occupancy rate ≥ 0.95 8% 12% 10%
Central West
Average daily occupancy rate 73% 73% 72%
Percentage of days with occupancy rate ≥ 0.85 1% 2% 5%
Percentage of days with occupancy rate ≥ 0.90 0% 0% 1%
Percentage of days with occupancy rate ≥ 0.95 0% 0% 0%
South
Average daily occupancy rate 84% 86% 85%
Percentage of days with occupancy rate ≥ 0.85 59% 65% 65%
Percentage of days with occupancy rate ≥ 0.90 28% 39% 32%
Percentage of days with occupancy rate ≥ 0.95 2% 6% 10%
Sources: NJ Uniform Billing (UB-92) Records, Quarterly Hospital Utilization Report (B-2) aOccupancy rates based on maintained beds.

Hospital Capacity, Patient Flow, and Emergency Department Use in New Jersey 29
0
10
20
30
40
50
60
Above 85% Above 90% Above 95%
Threshold occupancy
Num
ber o
f hos
pita
ls s
pend
ing
at le
ast h
alf
of th
e ye
ar a
t the
giv
en o
ccup
ancy
2003 2004 2005
Capacity constraints also vary by individual hospital. From 2003 to 2005, more than 40
hospitals spent at least half of the year with maintained bed occupancy above 85% (Figure 7).
Particularly striking is the growth in the number of hospitals with maintained bed occupancy
above 95% for at least half of the year from 22 facilities in 2003 to 26 in 2005.
Figure 7: Number of NJ Hospitals at High Occupancya, 2003-2005
Sources: NJ Uniform Billing (UB-92) Records, Quarterly Hospital Utilization Report (B-2) aOccupancy rates based on maintained beds.
To guide state and local authorities in their emergency planning activities, the federal
Health Resources and Service Administration (HRSA) created a benchmark level of empty beds
that should be available to treat casualties from a major disaster or epidemic (Agency for
Healthcare Policy and Research, 2004). Specifically, the HRSA benchmark states that 500 empty
beds should be available per million people living in the affected area. Table 6 shows that the
number of maintained beds in NJ frequently falls below this benchmark.

Rutgers Center for State Health Policy, September 2007 30
Table 6: Empty Beds per Day by Region, 2003-2005 Licensed beds Maintained beds
2003 2004 2005 2003 2004 2005
NJ
Average number of empty
beds per day
904 841 842 371 341 357
Percentage of days that
number of empty beds <
500 per million residents
0% 1% 4% 75% 78% 75%
Northeast
Average number of empty
beds per day
1,269 1072 1085 425 350 360
Percentage of days that
number of empty beds <
500 per million residents
0% 0% 0% 68% 76% 74%
Northwest
Average number of empty
beds per day
381 460 477 154 189 220
Percentage of days that
number of empty beds <
500 per million residents
78% 67% 64% 98% 95% 92%
Central East
Average number of empty
beds per day
692 729 726 323 320 339
Percentage of days that
number of empty beds <
500 per million residents
10% 7% 13% 84% 81% 78%
Central West
Average number of empty
beds per day
866 839 860 563 568 587
Percentage of days that
number of empty beds <
500 per million residents
0% 0% 1% 44% 42% 35%
South
Average number of empty 862 796 774 360 316 333

Hospital Capacity, Patient Flow, and Emergency Department Use in New Jersey 31
beds per day
Percentage of days that
number of empty beds <
500 per million residents
0% 1% 8% 78% 80% 78%
Sources: NJ Uniform Billing (UB-92) Records, Quarterly Hospital Utilization Report (B-2)
In the Northwest, the number of empty maintained beds almost never meets the HRSA
standard (although the percentage of days below the standard has declined from 2003 to 2005).
In the Central West, the HRSA standard is met more often but is still not met at least one-third of
the time. This is somewhat surprising given the relatively low occupancy of maintained beds in
this region (Table 5). However, as shown in Table 1, the population of the Central West has
grown faster than in any other region of the state. Since hospital capacity grows much slower
than population, this region often finds itself below the HRSA benchmark even though its
hospitals are not always full.
In contrast to the case for maintained beds, the HRSA standard is almost always met for
licensed beds (Table 6). The Northwest stands out as an important exception. The Central East
also shows some time when the supply of empty licensed beds is below the benchmark. In
addition, signs of stress on the supply of licensed beds also began to appear in the South in 2005.
Strain on hospital capacity is more likely to occur during certain months of the year. On
average, maintained bed occupancy rates are at their highest from January through March and at
their lowest in December (Figure 8). The percentage of days where the number of empty
maintained beds falls below the HRSA benchmark follows the same pattern as occupancy rates.

Rutgers Center for State Health Policy, September 2007 32
0%
10%
20%
30%
40%
50%
60%
70%
80%
90%
100%
Jan Feb Mar Apr May Jun Jul Aug Sep Oct Nov Dec
Average daily occupancy ratePercentage of days with fewer than 500 empty beds per million residents
Figure 8: Variation in Statewide Hospital Occupancy and Empty Beds by Month, 2003-2005 Combineda
Sources: NJ Uniform Billing (UB-92) Records, Quarterly Hospital Utilization Report (B-2) aOccupancy rates and empty bed counts are based on maintained beds.
Day of the week is also an important predictor of strained capacity. On average, hospitals
are nearly 90% full from Tuesdays through Fridays and then they rapidly empty on Saturdays and
Sundays (Figure 9). On Mondays, volume increases substantially and rises again in the Tuesday
through Friday period. The percentage of time with limited surge capacity (i.e., below the HRSA
benchmark) follows the same pattern as occupancy rates.

Hospital Capacity, Patient Flow, and Emergency Department Use in New Jersey 33
0%
10%
20%
30%
40%
50%
60%
70%
80%
90%
100%
Mon Tues Wed Thur Fri Sat Sun
Average daily occupancy ratePercentage of days with fewer than 500 empty beds per million residents
Figure 9: Variation in Statewide Hospital Occupancy and Empty Beds by Day of the Week, 2003-2005 Combineda
Sources: NJ Uniform Billing (UB-92) Records, Quarterly Hospital Utilization Report (B-2) aOccupancy rates and empty bed counts are based on maintained beds.
Ambulance diversion In December 2006, 762 total episodes of ambulance diversion were reported by 36
hospitals in NJ’s Jemstat system (Table 7). This total amounts to approximately 24 episodes per
day or one per hour across the state. Since participation in Jemstat is not universal, this finding
may understate the extent of diversion activity in the state. Diversion episodes increased to more
than 1,000 the following January, apparently reflecting the much higher volume that hospitals
tend to see at the beginning of the year.

Rutgers Center for State Health Policy, September 2007 34
Table 7: Frequency of Ambulance Diversion in NJ, December 2006 & January 2007a
December 2006 January 2007
Number of hospitals with at least one diversion 36 38
Number of diversion episodes 762 1,062
Full/total diversion episodes 104 250
ED diversion episodes 415 543
Critical care diversion episodes 218 199
Number of diversion episodes per day 24.6 34.3
Monday 29.3 41.4
Tuesday 31.0 51.8
Wednesday 40.3 37.4
Thursday 31.8 42.8
Friday 21.4 27.8
Saturday 12.6 13.5
Sunday 12.6 18.3
Number of diversion episodes per hour 1.0 1.4
12:00AM-7:59AM 0.8 1.1
8:00AM-4:59PM 1.0 1.4
5:00PM-11:59PM 1.3 1.8
Source: Jemstat.org Status Alert aNot all NJ hospitals participate in the Jemstat reporting system. Therefore, numbers in the table may under-represent total ambulance diversion activity in NJ.
Jemstat records the service limitations that hospitals report on their diversion alerts.
More than half of all diversion episodes in both months involved diversion from the ED. More
than 40% involved critical care or were classified as full/total divert. Compared to December
2006, a greater percentage of diversions were classified as full/total in January 2007 (14% in
December versus 24% in January). The remaining episodes include diversions for psychiatric
services, special services, or CT scans as well as temporary diversions for emergency exercises.

Hospital Capacity, Patient Flow, and Emergency Department Use in New Jersey 35
In some cases, hospitals issued several diversion notices in the same day or even within
the same hour. Although hospitals may report a return to normal conditions after going on
diversion, the Jemstat system assumes that hospitals return to normal after four hours. If this is
not the case, the hospital will issue another diversion notice. In addition, some facilities will
issues diversion notices for various services within the course of a few hours or even minutes.
For example, ED diversion may be followed by diversion of critical care services, followed in
turn by full/total hospital diversion. (In this report, each of these diversions would be counted
separately in the total number of diversion episodes.)
Ambulance diversions are most common Mondays through Thursdays. After falling on
Fridays, they reached their lowest levels on Saturdays and Sundays. This pattern is similar to that
demonstrated for inpatient occupancy in the analysis above.
Diversion activity varies somewhat by time of day. Diversions are most likely to occur
during the evening hours (5PM to midnight) followed by daytime hours (8AM to 5PM). Diversion
activity slows down during the overnight hours (midnight to 8AM). Nevertheless, ambulance
diversion still occurred almost once per hour in December and more than once per hour in
January even during the overnight period.
Case Studies
Design and site selection
This section summarizes findings from the case study analysis. The goal of the analysis is
to understand sources of stress on hospital ED’s, how hospitals manage patient flow through the
ED and other units, potential barriers to implementing best practices, how hospitals coordinate
care with federally qualified health centers (FQHC’s), and implications for surge capacity. The
case studies consist of telephone interviews lasting approximately 30 minutes with key

Rutgers Center for State Health Policy, September 2007 36
informants from hospitals in NJ. Informants include ED directors, nurse managers, and patient
flow managers. A copy of the interview protocol is found in the Appendix.4
Hospitals were chosen based on occupancy and frequency of ambulance diversion. The
original design envisioned matched pairs of hospitals that are similar in occupancy and other
characteristics but with one member of the pair experiencing frequent ambulance diversion and
the other experiencing little or no diversion. Scheduling difficulties precluded the
implementation of this highly structured selection process. Instead interviews were conducted
with seven hospitals from different regions of NJ that vary in their overall diversion activity but
are not considered matched pairs. Frequency of diversion is based on data from the Jemstat
system analyzed above and from direct questioning of interviewees. Six of the seven case
hospitals participate in Jemstat. Those that indicated during the interview that they were on
diversion frequently reported more than 50 diversion episodes per month in December 2006 and
January 2007. Those that indicated during the interview that they were on diversion rarely
reported 0 to 16 diversion episodes per month. The one hospital that does not participate in
Jemstat reported in the interview that it had not diverted an ambulance in over two years. By this
classification, three case hospitals are frequently on diversion and four are rarely or never on
diversion.
Compared to the universe of all hospitals in the state, case study hospitals are larger
operate at higher occupancy, and are more likely to be members of the Council of Teaching
Hospitals (COTH). Case hospitals cover a range of areas across NJ but do not fully represent all
areas as defined by HERMIS regions. In particular, the Central West is not represented and the
Northwest is overrepresented in the case study sample. The implications of the sample
characteristics for drawing final conclusions will be outlined in the discussion section.

Hospital Capacity, Patient Flow, and Emergency Department Use in New Jersey 37
Table 8: Characteristics of Case Study Hospitals in 2005
Characteristic Case hospitals All NJ hospitals
Average number of maintained beds 462 287
Average occupancy rate 75% 70%
Days above 95% occupancy 173 113
Membership in COTH 43% 15%
HERMIS region
Northeast 29% 34%
Northwest 29% 10%
Central East 14% 23%
Central West 0% 9%
South 29% 24%
Sources: Acute Care Hospital (ACH) Annual Cost Report, NJ Uniform Billing (UB-92) Records
Overcrowding and patient flow Not surprisingly, all three of the hospitals that are frequently on ambulance diversion
report ED overcrowding on a regular basis. One informant summarized the issue stating that
“overcrowding is always a challenge.” Among the four hospitals that do not divert frequently, two
indicated that the ED is never overcrowded, one said it happens sometimes, and one said it
occurs frequently. The classification of one hospital ED as routinely overcrowded but not
routinely on diversion appears to be driven by a recent policy change at the facility. The new
policy explicitly discourages diversion and requires more quantifiable criteria for doing so (e.g.,
time between decision to admit and actual admission routinely exceeding 30 minutes and
growing). Although the ED is still overcrowded, the hospital has been able to cope with the
situation without resorting to frequent diversion episodes as it had in the past.
There was virtually no overlap in the indicators that hospitals used to define and measure
overcrowded conditions. One had specific criteria involving cycle times for beds and laboratory
tests. Another hospital defines ED overcrowding as a situation where at least 6 patients are
Rutgers Center for State Health Policy, September 2007 38
waiting for admission or at least 12 patients are waiting for care. Others simply stated that they
were overcrowded and followed up with numerous examples of how difficult it is to see patients
in a timely manner or move them on to the next stage of care (as described below).
The lack of common definitions for ED overcrowding led to a lack of common thresholds
for ambulance diversion, particularly among the three case hospitals that divert frequently. In all
three cases, diversion is based on a combination of volume, occupancy, and/or patient acuity.
Only one of the three had a specific measure that triggered the diversion decision (available beds
relative to patients waiting for admission).
Two informants provided additional detail about circumstances where ambulances
override diversion requests. These circumstances often involve life threatening cases (e.g.
cardiac arrest) or cases where the patient’s physician has admitting privileges at only one
hospital in the area. Moreover, since there are many separate ambulance providers in NJ, a
hospital’s diversion alert does not always reach all ambulance drivers. Despite these caveats,
ambulance diversion is still relied upon to manage the flow of patients through the ED. One
informant observed, “Sometimes it’s psychological for the staff. Diversion seems to slow things
down.”
Additional problems are created when several area hospitals are on diversion
simultaneously. When this happens, hospitals must revert to taking all patients who come by
ambulance. As one informant described it, “We kind of laugh when we are on divert. When we
are on divert, so is everybody else. It really becomes a moot point. Patients are coming
regardless.” These diversion overrides are described as a source of substantial frustration for
caregivers in the ED.
All of the hospital informants appeared to agree that better management of patient flow is
crucial to avoid ED overcrowding. Yet they varied substantially in the scale, scope, and success
of their efforts.

Hospital Capacity, Patient Flow, and Emergency Department Use in New Jersey 39
The three facilities that experienced little or no overcrowding described detailed patient
flow management systems that run through the entire hospital. For example, two of these
hospitals use traffic light systems similar to those described in the literature review above. When
the volume in inpatient units or ancillary service areas (e.g., labs) reaches a certain level,
automatic warnings are generated that indicate a need for backup resources. When this occurs,
more resources (e.g., nurses) are brought to the area or alternatively, patients are diverted to
another area that can provide the needed service (e.g., a lab on another floor). This system is also
used by one of the hospitals to determine when patient volume is high enough to justify
ambulance diversion, which occurs only rarely at this facility. The third hospital in this set
emphasized the measurement of cycle times through various stages of the care process (e.g., the
time interval between the request and receipt of lab results). In the informant’s words, “We
analyze everything that moves in the ED.” These measures allow managers in the ED and other
departments to move quickly when cycle times begin to slow down. The informant offered a view
of the big picture saying, “We drive the entire hospital through the ED … The ED runs the flow of
the facility.”
The four hospitals with overcrowded ED’s have also made attempts to improve patient
flow. While some of their attempts were believed to be successful, the procedures that were
implemented were generally not as comprehensive or far reaching as the ones used by the other
three hospitals described above. Some of the approaches that helped reduce, if not eliminate, ED
overcrowding include the following:
Use of hospitalists to expedite the movement of patients into different levels of care
Creation of a back-up team of on-call nurses to fill in when scheduled nurses call out
Bed huddles to assess conditions in the ED and other units on a daily basis.
One informant also described some success with a procedure where patients who used to
be boarded in the ED are sent up to the units immediately. Having a patient board in the unit
Rutgers Center for State Health Policy, September 2007 40
hallway creates a visible incentive to speed up the admission process. However, this informant
added that the procedure cannot be done if the floors themselves are overwhelmed.
Two hospitals with overcrowded ED’s described how recent expansions of capacity did
not alleviate overcrowding. “They heard it was new and they showed up”, was the assessment of
one ED manager who observed an increase in volume that came with the added capacity.
Another commented that the expanded capacity had no effect on ambulance diversion hours
adding that, “It’s not volume. It’s process.” Yet, like several others, this individual described a
number of difficulties involved with getting other parts of the hospital to coordinate their
operations with the needs of the ED. In stark contrast to the above case where the ED “drives the
hospital”, another informant described the position of the ED as follows, “The ED serves as a
buffer for everything that’s going on in the hospital, inpatient beds and stuff like that. The ED is
the sponge for all the areas of overflow.”
Almost all of the interviewees discussed difficulties they faced with timely discharge of
patients. In many facilities, ED volume increases after 11AM. Ideally, patients ready to end their
inpatient stay would be discharged by then, making room for admissions through the ED.
However, admitting physicians are often not available to give their final signoff until later in the
day. Instead, these physicians often spend their mornings holding office hours or performing
surgeries. As a result, discharge orders are written at different times of the day depending on the
physician’s schedule. Coordination problems increase when patients need to consult with more
than one physician before discharge. Some informants also described difficulties involved with
getting family members to pick up discharged patients in the morning. Due to work and other
responsibilities, family members are often not available until the evening hours.
Informants described different methods to improve the timeliness of discharges.
One facility with only limited episodes of overcrowding emphasizes the need for timely discharge
to physicians and patients’ families as part of the formal admission process. This method was
viewed as helpful, if not definitive, in improving timely discharge. Another informant in an

Hospital Capacity, Patient Flow, and Emergency Department Use in New Jersey 41
overcrowded ED found it much more difficult to achieve this type of coordination. In this
hospital, an attempt was made to ask admitting physicians to expedite their discharges when the
ED became overcrowded via notes in the physicians’ lounge. Since the ED was routinely
overcrowded, the requests were very common and ultimately “annoying” to the physicians. As a
result, this method was viewed as unsuccessful. The informant added, “Our hands are tied. I can’t
make a physician do it (discharge quickly). We can only suggest that they do.”
Another facility considered the creation of a discharge lounge to hold patients before they
are released from the hospital but ultimately decided against it. The informant reasoned that with
declining length of stay, patients are discharged sicker than they used to be and would not be
comfortable in a temporary holding area. As a result, this arrangement would be very costly in
terms of reducing patient satisfaction.
The types of patients seen by hospitals also play a role in ED overcrowding. Several
informants emphasized strongly the difficulties created by a growing number of psychiatric
patients coming to the ED. These difficulties were described by facilities in wealthy suburban
areas as well as those in economically struggling inner cities. Psychiatric patients were described
as creating ED stress along a number of dimensions. The care of psych patients is resource-
intensive as they require close and continuous supervision. They often spend substantial time in
the ED as providers search for psychiatric beds in the hospital or elsewhere in the community to
place them. Moreover, psychiatric patients often “act out” and create distractions to other
patients and clinicians in the ED. A common theme across many interviews was the desire for
relief from the growing volume of psychiatric patients by expanding mental healthcare capacity
or through some other policy intervention. One informant described the situation dramatically
stating, “We could provide better patient care if we were not babysitting the criminally insane.”
Informants described similar problems created by intoxicated patients who are brought
to the ED and must be held there until they are sober. In some cases, intoxicated individuals

Rutgers Center for State Health Policy, September 2007 42
make repeat visits to the ED. Although these patients are offered substance abuse counseling and
related services, these services are commonly turned down.
Informants were asked about the issue of physicians referring patients directly to the ED
as discussed in the literature review above. Most said the practice was common. The most cited
reasons for doing so included convenience, the ability to obtain quick results, and the need to
perform tests that could not be done in the physician’s office. None of the informants believed
that physician referral to the ED was related to insurance status. One informant suggested that
physicians may get around cumbersome pre-approval processes of health plans by sending
patients to the ED instead of making arrangements for imaging and other diagnostic services. In
addition, two informants indicated that physicians no longer admit patients directly to units.
Instead, patients will be sent directly to the ED and admitted from there based on availability of
beds.
Informants at teaching facilities discussed the role of residents in the ED. Most agreed
that residents can slow down patient flow. However, these facilities believe they are able to
adjust for this with appropriate staffing and supervision by attending physicians. One informant
discussed cases where they will temporarily disrupt teaching activity to deal with overcrowded
conditions. According to another informant, residents eventually move from becoming a drag on
patient flow to becoming “flow enhancers” as they gain more experience.
Queuing and smoothing
Informants were asked about the implementation of queuing theory and the smoothing of
elective surgery schedules as described in the literature review above. Although the general
concepts are viewed favorably, a number of practical barriers to implementing them are
common. One informant believed that “too much modeling does not give bang for the buck”,
adding that formal operations research is often complicated and requires training. Only one
informant described efforts to explicitly smooth the elective surgery schedule as a way of

Hospital Capacity, Patient Flow, and Emergency Department Use in New Jersey 43
improving patient flow through the ED. The results of the effort are believed to have been
positive. This informant observed that “Surgeons are beginning to appreciate the problem (of
bottlenecks in the ED).” However, like most other interviewees, this informant was also aware of
a “fine line” for how much hospitals could ask their surgeons to accommodate the needs of other
hospital units, as surgeons bring the most lucrative cases into the hospital. Although the benefits
of smoothing would be greatest when applied to high-volume surgeons, this informant pointed
out that the loss of profitable business would also be highest if these surgeons were to be
alienated and move their patients to another facility. Another informant echoed this concern by
describing how the rearrangement of surgery schedules, while useful to the ED, would involve
“deep financial costs to the hospital.”
Primary care and chronic disease management
According to all hospital informants, patients commonly use the ED for non-emergent
and primary care related services. However, there was a clear split between hospitals in wealthy
and poor areas over the effects this had on their operations and the need for specific efforts to
address the problem. In wealthier areas, use of the ED for non-emergencies is generally viewed
as random and episodic. Although some patients seek care for chronic diseases, most informants
in these areas did not describe theses cases as particularly burdensome to their operations.
Although uninsured and indigent cases are not common in these areas, one informant described
situations where insured patients, particularly the elderly, come to the ED after other outpatient
treatments failed to resolve their problems. These include individuals with chronic conditions as
well as patients who received antibiotics or other treatments that proved to be ineffective.
Hospitals in low-income areas have a very different experience. These facilities described
a large volume of cases that come to the ED with late stage illnesses such as cancer and kidney
failure or come repeatedly for chronic conditions such as asthma, diabetes, and congestive heart
failure. Because the volume of these cases is so large and the problems are so severe, these
Rutgers Center for State Health Policy, September 2007 44
facilities have embarked on efforts to improve primary care in the ED with emphasis on the
management of chronic diseases. One informant described this undertaking as the “wave of the
future” for hospital ED’s.
In one facility, an ED case management system has been developed and implemented to
provide comprehensive treatment and coordination of services to patients, especially those with
overlapping medical, psychiatric, and financial problems. The idea was initially resisted by the
hospital, since the ED is traditionally a place where patients are stabilized and moved on to the
next level of care. However, once implemented, the program was viewed as giving the most
“bang for the buck” in terms serving patients and reducing the number of repeat visits to the ED.
In one example, a diabetic patient, often in ketoacidosis, had been coming to the ED 70 times per
year. After entering the ED’s case management program, the patient comes to the ED only once
or twice per year.
Informants were asked about the coordination of primary care services with nearby
FQHC’s. Although some suggested that it would be useful to do so, none had any particular
arrangements in place. More often, these hospitals had their own clinics or other providers that
they referred to when needed.
Anticipated response to hospital closure
As part of the interview, hospital informants were asked how well they would be able to
handle increased volume from a hospital closure, particularly in the ED. Five of the seven
informants expressed strong reservations or outright alarm at this prospect. According to one
informant, the hospital is “at a tipping point right now. If that (nearby closure) were to happen, it
would have draconian effects in this environment.” Interestingly, this particular informant had
spoken confidently about the hospital’s ability to mange its current patient flow and its
avoidance of hospital diversion. However, this hospital also operates at very high occupancy
(above 90%) throughout most of the year suggesting that it would be difficult to add more volume

Hospital Capacity, Patient Flow, and Emergency Department Use in New Jersey 45
without new capacity. Another informant from a hospital that is frequently overcrowded and
frequently on diversion went so far as to question the wisdom of previous closures. The
informant linked prior closures to a recent influx of ED patients remarking that, “It makes you
wonder if that was the right choice.” An informant in an ED that is currently not overcrowded
and not frequently on diversion expressed a similar reservation. This informant suggested that
the new volume would be “hard to handle” and expressed concern about the number of other
hospitals that are currently on diversion.
Two informants felt fairly comfortable with the prospect of nearby hospital closures.
Both described ongoing plans that anticipate and seek out a growing volume of patients coming
to their hospital. One believed that talk of a potential closure in the area was already sending
new patients to their facility, as patients and physicians begin preparing for what might come.
Another had a fairly recent experience with a nearby closure. Although volume at the facility did
increase in response, it did not cause a huge spike in the number of patients seeking care.
However, this hospital already describes its ED as overcrowded and diverts ambulances
frequently. This raises the question of how well it could meet additional patient care demands, if
another closure took place.
Surge capacity
All case hospitals have plans in place to deal with a surge of patients in a large-scale
emergency. They described a variety of drills and tabletop exercises that have been done to
prepare for specific emergencies (e.g., train crashes, avian flu, bubonic plague). These hospitals
also have plans in place to create overflow areas within the facility – e.g., cafeterias, tents,
conference rooms. Some hospitals have already implemented their plans in real emergencies
such as a recent building fire and an airplane crash.
Hospital informants also spoke of plans to create surge capacity via early discharge or
transfer of patients. None of the facilities have a formal reverse triage system in place for

Rutgers Center for State Health Policy, September 2007 46
emergencies. Instead most would look to admitting physicians to judge which patients could be
discharged early. If these physicians are not available, a designated physician would be charged
with making decisions to empty out beds if needed. One informant expressed concern about the
availability of transport services to move these patients out of the hospital, since ambulances
would likely be busy bringing casualties into the hospital. In addition, concerns were raised
about the ability to discharge patients early after health system changes have already reduced
patient lengths of stay and patients still receive fairly intensive services on the last day of their
stay.
Hospitals that are part of systems have plans in place to transfer patients within the
system to make room for critically injured patients. However, coordination among hospitals that
do not belong to a common system appears to be less developed. Moreover, although they were
open to working with FQHC’s and other non-hospital providers during a mass casualty event,
none of the case hospitals had specific plans to do so. One informant described the need for
broader legal and operational frameworks to be created before other facilities could be more
integrated into disaster planning. This informant also added that fear of potential lawsuits would
limit plans to “think outside the box” in response to extreme emergencies.
Discussion
Hospital occupancy and capacity
The analysis above highlights a number of issues that are critical for assessing the
amount and distribution of hospital capacity in NJ. The importance and timeliness of this topic is
underscored by the creation of the Commission on Rationalizing Healthcare Resources by
Governor Corzine. Although the Commission’s mandate is fairly broad, hospital capacity will be a
major focus.

Hospital Capacity, Patient Flow, and Emergency Department Use in New Jersey 47
It has been argued here and elsewhere (DeLia, 2006-b) that annual bed and utilization
statistics give a misleading picture of the alignment between supply and demand for hospital
services. Every year, individual hospitals, as well as groups of hospitals within the same
geographic region, experience recurring periods of very high occupancy followed by periods of
low occupancy. This makes average annual statistics inappropriate for an assessment of
community need for hospital beds. In addition, staffing shortages also play an important role in
constraining the supply of hospital care, as hospitals often have a large number of beds that are
licensed but not necessarily staffed. Concern over the supply of hospital staff, particularly
nurses, was also raised by case study participants.
During peak periods, hospital capacity in the state appears to be extremely constrained.
On 47 days in 2005, more than 95% of all staffed beds in NJ were occupied. This number
increased from 29 days in 2004 and 11 days in 2003. On these days, there would be almost no
immediate surge capacity available to respond to a major emergency such as a natural disaster or
terrorist attack without displacing existing patients. On more than ¾ of the days in 2003 through
2005, the state had less than 500 empty staffed beds available per million residents, which is a
surge capacity benchmark developed by the federal Health Resources and Services
Administration (AHRQ, 2004). Some regions, particularly the Northwest part of the state, fail to
meet this threshold more often than others.
The surge capacity benchmark chosen by HRSA was derived mostly by intuitive
judgments rather than an empirically derived number. Nevertheless, it is clear that hospital
capacity in NJ goes through periods of high stress, which is increasing in frequency. Although the
state’s population is not growing as rapidly as in other parts of the nation, population growth
does occur at a pace of more than 85,000 people per year. Population growth combined with
population aging suggests that the demand for hospital care in the future will not simply fall off
even as many services move to ambulatory surgery centers and other outpatient settings.
Rutgers Center for State Health Policy, September 2007 48
It is interesting to note that even annualized statistics do not support the claim that NJ
hospitals have unusually low occupancy rates. According to data from the American Hospital
Association, the overall occupancy rate in NJ is 73% compared to 65% nationwide (Accenture,
2006). Nevertheless, the likelihood of experiencing high occupancy is quite varied among
hospitals in the state. In 2005, for example, 26 facilities spent more than half of the year (i.e.,
more than 182 days) at or above 95% occupancy of staffed beds. Other facilities experienced very
high occupancy much less frequently if at all.
Hospitals that operate at low occupancy are often targeted as candidates for potential
closure. Yet closure of these low-occupancy facilities could potentially overload remaining
hospitals, especially during their peak periods. In NJ, seventeen general care hospitals have
closed since 1995 (Accenture, 2006) and more closures are currently under consideration. While
continued consolidation may be appropriate in some areas, the ability of remaining hospitals to
absorb additional volume will eventually diminish as more closures occur.
Research on hospital closures in California demonstrated this possibility and concluded
that the ability of nearby hospitals to treat the patients of formerly closed hospitals diminished as
more closures occurred (Sun et al., 2006). In addition, interviewees at many of the case study
hospitals in NJ revealed substantial reservations about their ability to treat additional patients
from closing hospitals. One interviewee went so far as the question the wisdom previous closures
in the area. It is important to note that the case study hospitals are generally larger, operating at
higher occupancy, and more likely to be major teaching hospitals than hospitals statewide.
Hospitals with these characteristics are less likely to face the prospect of closure themselves.
However, they would be expected to treat additional patients from facilities that did close. Their
ability to do so is an important consideration when evaluating the costs and benefits of any
specific proposal for hospital closure.
The frequency of ambulance diversion in NJ underscores the stress on capacity that is
often experienced by hospitals in the state. Data from late 2006 and early 2007 reveal that, on

Hospital Capacity, Patient Flow, and Emergency Department Use in New Jersey 49
average, an ambulance diversion occurs once every hour in NJ. This is similar to an often cited
national statistic that there is a hospital on diversion about once every minute in the U.S. (Burt et
al., 2006). Moreover, the reported number of diversions in NJ may represent an undercount, since
participation in the state’s diversion alert system (used in this report) is not universal.
Nevertheless, the implications of ambulance diversion on patient access to care are not
totally clear. For patients in truly critical condition, ambulances will override diversion requests
as needed. Also, when several nearby hospitals go on diversion at the same time, it becomes
impossible for ambulances to honor the requests and so hospitals on diversion continue to
receive patients. As a result, the effect of multiple and simultaneous diversions in an area is
difficult to assess. The IOM report raised concern about hospitals going on diversion strategically
to avoid taking patients, particularly unprofitable ones, from other diverting facilities.
Alternatively, hospitals with some available capacity may see it quickly disappear as other
facilities go on diversion, a situation that was emphasized by some case study participants. As a
result, even though a diversion override will get the patient into the hospital, the attempt at
diversion may be a signal of difficulties patients will face in obtaining the full range of required
treatment in a timely way.
Hospital surge capacity
The recurring stress on hospital capacity in NJ has direct implications for disaster surge
capacity. However, case study participants provided a more nuanced view of their ability to
respond to a mass casualty event. Along some dimensions, participating hospitals appear to be
better prepared than hospitals nationwide as assessed by the IOM. But along others, hospitals
appear to struggle with the same issues raised in the IOM report.
All participants described the existence of detailed disaster planning protocols, which are
routinely rehearsed and sometimes tested in real emergencies that have come up such as a
building fire and a small airplane crash. They also elaborated on their plans to use tents,

Rutgers Center for State Health Policy, September 2007 50
cafeterias, and overflow areas to create surge capacity. Along these dimensions, case hospitals
appear to be better prepared than indicated for hospitals nationally in the IOM report. Case
hospitals also have systems in place to create surge capacity through early discharge or transfer
of existing patients. These typically consist of a chain of command for ordering early discharge
based on individual judgment rather than formal clinical guidelines.
Some participants spoke about drills and other coordination activities with law
enforcement and other agencies that would be called upon to respond to a large emergency. Still,
other described areas where coordination is less developed. For example, hospitals in the same
system appear to be seamlessly coordinated for all emergencies. In contrast, very little joint
planning has occurred among hospitals not formally linked by system affiliation. Although many
participants had a positive view of enhanced disaster response coordination with FQHC’s, most
said they had no systems in place to pursue it. During the course of the project, attempts were
made to obtain the perspectives of FQHC’s on these issues. However, a variety of scheduling
problems made it impossible to obtain a set of FQHC participants that could be included in the
study.
Coordination of emergency medical services (EMS) is also problematic in the view of
some hospital informants. This problem was raised as part of broader discussions of ambulance
diversion under usual circumstances but came up again in discussion of disaster management. A
major issue is the lack of coordination among different ambulance services that are run privately
or on a volunteer basis. One participant expressed a specific EMS concern related to early
discharge of patients that might be required during an emergency. Specifically, ambulances may
be so overwhelmed in their efforts to bring casualties to the hospital that there would be no
capacity to bring early discharge/transfer patients to other facilities. Many of these concerns
echo concerns that were raised on a national scale by the IOM report.
All of these assessments should be viewed in light of some caveats about the case study
hospitals. As mentioned above, case facilities are generally larger, operate at higher occupancy,

Hospital Capacity, Patient Flow, and Emergency Department Use in New Jersey 51
and are more likely to be major teaching hospitals than the statewide average. They are also
more likely to be located in the Northwestern region of the state and less likely to be in the
Central East compared to the geographic distribution statewide.
Hospital efficiency and patient flow
Periodic stresses on hospital capacity in NJ might be alleviated with improvements in the
operating efficiency of hospitals. As described in the literature review, a number of national
organizations have worked with hospitals to develop methods for achieving this goal. The case
study analysis above reveals that hospitals in NJ are engaged in a number of these efforts, albeit
with varying levels of commitment and success. An important determinant of success in
minimizing bottlenecks in the ED is the extent to which hospitals are able to coordinate across
“silos” within the hospital. Hospitals that have been successful are able to communicate
information rapidly across units and respond quickly when a particular area is reaching capacity.
Other hospitals, while attempting to do this, report a greater number of problems in achieving
this level of coordination.
A common problem is the inability to discharge patients from inpatient beds in a timely
way, which creates bottlenecks for ED patients who are waiting for admission. In general,
admitting physicians have little incentive to rearrange their practice schedules to avoid these
bottlenecks, since their practices are not affected by patient flow through the ED. Hospitals that
emphasize timely discharge as part of a hospital-wide admission policy generally have more
success at moving patients quickly from the ED to the inpatient floors. In contrast, hospitals that
make intermittent requests for quicker discharges from individual physicians continue to struggle
with patients boarding in the ED.
A similar problem concerns the coordination of elective surgery schedules with the flow
of patients through the ED into surgical and intensive care areas. Although case study
participants saw value in this coordination, many described institutional barriers to achieving it.

Rutgers Center for State Health Policy, September 2007 52
Consistent with prior research (IOM, 2006; Ginsburg and Grossman, 2005), participants
emphasized the financial costs to the hospital of creating too many disruptions to the existing
flow of elective surgeries, which are important sources of revenue.
Hospitals have a clear interest in improving their own patient flow. But as shown above,
the incentives to pursue these interests may be blunted by divergent priorities across hospital
units and broader health system issues that reinforce the divergence. Given the implications for
patient access to care and emergency response, this situation is of public as well as private
concern. However, public policy responses are limited by a lack of standardized data on patient
flow performance and how policy initiatives can improve or impede that performance.
Measurement of patient flow performance is an emerging field of research. This research
builds and elaborates on ED overcrowding measures described in the literature review above as
well as other unpublished work conducted within the hospital sector. In 2006, leaders in the field
convened a summit on ED performance measures focusing specifically on patient flow (Welch et
al., 2006). The summit concluded with a set of recommendations for specific performance
measures and definitions of hospital peer groups for making comparisons. This initiative is
currently being pilot tested by an ED collaborate group in Maryland.
The expanding scope of care in the ED
Both quantitative and qualitative analyses document a wide range of services provided in
the ED. As documented in the second project report (DeLia, 2006-a), a large number of patients
come to the ED for primary care or for conditions that primary care might have prevented. These
include, for example, acute episodes of asthma and congestive heart failure as well as ED visits
for follow-up care and treatment of non-emergent infections. This report finds that this
potentially avoidable use of the ED has grown slightly in recent years. Ambulatory care sensitive
(ACS) admissions through the ED grew from 158,480 in 2003 to 186,284 in 2005 and accounted
for 31% of all ED admissions in 2005. The number of potentially avoidable treat-and-release ED

Hospital Capacity, Patient Flow, and Emergency Department Use in New Jersey 53
visits grew slightly from 1.15 million in 2004 to 1.24 million in 2005, accounting for 47% and 48%
of all treat-and-release ED visits, respectively.
Case study hospitals all reported experience with potentially avoidable ED use but varied
substantially in the volume of such use as well as their attitudes and responses toward it. Two
participants in hospitals with low to average volumes of potentially avoidable use gave very
different perspectives on the matter. The first described the process as being expected and
routine noting that “we don’t debate that with the patients … we thank them for coming and
provide care.” In contrast, when asked to discuss public policy ideas applicable to the ED, the
second felt that non-emergent use of the ED could be avoided with better education of patients
and even physicians who often directly refer patients to the ED.
Most case study hospitals have “fast track” or similar systems in place to treat non-
emergent cases and routinely refer patients to their outpatient clinics for non-emergent care.
However, two hospitals operating in inner cities find themselves in need of a much more
elaborate response to primary care-related use of the ED. Faced with a large and growing volume
of chronic and late-stage illness, these facilities have begun to develop systems of case
management and disease management within the ED itself.
These systems represent a radical shift away from the traditional role of the ED, which
emphasizes rapid diagnosis and stabilization of patients with the goal of curing them or moving
them to the next level of care. However, changing conditions of chronic disease prevalence,
access to primary care, and regulatory requirements for ED care have steadily eroded this
traditional role in many hospitals. As a result, an expanded role for the ED may be the best
response to these changes in many service areas (Siegel, 2004).
Hospital ED’s, nationally and in NJ, have also become important providers of care for
mental health and substance abuse patients (IOM, 2006; DeLia, 2006-a). However, case study
participants were much less willing to accept this role for the ED than they were in terms of
primary care. To the contrary, most described difficulties they face in providing appropriate care

Rutgers Center for State Health Policy, September 2007 54
and finding placement for individuals, particularly the mentally ill, who could not be well cared
for in their facilities. These patients are also considered very distracting to other patients and the
staff trying to care for them. Ultimately, a general desire was expressed for health policy
initiatives that would shift these patients out of acute care hospitals and into more appropriate
settings such as psychiatric hospitals or ambulatory mental health clinics.
Conclusion
Like their counterparts nationwide, hospitals in NJ face periodic stress on capacity,
which often manifests itself in the form of delayed care in the emergency department (ED).
These recurrent strains on capacity, more so than annualized occupancy rates, should be
considered in evaluating the adequacy of hospital capacity in a particular community. Stress on
hospitals can be understood and managed in terms of factors that affect ED input (i.e., the
number of patients coming to the ED for care), throughput (i.e., the movement of patients
through the ED), and output (i.e., the availability of resources in the next level of care). Though
performance is uneven, hospitals have a great deal of ability to affect ED throughput and output
through patient flow management techniques.
However, a variety of broader health system issues limits the extent to which hospitals
can control their ED input and some aspects of ED output. Trends in ED input are heavily
influenced by the inability of patients to gain access to primary and other specialized care
(especially mental health) outside the hospital. Streamlining ED output is often hampered by the
longstanding disparity in reimbursement for elective surgeries versus other hospital services,
which makes it costly to disrupt elective surgery schedules. In the absence of broader health
system reform, hospitals will have to find ways to serve an expanding range of patients in a
constrained environment. Public policy efforts to assist hospitals in this task would benefit from
regular surveillance of hospital patient flow measures and other efficiency indicators.

Hospital Capacity, Patient Flow, and Emergency Department Use in New Jersey 55
Appendix
Questions for Case Study Participants
Thank you for agreeing to participate in the study. This interview is expected to take
approximately 30 minutes to complete.
1. What is your current position/title and what are your current responsibilities?
2. Does your ED experience overcrowding on a regular basis?
a. How do you measure overcrowding?
Probe: Patient flow dashboard system
b. How often has the ED been overcrowded in the past 3 months? By what
measures?
c. How often has your ED diverted ambulances in the past 3 months?
d. Do you participate in the state’s JEMSTAT system to monitor ambulance diversions?
3. Can you identify predictable periods of peak and off-peak demand for various services in the
ED?
a. Do you forecast demand and use the results for planning?
4. What do you see as the greatest challenges to meeting the ongoing demand for ED care? Probe:
bed capacity, staffing, equipment
5. What are the major barriers to efficient patient flow through the ED?
Probe: available beds, staffing, on-call specialists, coordination across hospital units,
discharge to sub-acute care
a. Outpatient surgeries and observation stays in the ED require hospital resources but are
not counted in inpatient occupancy statistics. How do these services affect capacity
management and patient flow?

Rutgers Center for State Health Policy, September 2007 56
6. If a nearby hospital closed, how difficult would it be to serve patients from the closed facility,
particularly in the ED?
7. Are there any approaches to alleviate ED overcrowding that you have tried and found
particularly successful or unsuccessful?
Probe: redesigning elective surgery schedule, patient flow procedures in other units,
hospitalist/nurse bed expediter.
a. Has your hospital reviewed or implemented flow management strategies suggested by
JCAHO, Institute for Healthcare Improvement, or the Urgent Matters Program?
8. What percentage of patients coming to the ED come for primary care or conditions that
primary care may have prevented?
a. How does it affect ED operations when patients use the ED for primary care? Probe:
impact on patient flow
9. Do you have a “fast track” to see patients that are more appropriate for primary care than ED
care?
a. What percent of visits are “fast track”?
b. Is there different staffing for “fast track” (not ED trained)
10. Are there special problems related to uninsured or immigrant patients that affect ED
operations?
Probe: Financial stress, Casemix, social/language problems
11. Do private physicians send patients to the ED for evaluation rather than seeing the patients
themselves?
a. Are patients sent from private offices “boarded” in the ED?
12. Do you have a large number of repeat ED users?
a. Do they create special challenges?
b. Do you have specific procedures to identify and direct the care of these patients?

Hospital Capacity, Patient Flow, and Emergency Department Use in New Jersey 57
13. Do you have arrangements with local FQHC’s or primary care centers to provide follow-up
care after an ED episode?
Probe: Shared clinical data, shared appointment system
14. Do you have physician training programs?
a. Do these programs improve or impede ED efficiency?
Probe: time to initial evaluation, time to complete evaluation, number of tests ordered, re-
evaluation of patient by attending physicians
15. In the event of a major disaster, what kinds of immediate actions would be most important to
make significant additions to surge capacity?
Probe: cancel surgeries, early discharge/transfer (criteria), use of non-clinical space for
overflow
16. Have you found it necessary to take any of these or similar actions in the past year?
17. How difficult would it be to staff licensed beds that are currently not staffed?
a. Have any of these beds been permanently taken out of service?
18. In the event of a disaster, is there a specific role that could be played by FQHC’s or primary
care centers to support your hospital’s emergency response?
Probe: Screening/triage, shared staff, receive patient overflow, create temporary inpatient
unit
19. Do you find that most disaster planning activities enhance or detract from other non-disaster
related patient care activities?
20. What sorts of public policy initiatives would you consider most important to support or
improve hospital emergency care?
Thank you again for your participation.

Rutgers Center for State Health Policy, September 2007 58
Hospital Capacity, Patient Flow, and Emergency Department Use in New Jersey 59
Endnotes
1. Some analysts have commented that so-called “prudent layperson” mandates may also have
contributed to the rising trend in ED utilization (Burt and McCaig, 2001; JCAHO, 2005). These
mandates require insurers to provide reimbursement for ED visits that are made by policyholders
who “reasonably believe” that they have an emergent medical problem. However, a recent study
has cast doubt on the power of prudent layperson laws to affect ED volume (Hsia, Chan, and
Baker, 2006).
2. In the event of a disaster, hospitals may also receive assistance from federal emergency
medical assets such as the Federal Medical station and other mobile medical units maintained by
the federal government.
3. These conditions are defined more specifically as follows: 1) Non-emergent – The patient’s
initial complaint, presenting symptoms, vital signs, medical history, and age indicated that
immediate medical care was not required within 12 hours. 2) Emergent/Primary Care Treatable –
Based on information in the record, treatment was required within 12 hours, but care could have
been provided effectively and safely in a primary care setting. The complaint did not require
continuous observation, and no procedures were performed or resources used that are not
available in a primary care setting (e.g., CAT scan or certain lab tests). 3) Emergent, ED Care
Needed , Preventable/Avoidable – Emergency department care was required based on the
complaint or procedures performed/resources used, but the emergent nature of the condition
was potentially preventable/avoidable if timely and effective ambulatory care had been received
during the episode of illness (e.g., flare-ups of asthma, diabetes, congestive heart failure, etc.).
4. Study protocols were approved by Rutgers University Institutional Review Board for research
with human subjects on February 7, 2007.

Rutgers Center for State Health Policy, September 2007 60

Hospital Capacity, Patient Flow, and Emergency Department Use in New Jersey 61
References
Agency for Healthcare Research and Quality Staff, AHRQ HCUP Methods Series: Obersvation
Status Related to U.S. Hospital Records. Rockville, MD: Agency for Healthcare Research and Quality, 2003. American College of Emergency Physicians. On-Call Specialist Coverage in U.S. Emergency
Departments. Irving, TX: American College of Emergency Physicians, 2006-a. American College of Emergency Physicians. The National Report Card on the State of
Emergency Medicine. Irving, TX: American College of Emergency Physicians, 2006-b. Asplin B, Magrid D, Rhodes K, Solberg L, Lurie N, and Carmargo C. “ A Conceptual Model of Emergency Department Crowding.” Annals of Emergency Medicine, 42(2): 173-180, 2003. Bagust A., M Place and Posnett J. “Dynamics of Bed Use in Accommodating Emergency Admissions: Stochastic Simulation Model.” British Medical Journal, 319: 155-158, 1999. Brewster LR, Rudell LS, and Lesser CS. Emergency Room Diversions: a Symptom of Hospitals
Under Stress. Center for Studying Health System Change, Issue Brief. May 2001: No.38. Burt C and McCaig E. Staffing, Capacity and Ambulance Diversion in Emergency
Departments: United States, 2003-04. Washington, DC: U.S. Department of Health & Human Services, Center for Disease Control & Prevention; National Center for Health Statistics,No. 376, 2006. Burt C, McCaig F, and Valverde R “Analysis of Ambulance Transports and Diversions among U.S. Emergency Departments.” Annals of Emergency Medicine 47(4): 317-326, 2006. DeLia D. Potentially Avoidable Use of Hospital Emergency Departments in New Jersey. Report to the New Jersey Department of Health and Senior Services, July, 2006-a. DeLia D. “Annual Bed Statistics Give Misleading Picture of Hospital Surge Capacity”. Annals of
Emergency Medicine, 48(4): 384-388, 2006-b. DeLia, D. Emergency Department Utilization and Surge Capacity in New Jersey, 1998-2003. Report to the New Jersey Department of Health and Senior Services, March, 2005 Gabor K, Kraus C, McCarthy M, Bass E, Edbert H, Li G, Sceulen J, Shahan J, Brill J, and Green G. “ Inpatient Disposition Classification for the Creation of Hospital Surge Capacity: a Multiphase Study.” The Lancet, 368: 1984-1990, 2006.
Ginsburg P. and Grossman J. “When the Price Isn’t Right: Payment Incentives Drive Medicare.” Health Affairs W5: 376-384, 2005. Greene J, “Emergency Department Flow and the Boarded Patient: How to Get Admitted Patients Upstairs.” Annals of Emergency Medicine,49(1): 68-70, 2007.

Rutgers Center for State Health Policy, September 2007 62
Hsia R, Chan J, and Baker L. “Do Mandates Requiring Insurers to Pay for Emergency Care Influence the Use of the Emergency Department?” Health Affairs 25(4): 1087-1094, 2006. Institute of Medicine (IOM). Hospital-Based emergency Care: At the Breaking Point. National Academy of Sciences: Washington, DC., 2006. JCAHO. Joint Commission Resources. Managing Patient Flow: Strategies and Solutions for
Addressing Hospital Overcrowding. Oakbrook Terrace, IL: Joint Commission on Accreditation of Healthcare organizations, 2004. Levi J, Segal L, Gadola E, Juliano C, and Speulda N. Ready or Not?Protecting the Public’s Health
from Diseases, Disasters and Bioterrorism.” Trust for America’s Health, December 2006.
Litvak E, Buehaus P, Davidoff F, Long M, McManus M, and Berwick D. “Managing Unnecessary Variability in Patient Demand to Reduce Nursing Stress and Improve Patient Safety.” Journal on
Quality and Patient Safety, 31(6): 330-338, 2005 McCaig L. and Nawar E. National Hospital Ambulatory Medical Care Survey: 2004 Emergency
Department Summary. Washington, DC: U.S. Department of Health & Human Services, Center for Disease Control & Prevention; National Center for Health Statistics,No. 372, 2006. Millard W. “Suburban Sprawl: Where Does Emergency Medicine Fit on the Map?”. Annals of
Emergency Medicine, 49(1): 71-74, 2007. Morrissey J. “Going With the (Patient) Flow”. Modern Healthcare, 34(6): 6-7, 2004. Derlet R and Richards J. “Overcrowding in the Nation’s Emergency Departments: Complex Causes and Disturbing Effects.” Annals of Emergency Medicine, 35(1): 63-68, 2000. Richardson L, Asplin B, and Lowe R. “Emergency Department Crowding as a Health Policy Issue: Past Development, Future Directions.” Annals of Emergency Medicine, 40(4): 388-393, 2002. Siegel, B. “The Emergency Department: Rethinking the Safety Net for the Safety Net.” Health
Affairs W4: 146-148, 2004. Solberg L, Asplin B, Weinick R, and Magid D. “Emergency Department Crowding: Consensus Development of Potential Measures.” Annals of Emergency Medicine, 42(6): 824-834, 2003. Standard and Poors. What’s Ailing New Jersey’s Not-For-Profit Hospitals: The Reason Why
They Lag the Strong National Credit Trend. NY: Standards and Poors, 2007. State of New Jersey Office of the Governor. Governor Corzine Signs Executive Order Creating Commission on Rationalizing Health Care Resources. Trenton, NJ: Office of the Governor, 2006. Sun B., Sarita M., Weiss, R. et al. “Effects of Hospital Closures on Emergency Department Ambulance Diversion, Los Angeles County, 1998 to 2004.” Annals of Emergency Medicine 47(4): 309-316. Urgent Matters. “ Urgent and Emergency Surgeries: Creating Non-Block Scheduling to Increase Volume, Revenue, and Surgeon Satisfaction.” Urgent Matters E-Newsletter 1(8), 2004.
Hospital Capacity, Patient Flow, and Emergency Department Use in New Jersey 63
Welch S., Augustine J., Camargo C.A., and Reese C. “Emergency Department Performance Measures and Benchmarking Summit.” Academic Emergency Medicine 13: 1074-1080, 2006. Wilson M. and Nguyen K. Bursting at the Seams: Improving Patient Flow to Help America’s
Emergency Departments. Washington DC: The George Washington University Medical Center, 2004.