horse picker or right jockey? an examination of private equity...
TRANSCRIPT

Horse picker or right jockey? An examination of private equity value creation
through the lens of withdrawn leveraged buyouts
Ping Liu*
This version: January 11, 2017
Abstract
This paper examines the consequences of leveraged buyout (LBO) transactions through the lens
of subsequently withdrawn transactions. Using the reason for LBO withdrawal and the unfavorable
credit market movements during the period when the deal is in play to address the endogenous
withdrawal decision, I create a sample of LBOs withdrawn for reasons not related to target firm
fundamentals. This paper documents the following facts. First, target firms of failed LBO
transactions experience upward revaluation by the stock market. Such results are stronger for target
firms with more information asymmetry problems. The evidence in my paper indicates that private
equity investors are able to identify undervalued firms in the stock market. Second, I document
improvements in operating performance of firms after LBO transactions compared to target firms
that fail to go through the LBO process. Third, private equity investors adjust the capital structure
of target firms to exploit the tax benefit of interest deductions. Fourth, private equity investors also
tend to reshuffle the management of target firms shortly after the LBO transactions. Overall, the
evidence suggests that private equity creates value by exploiting the undervaluation of target firms,
and also by improving their operational performance and financial structure.
* Ping Liu is from the Department of Finance, University of Illinois at Urbana-Champaign. I would like to thank Heitor
Almeida and Yuhai Xuan for their continuous encouragement and invaluable guidance in this project. Thanks as well
to Joshua Pollet and seminar participants at University of Illinois for useful suggestions. This paper has also benefited
from discussions with my colleague Mo Liang. All errors are my own.
1
''They [KKR]'ve been very active in helping shape the disposition strategy—what to sell and how
to sell it . . . We've ended up with a smaller company, but one making more operating income on
a $13.5 billion sales base than it was on $20 billion [before the buyout].''
Peter A. Magowan, Chairman and Chief executive, Safeway
Co.,
New York Times, October 21, 1988
“For years, private equity firms like Blackstone have been viewed as financial alchemists who buy
undervalued companies, rejigger their balance sheets and sell them for quick gain.”
Kevin Roose,
Financial journalist and author
New York Times, July 11, 2012
1. Introduction
The last 30 years have revealed exponential growth in the private equity industry despite some
cyclical setbacks1. The prominence of private equity industry in capital markets is justified by its
track record of strong performance. Recent studies have found that private equity funds outperform
their public equity counterparts, even after accounting for fees and other expenses (see, e.g.,
Higson and Strucke, 2012; Harris, Jenkinson and Kaplan, 2014; Robinson and Sensoy, 2013)2.
The superior performance of the private equity industry raises a natural and important question:
What is the propelling force behind such strong performance? One view, referred to as “cherry-
picking channel”, is that private equity funds consist of savvy investors that “cherry-pick”
undervalued target firms, load them with high debt level, and sell them for capital gains, either
through secondary buyout or through public offering (DeAngelo, DeAngelo and Rice, 1984;
1 As of 2012, the global private equity industry has grown to reveal influential financial clout, with 4,800 active private
equity firms with 1 trillion dollar dry powders in the pockets. Source: Bain and Company global private equity report,
2013. 2 Specifically, Harris, Jenkinson and Kaplan (2014) document a sizable outperformance of 20% to 27% in higher
returns as compared to the S&P 500 Index stocks through a fund’s life, or more than 3% annually. On the deal level,
Guo, Hotchkiss and Song (2011) document a hefty increase in firm value from pre-buyout level to the exit of the
private equity firm.
2
Kaplan Stromberg, 2009; Dittmar, Li and Nain, 2012). A second view, which has been confirmed
by the literature, is that private equity firms create economic value by improving operating
performance of target firms. This can be achieved by operational engineering, in which private
equity funds help the firm cut operating costs (Kaplan, 1989b), and allocate labor and capital to
more efficiently (Smith, 1990; Davis, Haltiwanger, Jarmin, Lerner and Miranda, 2014).
Differentiating between private equity investors’ ability to identify undervalued target firms from
the private equity investors’ capabilities in improving the target firms’ performance is an
empirically challenging task. For example, the market reaction to a private equity buyout could
reflect both the undervaluation as well as the expected economic value of the target firm created
by the private equity investor if the deal goes through. Even a simple examination of the stock
returns of target firms during the period the deal is in play for unsuccessful buyouts may present
problems in correct interpretation, in that the reason for the withdrawal of the deal in itself could
contain information that could simultaneously affect the fundamentals of the target firms. On the
other hand, uncovering the change in operating performance and corporate governance practices
depends crucially on the control group for comparison purposes, since a recent study has shown
that the target firms of financial acquirers are different from those of other firms (Gorbenko
Malenko, 2014).
This paper overcomes the above-mentioned empirical difficulties by collecting a sample of
unsuccessful LBO transactions sponsored by private equity investors and by using the sample to
examine the cherry-picking hypothesis. The sample is also used as a baseline to check whether
the firms that go through LBOs enjoy operating performance improvements compared to firms
that failed in the LBO process. One drawback of this approach, seen in previous studies as well, is
that the reason for the failure in the deal going through could simultaneously depress the stock
price and undermine the future operating performance of the target. For example, new negative
information about the target firm’s prospects could be uncovered during the due diligence process.
Moreover, firm performance could fall below the private equity forecast on which the bid valuation
is based. I use two empirical strategies to show that private equity bids for target firms result in
increases in the value of their stock as well as improvements in their operation. In the first approach,
I search through LexisNexis for the reasons behind each unsuccessful LBO and create an

3
“exogenously withdrawn” sample by carefully excluding cases in which the failure of the deal is
due to disagreement over the bid price; to new information uncovered regarding firm fundamentals;
or to the evolution in the conditions of the firm, all of which could affect target firm value3. To
reduce subjectivity in this process, and to address the concern that some targets or acquirers might
lie about the reason that the deal failed4, I use an objective measure that classifies an unsuccessful
LBO as a “LBO failure due to unfavorable credit market movement” if the change in high-yield
bond market index since the deal announcement falls within the bottom quarter of that of all the
leveraged buyouts announced during the same year.
Overall, I find that, on average, the target stock experiences an 11.9% market-adjusted buy-and-
hold return, and a 10.6% buy-and-hold abnormal return against a benchmark portfolio matching
on Fama-French industry, capitalization and book-to-market ratio, from a period starting from 25
trading days before the deal announcement to 25 trading days after the deal withdrawal (“deal
active period”). Similar buy-and-hold abnormal returns are present for the “exogenously
withdrawn” sample and for “LBO failures due to unfavorable credit market movement”. For
example, during the same holding period as the full sample, the target firms, on average, yield a
13.4% cumulative abnormal return against market portfolio and a 16.5% cumulative abnormal
return against the matching portfolio for the “exogenously withdrawn” sample. Since each deal
has a different length of time from announcement to failure, I also report an average standardized
daily buy-and-hold abnormal return to gauge the economic significance of the abnormal returns.
The resulting daily buy-and-hold abnormal return is economically significant. For example, for
deals that fail due to unfavorable credit market movements, the target stock, on average, generates
a 15 basis points daily buy-and-hold return against the market portfolio, and a 16 basis points daily
buy-and-hold abnormal return compared to the matching portfolio. Similar results hold for all the
withdrawn deals, whether or not they are withdrawn for reasons unrelated to target stock price.
Overall, the evidence so far suggests that private equity funds are capable of identifying
undervalued companies, and that the stock market recognizes their abilities. As a result, even if
3 I also exclude cases in which the private equity investors withdraw from the deal because another acquirer offered a
higher bid. As in these cases, the stock price also incorporates the value premium of the competing bid. 4 I thank Joshua Pollet for pointing out this possibility.
4
the leveraged transaction does not eventually go through, the stock price is still higher than at the
pre-announcement level, reflecting a market revaluation of target firms.
A natural follow-up question would be: What makes private equity firms savvy about valuation?
To explore potential channels through which private equity firms identify the undervalued targets,
first I split the sample into two halves according to the information asymmetry. Using three
measures for information asymmetry common in the literature—number of analysts that cover the
firm, analyst forecast dispersion, and analyst forecast accuracy—I found that the abnormal returns
during the period when the deal was in play was concentrated within target firms suffering from
greater information asymmetry, both statistically and economically. This is consistent with the
hypothesis that private equity firms have more and better information than average investors,
information they rely on to help cherry-pick the targets5,6.
In what follows, I examine the second view regarding the value created by private equity
investors—that is, whether they improve the operating performance by overhauling the investment
as well as the financial policies of the firms in their portfolio. The empirical results confirm the
positive effect of private equity buyouts on the operating performance of the target firms after the
LBO transactions. For example, firms that fail LBOs do not display any improvement in earnings
and operating cash flow, while firms that are successfully bought by private equity firms through
LBO transactions enjoy increases in both earnings and operating cash flow by 0.031 and 0.035 of
the value of their assets, respectively.
Moreover, I use two empirical strategies to address the concern that the withdrawal of the deal
might be associated with information that are detrimental to the performance of the target firms
after the LBO transaction. First, I compare the evolution of the operating performance of the target
5 However, in un-tabulated analysis, for the period the deal was in play, I failed to find any difference in abnormal
returns between unsuccessful LBO transactions with management participation and unsuccessful LBO transactions
without management participation. Moreover, I failed to find any robust difference in abnormal returns between failed
deals that occurred before and after the enactment of “Regulation FD”. All these pieces of evidence point to the fact
that the information advantage possessed by private equity firms does not mainly come from target management
insiders or the board of directors of the target firms. 6 Recent anecdotal evidence shows that top private equity firms now hire former industry professionals, in addition to
dealmakers with financial background. For example, former GE CEO Jack Welch joined Clayton, Dubilier & Rice
and Lou Gerstner, once at the helm of RJR Nabisco and IBM, is affiliated with Carlyle (Kaplan and Stromberg, 2009).
It would be interesting to see if those industry professionals help private equity firms choose the right targets.

5
firms following both successful and unsuccessful LBO transactions due to reasons exogenous to
target fundamentals. Again, I found similar results. While the successful LBOs always enjoy
improvements in earnings and operating cash flow—measured against their assets—by an
economically significant amount of 0.031 and 0.035, respectively. The target firms in failed LBO
samples, on the other hand, do not show any meaningful change in their operating measures. In
the following analysis, instead of using actual failed LBO transactions, I use, as explanatory
variable, a predicted withdrawn probability for each LBO transaction from a linear probability
regression that forecasts deal withdrawal probability based on deal characteristics, target pre-
announcement financial conditions, as well as the change in high yield bond market index since
announcement 7 . This empirical strategy yields similar results as mentioned above: After
controlling for deal characteristics, pre-deal financial conditions, and the industry fixed effects, the
target firms with higher probability of LBO success display higher earnings following the closure
of the transaction.
Overall, I was able to confirm that private equity firms are not just financial alchemists but also
operational experts, in that they create economic value for the target firms by improving their
operating performance. A further analysis reveals that the improvement in operating performance
is not due to cuts in investment spending after the LBO transaction, since both completed and
withdrawn LBO targets exhibit similar changes in capital expenditures after the LBO transactions.
Lastly, I examine the change in capital structure following the LBO transactions. As expected, the
results hold for all different samples of withdrawn transaction in my study: Successful LBO targets
show higher levels of debt in their balance sheets. More interestingly, the unsuccessful targets also
indicate an increase in leverage ratio of 8% to 15% after the LBO attempts.
The last two parts of the paper explore other ways that private equity firm could create value for
the firms in their portfolios. Extant research state that the economic value creation through private
equity LBOs can also be achieved by increasing tax benefits of interest expense (Kaplan, 1989a),
and reforming corporate governance practices by offering, for example, more powerful managerial
7 The results are similar if I use Probit model instead of the linear probability model.

6
incentives and enhanced board monitoring (Acharya, Gottschalg, Hahn and Kohoe, 2013) 8 .
Correspondingly, the next part of this paper examines whether the private equity firms adjust the
capital structure of their target firms in a way that increases tax benefit of interest expense. In
particular, I compare the change in probability that a firm’s marginal tax rate (MTR) after interest
expense lies on the downward sloping part of interest deduction-MTR graph (“Graham’s Kink”,
Graham, 2000), between completed LBO target firms and withdrawn LBO target firms. If private
equity investors exploit tax deductions in interest, I should be able to observe interest expenses of
more successful LBO target firms exceed those inferred by “Graham’s Kink” after the LBO
transaction, compared to that of unsuccessful LBO targets. The empirical results confirm my
hypothesis and are economically significant. For instance, in the three-year period after the
completion of the LBO transaction, 23% more target firms maintain their leverage ratios, to the
point where the MTR after interest expense starts to decrease. At the same time, for the
unsuccessful LBO target firms, the probabilities do not show any meaningful statistical or
economic change. In general, the results of the paper confirm that tax benefits associated with
optimized capital structure is one way that private equity investors create value through LBO
transactions.
The last part of the analysis examines the change in corporate governance following LBO
transactions. In particular, I focus on one important channel that is well documented in the
corporate governance literature: the probability of CEO replacements following LBO transactions.
Previous literature document an increase in CEO turnovers following successful LBOs by private
equity investors (e.g., Acharya, Gottschalg, Hahn and Kehoe, 2013). Consistent with extant studies,
I find that, compared to unsuccessful LBO targets, the target firms that actually go through the
LBO transactions have a 18% to 30% higher probability of replacing their CEOs during the one-
year period after the completion of the deal. This result holds when I use the change in the high
yield bond market index to instrument the potentially endogenous LBO withdrawal decision and
conduct a two-stage least square regression. Interestingly, the unsuccessful LBO targets exhibit
stronger turnover-performance sensitivity compared to successful LBO targets, which is consistent
8 A recent study on private equity investments in the restaurant industry reveals that private equity firms create value
through instituting better management practices, such as better food quality, more sanitary environment, and more
reasonable menu prices (Bernstein and Sheen, 2013). However, this channel is beyond the scope of this study.

7
with recent literature that show that private equity firms use private information to evaluate the
CEO performance of target firms over a longer period of time relative to their publically traded
counterparts (Cornelli and Karakas, 2013).
Overall, I find that private equity firms are savvy investors in stock market, in that they are able to
identify undervalued target firms (“horse picker”). At the same time, the findings in this paper
challenge accusations in the literature that claim that private equity firms adhere to a “buy-strip-
flip” strategy and privilege short-term profits over long-term value9. Under the management of
private equity firms, the target firms—as compared to those that failed the LBO processes (“right
jockey”)—exhibit improvements in operations, optimization in capital structure, and positive
organizational changes.
This paper contributes to several strands of the literature in the field. First of all, the empirical
findings of this paper confirm the superior performance of private equity industry documented in
the literature (e.g., Higson and Strucke, 2012; Harris, Jenkinson and Kaplan, 2014; Robinson and
Sensoy, 2013). Specifically, by comparing the LBO target firms against carefully designed control
firms—i.e., target firms that failed LBO transactions for exogenous reasons—this paper provides
clean empirical evidence that private equity managers create value for their limited partners by
carefully picking undervalued target firms, and reengineering them through operational, tax, and
organizational lenses. Extant evidence in the literature on private equity firms’ cherry-picking
abilities is limited and indirect. For example, Dittmar, Li and Nain (2002) find that strategic
acquirers purchasing target firms by competing with financial buyers earn an 8.80% higher CAR
during -20 to +180 window compared with corporate buyers competing against other corporate
buyers. The authors conclude that financial buyers are able to identify target firms with higher
potential for value improvement that are also valuable to other acquirers. This paper employs a
different empirical strategy and confirms the cherry-picking ability of private equity investors
through stock market reaction during the period in which the deal is in play of unsuccessful LBOs.
Moreover, I further document the operational engineering of private equity firms, which they do
through a turnaround in the operating performance of target firms. I document as well not only the
financial engineering conducted by private equity firms through capital structure optimization, but
9 For example, Buy it, Strip it then Flip it. Bloomberg BusinessWeek Magazine, August 6, 2006.

8
also the governance engineering performed by reshuffling the corporate management of target
firms.
Moreover, this paper contributes to the literature on the driving forces behind value improvement
in target firms following buyout transactions in general. There are two hypotheses that can explain
the observed improvement in operating performance after LBO transactions. The first—the
organizational change hypothesis—states that organizational changes following buyouts enhance
operating performance of target firms. These changes include providing more incentives to
management, promoting better monitoring by corporate boards, as well as mitigating agency cost
of free cash flows via high leverage and more interest expenses (Jensen, 1989). The other popular
hypothesis is private information hypothesis, which states that buyout acquirers identify
undervalued targets that have great economic potential. Thus the improvement in operating
performance could occur even without the LBO transaction. Empirical evidence on the latter
hypothesis focus on management buyouts of their own firms. Studies providing such evidence are
generally based on small samples and offer mixed conclusions. DeAngelo, DeAngelo and Rice
(1984) document that, for a sample of 20 unsuccessful private transactions, the target stock has,
on average, a 25% market-adjusted abnormal return for the period from 40 trading days before the
announcement of the deal to 40 trading days after the withdrawal of the deal. Those studies
acknowledge that without knowing the reason behind the failure of the deal, it is impossible to
distinguish between target undervaluation and the future takeover probability that drive the
observed returns. Marais, Schipper and Smith (1989) find a much smaller rate of return for a
sample of 15 buyout transactions. Smith (1990) cites no change in operating performance
following LBO proposals that were either rejected by target firms or withdrawn by the acquirers
as evidence against private information hypothesis. However, as mentioned above, change in
operating performance is not the only source of economic value creation. Moreover, reasons for
withdrawal of LBOs are not specified for more than half of her sample deals. This confounds the
causality since, more often than not, the reason behind the deal being withdrawn might contain
useful information about firm fundamentals that simultaneously affects the future performance of
the target firms. More recently, Lee (1992) and Ofek (1994) use a larger sample of management
buyouts and find that for unsuccessful buyouts without subsequent takeover proposals, the stock
prices of target firms fall back to pre-buyout level. They also fail to find any improvement in

9
operating performance following failed management buyout attempts. The authors claim that the
empirical findings reject the private information hypothesis. This paper uses a comprehensive
sample of all LBO transactions sponsored by private equity firms from 1979 to 2012 and uses
news sources as well as change in LBO funding environment to address the endogeneity problems
that confound the conclusions of previous literature. I document a robust positive revaluation of
target stocks following failed LBO attempts. Moreover, I also examine channels other than
operational improvement, such as tax benefits and organizational change, as potential sources of
economic value creation by private equity firms.
Lastly, this paper also contributes to the empirical literature on the value implications of merger
and acquisitions. For example, Malmendier, Opp and Saidi (2016) find that much of the market
reaction to merger announcement are attributable to the revaluation of target firms if the acquisition
is paid in cash. This paper adds to this strand of literature by showing that a part of value gains
from private equity buyouts comes from the undervaluation of firms targeted by private equity
firms.
The rest of the paper is organized as follows. The following section, Section 2, presents sample
and data information. Section 3 expounds on the empirical results, which comprise of three
subsections. Subsection 3.1 focuses on the examination of the abilities of private equity firms to
explore undervaluation in stock markets. Subsection 3.2 compares operating performance and
policy changes of LBO target firms following successful LBOs against failed LBO attempts.
Subsections 3.3 and 3.4 test other channels that private equity investors employ in value creation,
using failed LBO target firms as baseline. This includes tax benefits of higher leverage, as well as
the reshuffling of management of the target firms. The paper concludes with directions for future
research.
2. Sample and Data
2.1 Sample construction

10
My starting point of sample collection is all the merger and acquisition transactions termed as
“Leveraged buyouts” in SDC Platinum. SDC covers 10,042 leveraged buyout deals from 1979 to
2012. Then I use the following criteria to screen the sample. Firstly, I require the target firms have
public equity outstanding before the announcement of the LBO transactions and will become
privately owned firms if the deal goes through. Secondly, I require that the target firms do not
receive any leveraged buyout bids during three year period before the current transaction. Thirdly,
I drop deals that are classified as “Rumors” or “Pending”. Moreover, I exclude transactions in
which the acquiring parties acquire less than 50% of shares. Finally, I erase deals in which the
acquiring parties acquire “remaining assets” of the target firms. This yield a LBO sample of 1,159
deals. In the following step, I search for each deal in LexisNexis and SEC filings surrounding the
deal announcement and ending dates to verify the acquirer identities, the eventual outcome of the
deal, and the announcement as well as the ending dates 10 . Similar to Lerner, Sorenson and
Stromberg (2011), I exclude buyouts that do not involve a financial sponsor (i.e., private equity
firms). Those deals are typically buyout transactions by target managements using their own
resources and bank debt, which are not the focus of this study11. The final sample consists of 610
LBOs sponsored by private equities from 1979 to 2012, of which 126 deals fail, and 484 deals
eventually succeed. Table 1 present the distribution of deal cohorts according to their
announcement years.
[Insert Table 1 here]
2.2 Withdrawn reasons
The main goal of this paper is to examine the four channels through which private equity funds
could generate investment returns for their limited partners: undervaluation channel, operational
engineering, tax engineering and governance engineering. The announcement of a leveraged
10 I eliminate deals in which I could not verify the deal closing dates. 11 Similar to Lerner, Sorenson and Stromberg (2011), I also erase the buyout transactions that are done by traditional
early-stage venture capital funds. Those deals are typically venture capital investments and have much lower leverage
in buyout capital structure.
11
buyout is concomitant with large market reaction12 , which reflects market assessment of the
undervaluation channel, the probability of deal success, as well as the target firm value
enhancement via the three other channels, which are conditional on deal success. In order to
disentangle the undervaluation channel from the other channels, I look at the stock market reaction
during the period when the deal is in play, which is 25 trading days before the deal announcement
and 25 trading days after the withdrawal of the deal. The choice of 25 trading days is consistent
with previous findings concerning stock price run-up occurrences before deal announcements
(Schwert, 1996; Malmendier, Opp and Saidi, 2016). The basic logic is as follows: since the deal
does not eventually go through, the stock price after the deal withdrawal does not reflect
operational engineering, tax engineering and governance engineering and all other value creation
channels which are conditional on deal success. Any remaining abnormal returns reflect the
undervaluation of targets before the private equity bids and the consequent market revaluation.
I also examine the operating performance change for the sample of successful LBO targets using
a sample of unsuccessful LBO targets as the control group. Previous studies show that mergers
and acquisitions market is segmented and targets of financial acquirers are special. Thus, a
comparison of operating performance and firm policies between successful and unsuccessful LBO
firms will shed light on whether or not private equity funds add value to their portfolio firms
through tax engineering, operational engineering, and governance engineering.
Unfortunately, not all of the withdrawn samples are eligible for inclusion in this analysis. An
essential criteria for a valid unconsummated LBO is that the reason for a LBO failure is not related
to the target firm’s valuation as well as the target firm’s operating performance and policies in the
future. For example, if the private equity investors walk away due to material adverse changes in
the target firms after the deal announcement, then the stock price of the target will plummet and
the operating performance will deteriorate afterwards even if the proposed LBO transaction never
occurs. This is by no means a theoretical possibility. In order to address the endogeneity problem
mentioned above, I check the LexisNexis and target SEC filings surrounding the deal withdrawal
date. This was done in order to determine the reasons behind each unconsummated deal. I carefully
12 The average three day announcement returns are 19% for both deals that eventually succeed and deals that are
eventually snapped.
12
screen out all of the LBO transactions which are withdrawn for explicit reasons that have the
potential to affect the target firm’s valuation and future operating performance, and the remainder
is deemed to be an “exogenously withdrawn” sample13. Table 2 presents the detailed withdrawal
reasons for the sample LBOs in this study.
[Insert Table 2 here]
In order to reduce subjectivity in the determination process of “exogenously withdrawn” samples,
and to address the concern that some targets or acquirers might misrepresent the reasons why the
deal is called off, I use another objective approach to analyze deals which are withdrawn for
reasons other than fundamentals of target firms. Previous literature has documented that the junk
bond market affect LBO pricing, capital structure and deal volume. For example, Axelson,
Jenkinson, Stromberg, Weisbach (2013) document that “mezzanine debt” and “junior bonds”
account for 19.2% capital of an average LBO deal, and that the high yield bond market conditions
dominate target characteristics in determining buyout capital structure. Kaplan and Stein (1993)
also find that “demand push” in the junk bond market leads to aggressive pricing of LBOs, higher
leverage in LBO capital structures, and high LBO volume. Motivated by these studies, I use the
change in the average logarithm Merrill-Lynch high yield bond market index between the quarter
period before the deal announcement and the period from deal announcement to deal ending, as
an instrument for the possibility of deal failure. The logic is that while an individual LBO
transaction is unlikely to affect the change in the high yield bond market condition, the turbulences
in the high yield bond market elevate the estimated financing costs of an individual LBO, thereby
increasing the possibility that the private equity investors will walk away from the targets. I classify
a withdrawn deal as a “LBO failure due to unfavorable credit market movement” if the difference
in average logarithm Merrill-Lynch high yield bond market index between the quarterly period
before the deal announcement and the period from the deal announcement to the deal ending falls
13 Some people might be concerned because the announced withdrawal reasons are not the underlying reasons behind
the deal failure. For example, a stated reason of “deal withdrawal because of the target management’s resistance”
might cloud the underlying fact that the target management might possess some positive information about the
prospects of target firms, which propels them to retain control. My assumption is that published news articles about
the deal reflect all of the public information that is available regarding the deal. Therefore any other private information
is not incorporated into stock prices and does not confound my analysis in a systematic manner.

13
within the bottom quarter of the universe of leverage buyout transactions14 announced during the
same year.
2.3 Detecting abnormal stock performance
I use two benchmarks to detect abnormal stock performance. Firstly, I use a simple CRSP value-
weighted market portfolio the same nature as Fama and French use to calculate market excess
returns. Moreover, in a manner similar to Barber and Lyon (1997) and Savor and Lu (2009), I use
a matching portfolio strategy. More specifically, I first identified all of the firms that operate in the
same Fama-French 49 industry and have market values of equity between 50% and 150% of the
market equity of the failed LBO target firm. I then pick the firm with the book-to-market ratio
closest to the ratio of the failed LBO target. The selection processes are repeated 3 times in order
to generate 3 control firms. The matching portfolio is an equally weighted portfolio consisting of
these 3 control firms. If there are fewer than 3 matching firms for the LBO target in question
(because there is an insufficient number of firms in the same industry that satisfy the size criterion),
the matching portfolio contains fewer than 3 control firms. If one control firm disappears from
CRSP before the end of the holding period, it is replaced by the next-best match15. The market
value of equity is calculated as of the market close 30 trading days before the deal announcement.
The book value of equity of the most recent fiscal year before the date used to calculate the market
value of equity, which is defined following Cohen, Polk and Vuolteenaho (2003) and Savor and
Lu (2009). The detailed procedure is outlined on page 613 of Cohen, Polk and Vuolteenaho (2003)
and omitted here for the sake of brevity. Buy-and-hold abnormal return (BHAR), cumulative
abnormal return (CAR) and standardized daily buy-and-hold abnormal return (DBHAR) over the
holding period t is defined as follows:
𝐵𝐻𝐴𝑅𝑖,𝑡 = ∏ (1 + 𝑟𝑒𝑡𝑖,𝑗) − ∏ (1 + 𝑟𝑒𝑡𝑝,𝑗)𝑡𝑗=1
𝑡𝑗=1 (1)
𝐶𝐴𝑅𝑖,𝑡 = ∑ (𝑟𝑒𝑡𝑖,𝑗 − 𝑟𝑒𝑡𝑝,𝑗)𝑡𝑗=1 (2)
14 The universe of LBO transactions includes all of the leveraged buyout transactions of U.S. public firms, private
firms and subsidiaries. 15 My results are qualitatively similar if I use a matching portfolio consisting of 1 control firm or 5 control firms.

14
𝐷𝐵𝐻𝐴𝑅𝑖,𝑡 = √∏ (1 + 𝑟𝑒𝑡𝑖,𝑗)𝑡𝑗=1
𝑡− √∏ (1 + 𝑟𝑒𝑡𝑝,𝑗)
𝑡𝑗=1
𝑡 (3)
where 𝑟𝑒𝑡𝑖,𝑗 and 𝑟𝑒𝑡𝑝,𝑗 denote firm i's stock return and the benchmark portfolio return at day j,
respectively.
2.4 Operating performance and firm policy
Target firms in LBO transactions become private firms after the deals are consummated, and are
often no longer required to file financial reports with the Security and Exchange Commission
(SEC). I am thus only able to retrieve measures of operating performance and firm policies for
successful LBO targets should those targets continue to file public reports with SEC. Those LBO
targets typically have public debts outstanding, or have filed for public offerings again after the
buyout, and must disclose accounting information for the three years prior to the public offering
filing. I use COMPUSTAT and Capital IQ to retrieve accounting information concerning LBO
targets whenever such are available. I employ two measures for operating performance:
profitability and operating cash flow. Profitability is defined as earnings before interest,
depreciation and amortization (EBITDA) over total assets, whereas operating cash flow is defined
as the difference between EBITDA minus capital expenditures over total assets. Investment policy
is measured as follows: capital expenditures over total assets. Financial leverage is measured as
the sum of debts in current liabilities and long-term debt over total assets16. Marginal tax rates both
before and after interest expenses are derived from Blouin, Core and Guay (2010). Those tax rates
are based on forecasted 22 years’ taxable income and take into consideration the carryforwards
and carrybacks. The tax rates measure the expected additional taxes a firm must pay during current
years as well as future years as a result of one dollar increase in taxable income17.
16 One problem is that the asset value of successful LBO targets inflates exponentially at the end of the fiscal year
during which the LBO occurs and afterwards. This is the case because existing accounting rules require acquired
assets and liabilities to be recorded in terms of fair market value, which is typically much higher than the book value
recorded beforehand since target firms are bought using large premiums in LBO transactions (Custódio, 2014).
Therefore, following Cohn, Mills and Towery (2014), I use total assets for the fiscal year during which the LBO is
completed as the scale factor for all of the years prior to the LBO completion year. This method accounts for any
accounting adjustments that are related to the LBO transaction. 17 I thank the authors for sharing the data via Wharton Research Data Services.

15
2.5 Other control variables
In this paper, I use the following variables to control for deal characteristics, financial conditions
of target firms, and stock performance of target firms, in different sections of the analyses. The
financial conditions of the target firms are obtained from COMPUSTAT annual tapes for the most
recent fiscal year ending before the deal announcement. Target cash flow is defined as the sum of
COMPUSTAT Item IB and Item DP over Item AT. Target financial leverage is defined as the sum
of Item DLTT and Item DLC over Item AT. Target Q is defined as the market value of assets over
the book value of assets, where the market value of the assets is equal to Item AT plus the market
value of equity minus Item TXDB minus Item CEQ. The market value of equity is Item PRCC
multiplied by Item CSHO. Target cash holdings is defined as Item CHE over Item AT. Target
stock performance is defined as the abnormal buy-and-hold return against the market portfolio for
a one-year period ending 11 days before the deal announcement. I obtain deal characteristics from
SDC Platinum database. Log(deal value) is the logarithm of deal value. Hostile deal is equal to
one if the LBO is classified as being hostile. LBO duration is the logarithm of the number of days
between the deal announcement and the deal ending. LBO announcement return is defined as the
three-day cumulative abnormal return surrounding the LBO announcement dates. Competing deals
is equal to one if there are multiple bidders for the target. Table 3 reports the summary of the deal
and the target characteristics of successful deals, withdrawn deals and “exogenously withdrawn”
deals. Compared with successful deals, withdrawn deals are smaller, and are more likely to involve
competing bidders.
[Insert Table 3 here]
3. Empirical results
This section presents the empirical results of this paper. Firstly, I answer the question of whether
private equity investors are able to identify undervalued targets in the market by examining the
stock returns during the deal active period for the unsuccessful LBO sample. The following section
examines whether private equity investors improve the operating performance of their portfolio
firms using failed LBO targets as a control group. The last two parts of the analyses deal with the

16
channels through which private equity investors ameliorate operating performance. More
specifically, I investigate the tax benefits channel and corporate governance engineering.
3.1 Does private equity identify undervalued targets?
This section examines the target stock performance of target firms during the deal active period,
which is 25 trading days before the deal announcement up through 25 trading days after the deal
withdrawal. The logic behind this empirical strategy is as follows: Assuming the stock market is
at least semi-efficient, then the stock price at the time of the announcement of LBO transactions
should incorporate market revaluation of the previously undervalued target (if any), the probability
of deal success, and the value enhancement of the target firm brought about by the private equity
investors, which is conditional on the deal’s success. After the deal failure, the stock price should
drop compared to the announcement level since the value creation associated with the transaction
has not been realized. However, if the stock price remains above the pre-deal level, that indicates
that the stock market has revalued the target stock’s value. The stock market revaluation thus
provides evidence that the target was undervalued before, and the buyout proposal and the bid
from private equity signals to the stock market what the target’s fair value actually is. Empirically
speaking, any abnormal returns during the deal active period for withdrawn LBOs reflect the
undervaluation of targets before the private equity bids and the consequent market revaluation.
More specifically, I analyze the stock market reaction during the deal active period, which is 25
trading days before the deal announcement and 25 trading days after the deal withdrawal18. The
choice of 25 trading days is consistent with previous findings concerning target stock price run-up
starts from about one month before deal announcements (Schwert, 1996). Figure 1A and Figure
1B present some graphic evidence. I plot the cumulative abnormal return against the market
portfolios for withdrawn LBO targets starting 25 days before the deal announcement through 25
18 The abnormal stock returns continue to hold for the “exogenously withdrawn” sample if I examine a longer period
after a deal failure, say, 100 trading days after a deal withdrawal. The abnormal buy-and-hold return against market
portfolio and matching portfolio for the “exogenously withdrawn deals” are economically and statistically significant,
and are more than 9% and 11% on average, respectively. The abnormal stock buy-and-hold return against market
portfolio and matching portfolio for the failed LBOs is due to unfavorable credit market movement continue
economically large, 11% and 8%, respectively, but cease to be statistically significant due to explosive standard errors
brought about by small sample size.

17
days after the deal withdrawal. I standardize deal length in the same manner as Malmendier, Opp
and Saidi (2016). There is a large jump in stock prices upon deal announcements. At the time of
the deal withdrawal announcement, the stock price nosedives. However, the stock price remains
higher than its pre-LBO level. Table 4 presents the empirical results. For each panel, I report the
buy-and-hold abnormal return, the cumulative abnormal return and the standardized daily
abnormal return against market portfolios and the three-firm portfolio matched on industry, size
and book-to-market ratio. Panel 4A reports the stock returns for the full sample of withdrawn
LBOs. During the deal active period, the target firms for withdrawn LBO transactions yield an
average 11.9% buy-and-hold abnormal return against the CRSP value-weighted market return, and
a 10.6% buy-and-hold abnormal return against the matching portfolio. Both results are statistically
significant below the 5% two-tail significance level. In order to gauge the economic significance
of the buy-and-hold abnormal returns, I standardized the buy-and-hold abnormal returns for each
deal according to equation (3). On average, the target firms involved in withdrawn LBO
transactions generate 8 basis points of abnormal buy-and-hold returns per day against the matching
portfolio, and there are similar results for returns against market portfolios. Both standardized daily
abnormal buy-and-hold returns are statistically significant below the 1% significance level.
One concern is that some LBOs are unconsummated for reasons that might simultaneously affect
the targets’ stock returns. For example, about 30% of the withdrawn LBOs fail because the private
equity acquirers are outbid by another strategic acquirer. In this case, the stock price after the deal
is withdrawn by the private equity investors incorporates the future takeover and value premium
associated with the new offer. In order to address these endogeneity issues, I include only deals
that are “exogenously withdrawn”, i.e., deals that fail for reasons not directly related to target firm
fundamentals. Detailed criteria for the construction the “exogenously withdrawn” sample are
presented in Table 2. The results are tabulated in Panel 4B. Again, the abnormal returns for target
firms during the deal active period are both statistically and economically significant. For example,
over the deal active period, the target firms of LBO transactions that are terminated exogenously
generate on average abnormal buy-and-hold returns of 9.9% and 13.4% against the market
portfolio and matching portfolio, respectively, which is statistically significant below the 10%
significance level. Similar results hold for standardized abnormal returns.

18
It is inevitable that the construction of “exogenously withdrawn” samples depends on some form
of subjective judgment. Moreover, targets and acquirers might misrepresent the identity of the
culprit behind the deal failures. In order to address these issues, I use an objective criteria to
construct a withdrawn sample for which the reasons are largely unrelated to an individual target’s
or acquirer’s characteristics. More specifically, I use change in the average logarithm Merrill-
Lynch high yield bond market index between the quarter before the deal announcement and the
period from the deal announcement to the deal ending, as an instrument for the possibility of deal
failure. Previous research shows that high-yield bond market conditions play vital roles in buyout
activities, e.g., capital structure (Axelson, Jenkinson, Stromberg and Weisbach, 2013) and deal
pricing (Kaplan and Stein, 1993). An unsuccessful deal is classified as a “LBO failure due to
unfavorable credit market movement” if the difference in the average logarithm Merrill-Lynch
high yield bond market index between the quarter before the deal announcement and the period
from the deal announcement to the deal ending falls within the bottom quarter of the universe of
leverage buyout transactions announced during the same year. The argument is that if the high-
yield credit market index deteriorates, private equity investors become more likely to walk away
from the targets due to the heightened financing costs. More importantly, those deals are
withdrawn as a result of the systematic downturn in the credit market, which is unlikely to be
affected by any individual LBO transaction. Panel 4C presents the results. Again, the results are
both quantitatively and qualitatively similar to the results exhibited in Panel 4A and Panel 4B. For
example, in the case of deals that are withdrawn due to unfavorable credit market movements, the
buy-and-hold abnormal return is 18% and 20.3% against the market portfolio and matching
portfolio, respectively. Another challenge to the empirical findings so far is that the higher stock
price compared with the pre-deal level might reflect a higher future takeover probability that the
target may face. In order to rule out this possibility, I repeat the analyses using a set of unsuccessful
LBO transactions in which the target firms do not receive takeover bids for a period of at least one
year after the deal withdrawal. The results exhibited in Panel 4D, are qualitatively similar to the
unrestricted sample and the two “exogenously withdrawn samples”.
[Insert Table 4 here]
19
Overall, I find that private equity investors are savvy about undervaluation in the stock market.
The stock market recognizes private equity investors’ “serendipity” and revalues firms targeted by
private equity investors. Other information leakage during the deal active period and future
takeover probability do not undermine my empirical findings.
A natural follow-up question would concern the extent to which the information advantage
possessed by private equity investors facilitates their ability to identify undervalued targets. In
order to address this issue, I split the sample into halves according to the information asymmetry
of target firms. I follow existing literature by using three measures of information asymmetry (e.g.,
Duchin, Matsusaka and Ozbas, 2010; He and Tian, 2013): the number of analyst who cover the
firm, analyst forecast dispersion scaled by firm assets, and analyst forecast accuracy, which is
measured by the absolute difference between the consensus forecasted EPS and actual EPS scaled
by stock price. Table 5 presents the results. I find that the abnormal returns during the deal active
period are concentrated in target firms suffering from greater information asymmetry, both
statistically and economically. For example, exogenously withdrawn LBO targets with analyst
forecast errors above the sample median display buy-and-hold abnormal returns of 20.5% and 16.4%
against the market portfolio and matching portfolio, respectively. On the contrary, exogenously
withdrawn LBO targets with analyst forecast errors below the sample median do not display any
abnormal returns during the deal active periods. Similar results are found when using the other two
measures of information asymmetry. The empirical findings in Table 5 provide indirect evidence
of the information advantage possessed by private equity investors. This information advantage is
more noticeable when public equity investors of target firms suffer additional information
asymmetry problems. However, in un-tabulated analysis, I fail to find differences in abnormal
returns between LBO transactions with and without management participation. Moreover, I fail to
find robust differences in abnormal returns between deals that occurred before and after the
enactment of “Regulation FD”. All of these pieces of evidence point out that the information
advantages possessed by private equity investors do not primarily come from target insiders.
Target insiders are not the only potential source from which private equity investors could glean
information that is typically not available to ordinary public equity investors. Recent anecdotal
evidence shows that the top private equity firms now hire former industry professionals in addition
to dealmakers with financial backgrounds. For example, former GE CEO Jack Welch joined

20
Clayton, Dubilier & Rice, and Lou Gerstner, formerly the head of RJR Nabisco and IBM, is
affiliated with Carlyle (Kaplan and Stromberg, 2009). It would be interesting to examine the
relationship between the backgrounds of general partners and the ability of private equity funds to
identify undervaluation, and determine whether the ability to identify undervalued firms is most
pronounced in industries in which the investment personnel in private equity firms have substantial
industrial experience. This is beyond the scope of this study due to the issue of data availability.
[Insert Table 5 here]
3.2 Does LBO improve operating performance?
This section examines whether private equity investors have operational engineering capacities.
Given that the data on the day-to-day operations of private companies are limited, I gauge
operational engineering by comparing changes in the operating performance of successful LBO
targets against changes in respective measure of failed LBO targets, during the three years before
and after LBOs end. Most of my sample of successful LBO targets cease public trading status after
the transaction and no longer file financial reports with the SEC. Meanwhile, Table 2 shows that
about one third of my sample of unsuccessful transactions are unconsummated because the private
equity firms are overbid and the targets are often bought out by another acquirer after the private
equity investors pulled out from the deal. As a result, only a subset of my LBO sample has at least
one year of financial data during both the three-year periods before and after the LBO transaction.
I end up with 115 completed LBOs, and 68 unconsummated LBOs, 25 of which are classified as
LBOs withdrawn for “exogenous reasons”. I employ standard difference-in-difference analyses in
Table 6 and Table 7, and multivariate regression analyses in Table 8.
Table 6 presents the results using the full sample of withdrawn LBOs as the control group. The
results show that successful LBO transactions drastically increase the profitability of target firms
compared with firms that fail in LBO transactions. For example, Panel 6A and Panel 6C indicate
that, firms which experienced failed LBOs do not exhibit any improvements in earnings and the
operating cash flow, while the firms going through LBOs enjoy earnings and operating cash flow
increases of 0.031 and 0.035 of their asset values, respectively. The differences in changes of

21
operational earnings and cash flows between successful and unsuccessful LBO targets are
significant below 1% significance level and are economically noticeable. Similar operation
improvements are documented when I compare the respective operating measure against the
industry median, as indicated in Panel 6B and Panel 6D. Previous research has found that private
equity investors increase the operating performance of target firms through cost cutting,
streamlining capital expenditures and sales of assets (Kaplan, 1989; Lichtenberg and Siegel, 1990).
Correspondingly, I examine capital expenditure changes in target firms after successful and failed
LBO transactions. I do not find any evidence that private equity firms pump up short-term profits
by disposing assets or slowing down capital expenditures. Panel 6E and Panel 6F show that both
successful LBO targets and failed LBO targets do not exhibit economically and statistically
differences in capital spending before and after LBO transactions. My results cast doubt on
previous claims that private equity ownership is associated with asset disposals. Panel 6G and
Panel 6H show that, as expected, successful LBO targets experience large hikes in their leverage
ratios after deal completions, compared with those of unsuccessful LBO targets. Interestingly, the
failed LBO targets also increase their leverage ratio by 0.077 after failed LBO transactions.
[Insert Table 6 here]
One concern, similar to that raised in section 3.1, is that deal withdrawals might be concomitant
with changes in targets’ fundamentals that could affect target firms’ performance afterwards. I
again compare the evolution of operating performance following successful LBO transactions and
unsuccessful LBO transactions for reasons exogenous to target quality. I find similar results which
are exhibited in Table 7. Successful LBOs always enjoy improvements in earnings and operating
cash flow scaled by assets, by economically significant amount of 0.031 and 0.035, respectively.
However, the targets in failed LBO samples do not exhibit any meaningful changes in their
operating performance measures. The results are qualitatively similar to the results reported Table
6 for capital expenditure and leverages19.
[Insert Table 7 here]
19 My results in Table 6 and Table 7 remain qualitatively similar if I use the same model specifications as those used
in Table 8.

22
In the analysis below, instead of using actual deal failures, I use as an explanatory variable a
predicted withdrawn probability from a linear probability regression which forecast the deal
withdrawal probability using deal characteristics, target pre-announcement financial conditions,
industry fixed effects, and changes in the high yield bond market index since deal announcement.
Table 8 shows the results. Column (1) and Column (2) of Panel 8B show that the change in the
average logarithm Merrill-Lynch high yield bond market index between the one quarter period
before the deal announcement and the period from the deal announcement to the deal ending is
negatively correlated with deal success probability. One standard deviation drop in the high-yield
bond market index reduces the deal success rate by 2% and 3%, depending on which alternative
estimation model is used. Moreover, using predicted withdrawal probabilities instead of actual
withdrawal cases yields similar results for difference in the operational changes between
successful and failed LBO targets before and after the LBO transactions. The target firms with
higher deal success probabilities exhibit improvements in earnings after controlling for deal
characteristics, pre-LBO target financial conditions, and the industry fixed effects. Similar results
are found for firm investment policy and capital structure changes. Overall, the empirical results
show that private equity investors are able to increase target firms’ operating performance. The
improvements in operating performance are not driven by changes in the targets’ fundamentals,
since exogenously failed LBO targets do not exhibit similar operational improvements. In addition,
the improvements do not appear to be driven by cost cutting and asset disposals. Interestingly, the
withdrawn LBO targets appear to emulate post-LBO capital structures by adding more debt on
their balance sheets20.
[Insert Table 8 here]
3.3 Does LBO transactions lower the target firms’ marginal tax rate?
20 One concern is that because I only observe the operating performance of targets after the LBO transactions that
have available SEC filings, and those firms might be of better quality since they have public debts outstanding, or
return to public stock markets, my results for changes in operating performance of successful LBO targets might not
represent the universe of LBO target firms. Unfortunately, I could not address this problem due to data availability
problems. For more discussion on this issue, please refer to Cohn, Mills and Towery(2013).

23
One debatable consequence of LBO transactions is that LBO transactions transfer government
income to post-LBO equity owners and debt holders. For example, Kaplan (1989b) estimate that
reduced tax payments increase firm value by 4% to 40% among target firms. The lower boundary
assumes that LBO debt is paid off within eight years and personal taxes on interest income offset
the corporate debt benefits from interest expenses. The upper boundary assumes that the debt is
permanent and that there is no offset from personal debt. Empirically an accurate estimate of the
tax benefit of LBO transactions is difficult (Kaplan and Stromberg, 2009), given that marginal tax
rates of one dollar additional income depends on current income and forecasted future incomes, as
well as carryforwards and carrybacks (Graham, 2000; Blouin, Core and Guay, 2010). This section
does not attempt to estimate the value implications of tax reductions, instead I offer empirical
evidence concerning whether the target firms are more inclined to efficiently adjust their capital
structures from the tax benefits perspective.
Table 9 reports the results. The dependent variable is equal to one if the target firm’s marginal tax
rate after interest expenses is at least 50 basis points lower than the marginal tax rate before interest
expenses, zero otherwise. Panel 9A uses the entire withdrawn sample as the control group. After
LBO transactions, target firms are 23.1% more likely to employ a capital structure that enables the
marginal tax rate after interest expenses to be at least 50 basis points lower than the marginal tax
rate before interest expenses, which indicates that private equity, after LBO transactions, is more
likely to employ a capital structure that enables the target firm to aggressively exploit the tax
benefits of debt. As regards the sample of withdrawn LBO targets, I do not observe a similar
pattern. Panel 9B uses “exogenously withdrawn” LBOs as control group and yields similar
conclusions. Overall, I find that private equity investors take more consideration of the tax benefits
brought about by interest payments when designing the capital structures of their portfolio firms21.
[Insert Table 9 here]
21 One question would be whether or not the documented tax benefit results are concentrated in the initial year after
the buyout completion when there is large LBO debt on the balance sheet. Over the time, the difference in tax benefits
between completed and withdrawn LBO targets diminishes as the completed LBO targets pay down the buyout debt.
I address this issue by comparing the probability that target firms’ marginal tax rates after interest expenses is at least
50 basis points lower than the marginal tax rates before interest expenses during the third year after the buyout
transactions and the three-year period before transactions, across successful and unconsummated LBO targets. I still
find economically and statistically significant differences between completed and withdrawn LBO targets.

24
3.4 CEO turnovers after the LBO transaction
Another potential effect brought about by private equity investors is that drastic changes in the
ownership structures of target firms facilitates the reshuffling of management teams. However,
recent evidence has shown that private equity investors tend to preserve the management teams of
target firms, and CEO turnover is less sensitive to target performance (Cornelli and Karakas, 2013).
In this part, I examine the CEO turnover rate of target firms during the one-year period after the
LBO transaction, using failed LBO targets as a control group. The results are presented in Table
10. In the first two columns, I use Probit model to link the CEO turnover probability with deal
outcomes. Withdrawn LBO targets are 17.8% less likely to change their CEOs after deal
withdrawals, compared with successful LBO targets. Using “exogenously withdrawn” LBOs as
the control group, as shown in column (2), does not change the results. In the following two
columns, I use a two-stage-least-square estimation approach, in which the first step uses the change
in the average logarithm Merrill-Lynch high yield bond market index between the one quarter
period before the deal announcement and the period from the deal announcement to the deal ending,
as an instrument for deal withdrawal. The F-statistic in the first step is above 10, as shown in
column (3), which indicates the strong power of the instrument. Again, the results are qualitatively
similar. The effects of the other control variables are as expected. For example, target CEOs are
more likely to step down if the target stock performance before the LBO announcement is worse
and the LBO is hostile. The last column examines differences in CEO turnover sensitivity to firm
performance by comparing successful and failed LBO targets. Consistent with recent literature
(Cornelli and Karakas, 2013), the CEO turnover in target firms for successful LBOs is less
sensitive to stock performance compared with unconsummated LBO transactions, as indicated by
the negative coefficient on the interactive term between the deal withdrawal and the target firm
performance, which is -0.353 and statistically significant below the 5% significance level. Overall,
I find that LBO transactions facilitates the reshuffling of top management teams of target firms.
Nevertheless, private equity firms rely more on private information over long horizon to evaluate
the performance of target CEOs.
[Insert Table 10 here]

25
4. Conclusion
This paper examines the economic consequences of LBO transactions sponsored by private equity
investors. Firstly, I find that the stock market revaluates target firms that have been subjected to
unsuccessful LBOs by private equity firms. This result is not driven by new information releases
or fundamental firm changes during LBO withdrawals, and are concentrated in target firms that
suffer from greater information asymmetry problems. Overall, the empirical finding is consistent
with the view that private equity firms are savvy investors in public equity markets that are able to
identify undervalued companies. Moreover, using withdrawn LBO targets as a benchmark group,
this paper documents increases in profitability and the operating cash flow of firms that
experienced successful LBO transactions. The operational improvements remain similar when
using “exogenously withdrawn” LBO targets as the control group, and when using predicted
withdrawn probability due to the adverse movements of the high yield bond market instead of the
actual deal withdrawals. These tests rule out the possibility that the reasons behind deal failures
drive the observed operational improvements. I further demonstrate that private equity firms
leverage up the target firms after the LBO transactions, compared with target firms that are not
bought out by private equities. Private equities adjust the capital structures of targets in a manner
consistent with the tax benefits of leverage, and ownership changes in target firms facilitate the
reshuffling of management teams based on private information about mangers’ quality. As a result,
the turnover sensitivity to performance decreases for successful LBO target firms, compared with
unconsummated LBO target firms.
The findings of this paper pave the way for further studies of the economic consequences of private
equity investments. Firstly, detailed examinations of the channels through which the private equity
identify undervalued targets would be beneficial. In un-tabulated results, I do not find the targets’
abnormal returns to be systematically different between deals with and without management
participation. Moreover, the abnormal returns do not reflect any difference between deals
announced before or after the enactment of Regulation FD. Insider information does not appear
to play a vital role in private equity investors’ target identification processes. Recent anecdotal
evidence shows that top private equity firms now hire former industry professionals in addition to
dealmakers with financial backgrounds. For example, former GE CEO Jack Welch joined Clayton,

26
Dubilier & Rice and Lou Gerstner, once at the helm of RJR Nabisco and IBM, is affiliated with
Carlyle (Kaplan and Stromberg, 2009).
One promising way to examine the target identification process used by private equity investors
would be to link the general partners’ backgrounds with the investment choices and investment
performance of private equity transactions. The paper offers some preliminary evidence that target
firms from withdrawn LBOs emulate LBO capital structures by leverage-up themselves. A detailed
examination of the financial and real policy changes following LBO failures would provide useful
guidance for the top managements of corporate America.

27
References
Acharya, Viral, Oliver Gottschalg, Moritz Hahn and Conor Kehoe, 2013. Corporate governance
and value creation: Evidence from private equity. Review of Financial Studies 26, 368-402.
Axelson, Ulf, Tim Jenkinson, Per Stromberg and Michael Weisbach, 2013. Borrow cheap, buy
high? The determinants of leverage and pricing in buyouts. The Journal of Finance, forthcoming.
Bain and Company, 2013. Global private equity report 2013.
Barber, Brad and John Lyon, 1997. Detecting long-run abnormal stock returns: The empirical
power and specification of test statistics. Journal of Financial Economics 43, 341-372.
Bernstein, Shai and Albert Sheen, 2016. The operational consequences of private equity buyouts
Evidence from the restaurant industry. Review of Financial Studies 29, 2387-2418.
Blouin, Jennifer, John Core and Wayne Guay, 2010. Have the tax benefits of debt been
overestimated? Journal of Financial Economics 98, 195-213.
Bloomberg BusinessWeek Magazine, 2006. Buy it, strip it then flip it.
Cohen, Randoph, Christopher Polk and Tuomo Vuolteenaho, 2003. The value spread. The Journal
of Finance 58, 609-642.
Cohn, Jonathan, Lilian Mills and Erin Towery, 2014. The evolution of capital structure and
operating performance after leveraged buyouts. Journal of Financial Economics, 111, 469-494.
Cornelli, Francesca and Oguzhan Karakas, 2013. CEO turnover in LBOs: The role of boards.
Working paper.
Custódio, Claudia, 2014. Mergers and acquisitions accounting and the diversification discount.
The Journal of Finance 69, 219-240.
Davis, Steven, John Haltiwanger, Kyle Handley, Ron Jarmin, Josh Lerner and Javier Miranda,
2014. Private equity, jobs and productivity. The American Economic Review 104, 3956-3990.
DeAngelo, Harry, Linda DeAngelo and Edward Rice, 1984. Going private: Minority freeze outs
and stockholders’ wealth. Journal of Law and Economics 27, 367-401.
Dittmar, Amy, Di Li and Amrita Nain, 2012. It pays to follow the leader: Acquiring targets picked
by private equity. Journal of Financial and Quantitative Analysis 47, 901-931.
Duchin, Ran, John Matsusaka and Oguzhan Ozbas, 2010. When are outside directors effective?
Journal of Financial Economics 96, 195-214.
Gorbenko, Alexander and Andrey Malenko, 2014. Strategic and financial bidders in takeover
auctions. The Journal of Finance 69, 2513-2555.
Graham, John, 2000. How big are the tax benefits of debt? The Journal of Finance 55, 1901-1941.
28
Guo, Shourun, Edith Hotchkiss and Weihong Song, 2011. Do buyouts (still) create value? The
Journal of Finance 66, 479-517.
Harris, Robert, Tim Jenkinson and Steven Kaplan, 2014. Private equity performance: What do we
know? The Journal of Finance 69, 1851-1882.
He, Jie and Xuan Tian, 2013. The dark side of analyst coverage: The case of innovation. Journal
of Financial Economics 109, 856-878.
Higson, Chris and Rudiger Stucke, 2012. The performance of private equity. Working paper.
Jensen, Michael. 1989. Eclipse of the public corporation. Harvard Business Review 67, 61–74.
Kaplan, Steven, 1989a. Management buyouts: Evidence on taxes as a source of value. The Journal
of Finance 44, 611-632.
Kaplan, Steven, 1989b. The effects of management buyouts on operating performance and value.
Journal of Financial Economics 24, 217-254.
Kaplan, Steven and Per Stromberg, 2009. Leveraged buyouts and private equity. Journal of
Economic Perspectives 23, 121-146.
Kaplan, Steven and Jeremy Stein, 1993. The evolution of buyout pricing and financial structure in
the 1980s. The Quarterly Journal of Economics 108, 313-357.
Lee, Scott, 1992. Management buyout proposals and inside information. The Journal of Finance
47, 1061-1079.
Lichtenberg, Frank and Donald Siegel, 1990. The effects of leveraged buyouts on productivity and
related aspects of firm behavior. Journal of Financial Economics 27, 165-194.
Malmendier, Ulrike, Marcus Opp and Farzad Saidi, 2016. Target revaluation after failed takeover
attempts: Cash versus stock. Journal of Financial Economics 119, 92-106.
Marais, Laurentius, Katherine Schipper and Abbie Smith, 1989. Wealth effects of going private
for senior securities. Journal of Financial Economics 23, 155-191.
Ofek, Eli, 1994. Efficiency gains in unsuccessful management buyouts. The Journal of Finance 49,
637-654.
Robinson, David and Berk Sensoy, 2013. Do private equity fund managers earn their fees?
Compensation, ownership, and cash flow performance. Review of Financial Studies 26, 2760-
2797.
Savor, Pavel and Qi Lu, 2009. Do stock mergers create value for acquirers? The Journal of Finance
64, 1061-1097.
Schwert, William, 1996. Markup pricing in mergers and acquisitions. Journal of Financial
Economics 41, 153-192.

29
Smith, Abbie, 1990. Corporate ownership structure and performance: The case of management
buyouts. Journal of Financial Economics 27, 143-164.

30
Figure 1 Cumulative abnormal returns for withdrawn LBOs
Figure 1A Cumulative abnormal returns for all withdrawn deals

31
Figure 1B Cumulative abnormal returns for exogenously withdrawn deals

32
Table 1 Annual distribution of leveraged buyouts with private equity participation
Table 1 reports the annual distribution of number of total LBOs with private equity participation, as well as number
of the successful deals and withdrawn deals according to deal announcement year.
Announcement year Total LBOs Successful LBOs Withdrawn LBOs
1979 1 0 1
1984 9 4 5
1985 22 12 10
1986 25 22 3
1987 26 18 8
1988 53 41 12
1989 15 9 6
1990 4 4 0
1991 2 1 1
1992 3 1 2
1993 4 4 0
1994 5 4 1
1995 5 4 1
1996 10 9 1
1997 17 14 3
1998 17 13 4
1999 36 28 8
2000 33 28 5
2001 9 9 0
2002 12 9 3
2003 12 9 3
2004 23 18 5
2005 39 33 6
2006 64 55 9
2007 64 50 14
2008 21 14 7
2009 19 13 6
2010 37 35 2
2011 23 23 0
Total 610 484 126

33
Table 2 Distribution of deal withdrawn reasons
Table 2 presents the reason behind each withdrawn deal. I search for news articles around deal withdrawal dates from
LexisNexis for withdrawal reasons. The 40 deals withdrawn for reasons specified in bold and italic letters are the ones
withdrawn without disclosing any information with regard to target performance or target stock price during the deal
outstanding period (“exogenously withdrawn” sample thereafter).
Withdrawal reason # cases
Adverse change in capital market and economic conditions 7
Favorable change in public equity market 1
Lack of finance 5
Target's high leverage 1
Negotiation failed due to price disagreement 19
Negotiation failed due to reasons other than bid price issue, target news or target performance 24
Negative target news (material adverse change of the target) /poor performance 17
Outbid by another acquirer 37
Positive target news/strong performance 3
Rejected by regulatory government agency 3
Withdrawn reason not specified 9
Total cases 126

34
Table 3 LBO characteristics
Table 3 reports the mean, median and standard deviation of characteristics for successful LBOs, Withdrawn LBOs, as
well as “exogenously withdrawn” LBOs. The definitions of variables are present in section 2.5
Panel 3A Successful LBOs
N Mean Median S.D.
deal value ($ million) 473 1622.56 344.5 4493
hostile bid dummy 484 0.01 0 0.1
target cash flow 429 0.07 0.09 0.16
target financial leverage 439 0.29 0.27 0.26
target market-to-book ratio 433 4.19 1.23 57.71
target cash holdings 439 0.12 0.06 0.15
target stock performance 457 0 -0.02 0.41
deal length (days) 484 125.35 113 76.12
announcement return 422 0.2 0.17 0.23
competing deal 484 0.11 0 0.32
Panel 3B All withdrawn LBOs
deal value ($ million) 117 1297.97 378.85 2965.71
hostile bid dummy 126 0.06 0 0.23
target cash flow 120 0.07 0.08 0.11
target financial leverage 122 0.3 0.28 0.23
target market-to-book ratio 122 6.19 1.17 53.62
target cash holdings 122 0.11 0.04 0.15
target stock performance 122 -0.08 -0.1 0.41
deal length (days) 126 130.72 106.5 107.85
announcement return 120 0.18 0.15 0.16
competing deal 126 0.33 0 0.47
Panel 3C "Exogenously withdrawn" LBOs
deal value ($ million) 34 1171.54 468.64 1983.71
hostile bid dummy 35 0.09 0 0.28
target cash flow 34 0.09 0.09 0.07
target financial leverage 35 0.28 0.29 0.2
target market-to-book ratio 35 1.25 1.08 0.53
target cash holdings 35 0.08 0.03 0.12
target stock performance 35 -0.03 -0.07 0.4
deal length (days) 35 125.06 102 115.58
announcement return 35 0.17 0.14 0.18
competing deal 35 0.06 0 0.24

35
Table 4 Stock returns for withdrawn leveraged buyouts
For each LBO deal, I calculate the abnormal buy-and-hold return, cumulative abnormal return, and standardized daily
abnormal return for the target stock in question, from 25 trading days before the deal announcement date till 25 trading
days after the deal withdrawn date. The benchmark portfolios are value-weighted market portfolio for “Market
portfolio” column and a three-firm portfolio matching on Fama-French 49 industry, size and book-to-market ratio,
similar to Barber and Lyon (1997), in the “Matching portfolio” column. LBOs withdrawn for exogenous reasons are
defined in Table 2. I classify LBOs withdrawn due to adverse change in high-yield bond market since announcement
if the change in average log high-yield bond market index between one quarter before the announcement and the LBO
period are among the worst 25% among all LBOs announced during that year. Withdrawn LBOs without subsequent
bids are withdrawn deals without any subsequent acquisition bids at least one year thereafter. T-statistics are in
parenthesis. ***, **, * denotes statistically significant below 1%, 5%, 10% level, respectively.
Panel 4A All withdrawn private equity LBOs
Market
portfolio
Matching
portfolio
105 cases
Raw buy-and-hold return 0.173***
(4.212)
Raw cumulative return 0.203***
(5.833)
Abnormal buy-and-hold return 0.119*** 0.106**
(2.987) (2.385)
Cumulative abnormal return 0.149*** 0.135***
(4.434) (3.640)
Standardized daily abnormal buy-and-hold return 0.0011*** 0.0008*** 0.0008***
(4.071) (3.122) (2.922)
Panel 4B Leveraged buyouts withdrawn for "exogenous" reasons
Market
portfolio
Matching
portfolio
35 cases
Raw buy-and-hold return 0.145**
(2.692)
Raw cumulative return 0.181***
(3.794)
Abnormal buy-and-hold return 0.099* 0.134***
(1.980) (3.086)
Cumulative abnormal return 0.134*** 0.165***
(3.040) (3.960)
Standardized daily abnormal buy-and-hold return 0.0011** 0.0009** 0.0012***
(2.317) (2.267) (2.968)
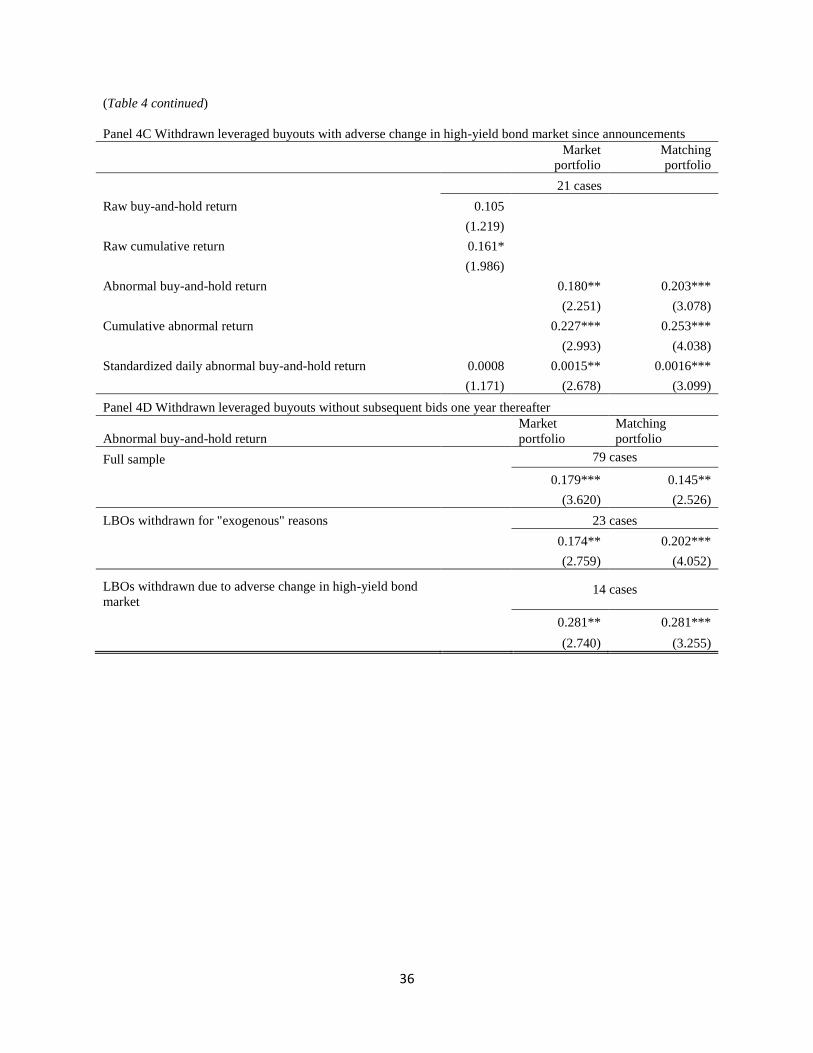
36
(Table 4 continued)
Panel 4C Withdrawn leveraged buyouts with adverse change in high-yield bond market since announcements
Market
portfolio
Matching
portfolio
21 cases
Raw buy-and-hold return 0.105
(1.219)
Raw cumulative return 0.161*
(1.986)
Abnormal buy-and-hold return 0.180** 0.203***
(2.251) (3.078)
Cumulative abnormal return 0.227*** 0.253***
(2.993) (4.038)
Standardized daily abnormal buy-and-hold return 0.0008 0.0015** 0.0016***
(1.171) (2.678) (3.099)
Panel 4D Withdrawn leveraged buyouts without subsequent bids one year thereafter
Abnormal buy-and-hold return
Market
portfolio
Matching
portfolio
Full sample 79 cases
0.179*** 0.145**
(3.620) (2.526)
LBOs withdrawn for "exogenous" reasons 23 cases
0.174** 0.202***
(2.759) (4.052)
LBOs withdrawn due to adverse change in high-yield bond
market
14 cases
0.281** 0.281***
(2.740) (3.255)
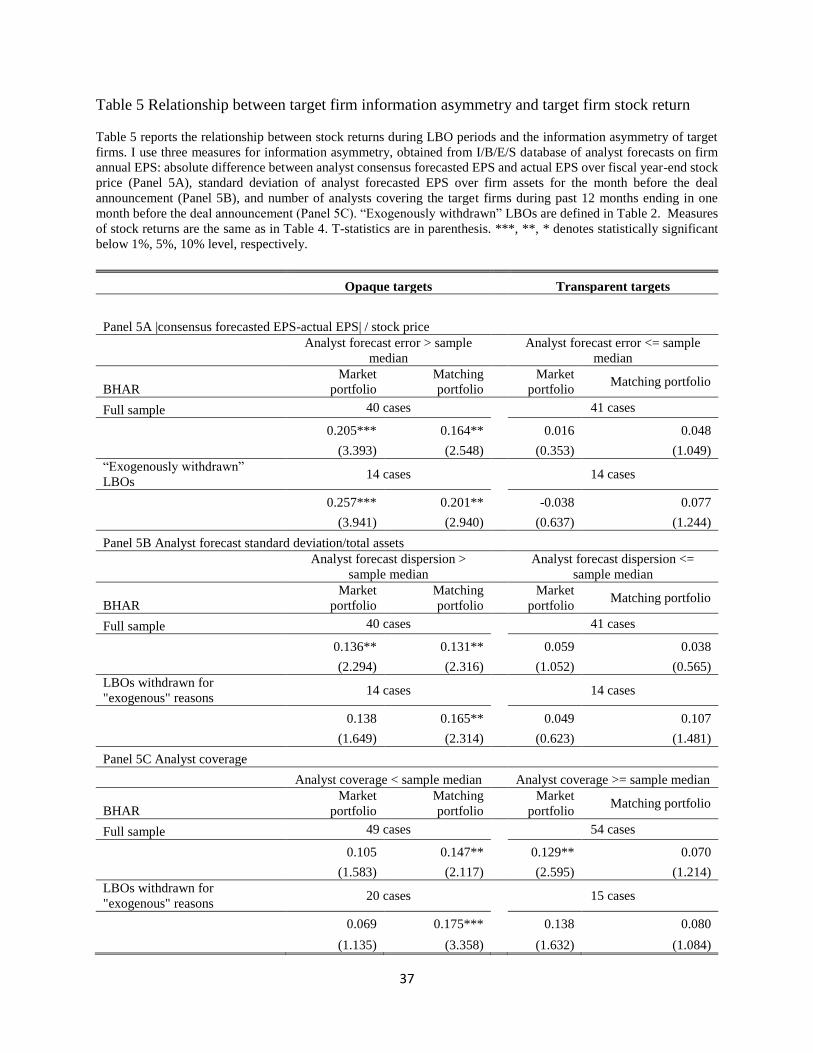
37
Table 5 Relationship between target firm information asymmetry and target firm stock return
Table 5 reports the relationship between stock returns during LBO periods and the information asymmetry of target
firms. I use three measures for information asymmetry, obtained from I/B/E/S database of analyst forecasts on firm
annual EPS: absolute difference between analyst consensus forecasted EPS and actual EPS over fiscal year-end stock
price (Panel 5A), standard deviation of analyst forecasted EPS over firm assets for the month before the deal
announcement (Panel 5B), and number of analysts covering the target firms during past 12 months ending in one
month before the deal announcement (Panel 5C). “Exogenously withdrawn” LBOs are defined in Table 2. Measures
of stock returns are the same as in Table 4. T-statistics are in parenthesis. ***, **, * denotes statistically significant
below 1%, 5%, 10% level, respectively.
Opaque targets Transparent targets
Panel 5A |consensus forecasted EPS-actual EPS| / stock price
Analyst forecast error > sample
median
Analyst forecast error <= sample
median
BHAR
Market
portfolio
Matching
portfolio
Market
portfolio Matching portfolio
Full sample 40 cases 41 cases
0.205*** 0.164** 0.016 0.048
(3.393) (2.548) (0.353) (1.049)
“Exogenously withdrawn”
LBOs 14 cases 14 cases
0.257*** 0.201** -0.038 0.077
(3.941) (2.940) (0.637) (1.244)
Panel 5B Analyst forecast standard deviation/total assets
Analyst forecast dispersion >
sample median
Analyst forecast dispersion <=
sample median
BHAR
Market
portfolio
Matching
portfolio
Market
portfolio Matching portfolio
Full sample 40 cases 41 cases
0.136** 0.131** 0.059 0.038
(2.294) (2.316) (1.052) (0.565)
LBOs withdrawn for
"exogenous" reasons 14 cases 14 cases
0.138 0.165** 0.049 0.107
(1.649) (2.314) (0.623) (1.481)
Panel 5C Analyst coverage
Analyst coverage < sample median Analyst coverage >= sample median
BHAR
Market
portfolio
Matching
portfolio
Market
portfolio Matching portfolio
Full sample 49 cases 54 cases
0.105 0.147** 0.129** 0.070
(1.583) (2.117) (2.595) (1.214)
LBOs withdrawn for
"exogenous" reasons 20 cases 15 cases
0.069 0.175*** 0.138 0.080
(1.135) (3.358) (1.632) (1.084)

38
Table 6 Operating performance and firm policy following LBO transactions: All withdrawn
sample
Table 6 compares the operating performance, investment and capital structure, for successful and withdrawn LBOs
three years before and after the LBO closing. I exclude the year during which the LBO ends. Operating cash flow is
defined as EBITDA minus capital expenditure. Financial leverage is defined as the sum of debt in current liabilities
and long-term debt. Panel 6A, 6C, 6E, 6G reports raw measures, and Panel 6B, 6D, 6F, 6H report raw measures minus
median value for all firms in the sample 4 digit SIC industry in the year. Robust T-statistics are in parentheses. ***,
**, * denotes statistically significant below 1%, 5%, 10% level, respectively.
Panel 6A EBITDA/Total assets
Before After After-Before
Withdrawn deals 0.126 0.124 -0.002
(0.253)
Successful deals 0.095 0.125 0.031***
(6.303)
Withdrawn-successful 0.031*** -0.001 -0.032***
(5.504) (0.137) (-3.574)
Panel 6B EBITDA/Total assets - 4 digit SIC industry median
Before After After-Before
Withdrawn deals 0.012 0.013 0.000
(0.064)
Successful deals -0.027 0.011 0.038***
(7.239)
Withdrawn-successful 0.039*** 0.001 -0.038***
(6.705) (0.209) (-4.228)
Panel 6C Operating cash flows/Total assets
Before After After-Before
Withdrawn deals 0.06 0.065 0.005
(0.493)
Successful deals 0.05 0.085 0.035***
(7.260)
Withdrawn-successful 0.010 -0.020** -0.030***
(1.563) (2.409) (2.856)
Panel 6D Operating cash flows/Total assets - 4 digit SIC industry median
Before After After-Before
Withdrawn deals 0.02 0.012 -0.008
(1.026)
Successful deals -0.002 0.026 0.028***
(5.744)
Withdrawn-successful 0.023*** -0.013* -0.036***
(3.903) (1.864) (3.929)
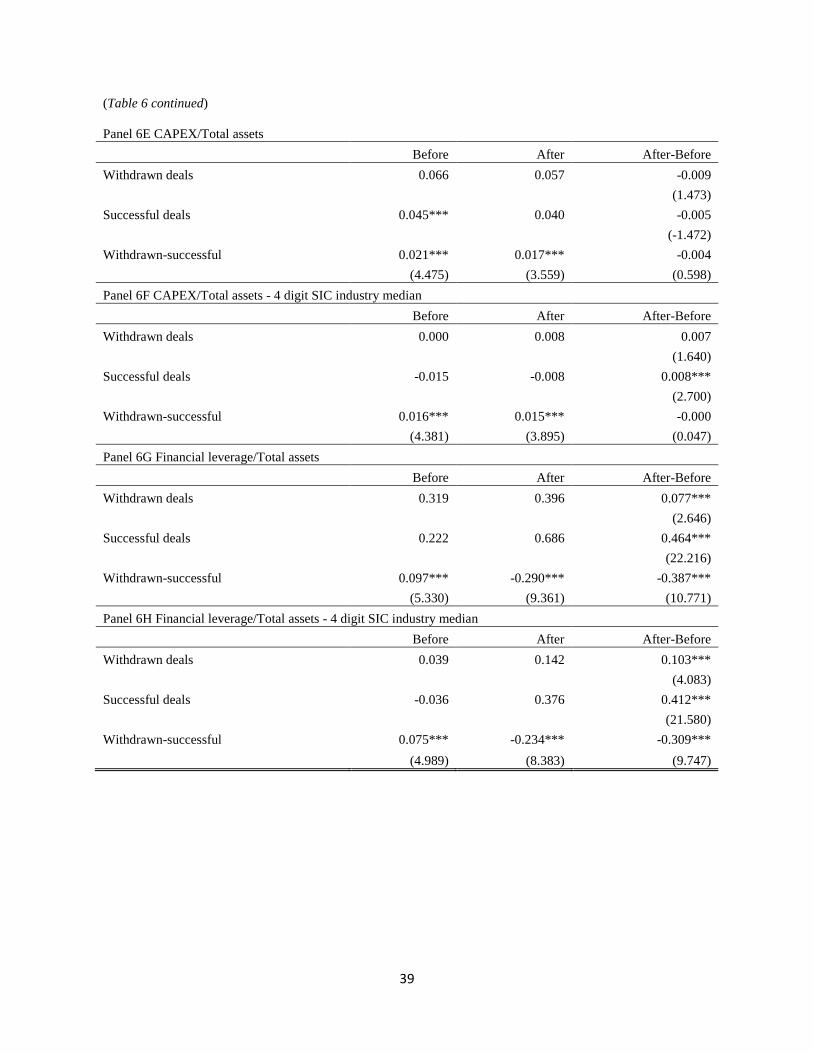
39
(Table 6 continued)
Panel 6E CAPEX/Total assets
Before After After-Before
Withdrawn deals 0.066 0.057 -0.009
(1.473)
Successful deals 0.045*** 0.040 -0.005
(-1.472)
Withdrawn-successful 0.021*** 0.017*** -0.004
(4.475) (3.559) (0.598)
Panel 6F CAPEX/Total assets - 4 digit SIC industry median
Before After After-Before
Withdrawn deals 0.000 0.008 0.007
(1.640)
Successful deals -0.015 -0.008 0.008***
(2.700)
Withdrawn-successful 0.016*** 0.015*** -0.000
(4.381) (3.895) (0.047)
Panel 6G Financial leverage/Total assets
Before After After-Before
Withdrawn deals 0.319 0.396 0.077***
(2.646)
Successful deals 0.222 0.686 0.464***
(22.216)
Withdrawn-successful 0.097*** -0.290*** -0.387***
(5.330) (9.361) (10.771)
Panel 6H Financial leverage/Total assets - 4 digit SIC industry median
Before After After-Before
Withdrawn deals 0.039 0.142 0.103***
(4.083)
Successful deals -0.036 0.376 0.412***
(21.580)
Withdrawn-successful 0.075*** -0.234*** -0.309***
(4.989) (8.383) (9.747)
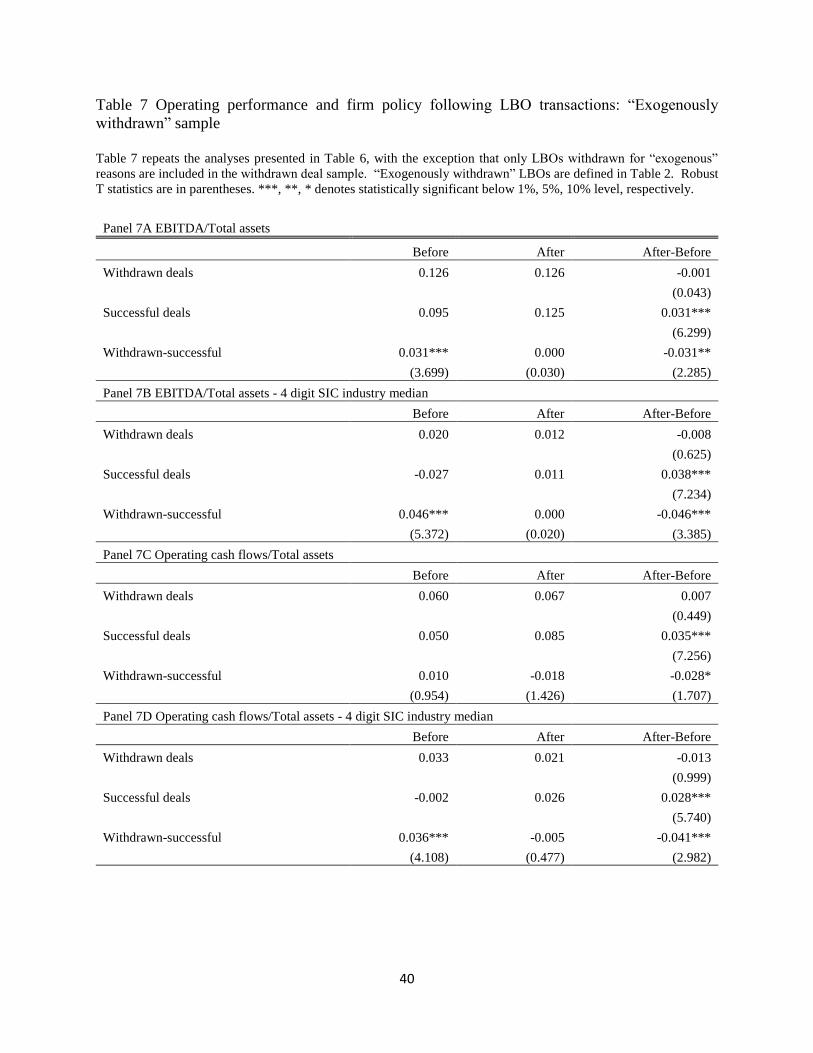
40
Table 7 Operating performance and firm policy following LBO transactions: “Exogenously
withdrawn” sample
Table 7 repeats the analyses presented in Table 6, with the exception that only LBOs withdrawn for “exogenous”
reasons are included in the withdrawn deal sample. “Exogenously withdrawn” LBOs are defined in Table 2. Robust
T statistics are in parentheses. ***, **, * denotes statistically significant below 1%, 5%, 10% level, respectively.
Panel 7A EBITDA/Total assets
Before After After-Before
Withdrawn deals 0.126 0.126 -0.001
(0.043)
Successful deals 0.095 0.125 0.031***
(6.299)
Withdrawn-successful 0.031*** 0.000 -0.031**
(3.699) (0.030) (2.285)
Panel 7B EBITDA/Total assets - 4 digit SIC industry median
Before After After-Before
Withdrawn deals 0.020 0.012 -0.008
(0.625)
Successful deals -0.027 0.011 0.038***
(7.234)
Withdrawn-successful 0.046*** 0.000 -0.046***
(5.372) (0.020) (3.385)
Panel 7C Operating cash flows/Total assets
Before After After-Before
Withdrawn deals 0.060 0.067 0.007
(0.449)
Successful deals 0.050 0.085 0.035***
(7.256)
Withdrawn-successful 0.010 -0.018 -0.028*
(0.954) (1.426) (1.707)
Panel 7D Operating cash flows/Total assets - 4 digit SIC industry median
Before After After-Before
Withdrawn deals 0.033 0.021 -0.013
(0.999)
Successful deals -0.002 0.026 0.028***
(5.740)
Withdrawn-successful 0.036*** -0.005 -0.041***
(4.108) (0.477) (2.982)

41
(Table 7 continued)
Panel 7E CAPEX/Total assets
Before After After-Before
Withdrawn deals 0.067 0.054 -0.012
-1.217
Successful deals 0.045 0.040 -0.005
-1.471
Withdrawn-successful 0.022*** 0.014** -0.008
(2.757) (2.023) (0.722)
Panel 7F CAPEX/Total assets - 4 digit SIC industry median
Before After After-Before
Withdrawn deals -0.006 -0.003 0.003
(0.353)
Successful deals -0.015 -0.008 0.008***
(2.698)
Withdrawn-successful 0.009 0.004 -0.005
(1.402) (0.714) (0.514)
Panel 7G Financial leverage/Total assets
Before After After-Before
Withdrawn deals 0.287 0.434 0.148***
(2.735)
Successful deals 0.222 0.686 0.464***
(22.202)
Withdrawn-successful 0.065** -0.252*** -0.317***
(2.558) (4.836) (5.468)
Panel 7H Financial leverage/Total assets - 4 digit SIC industry median
Before After After-Before
Withdrawn deals 0.031 0.180 0.149***
(3.061)
Successful deals -0.036 0.376 0.412***
(21.566)
Withdrawn-successful 0.068*** -0.196*** -0.264***
(3.085) (4.132) (5.047)

42
Table 8 Operating performance and firm policy following LBO transactions: Full control and
predicted withdrawal
Table 8 repeats analyses presented in Table 6 and Table 7, but with more controls. Log (deal value) is logarithm of
deal value. Hostile deal is equal to one if the LBO is classified as hostile. Target financial conditions before the LBO
announcement are obtained from COMPUSTAT annual tapes. Target cash flow is defined as the sum of COMPUSTAT
Item IB and DP over AT. Target financial leverage is defined as sum of DLTT and DLC over AT. Target Q is defined
as market value of assets over book value of assets, where market value of assets is equal to AT plus market value of
equity minus TXDB minus CEQ, and market value of equity is PRCC multiplied by CSHO. Target cash holdings is
defined as CHE over AT. Target stock price performance is defined as abnormal buy-and-hold return against market
portfolio for one year period ending in 11 days before deal announcement. LBO duration is logarithm of number of
days between deal announcement and deal close. LBO announcement return is defined as the three-day cumulative
abnormal return surrounding the LBO announcement dates. Competing deal is equal to one if there are multiple
bidders for the target. Changes in average Log high-yield bond market index is defined as change in average log high-
yield bond market index between one quarter period before the announcement and the period from deal announcement
to deal ending. Industry fixed effects are included in the regressions. Standard errors are robust and clustered by
industry. T statistics are in parentheses. ***, **, * denotes statistically significant below 1%, 5%, 10% level,
respectively.

43
Panel 8A Actual withdrawn LBOs
EBITDA/Total
assets
Operating
cash
flow/Total
assets
Capital
expenditure/Total
assets
Financial
leverage/Total
assets
(1) (2) (3) (4)
After 0.030*** 0.034*** -0.004* 0.479***
(8.138) (8.244) (-1.681) (24.260)
After × Withdrawn -0.033*** -0.032*** -0.003 -0.394***
(-4.358) (-3.471) (-0.534) (-12.498)
Withdrawn 0.029*** 0.015* 0.014** 0.095***
(4.454) (1.679) (2.255) (3.521)
Log(deal value) -0.002 0.005** -0.008*** 0.022**
(-1.034) (2.059) (-4.190) (2.060)
Hostile deal 0.034** 0.013 0.023** -0.002
(2.027) (0.765) (2.249) (-0.029)
Target cash flow before LBO 0.389*** 0.173 0.205*** 0.046
(4.316) (1.469) (2.893) (0.303)
Target financial leverage before LBO 0.104*** 0.130*** -0.029 0.657***
(3.363) (3.192) (-1.186) (5.195)
Target Q before LBO 0.003 0.005 -0.004 0.066
(0.305) (0.389) (-0.834) (1.488)
Target cash holdings before LBO 0.084** 0.129*** -0.055** -0.007
(1.979) (2.820) (-2.002) (-0.044)
Target stock price run-up before LBO -0.013 -0.004 -0.008 -0.075*
(-1.552) (-0.389) (-1.265) (-1.780)
LBO time length 0.002 -0.001 0.004 -0.016
(0.439) (-0.188) (0.922) (-0.796)
LBO announcement return -0.012 -0.009 -0.004 -0.146*
(-0.498) (-0.246) (-0.158) (-1.776)
Competing deals 0.004 -0.004 0.008 -0.062*
(0.562) (-0.478) (1.423) (-1.858)
Industry fixed effects Yes Yes Yes Yes
Observations 929 929 929 929
R-squared 0.555 0.502 0.562 0.631
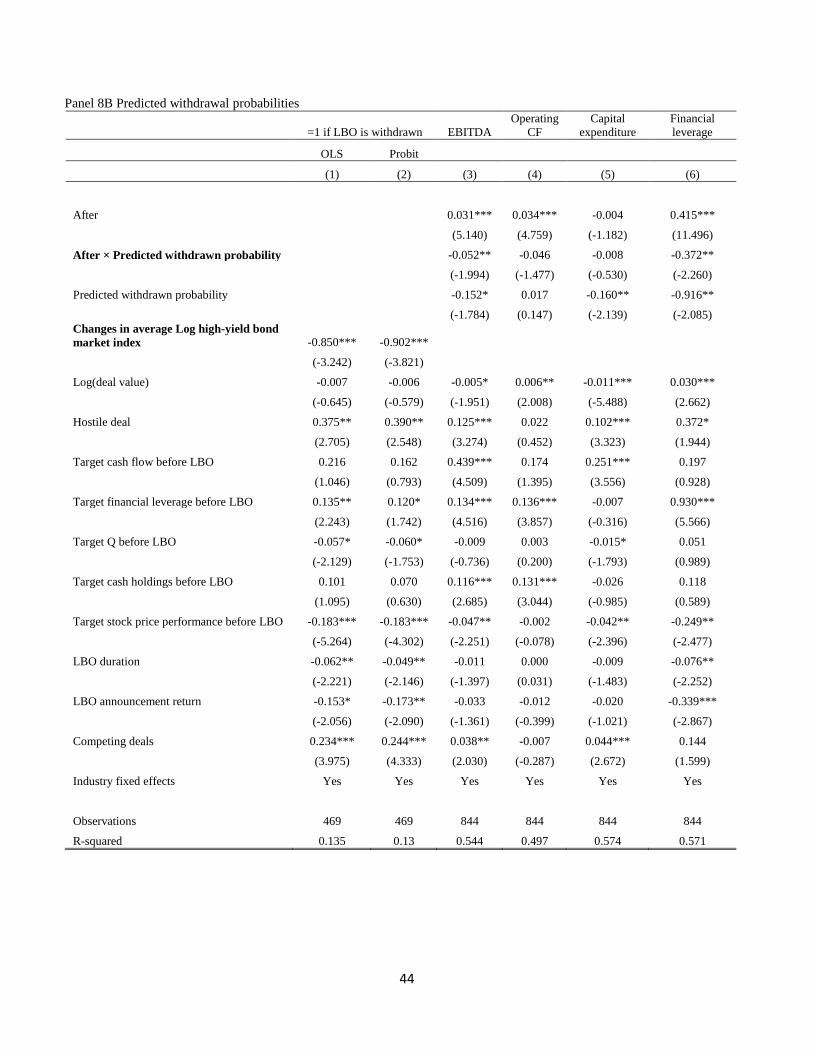
44
Panel 8B Predicted withdrawal probabilities
=1 if LBO is withdrawn EBITDA
Operating
CF
Capital
expenditure
Financial
leverage
OLS Probit
(1) (2) (3) (4) (5) (6)
After 0.031*** 0.034*** -0.004 0.415***
(5.140) (4.759) (-1.182) (11.496)
After × Predicted withdrawn probability -0.052** -0.046 -0.008 -0.372**
(-1.994) (-1.477) (-0.530) (-2.260)
Predicted withdrawn probability -0.152* 0.017 -0.160** -0.916**
(-1.784) (0.147) (-2.139) (-2.085)
Changes in average Log high-yield bond
market index -0.850*** -0.902***
(-3.242) (-3.821)
Log(deal value) -0.007 -0.006 -0.005* 0.006** -0.011*** 0.030***
(-0.645) (-0.579) (-1.951) (2.008) (-5.488) (2.662)
Hostile deal 0.375** 0.390** 0.125*** 0.022 0.102*** 0.372*
(2.705) (2.548) (3.274) (0.452) (3.323) (1.944)
Target cash flow before LBO 0.216 0.162 0.439*** 0.174 0.251*** 0.197
(1.046) (0.793) (4.509) (1.395) (3.556) (0.928)
Target financial leverage before LBO 0.135** 0.120* 0.134*** 0.136*** -0.007 0.930***
(2.243) (1.742) (4.516) (3.857) (-0.316) (5.566)
Target Q before LBO -0.057* -0.060* -0.009 0.003 -0.015* 0.051
(-2.129) (-1.753) (-0.736) (0.200) (-1.793) (0.989)
Target cash holdings before LBO 0.101 0.070 0.116*** 0.131*** -0.026 0.118
(1.095) (0.630) (2.685) (3.044) (-0.985) (0.589)
Target stock price performance before LBO -0.183*** -0.183*** -0.047** -0.002 -0.042** -0.249**
(-5.264) (-4.302) (-2.251) (-0.078) (-2.396) (-2.477)
LBO duration -0.062** -0.049** -0.011 0.000 -0.009 -0.076**
(-2.221) (-2.146) (-1.397) (0.031) (-1.483) (-2.252)
LBO announcement return -0.153* -0.173** -0.033 -0.012 -0.020 -0.339***
(-2.056) (-2.090) (-1.361) (-0.399) (-1.021) (-2.867)
Competing deals 0.234*** 0.244*** 0.038** -0.007 0.044*** 0.144
(3.975) (4.333) (2.030) (-0.287) (2.672) (1.599)
Industry fixed effects Yes Yes Yes Yes Yes Yes
Observations 469 469 844 844 844 844
R-squared 0.135 0.13 0.544 0.497 0.574 0.571

45
Table 9 Tax policies following LBO transactions
Table 9 examines whether target firms make more use of tax benefit of interest deductions after the LBO transaction.
The dependent variable is equal to one if the difference between marginal tax rate before and after interest expenses
is greater or equal to 50 basis points (“Graham's Kink”, Graham, 2000). Panel 9A uses all withdrawn sample as
control group, while Panel 9B uses only LBOs withdrawn for “exogenous” reasons as the control sample.
“Exogenously withdrawn” LBOs are defined in Table 2. Robust T-statistics are in parentheses. ***, **,* denotes
statistically significant below 1%, 5%, 10% level, respectively.
Panel 9A Full sample
Before After After-Before
Withdrawn deals 0.711 0.756 0.045
(0.952)
Successful deals 0.576 0.807 0.231***
(5.982)
Withdrawn-successful 0.135*** -0.051 -0.187***
(3.047) (-1.232) (-3.066)
Panel 9B Exogenously withdrawn sample
Before After After-Before
Withdrawn deals 0.716 0.679 -0.038
(-0.453)
Successful deals 0.576 0.807 0.231***
(5.977)
Withdrawn-successful 0.140** -0.129* -0.269***
(2.243) (-1.908) (-2.925)

46
Table 10 CEO turnovers after leveraged buyouts Table 10 compares the probability of CEO turnovers between completed and withdrawn LBOs. Turnover is equal to
one if the CEO of target firm steps down within one year period after the deal ends, and zero otherwise. Column (1)
include all withdrawn LBOs; Column (2) includes only withdrawn LBOs due to “exogenous” reasons, which are
defined in Table 2; Column (3) and (4) use two-stage least square regressions to address the endogeneity of deal
withdrawal. All variables are defined in the same manner as in Table 8. Industry fixed effects are included in the
regressions. Standard errors are robust and clustered by industry. T statistics are in parentheses. ***, **,* denotes
statistically significant below 1%, 5%, 10% level, respectively.
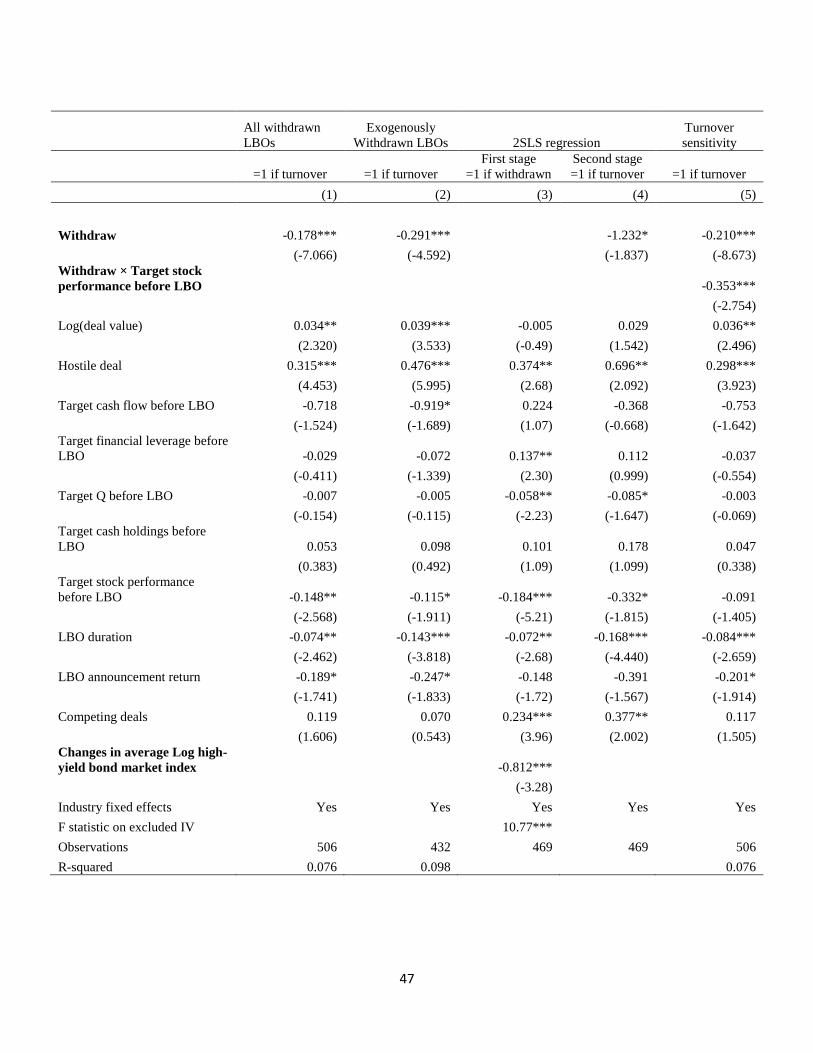
47
All withdrawn
LBOs
Exogenously
Withdrawn LBOs 2SLS regression
Turnover
sensitivity
=1 if turnover =1 if turnover
First stage
=1 if withdrawn
Second stage
=1 if turnover =1 if turnover
(1) (2) (3) (4) (5)
Withdraw -0.178*** -0.291*** -1.232* -0.210***
(-7.066) (-4.592) (-1.837) (-8.673)
Withdraw × Target stock
performance before LBO -0.353***
(-2.754)
Log(deal value) 0.034** 0.039*** -0.005 0.029 0.036**
(2.320) (3.533) (-0.49) (1.542) (2.496)
Hostile deal 0.315*** 0.476*** 0.374** 0.696** 0.298***
(4.453) (5.995) (2.68) (2.092) (3.923)
Target cash flow before LBO -0.718 -0.919* 0.224 -0.368 -0.753
(-1.524) (-1.689) (1.07) (-0.668) (-1.642)
Target financial leverage before
LBO -0.029 -0.072 0.137** 0.112 -0.037
(-0.411) (-1.339) (2.30) (0.999) (-0.554)
Target Q before LBO -0.007 -0.005 -0.058** -0.085* -0.003
(-0.154) (-0.115) (-2.23) (-1.647) (-0.069)
Target cash holdings before
LBO 0.053 0.098 0.101 0.178 0.047
(0.383) (0.492) (1.09) (1.099) (0.338)
Target stock performance
before LBO -0.148** -0.115* -0.184*** -0.332* -0.091
(-2.568) (-1.911) (-5.21) (-1.815) (-1.405)
LBO duration -0.074** -0.143*** -0.072** -0.168*** -0.084***
(-2.462) (-3.818) (-2.68) (-4.440) (-2.659)
LBO announcement return -0.189* -0.247* -0.148 -0.391 -0.201*
(-1.741) (-1.833) (-1.72) (-1.567) (-1.914)
Competing deals 0.119 0.070 0.234*** 0.377** 0.117
(1.606) (0.543) (3.96) (2.002) (1.505)
Changes in average Log high-
yield bond market index -0.812***
(-3.28)
Industry fixed effects Yes Yes Yes Yes Yes
F statistic on excluded IV 10.77***
Observations 506 432 469 469 506
R-squared 0.076 0.098 0.076