horizontal but not vertical: accountability institutions...
TRANSCRIPT

Horizontal But Not Vertical: AccountabilityInstitutions and Electoral Sanctioning in Northeast
Brazil
Taylor C. Boas1, F. Daniel Hidalgo2, and Marcus A. Melo3
1Boston University2 Massachusetts Institute of Technology
3Federal University of Pernambuco
January 2, 2018
1

Institutions of horizontal accountability often aim to sanction malfeasant or corrupt of-ficeholders before they have an opportunity to seek reelection. In Italy, Silvio Berlusconi wasexpelled from the Senate and barred from public office under an anticorruption law after beingconvicted of tax fraud in 2013. In Peru’s 2016 election, electoral authorities disqualified CésarAcuña as a candidate in the presidential race for vote-buying activities when he was mayor ofTrujillo. Though decisions to bar candidates are sometimes controversial and seen as politicallymotivated—as in the case of Caracas mayor Leopoldo López, a leading opponent of Venezuelanpresident Hugo Chávez—they can often further the cause of good governance by preventingdishonest politicians from perpetuating their hold on power.
Yet horizontal accountability institutions do not always succeed in their efforts to blockmalfeasant officeholders from seeking reelection. In Brazil, the 2010 Clean Slate Law allowedcandidates to be disqualified if a government auditing agency had charged them with corruptionor financial irregularities during prior terms in office. However, a 2016 Supreme Court ruling heldthat, in the case of candidates for executive office, disqualification required that the charge beconfirmed by the corresponding legislature—which, at the state and municipal levels, typicallydoes the bidding of the governor or mayor.
When horizontal accountability is stymied by legal obstructions or candidates’ politicalconnections, citizens have the potential to step in and exercise vertical accountability, votingagainst incumbents who have been charged with corruption or malfeasance but managed toremain on the ballot. Electoral sanctioning requires, first and foremost, that voters be madeaware of incumbents’ transgressions while in office. Towards this end, auditing agencies oftenseek to disseminate their decisions as part of a broad public education mission. Yet it alsorequires that voters condemn malfeasance by elected officials, and that they be willing to actupon this norm when they go to the polls.
Our Metaketa project aimed to test whether horizontal accountability institutions couldinduce vertical accountability by informing citizens of significant wrongdoing, or lack thereof,by incumbent politicians running for reelection. Partnering with the State Accounts Court ofPernambuco, a government auditing agency in Brazil, our intervention told voters whether theCourt’s annual audit of municipal accounts had found substantial evidence of malfeasanceattributable to the mayor. We examine the effect of this treatment on self-reported vote for themayor, measured via a secret ballot question in a post-electoral wave of the panel study.
Our study found that informing voters of the approval or rejection of their mayor’s accountshas no significant effect on the decision to vote for his or her reelection. This null effect alsoapplies to evaluations of the mayor’s performance and to levels of certainty regarding thisevaluation. We argue that the divergence between norms and action explains these null effects.While Brazilians strongly condemn corruption in the abstract, their behavior in the real worldis constrained by factors such as loyalty to local political dynasties and the greater salience ofmore pressing concerns like employment and health services.
1 The Politics of Horizontal Accountability in Pernambuco
A key feature of our study is that we collaborated with one of Brazil’s State Accounts Courts(Tribunais de Contas dos Estados, or TCEs), the main institutions of horizontal accountabilitycharged with monitoring state and municipal governments’ compliance with the law.1 BrazilianTCEs are key actors in state politics and policy making because their decisions provide the
1. Most TCEs are charged with auditing both municipal governments and the state governments. In a few states,there is a separate Municipal Accounts Court that handles only the municipal audits.
2

primary legal and political basis for sanctioning local and state governments. Relying on alarge and highly trained staff, the courts engage in routine annual audits of all governmentbodies, as well as conducting ad hoc audits of specific programs and governments. The processculminates in a overall recommendation that audited accounts be "approved," "approved withreservations," or "rejected." In the case of executive branch audits, the recommendation is thensent to the corresponding legislature for a final decision. At the municipal level, the court’srecommendation regarding a mayor’s accounts can only be overturned by a two-thirds vote ofthe city council.
Municipalities and the mayors that lead them are central political actors in Brazil. Akin to aU.S. county, municipalities are largely responsible for the provision of basic social services such asprimary education and health care, in addition to local services like garbage collection, housing,and water provision. Comparative analyses of inter-governmental relations classify Brazil asamong the most decentralized polities in the world, with very high levels of fiscal and politicaldecentralization, although taxation capacity at the municipal level remains generally low (Falleti2010, p. 150). Directly elected mayors are the most important local political actors because theycontrol the local municipal apparatus and also function as important intermediaries betweencitizens and the state and federal governments. Political competition is largely non-ideological,and parties tend to be weak (Novaes 2017), especially in smaller municipalities. While manyvoters may have persistent loyalties to political families or other groups within the municipality(discussed further below), swing voters tend to vote on more personalistic or clientelistic grounds.
We chose the state of Pernambuco as the location for our study largely because of the pro-fessionalism and efficiency of its TCE. As discussed below, Brazilian auditing agencies vary inthe degree to which they are considered independent, professional organizations free fromovert political meddling; the reputation of Pernambuco’s court, the TCE-PE, is among the best(Melo, Pereira, and Figueiredo 2009). In addition to the likely effect of boosting citizen confi-dence in the court’s judgments and their potential influence on voting behavior, the TCE-PE’sprofessionalism meant that it was more open to a partnership with academics than a morepoliticized agency would have been. Brazilian TCEs also vary widely in their efficiency. Someroutinely take five or more years to review municipal accounts, meaning that information ona mayor’s first four-year term is not available until after he or she has stood for reelection. InPernambuco, the TCE typically completes its review in three years or less, meaning that forthe vast majority of mayors, a judgment of their first year’s accounts is issued prior to the nextelection and is available to communicate to voters. By the time our intervention began, theTCE-PE had reviewed the accounts from 2013, the first year of the current mayoral term, in 95%of the state’s municipalities.
Rejection of a municipality’s accounts occurs when the TCE finds that the municipal govern-ment failed to comply with regulations and laws that govern local government expenditures,such as procurement legislation, constitutionally mandated spending, and hiring procedures.The court issues a report (parecer prévio) that describes any violations, recommendations forremediation, and recommended punishments. Not every violation is sufficient basis for therejection of accounts, as the court has the option of recommending "Approval with Reservations"when improprieties are less serious. In the municipalities included in our study, the rejectionof a mayor’s accounts occurred for a variety of reasons. In the municipality of Flores, the courtcited excessive personnel expenditures, municipal debt that far surpassed legal limits, and thefailure to properly report details about government spending. In Santa Filomena, the courthighlighted failure to spend required amounts on education and to transfer employees’ pensioncontributions to the state pension fund, among other violations. In Bom Conselho, the courtcharged that the mayor had incurred substantial debt without approval from the local legislature,
3

among other infractions. Reports for other municipalities with rejected accounts describedsimilar violations.
Figure 1 – Number of Federal Transfer Irregularities by Accounts Status. These irregularities arereported by the federal government auditing agency CGU. Total number of irregularities has beennormalized by number of bureaucrats employed in 2008.
Reassuringly, the decisions of the TCE-PE are correlated with other, independent measuresof government irregularities. The most well-known auditing agency in Brazil, the ComptrollerGeneral of the Union (Controladoria-Geral da União or CGU) performs regular audits of federaltransfers to municipalities—an area outside the purview of the TCE—and publicizes the namesof public servants responsible for irregularities. Using these data, we computed the number ofpublic servants named in CGU audits in all municipalities in the state, normalized by the totalnumber of municipal bureaucrats employed in 2008.2 To assess the extent to which the TCE-PE’soverall judgment correlates with the CGU’s audit findings, Figure 1 plots the distribution of CGUirregularities by the TCE-PE’s approval or rejection of the mayor’s 2013 accounts. On average,municipalities whose accounts had been rejected by TCE-PE had many more public servantsfound to have misspent federal funds. This finding suggests that the TCE-PE’s judgments doreflect broader differences in governance among Brazilian municipalities.
Decisions taken by Brazilian TCEs have potentially severe consequences for politicians, yetin practice these institutions are often quite hampered in their ability to exercise horizontalaccountability. A 1990 law allowed politicians to be barred from running for office for 8 years iftheir accounts had been rejected, the legislature had upheld the decision (in the case of executiveofficeholders), and all possibilities for appeal had been exhausted. However, the long, draw-outappeals process meant that incumbents with rejected accounts were typically able to run again—and even finish a second term—before a final decision on their case could be rendered (Speck
2. Specifically, we used the list of public servants whose accounts were judged "irregular" by the CGU between 2008and 2016. The number of municipal bureaucrats was obtained from IBGE’s “Perfil dos Municípios Brasileiros”.
4

2011, p.145). In 2010, the new Clean Slate (Ficha Limpa) Law sought to close the judicial appealsloophole, allowing candidates to be barred based solely on the rejection of their accounts bythe TCE. However, a Supreme Court decision in August 2016 significantly weakened the lawby ruling that, in the case of executive branch accounts rejection, candidates could only bedisqualified if the rejection had been upheld by the corresponding legislature. City councilsoften incur substantial delays in voting on the TCE-PE’s recommendation, during which timethe mayor may have run for reelection. Moreover, since city councils are usually dominated bythe mayor’s allies, they routinely overturn recommendations that accounts be rejected. From1994 to 2013, 50% of rejection recommendations were overturned by the city council, versusonly 5% of approval recommendations.
In addition to their efforts to exercise horizontal accountability, TCEs seek to induce verticalaccountability by publicizing their auditing decisions and educating the public about theirgeneral mission. In Pernambuco, the TCE-PE employs a dedicated public outreach staff andpublishes a column in the major newspaper that reports on its activities, including decisions onaccounts. More generally, it seeks to directly inform the public about various aspects of municipalgovernance in Pernambuco. For example, its website "Tome Conta" (roughly translated as"Supervise" or "Take Notice") conveys indicators of government performance in a variety of areas,including health and education. The TCE-PE also has an outreach program, "TCEndo Cidadania"(a play on "weaving citizenship"), that involves holding public forums in municipalities aroundthe state in order to educate citizens about local governance and help them hold elected officialsaccountable.
Although Brazil’s TCEs project themselves as impartial arbiters and investigators, they arepolitical institutions by design. TCEs are led by a panel of seven "councilors" (conselheiros),three of whom are appointed by the governor and four by the state legislature. The governor isfairly constrained in two of his three choices—one must be an Accounts Court career auditor,the other must be a career public prosecutor, and both have to be chosen from a list of threecandidates compiled by either the Accounts Tribunal or the Public Prosecutor’s Office. However,the governor’s third choice, and all four of the legislature’s choices, are essentially unrestricted,meaning that political criteria often factor into their decisions. Councilors selected by thelegislature are typically former state deputies belonging to the dominant coalition and havea clearly political, rather than technical, profile. All councilors have protected tenure until amandatory age of retirement.
The TCEs’ institutional structure means that audit decisions are at least partly responsiveto political factors, especially in the annual review of accounts, their most visible and legallyconsequential function. Many courts are dominated by councilors with partisan or family tiesto politicians. In Pernambuco, the court had five members with political ties: three were formerstate deputies, one was the former cabinet chief of the governor, and another was a cousin ofthe governor who appointed him (Paiva and Sakai 2014). An emerging literature on horizontalaccountability in Brazil has documented the implications of these political ties. TCEs tend topunish governments more readily when the councilors are politically diverse (Melo, Pereira,and Figueiredo 2009), whereas councilors tend to treat co-partisan politicians more leniently(Hidalgo, Canello, and Lima-de-Oliveira 2016). The degree to which political factors influencedecision-making varies substantially, and Pernambuco’s court is considered one of the mostprofessional and least politicized (Melo, Pereira, and Figueiredo 2009). However, decisions byits councilors with political careers do show some evidence of favoritism toward co-partisanmayors (Hidalgo, Canello, and Lima-de-Oliveira 2016).
In addition to sometimes treating co-partisans more leniently, there is clear evidence that thebar for rejection of everyone’s accounts is raised or lowered depending on the political sensitivity
5
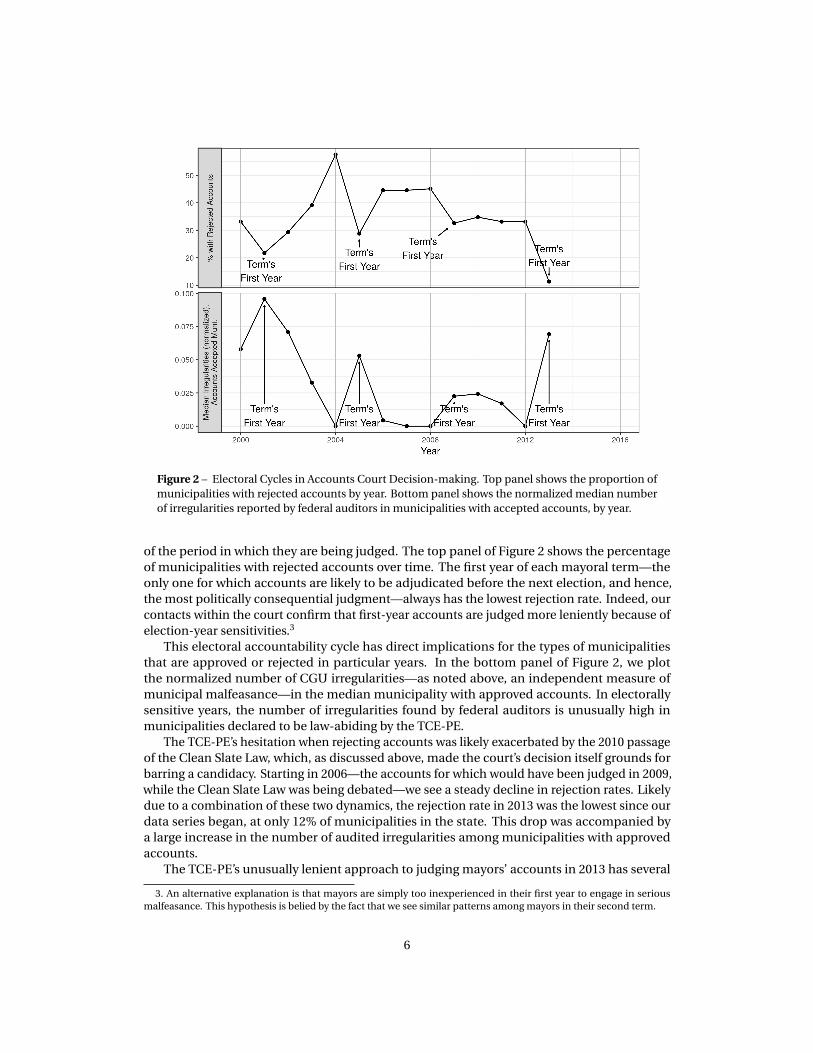
Figure 2 – Electoral Cycles in Accounts Court Decision-making. Top panel shows the proportion ofmunicipalities with rejected accounts by year. Bottom panel shows the normalized median numberof irregularities reported by federal auditors in municipalities with accepted accounts, by year.
of the period in which they are being judged. The top panel of Figure 2 shows the percentageof municipalities with rejected accounts over time. The first year of each mayoral term—theonly one for which accounts are likely to be adjudicated before the next election, and hence,the most politically consequential judgment—always has the lowest rejection rate. Indeed, ourcontacts within the court confirm that first-year accounts are judged more leniently because ofelection-year sensitivities.3
This electoral accountability cycle has direct implications for the types of municipalitiesthat are approved or rejected in particular years. In the bottom panel of Figure 2, we plotthe normalized number of CGU irregularities—as noted above, an independent measure ofmunicipal malfeasance—in the median municipality with approved accounts. In electorallysensitive years, the number of irregularities found by federal auditors is unusually high inmunicipalities declared to be law-abiding by the TCE-PE.
The TCE-PE’s hesitation when rejecting accounts was likely exacerbated by the 2010 passageof the Clean Slate Law, which, as discussed above, made the court’s decision itself grounds forbarring a candidacy. Starting in 2006—the accounts for which would have been judged in 2009,while the Clean Slate Law was being debated—we see a steady decline in rejection rates. Likelydue to a combination of these two dynamics, the rejection rate in 2013 was the lowest since ourdata series began, at only 12% of municipalities in the state. This drop was accompanied bya large increase in the number of audited irregularities among municipalities with approvedaccounts.
The TCE-PE’s unusually lenient approach to judging mayors’ accounts in 2013 has several
3. An alternative explanation is that mayors are simply too inexperienced in their first year to engage in seriousmalfeasance. This hypothesis is belied by the fact that we see similar patterns among mayors in their second term.
6
INFORMAÇÕES PARA O MUNICÍPIO DEABREU E LIMA
Em 2013, as contas do prefeito de ABREU E LIMA foram APROVADAS, como aconteceu em 88% dos municípios de Pernambuco.
GESTÃOFINANCEIRA
12%MUNICÍPIOS
COM CONTASREJEITADAS
Estas informações estão sendo fornecidas no contexto de uma pesquisa acadêmica conduzida por professores da Universidade Federal de Pernambuco, o Instituto Tecnológico de Massachusetts e a Universidade de Boston, em parceria com a Escola de Contas Públicas Barreto Guimarães do TCE-PE.
PARA MAIS DETALHES, VISITE WWW.METAKETA.ORG/TCE
88%MUNICÍPIOS COM CONTAS APROVADAS,INCLUSIVE ABREU E LIMA
(a) Example Accounts Accepted Flier
INFORMAÇÕES PARA O MUNICÍPIO DEBOM CONSELHO
Em 2013, as contas do prefeito de BOM CONSELHO foram REJEITADAS, algo que aconteceu só em 12% dos municípios de Pernambuco.
GESTÃOFINANCEIRA
12%MUNICÍPIOS
COM CONTASREJEITADAS,
INCLUSIVEBOM CONSELHO
Estas informações estão sendo fornecidas no contexto de uma pesquisa acadêmica conduzida por professores da Universidade Federal de Pernambuco, o Instituto Tecnológico de Massachusetts e a Universidade de Boston, em parceria com a Escola de Contas Públicas Barreto Guimarães do TCE-PE.
PARA MAIS DETALHES, VISITE WWW.METAKETA.ORG/TCE
88%MUNICÍPIOS COM CONTAS APROVADAS.
(b) Example Accounts Rejected Flier
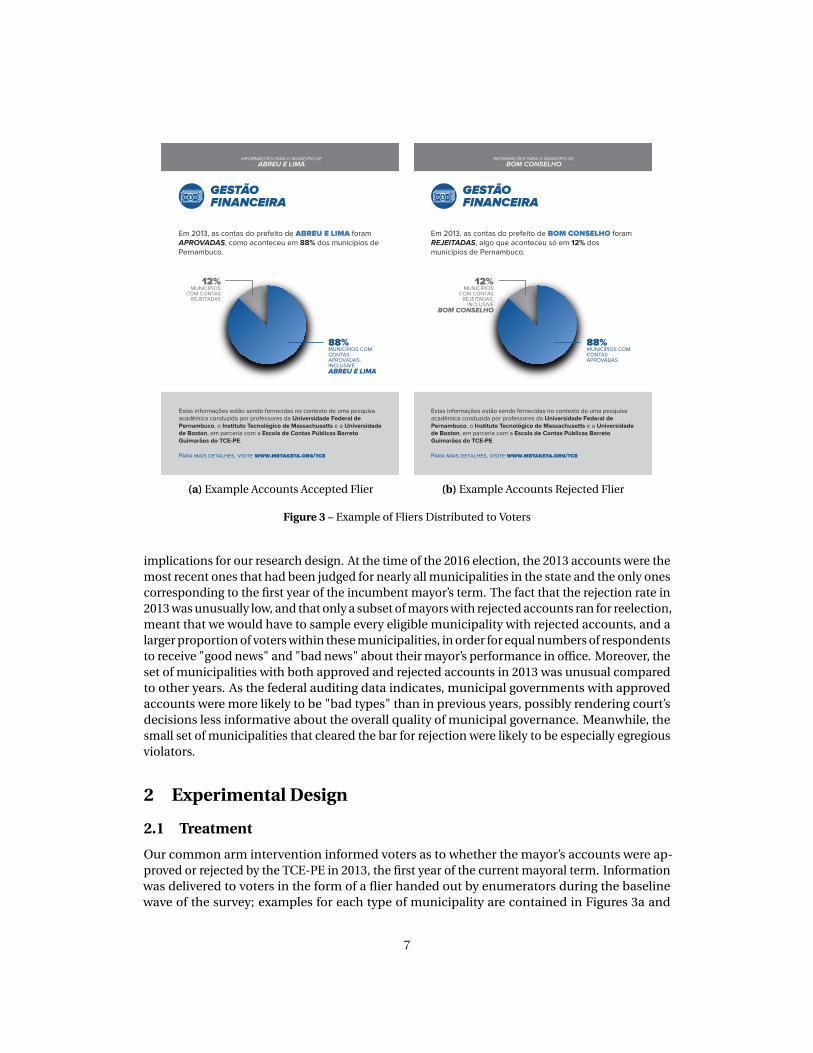
Figure 3 – Example of Fliers Distributed to Voters
implications for our research design. At the time of the 2016 election, the 2013 accounts were themost recent ones that had been judged for nearly all municipalities in the state and the only onescorresponding to the first year of the incumbent mayor’s term. The fact that the rejection rate in2013 was unusually low, and that only a subset of mayors with rejected accounts ran for reelection,meant that we would have to sample every eligible municipality with rejected accounts, and alarger proportion of voters within these municipalities, in order for equal numbers of respondentsto receive "good news" and "bad news" about their mayor’s performance in office. Moreover, theset of municipalities with both approved and rejected accounts in 2013 was unusual comparedto other years. As the federal auditing data indicates, municipal governments with approvedaccounts were more likely to be "bad types" than in previous years, possibly rendering court’sdecisions less informative about the overall quality of municipal governance. Meanwhile, thesmall set of municipalities that cleared the bar for rejection were likely to be especially egregiousviolators.
2 Experimental Design
2.1 Treatment
Our common arm intervention informed voters as to whether the mayor’s accounts were ap-proved or rejected by the TCE-PE in 2013, the first year of the current mayoral term. Informationwas delivered to voters in the form of a flier handed out by enumerators during the baselinewave of the survey; examples for each type of municipality are contained in Figures 3a and
7

3b. Enumerators also summarized the information orally to maximize information retentionand facilitate comprehension among illiterate voters. The flier design was refined based onfeedback from two rounds of focus groups conducted with voters from three municipalities aswell as review by our government partner, the TCE-PE. The front of the flier bore the logos ofthe TCE-PE and its affiliated academic institution, the Public Accounts School, and it brieflyexplained the court’s auditing responsibilities. The reverse side conveyed municipality-specificdetails, including a pie chart with comparative metrics.4
75Municipalitieswithre-runningincumbents(outof184)
7MunicipalitieswithAccountsRejected
68MunicipalitieswithAccountsApproved
40SampledMunicipalitieswithAccountsApproved
5–26SampledCensusTracts 5SampledCensusTracts
8SampledHouseholds16SampledHouseholds
AccountsTreatment
EducationTreatment
ControlGroup
AccountsTreatment
EducationTreatment
ControlGroup
Figure 4 – Overall Stucture of the Sampling and Treatment Assignment Process
The implementation of the field experiment involved sampling municipalities, census tracts,and individuals, who were then individually randomized to three different treatment conditions.The overall structure of our research design is summarized in Figure 4. Below we describe indetail each stage of the process and their implications for interpretation of our findings. Thetiming of the pilot, baseline, and endline is shown in Figure 5.
2.2 Subjects and Contexts
2.2.1 Sampling Municipalities
The primary criterion for sampling municipalities was achieving a balanced sample, such thatan equal number of respondents would receive positive and negative information about the
4. We initially designed the fliers to mimic vivid advertising common in campaigns, but our focus groups indicatedthat recipients would likely believe that the fliers were distributed by politicians and not by the TCE. As a result, weadopted a more neutral and staid design.
8
Jul Aug Sep Oct Nov Dec
Pilot b
egins
(7/1
)
Pilot e
nds (
7/21
)
Campa
ign b
egins
(8/1
6)
Baseli
ne b
egins
(9/7
)
Baseli
ne e
nds (
9/17
)
Electio
n (1
0/2)
Endlin
e be
gins (
10/1
9)
Endlin
e en
ds (1
1/2)
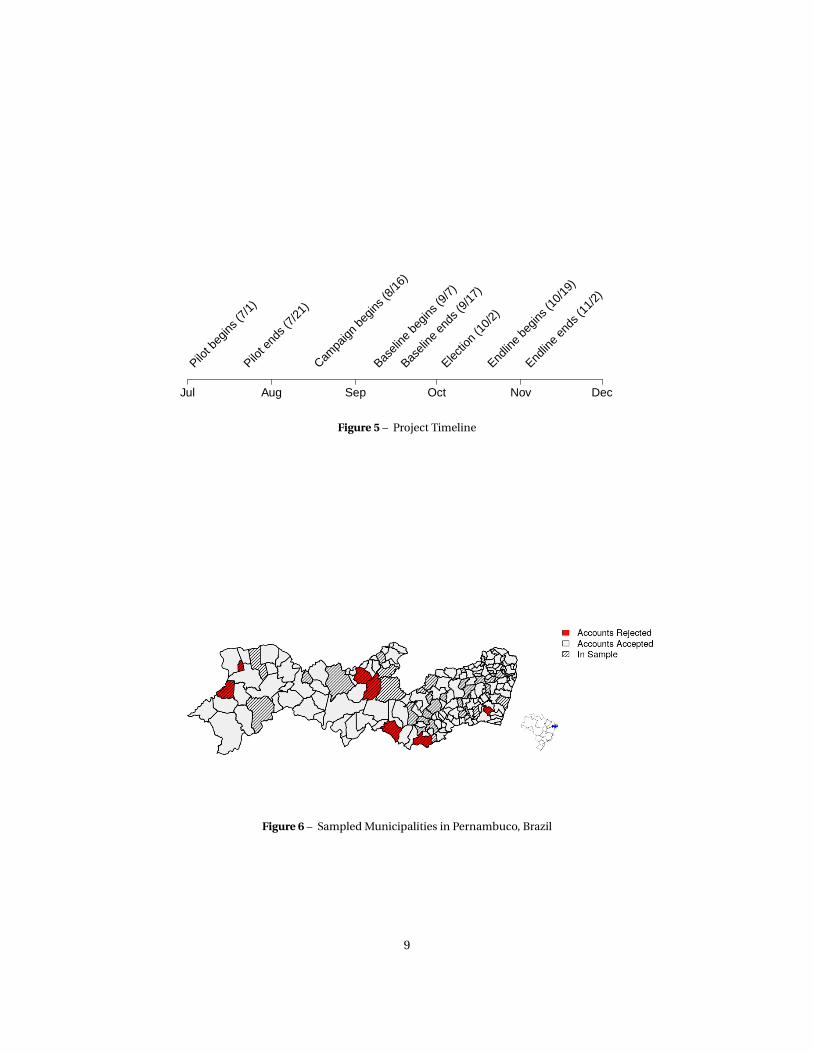
Figure 5 – Project Timeline
Figure 6 – Sampled Municipalities in Pernambuco, Brazil
9

incumbent government. Because there were only seven municipalities where incumbents withrejected accounts ran for reelection, we included all of them in the study. To construct the sam-pling frame of municipalities with approved accounts, we eliminated the smallest municipalities(where it might be difficult to sample the requisite number of voters) as well as the state capital,Recife. We then grouped the remaining 75 municipalities into two strata based on informationto be conveyed in our alternative arm—performance on the National Literacy Exam (AvaliaçãoNacional da Alfabetização, ANA), a standardized test given in elementary schools—and sampledan equal number of municipalities from each stratum with inclusion probabilities proportionalto the 2010 population. Our sample of municipalities is depicted in Figure 6, which shows thegeographic distribution of sampled communities as well as accounts status. As shown by themap, the accounts rejected municipalities are geographically distributed across the state, thoughsix out of the seven municipalities are located in the poor, semi-arid region known as the sertão,whose politics is often characterized as relatively traditional and clientelistic.
Table 1 – Socio-Demographics and Political Characteristics of Sampled Municipalities. Source: 2010Census and Superior Electoral Court.
Variable Brazil Pernambuco Sampled AccountsAccepted
Sampled AccountsRejected
Socio-Demographic Variables% in Extreme Poverty 6.6 12.3 15.1 22.9% with Running Water 92.7 83.7 76.6 65.2% Students Held Back 38.2 43.6 45.2 52.0% Working in Agriculture 13.6 18.9 29.3 44.7Average Income (BRL) 794 525 347 279Human Development Index 0.73 0.67 0.62 0.57Electoral Variables2012 Winner Vote % 54.4 55.6 53.0 52.22012 Turnout (% of registered) 83.5 83.7 83.3 78.2Baseline Survey VariablesMuni. Government Evaluation (5 point scale) - - 3.0 3.1Confidence in Muni. Government (7 point scale) - - 4.2 4.1Confidence in Accounts Tribunal (7 point scale) - - 4.3 4.5Vote Buying Offer is Somewhat or Very Probable (%) - - 33.0 30.1Vote Monitoring is Somewhat or Very Probable (%) - - 29.3 31.0
On basic socio-demographic variables, our sample is poorer and more rural than Brazil orPernambuco as a whole. As indicated in Table 1, municipalities with both approved and rejectedaccounts have higher levels of extreme poverty, lower rates of access to running water, loweraverage monthly incomes, and worse educational performance. The poorer socioeconomicprofile of our sample is not surprising, given the Northeast’s persistent under-development andour exclusion of Recife, the wealthiest city in the state. Within our sample, however, the accountsrejected municipalities are substantially poorer and more rural than their accounts approvedcounterparts. For example, the average monthly income in accounts rejected municipalitiesis less than half of the Brazilian average and 20% smaller than the accounts approved average.Similarly, the agriculture sector’s share of the workforce is about 13 percentage points higher inthe accounts rejected municipalities.
With respect to electoral participation and competition, our sample is quite representativeof Pernambuco and Brazil as a whole. Turnout and average vote share for the incumbent in thelast election (2012) are broadly comparable to national and state averages. Elections are quitecompetitive, with incumbents only garnering around 52–53% of valid votes. Due to compulsoryvoting, turnout is high, with average rates of 78–83%. On these basic political indicators, accounts
10

approved and accounts rejected municipalities are broadly comparable.Attitudes towards the government and perceptions of the electoral process were also quite
similar across the two types of municipalities. In the bottom rows of Table 1, we present datafrom our baseline survey on evaluations of the municipal government and the TCE, as wellas perceptions about the prevalence of vote buying and the secrecy of the ballot. Across allfive variables, we see quite similar responses in both accounts rejected and accounts approvedmunicipalities.
2.2.2 Sampling Respondents
Within each municipality, we used a two-stage sampling procedure that involved choosingcensus tracts and then respondents. Census tracts were sampled with probability proportionalto the number of households in the 2010 census, excluding the least populous and most ruraltracts where, based on pretesting, we anticipated logistical problems during fieldwork. Inaccounts approved municipalities we sampled five census tracts, while in accounts rejectedmunicipalities we sampled between 5 and 26 census tracts, varying with municipality size.Within each tract, enumerators sampled sixteen households in accounts rejected municipalitiesand eight households in accounts approved municipalities. To ensure that interviews weregeographically distributed throughout the tract—thus reducing the risk of spillover amongneighbors assigned to different treatment conditions—we calculated a tract-specific number ofhouses to skip after a successful interview by dividing the total number of households in thetract by twice the number of interviews to be conducted. To avoid large imbalances in basicdemographics, we used census data to construct sex-specific age quotas that interviewers wererequired to meet in each census tract.
2.3 Threats to Validity
2.3.1 Attrition
Table 2 – Comparison of Attrited and Re-interviewed Respondents.
Variable Attritted Re-interviewedAge 38.1 41.2Male (%) 58% 48%Income < R$880.00 (%) 44% 51%Evaluation of Incumbent (5 point scale) 3.0 3.12012 Vote for Incumbent (%) 55% 52%2012 Turnout (%) 84% 85%Accounts Treatment 36% 33%
Because we measure our outcome using a post-election survey, it was important to minimizeattrition, both to preserve statistical power and to reduce the possibility of post-treatment bias.Our survey enumerators returned multiple times to interviewed households and often trackedmissing respondents to their workplace or other locations to complete the endline interview.Recontact was more difficult, and attrition was noticeably higher, in more urban municipalitieswhere respondents tended to work further from home. Overall, we achieved a re-contact rate of81%.
11

Figure 2 shows how basic demographic and political variables vary by attrition status. Asexpected, men and higher income individuals were more difficult to reinterview as they weremore likely to be employed and away from home during second-round visits. With respectto political variables, the two groups are broadly comparable: 2012 voting behavior as well asevaluation of the incumbent were very similar. Finally, the attrition rate in the treatment groupwas 3 percentage points higher than in the control group. While this difference is not large, it isstatistically significant with a p-value of 0.03.5 While the significant difference in attrition is apotential threat to inference, the fact that attrition is weakly correlated with political variablessuggest that any bias would likely be small.
2.3.2 Measurement Error
A second important threat to the validity of our estimates is the fact that our main dependentvariables are self-reported. In Brazil, electoral precincts (seções) do not correspond to specific,mutually exclusive geographical units in which voters reside, so we did not have the option ofrandomizing and measuring outcomes at the precinct level, as some other projects did. Self-reported outcomes are, of course, subject to recall, demand, and pro-winner biases. Of thesethree potential sources of error, demand effects are most likely to induce a correlation betweenmeasurement error and the treatment, as voters who received fliers may seek to pander to surveyenumerators and falsify their vote choice. Recall effects, even if correlated with treatment, areunlikely to be correlated with the outcome of interest—vote for the incumbent mayor—so theyshould not affect our estimates. Likewise, the well-known propensity to over-report vote forthe winning candidate is also unlikely to induce differential measurement error because ourblock randomization design ensures that we compare voters within municipalities, who wouldall presumably experience the same pro-winner effect.6
To reduce all three forms of bias, we used a secret ballot vote choice question. Respondentswere given municipality-specific printed ballots (see Figure 7 for an example) and asked to pri-vately check off their vote choice, fold the ballot, and deposit it into a sealed "ballot box" carriedby the enumerator. To facilitate recall, our ballots included the same candidate photographsthat are displayed on the confirmation screen of the electronic voting machine. Respondentsalso had the option of marking a blank or null vote, as is possible with electronic voting.
To assess the extent to which we successfully minimized measurement error, it is informativeto benchmark our survey against actual election outcomes. This exercise has limitations, as oursampling frame omitted 16- and 17-year-olds (enfranchised in Brazil) as well as residents of themost rural census tracts. Furthermore, our target population excludes voters who do not residethe municipality where they are registered to vote, a common occurrence in areas, such as ruralPernambuco, that have experienced substantial out-migration. Non-resident registered voterstend to inflate official abstention rates, which would not be captured in our survey. Despitethese caveats, benchmarking our sample can be informative, in that substantial deviations fromelectoral outcomes could be indicative of measurement error.
To construct a benchmark for comparison, we weighted each municipality’s electoral resultsin proportion to its share of respondents in the endline sample. Results are displayed in Figure 8.The largest discrepancy is with respect to turnout, which could be driven by social desirability
5. This p-value was estimated using permutation inference, testing the null of no effect on any individual’s propensityto attrit. We employed the t-statistic from the specification listed in Section 3 as the test-statistic and performed 10,000simulated randomizations.
6. If treatment causes a pro-winner (as opposed to pro-incumbent bias), this source of measurement error could leadto erroneous inferences. It is difficult to conceive of a scenario in which this would be the case.
12

Figure 7 – Simulated Ballot Used to Measure Vote Choice
13

●
●
●
All Voters
0 0.25 0.5 0.75
Abstention
Winner
Incumbent ●
●
●
●
●
Voters Who Turned Out
0 0.25 0.5 0.75
●
●
●
●
Election ResultsFull SampleControl Group
Figure 8 – Vote for Mayor: Sample vs. Official Election Results
bias but probably also reflects our inability to sample non-residents. As is common in post-election surveys, we also find that voters somewhat over-report vote for the winning candidate.When we exclude abstainers, however, our estimate of the incumbent vote share is statisticallyindistinguishable from the official electoral results. Furthermore, the difference between theofficial vote returns and self-reported vote for the winning candidate diminishes—but does notdisappear—after conditioning on turnout.
2.3.3 Candidate Self-Selection
A final potential concern is that, among mayors with rejected accounts, politically weak incum-bents may have expected to lose and chosen not to run again. The remaining incumbents withrejected accounts might have a strong record of achievement or attractive personal qualities,making it less likely that supporters would change their vote when presented with negativeinformation. If so, our sample would exclude those places where effects might be larger, creatinga bias in favor of a null finding.
Evidence from our pilot argues against this interpretation. About a month prior to the candi-date registration deadline, we conducted a large-scale (n = 2000) pilot study in all municipalitieswhere the incumbent was eligible to run for reelection, providing the same treatment informa-tion and inquiring about intended vote if the incumbent were to rerun. We obtained similarresults to those from the field experiment, suggesting that the findings reported below are notan artifact of self-selection into the sample of candidates.
2.4 Implementation Challenges
In the vast majority of municipalities, our project encountered no implementation difficulties,but in four municipalities where the mayor’s accounts had been rejected, our survey promptedreactions from local politicians or their allies. While the negative valence of our treatment
14

information may partially account for these reactions, it is also important to remember that wesampled a much larger fraction of the electorate in these municipalities, making the interven-tion more noticeable to local political actors. According to enumerators, reactions from localpoliticians were most often triggered not by the content of the fliers but rather by questions inthe baseline survey about the likelihood of vote buying—an activity that is illegal in Brazil andseverely punished by electoral authorities.
Political reactions to our survey fell into two categories: inquiries or complaints throughofficial channels, and harassment of enumerators in the field. In two municipalities, publicservants sent an email to our official project account or complained to the Brazilian IRB andState Accounts Court. The complaint to the Accounts Court generated some concern, and theyasked us to cease the intervention in the corresponding municipality, but fieldwork had alreadybeen completed so our results were unaffected. In three municipalities, enumerators wereharassed by allies of local politicians, and in some cases, they were followed and observed duringfieldwork. As a result, they were unable to finish a handful of interviews (7 during the first roundand 48 during the second) in two municipalities. In both cases, incidents were confined to oneor two census tracts in peripheral communities where there was little or no police presence.Fieldwork was unaffected in more centrally-located parts of these municipalities, from whichthe majority of respondents had been sampled.
2.5 Ethical Considerations
In concert with the overall objectives of the Metaketa initiative, we sought to ensure that our studyadhered to ethical principles. First, one of the Principal Investigators is Brazilian and a residentof the state of Pernambuco, so our study is not an instance of a strictly foreign team of academicsintervening in an election abroad. Second, we obtained approval from the Institutional ReviewBoards of each of our universities.7 This includes the Comité de Etica em Pesquisa (Ethics inResearch Committee) of the Federal University of Pernambuco, which, like all Brazilian IRBs,generally reviews only medical studies.8 Thus, we went much further in obtaining approval thanis typically done for studies of Brazil, especially those done by Brazilian social scientists.
Third, we partnered with the Brazilian government agency that produces the auditing deci-sions that we conveyed to voters in the common arm. The TCE-PE gave us formal permission touse its name and logo in the study, and it reviewed, requested modifications to, and ultimatelyapproved the final version of the fliers. While we cannot claim that the intervention wouldhave happened anyway without our participation, the design of the study is entirely consistentwith the public education mission of the TCE-PE. We presented our research proposal to theTCE-PE as evaluating a method of direct outreach to individual citizens that they might consideradopting in the future.
Fourth, prior to the experiment we had very little basis for believing that our interventioncould change the outcome of the election. In no municipality did our treatments reach morethan 1 percent of the electorate. To estimate the number of votes moved in each municipalityprior to launching the study, we relied on a full-scale (N = 2000) pilot conducted in July 2016,administering the same treatments in many of the same municipalities. Based on the averagetreatment effects on intended vote for mayor in our pilot study, we estimated that our inter-ventions could shift the votes of 8 percent of the number of treated voters in each municipality.
7. Boston University, protocol 4094X; MIT, protocol 1604551604; Universidade Federal de Pernambuco, número deparecer 1571592.
8. IRB review in Brazil is similar to the situation in the United States, in that university-based committees reviewresearch protocols according to a set of regulations that are defined at the federal level and apply nationwide.
15
In most places, this amounts to a mere 2 votes; in the most heavily sampled municipality, itconstitutes 22 votes. As shown in our pre-analysis plan, our treatment effect would have hadto be 3.25 times larger than estimated in the pilot study to have had a chance of changing theoutcome of the closest prior election in these 47 municipalities over the past 16 years. In fact,our treatment effect was much smaller than estimated in the pilot, so it is even more unlikelythat our intervention made the difference between any candidate winning and losing.
3 Results
To examine the overall impact of our treatment, we estimate the average treatment effect usingthe following estimating equation:
Yi m =β0+β1Ti m +k∑
j=1
�
µ j X ji m +γ j X j
i m ·Ti m
�
+εi m (1)
Yi m is the outcome variable for individual i in municipality m , Tim is the treatment indicator,X j
i m is the j th pre-treatment covariate (demeaned using the sample average) and εi m is the dis-
turbance term. In the results presented here, X ji m only include census tract dummies, which are
our blocking variable; in the appendix, we present all relevant specifications pre-specified in the“Meta-PAP,” including those with covariate adjustment. Because we demean the covariates andinclude their interaction with treatment, β1 is a consistent estimator for the average treatmenteffect (Lin 2013). For the standard error of our estimates, we employ the "HC2" heteroskedasticconsistent estimator. In addition to conventional inference, we also test the sharp null of notreatment effect using permutation inference in each of our specifications. Our test-statistic isthe t-statistic of our experimental estimate. Our pre-specified hypotheses are directional, soreported p-values are one-sided.
While the effect on vote choice is of primary interest, we first show the effect of our in-tervention on intermediate knowledge and attitudinal variables that should be affected if theinformation were to change behavior. Specifically, we examine whether or not respondentslearn as a result of the treatment, change their evaluation of the mayor in the specific domain ofmanagement of accounts, decrease self-reported uncertainty over their evaluations, and changetheir overall evaluation of the mayor’s record.
First, we show that our intervention increased citizens’ knowledge about whether theirmayor’s accounts had indeed been rejected or approved in 2013. In Figure 9, we present theestimated effect of treatment on respondents’ knowledge of the TCE’s decision on their mayor’saccounts, both for the full sample and for as those who had been incorrect about the mayor’saccounts at baseline. About 65% and 60% of respondents provided the correct answer in thetreatment and control groups, respectively; the difference is statistically significant. Whilestatistically detectable, the intervention did not dramatically increase the number of respondentsgiving correct answers. This suggests that many respondents either forgot the information ordid not believe it. Among the group of respondents who answered incorrectly at baseline, about37% of control group respondents provided the correct answer at endline, possibly indicatingthat some learning occurred over the course of the campaign.
Upon learning the information, did respondents change their assessment of the incumbent’shanding of the municipality’s accounts? As evident in Figure 10, we find some evidence thatrespondents changed their views of the incumbent’s performance on this dimension in theexpected directions, as measured on a 5 point scale. In both groups, however, the effect is
16

Effect on Responding Correctly about Accounts Status
0.00 0.02 0.04 0.06 0.08 0.10
Against Prior
All Respondents
●
●
permutation p−value: 0.04
Control Mean: 0.37
permutation p−value: 0.02
Control Mean: 0.6
Figure 9 – Effect of Treatment on Learning. Dependent variable is a variable measuring if therespondent answered correctly about whether municipality accounts had been rejected by the TCE.The "Against Prior" sample consists of respondents who were incorrect about accounts status atbaseline. Lines are 95% confidence intervals. P-values in the right margin are from one tailed testscomputed using permutation inference.
Effect on Evaluation of the Mayor's Management of Accounts
−0.2 −0.1 0.0 0.1 0.2
Accounts Rejected
Accounts Approved
●
●
permutation p−value: 0.14
Control Mean: 2.78
permutation p−value: 0.08
Control Mean: 3.04
Figure 10 – Effect of Treatment on Evaluation of Mayor’s Management of Accounts. Dependentvariable is the respondent’s assessment of the mayor’s management of the municipality’s accountson a 5 point scale (higher values indicating a more positive evaluation). Lines are 95% confidenceintervals. P-values in the right margin are from one tailed tests computed using permutation inference.
17

imprecisely estimated. If we combine both groups and change the polarity of dependent variableto match the valence of the information (not shown), then the effect estimate is statisticallysignificant with a point estimate of about .07. This latter specification is not pre-specified,however.
Effect on Uncertainty over Evaluation of Management of Accounts
−0.10 −0.05 0.00 0.05 0.10
All
Accounts Rejected
Accounts Approved
●
●
●
permutation p−value: 0.18Control Mean: 2.11
permutation p−value: 0.18Control Mean: 2.1
permutation p−value: 0.09Control Mean: 2.11
Figure 11 – Effect of Treatment on Uncertainty Over Evaluation of Mayor’s Management of Accounts.Dependent variable is the respondent’s uncertainty over the their own assessment of the mayor’smanagement of the municipality’s accounts on a 5 point scale (higher values indicating more un-certainty). Lines are 95% confidence intervals. P-values in the right margin are from one tailed testscomputed using permutation inference.
We find inconsistent evidence that respondents’ uncertainty over their assessment of themayor’s management of the municipal accounts diminishes as a result of treatment. Amongrespondents in accounts approved municipalities, the average effect of the treatment is todiminish uncertainty by .05 on a five point scale. In accounts rejected municipalities, however,we find a small positive (and insignificant) effect. Overall, the effect is negligible.
Finally, we find null effects with respect to our main dependent variable, vote for the incum-bent, as well as evaluation of the incumbent’s record in office. As shown in Figures 12 and 13the point estimates are in the expected direction but small and statistically insignificant. Forvote choice, the point estimate for respondents in both types of municipality is no greater than.02. Accounting for sampling uncertainty, we can rule out effect sizes greater than about .06with 95% confidence. Overall, these results indicate that the respondents’ vote choices are notsensitive to the information we distributed. We turn to possible explanations of this result in thenext section.
4 Explanation of Effects
Why might our intervention have failed to exert any significant effects on the decision to votefor or against mayors running for reelection? One obvious answer might be that Brazilians failto condemn corruption or malfeasance by elected officials. Yet numerous empirical studies and
18

Effect on Evaluation of the Mayor
−0.15 −0.05 0.00 0.05 0.10 0.15
Accounts Rejected
Accounts Approved
●
●
permutation p−value: 0.13
Control Mean: 2.85
permutation p−value: 0.19
Control Mean: 3.05
Figure 12 – Effect of Treatment on Evaluation of Mayor’s Record. Dependent variable is the respon-dent’s assessment of the mayor’s record on a 5 point scale (higher values indicating a more positiveevaluation). Lines are 95% confidence intervals. P-values in the right margin are from one tailed testscomputed using permutation inference.
Effect on Vote for the Incumbent
−0.06 −0.04 −0.02 0.00 0.02 0.04 0.06
Accounts Rejected
Accounts Approved
●
●
permutation p−value: 0.23
Control Mean: 0.4
permutation p−value: 0.14
Control Mean: 0.47
Figure 13 – Effect of Treatment on Vote for the Incumbent. Dependent variable is the respondent’sself-reported vote. Lines are 95% confidence intervals. P-values in the right margin are from onetailed tests computed using permutation inference.
19

public opinion surveys suggest that, to the contrary, Brazilians are some of the most intolerant ofofficial corruption in the world. In the most recent wave of the World Values Survey, Brazil ranked8th out of 60 countries in the percentage who said that accepting a bribe is "never justifiable." Inthe AmericasBarometer surveys from 2004–2014, Brazilians have the highest sustained levels ofpopular concern with corruption in the region, judged by an open-ended question about themost serious problem facing the country (Boas, Hidalgo, and Melo 2017).
In the context of Brazilians’ staunch opposition to corruption, survey experiments presentingvoters with hypothetical vignettes about a corrupt mayor running for reelection have found largeand statistically significant electoral punishment effects, of much greater magnitude than similarstudies in Colombia, Moldova, Peru, and Sweden (Avenburg 2016; Botero et al. 2015; Klašnja andTucker 2013; Vera Rojas 2017; Weitz-Shapiro and Winters 2017; Winters and Weitz-Shapiro 2013,2016). In our own survey, we were able to replicate these large negative effects when presentingour treatment information about the rejection of accounts in the context of a hypotheticalvignette (Boas, Hidalgo, and Melo 2017). The strong negative response in the vignette experimentshows that voters consider a rejection of accounts to be worthy of punishment; hence, the nulleffects of our field experiment should not be attributable to miscomprehension of the deliveredinformation.
Our survey also underscores that Brazilians strongly support the horizontal accountabilitymission of the TCE-PE, especially under the original sanctions regime of the Clean Slate Law.In the second wave of our survey, we asked respondents whether mayors who had had theiraccounts rejected by the TCE should have the right to run for reelection. In the full sampleof respondents, 91% answered "no." Even among respondents who reported voting for theincumbent mayor and had been informed of the rejection of his or her accounts, 84% said thatsuch mayors should not have the right to run again—effectively claiming that the candidatethey supported should not have been on the ballot.
Another explanation for the null finding might be pervasive cynicism about incumbentsand challengers. If voters do not perceive the other candidates in the race as better alternativeswith respect to corruption or malfeasance, negative information might not affect their votingbehavior. The problem with this explanation is the lack of any effect of positive information.If voters’ ex-ante opinions about all candidates were highly negative, the provision of positiveinformation should induce some citizens to vote for incumbents with approved accounts sincethis new information would counter their priors. The absence of both positive and negativeeffects suggests that low expectations is an unlikely reason for our null findings.
Rather than suggesting that Brazilians do not care about corruption or malfeasance or thattheir expectations are already too low, we argue that they fail to act upon a strong anti-corruptionnorm due to a variety of factors that constrain voting behavior (Boas, Hidalgo, and Melo 2017).Here, we highlight two particularly important constraints: the greater salience of more tangibleaspects of incumbent performance, such as job creation and the quality of health services, aswell as voter loyalty to political dynasties, which serves as a functional equivalent to strong partyidentification in many municipalities. In addition to our survey, this section draws upon severalsources of qualitative data: background reports on 14 municipalities prepared by Brazilianresearch assistants and post-electoral focus groups in 3 municipalities.
Our research makes it clear that corruption in general, and the judgment of a mayor’s ac-counts by the TCE-PE in particular, are relatively low-salience concerns for voters in Pernam-buco.9 In the baseline survey we asked respondents to name the biggest problem in their
9. One possible factor behind the divergence between our findings and those of Ferraz and Finan (2008), which findslarge effects of releasing audit information, is that actors such as the media are essential for making audit results salient,as well as facilitating coordination among citizens who wish to act on the information.
20

municipality, and in the endline survey we asked what issue candidates had most discussed dur-ing the campaign. At the top of both lists are health (mentioned by 33% as the biggest problem,and 46% as the biggest campaign issue), crime (15% and 8%), employment (15% and 10%), anddealing with a severe drought affecting much of the state (15% and 7%). Only 2% mentionedcorruption or municipal accounts as the biggest campaign issue, and fewer than 1% consideredit the biggest problem.
Evidence from the focus groups underscored these findings from the survey. Asked aboutproblems in their municipality, participants most often mentioned poor employment prospects,an issue exacerbated by the region’s severe drought, which has made it difficult to earn a livingin agriculture. Issues related to corruption and municipal accounts never arose spontaneously.When asked about the quality of the municipal government’s "financial management," a termused in the survey to refer to the status of the mayor’s accounts, participants talked insteadabout whether the municipal government paid public servants on time.
A second factor that likely constrains voters’ responses to information about malfeasanceconcerns their loyalty or opposition to traditional political dynasties. Mass partisanship isrelatively weak in Brazil, so it is unlikely to play the role that it is often thought to play in advanceddemocracies—limiting the effect on voting behavior of information gleaned during the campaign.Yet dynastic politics is likely to serve as a functional equivalent in many small towns. In themajority of our fourteen case study municipalities, one or more of the principal candidates formayor in 2016 was a close relative—parent, child, grandchild, sibling, niece/nephew, or currentor former spouse—of a former mayor in that municipality. In some instances, candidates’families had dominated municipal politics for decades. Their campaign strategies often madethese family ties explicit, such as featuring photos and names of ex-mayor relatives in theiradvertising materials.
Evidence from the focus groups underscores that loyalty to political dynasties may serve asimilar function as traditional partisan attachments in more established democracies. Whilemembers of local political dynasties often switch formal party affiliations from one electionto the next, participants often used the term "party" to refer to these groups. According toone participant in Flores, "all my life it’s been two parties, either one of them has 5000 votesguaranteed, and there are 2–3000 votes left for them to dispute. . . the candidate can be JoeNobody, he enters and gets 5000 votes." In Tabira, another participant said that "whoever votesfor that party never ceases to be [loyal]. . . it’s a real tradition. They are people that put on theshirt of their team and never take it off."
In sum, while Brazilian voters strongly condemn corruption and malfeasance in the abstract,it simply ranks too low on their priority lists to have much chance of influencing voting behaviorin real elections. Some residents of small towns may support the candidate of a local politicaldynasty out of longstanding loyalty to that particular clan. For voters such as these, any aspectof incumbent performance may have little influence over their decisions. Where local dynastiesare weaker, residents may be more inclined to reward good performers and punish bad ones.Yet those voting based on performance criteria may be largely swayed by a mayor’s record ontangible and highly salient issues such as job creation and local health services, leaving littleroom for additional information about the judgment of an auditing agency to influence theirdecisions.
21

5 Results from the Pilot and Second Arm
Consistent with the idea that issue salience matters for the effectiveness of informational inter-ventions, results from our pilot study and second arm show that certain types of informationabout incumbent performance can change voting behavior, but only for those citizens with apersonal stake in the issue. In our large-scale pilot study, we provided information on municipalefforts at combating mosquito-borne illnesses such as Zika, dengue, and chikungunya, and inour second arm of the field experiment, we provided information on standardized test scores inmunicipality-run elementary schools. Mosquito-borne illnesses were a potentially salient issueat the time of our fieldwork because Pernambuco was the epicenter of an outbreak of congenitalZika syndrome, the series of severe birth defects, including microcephaly, associated with theZika virus. For its part, school performance is potentially salient for parents of children enrolledin local schools, thus providing meaningful heterogeneity in the degree to which respondentshad a personal stake in the policy.
With respect to the information on combatting mosquito-borne illnesses, our pilot studyprovided voters in the treatment condition with information about the municipality’s hiring ofAnti-Endemic Disease Agents (Agentes de Combate às Endemias, ACE), specialized public healthworkers who visit homes to combat mosquitos and to teach residents about disease prevention.Municipalities are in charge of hiring these agents, using both federal and municipal funds;to benchmark their efforts, we use the number of agents funded by the Federal government.Thus, our performance indicator is the ratio of ACE agents per municipality to the maximumnumber funded by the federal government, which varies substantially across Pernambuco.Treatment information was delivered in a manner similar to that of the field experiment, but voteintention was recorded immediately after information delivery. Because the outcome variablewas measured in the same survey—rather than several weeks later, as in our panel study—onemight expect larger treatment effects.
Despite the intense media coverage of the Zika outbreak, we find that providing informationabout the municipality’s efforts to combat mosquito-borne illnesses has no detectable effect onintended vote for the incumbent mayor, regardless of whether the municipality was a good orpoor performer on our metric (Boas and Hidalgo 2017). These findings also apply to parents ofyoung children or those planning to conceive in the next several years, a population that mightbe particularly concerned about the effects of the Zika virus on fetal development. However, wefind strong reactions to negative information among respondents who know someone with achild affected by microcephaly or the Zika virus. For this group, the treatment lowers supportfor the incumbent by 37.7 percentage points in poor performing municipalities. Hence, onlyamong respondents with a personal connection to the negative consequences of Zika—forwhom information about mosquito control should be particularly salient—do we observe anyelectoral sanctioning effect.
We find a similar result when examining voters’ response to information about municipalschool performance (Boas, Hidalgo, and Toral 2017). The second arm of the field experimentinformed about changes in scores on the National Literacy Evaluation (Avaliação Nacionalde Alfabetização or ANA) during the mayor’s first term. Among all respondents, we find anunexpected result: voters tend to punish good municipal performance on the ANA and aregenerally indifferent to poor performance. However, this result masks considerable heterogeneityby whether the respondent has a child enrolled in a municipal school. Among parents of enrolledchildren, for whom the issue should be most salient, we find the expected relationship: voterspunish poor performance and reward (or are indifferent to) good performance. As with anti-disease efforts, a personal connection to the policy in question appears to be a prerequisite for
22

information about incumbent performance to change voting behavior.
6 Conclusion
Vertical accountability might seem to offer a recourse for institutions of horizontal accountabilitywhose efforts to sanction officeholders are blocked by legal obstacles or political maneuverings.While executives may be able to thwart the constraints imposed by other government entities,in a democracy they are more vulnerable to the punishment imposed by voters. If institutionslike Brazil’s State Accounts Courts can communicate their decisions directly to the public, theycan potentially induce citizens to act directly, voting against and possibly defeating corrupt ormalfeasant incumbents. The strength of Brazil’s anticorruption norm—confirmed in multiplesurveys, including our own—suggests that voters might indeed have the will to do so.
The results of our Metaketa project underscore the limits of this form of "roundabout horizon-tal accountability." While Brazilian voters condemn corruption and malfeasance in the abstract,they fail to take action in a real election when presented with the same sort of information abouttheir own mayor. We argue that a variety of other factors serve to constrain voting behavior,including attitudes toward local political dynasties and the greater salience of more tangibleaspects of incumbent performance, such as job creation. Hence, our findings underscore thatrobust, direct horizontal accountability is the most promising way to combat corruption andmalfeasance in Brazil.
23

References
Avenburg, Alejandro. 2016. “Corruption and Electoral Accountability in Brazil.” Ph.D. Disserta-tion, Boston University.
Boas, Taylor C., and F. Daniel Hidalgo. 2017. Electoral Intentives to Combat Mosquito-BorneIllnesses: Experimental Evidence from Brazil, Working Paper.
Boas, Taylor C., F. Daniel Hidalgo, and Marcus A. Melo. 2017. Norms vs Actions: Voting againstMalfeasance in Brazil, Working Paper.
Boas, Taylor C., F. Daniel Hidalgo, and Guillermo Toral. 2017. Evaluating Students and Politicians:Test Scores and Electoral Accountability in Brazil, Working Paper.
Botero, Sandra, Rodrigo Castro Cornejo, Laura Gamboa, Nara Pavao, and David W. Nickerson.2015. “Says Who? An Experiment on Allegations of Corruption and Credibility of Sources.”Political Research Quarterly 68 (3): 493–504.
Falleti, Tulia G. 2010. Decentralization and subnational politics in Latin America. CambridgeUniversity Press.
Ferraz, Claudio, and Frederico Finan. 2008. “Exposing corrupt politicians: the effects of Brazil’spublicly released audits on electoral outcomes.” The Quarterly Journal of Economics 123 (2):703–745.
Hidalgo, F. Daniel, Júlio Canello, and Renato Lima-de-Oliveira. 2016. “Can Politicians PoliceThemselves? Natural Experimental Evidence From Brazil’s Audit Courts.” ComparativePolitical Studies 49 (13): 1739–1773.
Klašnja, Marko, and Joshua A. Tucker. 2013. “The economy, corruption, and the vote: Evidencefrom experiments in Sweden and Moldova.” Electoral Studies 32 (3): 536–543.
Lin, Winston. 2013. “Agnostic notes on regression adjustments to experimental data: Reexamin-ing Freedman’s critique.” The Annals of Applied Statistics 7 (1): 295–318.
Melo, Marcus André, Carlos Pereira, and Carlos Mauricio Figueiredo. 2009. “Political and Institu-tional Checks on Corruption.” Comparative Political Studies 42 (9): 1217–1244.
Novaes, Lucas M. 2017. “Disloyal Brokers and Weak Parties.” American Journal of Political Science.
Paiva, Natalia, and Juliana Sakai. 2014. Quem São os Conselheiros dos Tribunais de Contas.
Speck, Bruno W. 2011. “Auditing Institutions.” In Corruption and Democracy in Brazil: TheStruggle for Accountability, edited by Timothy J. Power and Matthew M. Taylor, 127–161.Notre Dame, IN: University of Notre Dame Press.
Vera Rojas, Sofía Beatriz. 2017. “The Heterogeneous Effects of Corruption: Experimental Evidencefrom Peru.” Manuscript, University of Pittsburgh.
Weitz-Shapiro, Rebecca, and Matthew S. Winters. 2017. “Can Citizens Discern? InformationCredibility, Political Sophistication, and the Punishment of Corruption in Brazil.” Journal ofPolitics 79 (1): 60–74.
Winters, Matthew S., and Rebecca Weitz-Shapiro. 2013. “Lacking Information or CondoningCorruption: When do Voters Support Corrupt Politicians?” Comparative Politics 45 (4): 418–436.
24

Winters, Matthew S., and Rebecca Weitz-Shapiro. 2016. “Who’s in Charge Here? Direct andIndirect Accusations and Voter Punishment of Corruption.” Political Research Quarterly 69(2): 207–219.
25

Appendices
A Meta-PAP Pre-Specified Results
This section contains all applicable Meta-PAP pre-specified results. In addition to estimates andheteroskedastic-consistent standard errors, we present permutation p-values for the sharp nullhypothesis of no effect. To calculate p-values, we drew 10,000 draws from the randomizationdistribution under the null. The test-statistic is the regression coefficient divided by the standarderror.
For specifications with covariate adjustment, the following variables are included in theestimating equation:
• Age• Gender• Likelihood that incumbent will engage in vote buying• Likelihood that the vote is not secret• Likelihood that vote count is accurate• Relative well-being• Respondent most interested in receiving information about corruption• Respondent most trusts information coming from a person conducting a survey• Identifies with the party of the mayor• Same race as mayor• Turnout in previous mayoral election• Vote for the incumbent in previous mayoral election• Years of educationFor variables that were asked using a Likert scale format, we transform the ordinal-scale
variable into a numeric variable with equal intervals between each possible response.Because all included covariates are demeaned, main effects—even when interactions are
included—should be interpreted as the estimate of the average treatment effect.
A.1 Family 1
Good News Good News (cov. adj) Bad News Bad News (cov. adj)Control Mean 0.462 0.471 0.400 0.401
(0.015) (0.014) (0.019) (0.019)ATE Estimate 0.020 0.015 −0.003 −0.002
(0.023) (0.020) (0.028) (0.027)Num. obs. 847 847 818 818ATE Permutation P-Value 0.288 0.326 0.456 0.473
Table A1 – Famil1y 1 Results. Outcome is self-reported vote for the incumbent. Estimates fromspecifications listed as part of the "Primary Family" in the Meta-PAP.
Results for the hypotheses in the “Primary” family are presented in Table A1. Specificationsin the first and third columns do not include covariates.
26

A.2 Family 2
Good News Good News (cov. adj) Bad News Bad News (cov. adj)Control Mean 0.960 0.956 0.948 0.945
(0.007) (0.006) (0.010) (0.009)ATE Estimate 0.015 0.020 0.009 0.015
(0.009) (0.008) (0.012) (0.012)Num. obs. 847 847 818 818ATE Permutation P-Value 0.162 0.071 0.247 0.137
Table A2 – Family 2 Results. Outcome is self-reported turnout. Estimates from specifications listed aspart of the "Secondary Family" in the Meta-PAP.
Results for the hypotheses in the “Secondary” family are presented in Table A2. Note thatturnout is self-reported. Specifications in the first and third columns do not include covariates.
A.3 Family 3
Effort (Good News) Effort (Bad News) Integrity (Good News) Integrity (Bad News)Control Mean 3.248 2.832 2.567 2.257
(0.041) (0.046) (0.043) (0.049)ATE Estimate −0.058 0.059 0.018 −0.028
(0.057) (0.064) (0.057) (0.068)Num. obs. 810 760 825 776ATE Permutation P-Value 0.292 0.209 0.403 0.360
Table A3 – Family 3 Results. Outcomes are perceptions of incumbent effort and integrity. Estimatesfrom specifications listed as part of the "Mediators" family in the Meta-PAP. All specifications includepre-specified covariates.
Results for the hypotheses in the “Mediators” family are presented in Table A3.
A.4 Family 4
Moderator: Same Race as Mayor Same Party as Mayor ClientelismGood News Bad News Good News Bad News Good News Bad News
Treatment (ATE) 0.015 -0.012 0.015 -0.012 0.01 -0.01SE 0.020 0.025 0.020 0.025 0.02 0.02Perm. P-Value 0.343 0.357 0.331 0.375 0.34 0.36Treatment x Moderator 0.087 -0.058 0.018 0.038 -0.03 0.01SE 0.063 0.063 0.015 0.014 0.03 0.02Perm. P-Value 0.142 0.196 0.176 0.011 0.21 0.36Num. obs. 847 818 847 818 847 818
Table A4 – Family 4 Results. Outcome is self-reported vote for the incumbent. Estimate from specifi-ciations listed as part of "Substitution" family in the Meta-PAP. Moderator has been demeaned somain effect is the estimated ATE. All specifications include pre-specified covariates.
Results for the hypotheses in the “Substitution” family are presented in Table A4. The moder-ator “Same Race as Mayor” is whether the respondent believes the incumbent is the same race.
27

The “Clientelism” moderator is based on the question asking respondents to rate the probabilitythat the incumbent will engage in vote buying.
A.5 Family 5
Moderator: Uncertainty Competition Free and FairGood News Bad News Good News Bad News Good News Bad News
Treatment (ATE) 0.018 -0.009 0.015 -0.012 0.01 -0.01SE 0.020 0.025 0.020 0.025 0.02 0.02Perm. P-Value 0.331 0.398 0.332 0.359 0.35 0.37Treatment x Moderator 0.031 0.012 1.114 -10.732 -0.02 0.02SE 0.023 0.028 1.877 2.637 0.03 0.03Perm. P-Value 0.148 0.371 0.376 0.006 0.26 0.28Num. obs. 847 818 847 818 847 818
Table A5 – Family 5 Results. Outcome is self-reported vote for the incumbent. Estimate from specifi-ciations listed as part of “Context” family in the Meta-PAP. Moderator has been demeaned so maineffect is the estimated ATE. All specifications include pre-specified covariates.
Results for the hypotheses in the “Context” family are presented in Table A5. The moderator“Uncertainty” measures the degree of uncertainty that the respondent has over his or her prior.The moderator “Competition” is simply the vote margin between the top mayoral candidates inthe 2012 election. “Free and Fair” is the sum of the questions asking voters to rate the probabilitythat the vote is counted fairly and that their vote is secret.
A.6 Family 6
Moderator None Welfare Relevant Source CredibilityFull Sample Good News Bad News Good News Bad News
Treatment (ATE) 0.001 0.015 -0.012 0.015 -0.012SE 0.016 0.020 0.025 0.020 0.025Perm. P-Value 0.490 0.345 0.353 0.331 0.343Treatment x Moderator 0.124 0.184 -0.094 -0.015SE 0.075 0.075 0.106 0.112Perm. P-Value 0.103 0.017 0.252 0.456Num. obs. 1665 847 818 847 818
Table A6 – Family 6 Results. Outcome is self-reported vote for the incumbent. Estimate from specifi-ciations listed as part of "Design" family in the Meta-PAP. Moderator has been demeaned so maineffect is the estimated ATE. All specifications include pre-specified covariates.
Results for the hypotheses in the “Design” family are presented in Table A6. The resultspresented in the first column show the effect of the treatment on vote for the incumbent withoutdistinguishing between good news and bad news. For the “Welfare Relevant” moderator, we usewhether or not the respondent would most like to obtain information about politicians involvedin corruption. For the “Source Credibility” moderator, we use whether or not the respondentwould most trust information given by a person conducting a survey.
Note that we do not present results for the hypotheses labeled “Public Channels” and“Hawthorne” because these treatments were not part of our design.
28

B Balance Tests
Variable Estimate SE Perm. P-Value2012 Incumbent Vote 0.011 0.018 0.3562012 Turnout -0.044 0.014 0.015Age 0.328 0.670 0.366Education -0.052 0.180 0.445Female -0.050 0.020 0.054Finds Info from Surveyors Credible 0.010 0.010 0.258Free and Fair Scale -0.046 0.052 0.289Prob Vote Can’t Be Monitored -0.017 0.041 0.406Prob. Vote Buying -0.085 0.046 0.106Prob. Vote Count Accurate -0.030 0.033 0.276Relative Wellbeing 0.030 0.081 0.389Same Party as Mayor -0.024 0.018 0.202Same Race as Mayor 0.046 0.043 0.218Wants Info about Corruption 0.020 0.016 0.169
Table A7 – Covariate Balance Tests. Estimates are based on full sample.
Covariate balance tests on pre-specified covariates are presented in Table A7. These estimatesare from a model with block fixed effects run on the full sample.
29