horizons active corporate bond etf (hab, hab.a:tsx)
TRANSCRIPT

Horizons Active Corporate Bond ETF(HAB, HAB.A:TSX)
Annual Report | December 31, 2016
www.HorizonsETFs.comInnovation is our capital. Make it yours.
ALPHA BENCHMARK BETAPRO
92964 - Horizons HAB.indd 1 2017-03-06 8:29 AM

ContentsMANAGEMENT REPORT OF FUND PERFORMANCE
Management Discussion of Fund Performance . . . . . . . . . . . . . . . . . . . . . 1
Financial Highlights . . . . . . . . . . . . . . . . . . . . . . . . . . . . . . . . . . . . . . . . . . . . . . . 7
Past Performance . . . . . . . . . . . . . . . . . . . . . . . . . . . . . . . . . . . . . . . . . . . . . . . . . 11
Summary of Investment Portfolio . . . . . . . . . . . . . . . . . . . . . . . . . . . . . . . . . 13
MANAGER’S RESPONSIBILITY FOR FINANCIAL REPORTING . . . . . . . . . . . . 15
INDEPENDENT AUDITORS’ REPORT . . . . . . . . . . . . . . . . . . . . . . . . . . . . . . . . . . . . . 16
FINANCIAL STATEMENTS
Statements of Financial Position . . . . . . . . . . . . . . . . . . . . . . . . . . . . . . . . . . 17
Statements of Comprehensive Income . . . . . . . . . . . . . . . . . . . . . . . . . . . . 18
Statements of Changes in Financial Position . . . . . . . . . . . . . . . . . . . . . . . 19
Statements of Cash Flows . . . . . . . . . . . . . . . . . . . . . . . . . . . . . . . . . . . . . . . . . 20
Schedule of Investments . . . . . . . . . . . . . . . . . . . . . . . . . . . . . . . . . . . . . . . . . . 21
Notes to Financial Statements . . . . . . . . . . . . . . . . . . . . . . . . . . . . . . . . . . . . 26
92964 - Horizons HAB.indd 3 2017-03-06 8:29 AM
Letter from the President and Co-CEO:
It was another noteworthy year in 2016 for both Horizons ETFs Management (Canada) Inc. (“Horizons ETFs”) and the Canadian ETF industry. The industry surpassed $100 billion in assets under management (“AUM”) with now more than 400 ETF listings. Meanwhile, our AUM surpassed $7.0 billion and we launched 10 new ETFs, giving us a total of 76 different tools available for our clients. It was gratifying that this success was spread out across all three of our ETF line-ups which include our benchmark index ETFs, actively managed ETFs and BetaPro ETFs for tactical investors.
With the evolution of the investment landscape in Canada bringing greater fee transparency and fewer tax-efficient products available to the retail investor, we’ve focused on expanding our line-up of Total Return Index (“TRI”) ETFs. This includes the launch of the Horizons Cdn High Dividend Index ETF (“HXH”), the Horizons NASDAQ-100® Index ETF (“HXQ”) and the Horizons EURO STOXX 50® Index ETF (“HXX”), which is the first ETF of its kind in Canada to provide investors with low-cost, tax-efficient exposure to the performance of 50 of the largest sector-leading companies in Europe.
Along with these new offerings, we lowered the cost of the Horizons S&P 500® Index ETF (“HXS”), reducing its management fee from 0.15% to 0.10%. We also launched currency hedged versions of popular U.S.-focused index strategies, including the Horizons S&P 500 CAD Hedged Index ETF (“HSH”) and the Horizons US 7-10 Year Treasury Bond CAD Hedged ETF (“HTH”), which give investors access to U.S. asset classes with a hedge to protect returns from currency volatility between the Canadian and U.S. dollars.
While most equity markets finished the year on a positive note – something which has certainly helped the growth of our benchmark suite of index-replicating ETFs – fixed income investors had a more difficult year in 2016. For the first time in more than a generation, we may be looking at a period of prolonged rising – rather than falling – interest rates. November was the worst month on record for bond losses globally, according to Bloomberg, as markets digested the unexpected results and ramifications of the U.S. presidential election.
We believe that our low-cost family of actively managed fixed income ETFs have the flexibility to reduce duration and take advantage of these potentially seismic changes in the fixed income market. One of the primary beneficiaries of rising rates, for example, was in the Canadian preferred share asset class. The Horizons Active Preferred Share ETF (“HPR”) has been the top asset-gatherer in the preferred share space in Canada this year and was our top-selling actively managed ETF for the calendar year. HPR now has a solid six-year track record that demonstrates the value of active management in this asset class.
Regardless of the direction of markets or interest rates, we have ETF solutions that allow investors of all types to customize their portfolio exposure. Markets do change, sometimes quickly, and our family of ETFs gives investors the tools they need to help meet their objectives.
For more information on all our strategies, please visit our website at www.HorizonsETFs.com where we offer a range of resources designed to help you become a more skilled ETF investor.
Thank you for your continued support and wishing you strong returns in 2017,
Steven J. Hawkins, President & Co-CEOHorizons ETFs Management (Canada) Inc.
92964 - Horizons HAB.indd 5 2017-03-06 8:29 AM

1
Horizons Active Corporate Bond ETF
MANAGEMENT REPORT OF FUND PERFORMANCE
This annual management report of fund performance for Horizons Active Corporate Bond ETF (“Horizons HAB” or the “ETF”) contains financial highlights and is included with the audited annual financial statements for the investment fund. You may request a copy of the ETF’s unaudited interim or audited annual financial statements, interim or annual man-agement report of fund performance, current proxy voting policies and procedures, proxy voting disclosure record, or quarterly portfolio disclosures, at no cost, from the ETF’s manager, AlphaPro Management Inc. (“AlphaPro” or the “Manag-er”), by calling toll free 1-866-641-5739, or locally (416) 933-5745, by writing to us at: 26 Wellington Street East, Suite 700, Toronto ON, M5E 1S2, or by visiting our website at www.horizonsetfs.com or SEDAR at www.sedar.com.
This document may contain forward-looking statements relating to anticipated future events, results, circumstances, per-formance, or expectations that are not historical facts but instead represent our beliefs regarding future events. By their nature, forward-looking statements require us to make assumptions and are subject to inherent risks and uncertainties. There is significant risk that predictions and other forward-looking statements will not prove to be accurate. We caution readers of this document not to place undue reliance on our forward-looking statements as a number of factors could cause actual future results, conditions, actions or events to differ materially from the targets, expectations, estimates or intentions expressed or implied in the forward-looking statements.
Actual results may differ materially from management expectations as projected in such forward-looking statements for a variety of reasons, including but not limited to market and general economic conditions, interest rates, regulatory and statutory developments, and the effects of competition in the geographic and business areas in which the ETF may invest and the risks detailed from time to time in the ETF’s prospectus. New risk factors emerge from time to time and it is not possible for management to predict all such risk factors. We caution that the foregoing list of factors is not exhaustive, and that when relying on forward-looking statements to make decisions with respect to investing in the ETF, investors and others should carefully consider these factors, as well as other uncertainties and potential events, and the inherent uncertainty of forward-looking statements. Due to the potential impact of these factors, the Manager does not under-take, and specifically disclaims, any intention or obligation to update or revise any forward-looking statements, whether as a result of new information, future events or otherwise, unless required by applicable law.
Management Discussion of Fund Performance
Investment Objective and Strategies
The investment objective of Horizons HAB is to seek long-term moderate capital growth and generate high income. Ho-rizons HAB invests primarily in a portfolio of debt securities of Canadian and U.S. companies, directly, or through invest-ments in securities of other investment funds, including exchange traded funds. Horizons HAB, to the best of its ability, seeks to hedge its non-Canadian dollar currency exposure to the Canadian dollar at all times.
To achieve Horizons HAB’s investment objectives, the ETF’s sub-advisor, Fiera Capital Corporation (“Fiera” or the “Sub-Advisor”), uses fundamental credit research to select companies that, based on the Sub-Advisor’s view on the company’s industry and growth prospects, are believed to offer superior risk adjusted returns relative to passively managed corpo-rate bond indexes. When the Sub-Advisor believes that interest rates will increase, the Sub-Advisor may choose securi-ties with shorter terms and when the Sub-Advisor believes that interest rates will decrease, the Sub-Advisor may choose securities with longer terms.
The Sub-Advisor seeks diversification by industry sector and geographic region and relies on its: in-depth fundamental credit research, view of market trends, analysis of the company’s competitive position, and review of the return relative to the company’s risk and general market conditions, to select securities for the ETF.
In order to manage the liquidity of the portfolio, the Sub-Advisor may, from time to time, invest in debt securities or money market instruments issued or guaranteed by the Government of Canada or the Government of a jurisdiction in Canada, or issued or guaranteed by the U.S. Government.
92964 - Horizons HAB.indd 1 2017-03-06 8:29 AM

2
Horizons Active Corporate Bond ETF
Horizons HAB may rely on exemptions from the securities regulatory authorities allowing it to purchase securities of a related issuer of Fiera which are not exchange traded if certain conditions are met. In particular, the investment must be consistent with, or necessary to meet, the investment objective of Horizons HAB. The investment must also be approved by the ETF’s Independent Review Committee (“IRC”) and is subject to certain other provisions of National Instrument 81-107 (“NI 81-107”).
Please refer to the ETF’s most recent prospectus for a complete description of Horizons HAB’s investment restrictions.
Risk
The Manager performs a review of the ETF’s risk rating at least annually, as well as when there is a material change in the ETF’s investment objective or investment strategies. The current risk rating for the ETF is: low.
Risk ratings are determined based on the historical volatility of the ETF as measured by the standard deviation of its performance against its mean. The risk categorization of the ETF may change over time and historical volatility is not indicative of future volatility. Generally, a risk rating is assigned to the ETF based on the historical rolling ten-year standard deviation of its return, the return of an underlying index, or of an applicable proxy index. In cases where the Manager believes that this methodology produces a result that is not indicative of the ETF’s future volatility, the risk rating may be determined by the ETF’s category. Risk ratings are not intended for use as a substitute for undertaking a proper and complete suitability or financial assessment by an investment advisor.
The Manager, as a summary for existing investors, is providing the list below of the risks to which an investment in the ETF may be subject. Prospective investors should read the ETF’s most recent prospectus and consider the full descrip-tion of the risks contained therein before purchasing units.
The risks to which an investment in the ETF is subject are listed below and have not changed from the list of risks found in the ETF’s most recent prospectus. A full description of each risk listed below may also be found in the most recent prospectus. The most recent prospectus is available at www.horizonsetfs.com or from www.sedar.com, or by contacting AlphaPro Management Inc. directly via the contact information on the back page of this document.
• Stock market risk • Specific issuer risk • Legal and regulatory risk • Exchange traded funds risk• Reliance on historical data risk • Corresponding net asset value risk• Designated broker/dealer risk • Cease trading of securities risk • Exchange risk • Early closing risk • No assurance of meeting investment objective • Tax risk • Securities lending, repurchase and reverse repurchase transaction risk• Loss of limited liability • Reliance on key personnel• Distributions risk• Conflicts of interest
• No ownership interest• Market for units• Redemption price• Net asset value fluctuation• Restrictions on certain unitholders• Highly volatile markets• Multi-class risk• No guaranteed return• Derivatives and counterparty risk• Interest rate risk• Foreign currency risk• Credit risk• Foreign stock exchange risk• Call risk• Risk of difference between quoted and actionable market price• Liquidity risk
Management Discussion of Fund Performance (continued)
92964 - Horizons HAB.indd 2 2017-03-06 8:29 AM

3
Horizons Active Corporate Bond ETF
Management Discussion of Fund Performance (continued)
Results of Operations
For the year ended December 31, 2016, the Class E units and Advisor Class units of the ETF returned 3.84% and 3.26%, respectively, when including distributions paid to unitholders. This compares to a return of 3.59% for the Bank of America Merrill Lynch Canada Corporate Bond Index (the “Index) for the same period.
The Index tracks the performance of Canadian dollar denominated investment grade corporate, securitized and collater-alized debt publicly issued in the Canadian domestic market.
General Market Review
The year opened poorly for Canadian credit markets as the continued plunge in oil prices from 2015 cast a shadow over the outlook for the Canadian economy and the important energy related sectors in particular. As oil prices recovered, risk appetite improved and spreads began to narrow.
Global market conditions were also supportive for credit spreads. In Europe, the expansion of the European Central Bank’s (the “ECB”) bond purchase program to include investment grade corporate bonds gave a lift to credit-related securities, while in the U.S., a slower pace of growth pushed out the need for the U.S. Federal Reserve (the “Fed”) to raise its policy interest rate setting.
Late in the second quarter, the decision by U.K. voters to leave the European Union resulted in a moderate repricing of credit spreads, but the reaction to date has been quite measured. The result still leaves a great deal of uncertainty in the market with respect to the ultimate impact on the U.K. bond markets, which did suffer a brief correction in September when the ECB and Bank of Japan (“BOJ”) failed to add to their asset purchase programs, as had been expected. However, bond markets rallied once again following the September Federal Open Market Committee (“FOMC”) meeting that once again failed to deliver a much discussed rate hike.
The U.S. elections were the main focus in the fourth quarter, with the Fed’s mid-December decision to raise its benchmark overnight lending rate being the second main event. The unexpected win of the U.S. presidency by Donald Trump in early November resulted in significant market volatility afterwards. The potentially pro-growth environment marketed by the Trump presidential team led equities higher and drove growth forecasts and inflation expectations higher, with North-American interest rates increasing to year-high levels.
In this environment, corporate bonds did extremely well this year, with generic corporate spreads tightening between 36-46 basis points (bps). Spread compression that began in mid-February continued into year-end. BBB-rated bonds performed 20 bps better than A-rated credits, with a 50 bps compression versus 30 bps. Broad corporate BBB-rated bonds were the best performers among the various index segments in 2016, posting a total return of 5.15%. That performance was more than 150 bps ahead of the next closest component, which was in broad corporate A-rated bonds, at 3.60%. The performance in broad corporate A-rated bonds was more than 150 basis points better than the next two index segments, broad corporate AA-rated bonds and municipal bonds, both of which returned 1.98%. Sector wise, energy and telecom-munication services were the best performers for the year, outperforming the broader corporate universe by 167 and 58 bps, respectively.
Portfolio Review
For 2016, gross performance of the ETF, before expenses, was 85 bps higher than the Index, with an absolute return of 4.44%. Most of the value added came from the higher relative value of an investment in corporate bonds versus similar
92964 - Horizons HAB.indd 3 2017-03-06 8:29 AM

4
government bonds (carry) in the ETF’s portfolio as compared to the Index. This carry had a positive effect on performance of approximately 46 bps. Yield compression within corporate bonds and the selection of specific sectors did generate an additional 32 bps of value.
In 2016, the general spread compression seen in corporate bonds was indeed impressive. Fiera focused on the energy and financial sectors and these made the largest contributions to the ETF’s spread performance. The improved oil and gas market has greatly stabilized the pipeline sector throughout the year and spreads continued to retrace the widening that occurred late in 2015 and early this year. Enbridge Inc., Pembina Pipeline Inc., Inter Pipeline Ltd. and AltaGas Ltd. are portfolio constituents that were added that saw a subsequent narrowing of spreads.
Spreads in the pipeline sector were narrower by over 60 bps on average over the year and by 36 bps in the fourth quarter alone. The financial sector was another area of focus. The ETF holds large positions in subordinated bank securities that have done well as bank capital remains healthy. Insurance issuers have also been the beneficiaries of rising yields and stronger equity markets as these bolster earnings and improve capital reserves.
Outlook
At face value, the election of Donald Trump to the U.S. presidency is bearish for bonds. The key elements of his taxation and spending proposals will boost growth in the U.S. materially, should they come to pass. Given the relatively small amount of slack in the U.S. economy, this could push rate expectations higher and will need to be factored into future Fed rate decisions. Some of this is already reflected in the post-election move in yields. Further rises in bond yields will depend on how successful the new president is in pushing his agenda. With the Republican Party in control of both Con-gress and the presidency, it seems reasonable that some version of his program will be implemented.
Other elements of Trump’s program are more ambiguous. Aggressive trade policies, for example, could interrupt global supply systems. Canada in particular may be vulnerable to disruptions should the North American Free Trade Agreement (“NAFTA”) be watered down or trade disputes interfere with cross-border activity. Global conditions also remain in doubt. The Eurozone is currently getting a lift from a weaker currency and stimulative monetary policies. However, long-term economic recovery remains a challenge and upcoming elections in France and Germany in 2017 could pour cold water on the Euro project.
While there is room for yields to move higher, we think inflation expectations remain well contained and the positive impact from fiscal stimulus will be somewhat offset by tighter financial conditions in the form of a stronger U.S. dollar and rising long-term borrowing rates. Increased risks tied to geopolitical events will become harder to predict and lead us to expect a pick-up in financial market volatility.
Credit markets should continue to be supported by a moderate improvement in economic growth if accompanied by a moderate response by monetary authorities. We think Canadian businesses will find good support from the weaker Canadian dollar, ample excess capacity and some stabilization in the energy sector. We judge the current compensa-tion for carry as attractive but expect 2017 will offer plenty of opportunities to be tactical. Hence, Fiera plans to remain moderately overweight credit spreads with a view of taking profits as sector spreads get to the lower end of our expected trading range.
Other Operating Items and Changes in Net Assets Attributable to Holders of Redeemable Units
For the year ended December 31, 2016, the ETF generated gross comprehensive income (loss) from investments and de-rivatives of $22,593,271. This compares to $13,697,631 for the year ended December 31, 2015. The ETF incurred manage-ment, operating and transaction expenses of $3,184,552 (2015 – $3,281,140) of which $22,399 (2015 – $nil) was either
Management Discussion of Fund Performance (continued)
Horizons Active Corporate Bond ETF
92964 - Horizons HAB.indd 4 2017-03-06 8:29 AM

5
Management Discussion of Fund Performance (continued)
paid or absorbed by the Manager on behalf of the ETF. The waiving and/or absorption of such fees and/or expenses by the Manager may be terminated at any time, or continued indefinitely, at the discretion of the Manager.
The ETF distributed $21,741,167 to Class E unitholders and $120,278 to Advisor Class unitholders during the year (2015 – Class E: $17,860,103, Advisor Class: $91,399).
Unitholder Activity
An “ETF” is a stock exchange listed, open-ended, continuously offered fund. All orders to purchase units directly from the ETF must be placed by designated brokers and/or underwriters. On any trading day, a designated broker or an under-writer may place a subscription order for a prescribed number of units (“PNU”) or integral multiple PNU. The ETF reserves the absolute right to reject any subscription order placed by a designated broker and/or an underwriter. No fees will be payable by the ETF to a designated broker or an underwriter in connection with the issuance of units. On the issuance of units, the Manager may, at its discretion, charge an administrative fee to an underwriter or designated broker to offset any expenses incurred in issuing the units.
All unitholders of the ETF may exchange the applicable PNU (or an integral multiple thereof ) of the ETF on any trading day for a prescribed basket of securities (as determined by the investment manager) and/or cash, subject to the require-ment that a minimum PNU be exchanged. The Manager may, in its complete discretion, pay exchange proceeds consist-ing of cash only in an amount equal to the net asset value of the applicable PNU of the ETF next determined following the receipt of the exchange request. The Manager will, upon receipt of the exchange request, advise the unitholder submit-ting the request as to whether cash and/or a basket of securities will be delivered to satisfy the request.
Investors are able to trade units of the ETF in the same way as other securities traded on the Toronto Stock Exchange (“TSX”), including by using market orders and limit orders. An investor may buy or sell units of the ETF on the TSX only through a registered broker or dealer in the province or territory where the investor resides. Investors may incur custom-ary brokerage commissions when buying or selling units.
Presentation
The attached financial statements have been prepared in accordance with International Financial Reporting Standards (“IFRS”). Any mention of total net assets, net assets, net asset value or increase (decrease) in net assets in the financial statements and/or management report of fund performance for periods starting on or after January 1, 2013 is referring to net assets or increase (decrease) in net assets attributable to holders of redeemable units as reported under IFRS. Any information presented for periods prior to January 1, 2013 is in accordance with Canadian generally accepted accounting principles (“Canadian GAAP”).
Recent Developments
Other than indicated below, there are no recent industry, management or ETF related developments that are pertinent to the present and future of the ETF.
Termination of Advisor Class Units
On December 29, 2016, the Manager announced that it plans to eliminate the Advisor Class units of the ETF. As of January 31, 2017, investment professionals will no longer be able to purchase Advisor Class units on behalf of their clients and this class of units is expected to be fully eliminated by the end of April, 2017.
Horizons Active Corporate Bond ETF
92964 - Horizons HAB.indd 5 2017-03-06 8:29 AM

6
Management Discussion of Fund Performance (continued)
Horizons Active Corporate Bond ETF
Related Party Transactions
Certain services have been provided to the ETF by related parties and those relationships are described below.
Manager, Trustee and Investment Manager
The manager and trustee of the ETF is AlphaPro Management Inc., 26 Wellington Street East, Suite 700, Toronto, Ontario, M5E 1S2, a corporation incorporated under the laws of Ontario specializing in actively managed ETFs. AlphaPro is a subsidiary of Horizons ETFs Management (Canada) Inc., which also serves as the ETF’s investment manager (“Horizons Management” or the “Investment Manager”), and both entities are members of the Mirae Asset Financial Group. If the ETF invests in the Horizons Management ETFs, Horizons Management may receive management fees in respect of the ETF’s assets invested in such Horizons Management ETFs. The offices of the Manager and Investment Manager are the same.
Other Related Parties
An affiliate of National Bank of Canada (“NBC”) and National Bank Financial Inc. (“NBF”) holds an indirect minority inter-est in the Manager, and NBC holds an indirect minority interest in Fiera, the sub-advisor of the ETF. NBF acts or may act as a designated broker, an underwriter and/or a registered trader (market maker). These relationships may create actual or perceived conflicts of interest which investors should consider in relation to an investment in the ETF. In particular, by virtue of these relationships, NBF may profit from the sale and trading of the ETF’s units. NBF, as market maker of the ETF in the secondary market, may therefore have economic interests which differ from and may be adverse to those of unitholders.
NBF’s potential roles as a designated broker and a dealer of the ETF is not as an underwriter of the ETF in connection with the primary distribution of units under the ETF’s prospectus. NBF was not involved in the preparation of, nor did it per-form any review of, the contents of the ETF’s prospectus. NBF and its affiliates may, at present or in the future, engage in business with the ETF, the issuers of securities making up the investment portfolio of the ETF, or with the Manager or any funds sponsored by the Manager or its affiliates, including by making loans, executing brokerage transactions, entering into derivative transactions or providing advisory or agency services. In addition, the relationship between NBF and its af-filiates, and the Manager and its affiliates may extend to other activities, such as being part of a distribution syndicate for other funds sponsored by the Manager or its affiliates.
The ETF, in its course of normal business in seeking to achieve its investment objective, may enter into portfolio transac-tions that involve an investment in securities of an issuer that is a related party to the Manager. The Manager is permitted to execute these transactions without seeking advance approval from the ETF’s Independent Review Committee (“IRC”), provided the Manager complies with the predetermined list of requirements agreed upon with the IRC.
For the years ended December 31, 2016 and 2015, the ETF did not make any payments to NBF, and/or its affiliates in bro-ker commissions on portfolio transactions.
92964 - Horizons HAB.indd 6 2017-03-06 8:29 AM

7
The following tables show selected key financial information about the ETF and are intended to help you understand the ETF’s financial performance for the past five fiscal years. This information is derived from the ETF’s audited annual financial statements. Please see the front page for information on how you may obtain the ETF’s annual or interim financial statements.
The ETF’s Net Assets per Unit
Class EYear 2016 2015 2014 2013 2012
Net assets, beginning of year (1) $ 10.66 10.80 10.43 10.74 10.40
Increase from operations: Total revenue 0.43 0.43 0.42 0.42 0.45 Total expenses (0.06) (0.07) (0.06) (0.06) (0.06) Realized gains (losses) for the year 0.11 – 0.06 (0.01) 0.17 Unrealized gains (losses) for the year (0.08) (0.15) 0.31 (0.32) 0.14
Total increase from operations (2) 0.40 0.21 0.73 0.03 0.70
Distributions: From net investment income (excluding dividends) (0.36) (0.36) (0.36) (0.35) (0.39) From net realized capital gains (0.09) – (0.06) – (0.14)
Total annual distributions (3) (0.45) (0.36) (0.42) (0.35) (0.53)
Net assets, end of year (4) $ 10.70 10.66 10.80 10.43 10.71
Financial Highlights
Horizons Active Corporate Bond ETF
92964 - Horizons HAB.indd 7 2017-03-06 8:29 AM

8
Advisor ClassYear 2016 2015 2014 2013 2012
Net assets, beginning of year (1) $ 10.68 10.82 10.44 10.75 10.41
Increase (decrease) from operations: Total revenue 0.43 0.43 0.42 0.42 0.45 Total expenses (0.12) (0.12) (0.12) (0.12) (0.12) Realized gains (losses) for the year 0.11 – 0.06 (0.01) 0.17 Unrealized gains (losses) for the year (0.09) (0.17) 0.34 (0.31) 0.11
Total increase (decrease) from operations (2) 0.33 0.14 0.70 (0.02) 0.61
Distributions: From net investment income (excluding dividends) (0.30) (0.30) (0.30) (0.29) (0.34) From net realized capital gains (0.08) – (0.05) – (0.13)
Total annual distributions (3) (0.38) (0.30) (0.35) (0.29) (0.47)
Net assets, end of year (4) $ 10.72 10.68 10.82 10.44 10.73
1. This information is derived from the ETF’s audited annual financial statements as at December 31 of the years shown. Class E units of the ETF have an initial net asset value of $10.00 as at July 14, 2010. Advisor Class units of the ETF have an initial net asset value of $10.26 as at October 12, 2011 which was the net asset value of Class E units on that date. Information from 2013 onwards is in accordance with IFRS. Information for years prior to 2013 is reported under Canadian GAAP.
2. Net assets per unit and distributions are based on the actual number of units outstanding at the relevant time. The increase (decrease) from operations is based on the weighted average number of units outstanding over the financial period.
3. Income, dividend and/or return of capital distributions, if any, are paid in cash, reinvested in additional units of the ETF, or both. Capital gains distributions, if any, may or may not be paid in cash. Non-cash capital gains distributions are reinvested in additional units of the ETF and subsequently consolidated. They are reported as taxable distributions and increase each unitholder’s adjusted cost base for their units. Neither the number of units held by the unitholder, nor the net asset per unit of the ETF change as a result of any non-cash capital gains distributions. Distributions classified as return of capital, if any, decrease each unitholder’s adjusted cost base for their units. The characteristics of distributions, if any, are determined subsequent to the end of the ETF’s tax year. Until such time, distribu-tions are classified as from net investment income (excluding dividends) for reporting purposes.
4. The Financial Highlights are not intended to act as a continuity of the opening and closing net assets per unit.
Financial Highlights (continued)
Horizons Active Corporate Bond ETF
92964 - Horizons HAB.indd 8 2017-03-06 8:29 AM

9
Ratios and Supplemental Data
Class EYear (1) 2016 2015 2014 2013 2012
Total net asset value (000’s) $ 513,864 528,301 518,534 491,893 517,219Number of units outstanding (000’s) 48,005 49,547 48,015 47,182 48,166Management expense ratio (2) 0.60% 0.60% 0.60% 0.61% 0.57%Management expense ratio before waivers and absorptions (3) 0.60% 0.60% 0.61% 0.61% 0.66%Trading expense ratio (4) 0.00% 0.00% 0.00% 0.00% 0.00%Portfolio turnover rate (5) 30.73% 28.35% 70.72% 72.24% 92.07%Net asset value per unit, end of year $ 10.70 10.66 10.80 10.43 10.74 Closing market price $ 10.65 10.68 10.80 10.43 10.78
Advisor ClassYear (1) 2016 2015 2014 2013 2012
Total net asset value (000’s) $ 3,485 3,204 2,975 3,394 3,495Number of units outstanding (000’s) 325 300 275 325 325Management expense ratio (2) 1.15% 1.14% 1.14% 1.14% 1.13%Management expense ratio before waivers and absorptions (3) 1.16% 1.16% 1.16% 1.17% 1.24%Trading expense ratio (4) 0.00% 0.00% 0.00% 0.00% 0.00%Portfolio turnover rate (5) 30.73% 28.35% 70.72% 72.24% 92.07%Net asset value per unit, end of year $ 10.72 10.68 10.82 10.44 10.75 Closing market price $ 10.75 10.67 10.82 10.51 10.79
1. This information is provided as at December 31 of the years shown. Information from 2013 onwards is in accordance with IFRS. Information for years prior to 2013 is reported under Canadian GAAP.
2. Management expense ratio is based on total expenses, including sales tax, (excluding commissions and other portfolio transaction costs) for the stated period and is expressed as an annualized per-centage of daily average net asset value during the year. Out of its management fees, the Manager pays for such services to the ETF as investment manager compensation, service fees and marketing.
3. The Manager, at its discretion, may waive and/or absorb a portion of the fees and/or expenses otherwise payable by the ETF. The waiving and/or absorption of such fees and/or expenses by the Manager may be terminated at any time, or continued indefinitely, at the discretion of the Manager.
4. The trading expense ratio represents total commissions and other portfolio transaction costs expressed as an annualized percentage of daily average net asset value during the year.
5. The ETF’s portfolio turnover rate indicates how actively its portfolio investments are traded. A portfolio turnover rate of 100% is equivalent to the ETF buying and selling all of the securities in its port-folio once in the course of the year. Generally, the higher the ETF’s portfolio turnover rate in a year, the greater the trading costs payable by the ETF in the year, and the greater the chance of an investor receiving taxable capital gains in the year. There is not necessarily a relationship between a high turnover rate and the performance of the ETF.
Financial Highlights (continued)
Horizons Active Corporate Bond ETF
92964 - Horizons HAB.indd 9 2017-03-06 8:29 AM

10
Management Fees
The Manager appoints the Investment Manager and provides, or oversees the provision of, administrative services re-quired by the ETF including, but not limited to: negotiating contracts with certain third-party service providers, such as portfolio managers, custodians, registrars, transfer agents, auditors and printers; authorizing the payment of operating expenses incurred on behalf of the ETF; arranging for the maintenance of accounting records for the ETF; preparing re-ports to unitholders and to the applicable securities regulatory authorities; calculating the amount and determining the frequency of distributions by the ETF; preparing financial statements, income tax returns and financial and accounting information as required by the ETF; ensuring that unitholders are provided with financial statements and other reports as are required from time to time by applicable law; ensuring that the ETF complies with all other regulatory requirements, including the continuous disclosure obligations of the ETF under applicable securities laws; administering purchases, redemptions and other transactions in units of the ETF; and dealing and communicating with unitholders of the ETF. The Manager provides office facilities and personnel to carry out these services, if not otherwise furnished by any other ser-vice provider to the ETF. The Manager also monitors the investment strategies of the ETF to ensure that the ETF complies with its investment objectives, investment strategies and investment restrictions and practices.
In consideration for the provision of these services, the Manager receives a monthly management fee at the annual rate of 0.50%, plus applicable sales taxes, of the net asset value of the ETF’s Class E units and 1.00%, plus applicable sales taxes, of the net asset value of the ETF’s Advisor Class units, calculated and accrued daily and payable monthly in arrears.
The Manager, and not the ETF, will pay to registered dealers a service fee equal to 0.50% per year of the net asset value of Advisor Class units held by clients of the registered dealer. No service fees are paid to registered dealers in respect of Class E units.
The Investment Manager and Sub-Advisor are compensated for their services out of the management fees without any further cost to the ETF. Any expenses of the ETF which are waived or absorbed by the Manager are paid out of the man-agement fees received by the Manager.
The table below details, in percentage terms, the services received by the ETF from the Manager in consideration of the management fees paid during the year.
Marketing
Portfolio management fees, general administrative costs
and profit
Waived/absorbed expenses of the ETF
7% 92% 1%
Financial Highlights (continued)
Horizons Active Corporate Bond ETF
92964 - Horizons HAB.indd 10 2017-03-06 8:29 AM

11
Commissions, trailing commissions, management fees and expenses all may be associated with an investment in the ETF. Please read the prospectus before investing. The indicated rates of return are the historical total returns including changes in unit value and reinvestment of all distributions, and do not take into account sales, redemptions, distributions or optional charges or income taxes payable by any investor that would have reduced returns. An investment in the ETF is not guaranteed. Its value changes frequently and past performance may not be repeated. The ETF’s performance num-bers assume that all distributions are reinvested in additional units of the ETF. If you hold this ETF outside of a registered plan, income and capital gains distributions that are paid to you increase your income for tax purposes whether paid to you in cash or reinvested in additional units. The amount of the reinvested taxable distributions is added to the adjusted cost base of the units that you own. This would decrease your capital gain or increase your capital loss when you later redeem from the ETF, thereby ensuring that you are not taxed on this amount again. Please consult your tax advisor regarding your personal tax situation.
Year-by-Year Returns
The following chart presents the ETF’s performance for its Class E and Advisor Class units for the periods shown. In per-centage terms, the chart shows how much an investment made on the first day of the financial period would have grown or decreased by the last day of the financial period.
2010 2011 2012 2013 2014 2015 2016Class E 2.82% 7.52% 7.01% 0.36% 7.12% 2.05% 3.84%
Advisor Class 2.41% 6.40% -0.17% 6.55% 1.50% 3.26%
-2.00%
0.00%
2.00%
4.00%
6.00%
8.00%
10.00%
Rate
of R
etur
n
Class E units of the ETF have an initial net asset value of $10.00 as at July 14, 2010 and Advisor Class units of the ETF have an initial net asset value of $10.26 as at October 12, 2011.
Past Performance
Horizons Active Corporate Bond ETF
92964 - Horizons HAB.indd 11 2017-03-06 8:29 AM

12
Annual Compound Returns
The following table presents the ETF’s annual compound total return since inception and for the periods shown ended December 31, 2016 along with a comparable market index. The table is used only to illustrate the effects of the com-pound growth rate and is not intended to reflect future values of the ETF or future returns on investments in the ETF.
PeriodClass E
Return %Advisor Class
Return %
BofA Merrill Lynch Canada Corporate
Bond Index Return %
1 Year 3.84% 3.26% 3.59%
3 Year 4.31% 3.75% 4.57%
5 Year 4.04% 3.47% 4.18%
Since Inception:
Class E 4.72% 4.95%
Advisor Class 3.80% 4.62%
Class E units of the ETF have an initial net asset value of $10.00 as at July 14, 2010 and Advisor Class units of the ETF have an initial net asset value of $10.26 as at October 12, 2011.
Horizons Active Corporate Bond ETF
Past Performance (continued)
92964 - Horizons HAB.indd 12 2017-03-06 8:29 AM

13
% of ETF’sAsset Mix Net Asset Value Net Asset Value
Canadian Fixed Income Securities $ 456,970,158 88.33%U.S. Fixed Income Securities 44,666,733 8.63%Global Fixed Income Securities 11,464,202 2.22%Currency Forward Hedge* (374,054) -0.07%Cash and Cash Equivalents 2,366,880 0.46%Margin Deposits 499 0.00%Other Assets less Liabilities 2,253,814 0.43% $ 517,348,232 100.00% % of ETF’sSector Mix Net Asset Value Net Asset Value
Corporate Bonds $ 495,622,716 95.80%Municipal Bonds 7,911,145 1.53%Mortgage Backed Securities 4,251,714 0.82%Provincial Bonds 2,956,141 0.57%Government Bonds 2,359,377 0.46%Currency Forward Hedge* (374,054) -0.07%Cash and Cash Equivalents 2,366,880 0.46%Margin Deposits 499 0.00%Other Assets less Liabilities 2,253,814 0.43% $ 517,348,232 100.00%
*Positions in forward contracts are disclosed as the gain/(loss) that would be realized if the contracts were closed out on the date of this report.
Summary of Investment PortfolioAs at December 31, 2016
Horizons Active Corporate Bond ETF
92964 - Horizons HAB.indd 13 2017-03-06 8:29 AM

14
% of ETF’sTop 25 Holdings* Net Asset Value
Royal Bank of Canada 4.87%Bank of Nova Scotia (The) 3.24%Bank of Montreal 3.09%Ford Credit Canada Ltd. 2.42%Toronto-Dominion Bank (The) 2.39%TELUS Corp. 2.26%Canadian Western Bank 2.08%407 International Inc. 1.77%Canadian Imperial Bank of Commerce 1.70%Bell Canada 1.64%Home Trust Co. (The) 1.63%Laurentian Bank of Canada 1.62%EnerCare Solutions Inc. 1.60%Enbridge Pipelines Inc. 1.55%SNC-Lavalin Innisfree McGill Finance Inc. 1.55%Health Montreal Collective L.P. 1.49%CIBC Capital Trust 1.34%Empire Life Insurance Co. (The) 1.32%SEC L.P. and Arci Ltd. 1.30%BP L.P. 1.26%AltaGas Ltd. 1.23%CU Inc. 1.23%Reliance L.P. 1.21%Hydro One Inc. 1.18%Sun Life Financial Inc. 1.17%
* Note all of the Top 25 Holdings represent the aggregate debt instruments of that issuer in the ETF’s portfolio.
The summary of investment portfolio may change due to the ongoing portfolio transactions of the ETF. The most recent financial statements are available at no cost by calling 1-866-641-5739, by writing to us at 26 Wellington Street East, Suite 700, Toronto, Ontario, M5E 1S2, by visiting our website at www.horizonsetfs.com or through SEDAR at www.sedar.com.
Summary of Investment Portfolio (continued)As at December 31, 2016
Horizons Active Corporate Bond ETF
92964 - Horizons HAB.indd 14 2017-03-06 8:29 AM

15
MANAGER’S RESPONSIBILITY FOR FINANCIAL REPORTING
The accompanying audited annual financial statements of Horizons Active Corporate Bond ETF (the “ETF”) are the responsibil-ity of the manager and trustee to the ETF, AlphaPro Management Inc. (the “Manager”). They have been prepared in accor-dance with International Financial Reporting Standards using information available and include certain amounts that are based on the Manager’s best estimates and judgments.
The Manager has developed and maintains a system of internal controls to provide reasonable assurance that all assets are safeguarded and to produce relevant, reliable and timely financial information, including the accompanying financial statements.
These financial statements have been approved by the Board of Directors of the Manager and have been audited by KPMG LLP, Chartered Professional Accountants, Licensed Public Accountants, on behalf of unitholders. The independent audi-tors’ report outlines the scope of their audit and their opinion on the financial statements.
________________________ ________________________Steven J. Hawkins Taeyong LeeDirector DirectorAlphaPro Management Inc. AlphaPro Management Inc.
Horizons Active Corporate Bond ETF
92964 - Horizons HAB.indd 15 2017-03-06 8:29 AM

16
INDEPENDENT AUDITORS’ REPORT
To the Unitholders of Horizons Active Corporate Bond ETF (the “ETF”)
We have audited the accompanying financial statements of the ETF, which comprise the statements of financial position as at December 31, 2016 and 2015, the statements of comprehensive income, changes in financial position and cash flows for the years then ended, and notes, comprising a summary of significant accounting policies and other explanatory information.
Management’s Responsibility for the Financial Statements
Management is responsible for the preparation and fair presentation of these financial statements in accordance with Inter-national Financial Reporting Standards, and for such internal control as management determines is necessary to enable the preparation of financial statements that are free from material misstatement, whether due to fraud or error.
Auditors’ Responsibility
Our responsibility is to express an opinion on these financial statements based on our audits. We conducted our audits in ac-cordance with Canadian generally accepted auditing standards. Those standards require that we comply with ethical require-ments and plan and perform the audit to obtain reasonable assurance about whether the financial statements are free from material misstatement.
An audit involves performing procedures to obtain audit evidence about the amounts and disclosures in the financial state-ments. The procedures selected depend on our judgment, including the assessment of the risks of material misstatement of the financial statements, whether due to fraud or error. In making those risk assessments, we consider internal control relevant to the entity’s preparation and fair presentation of the financial statements in order to design audit procedures that are appropriate in the circumstances, but not for the purpose of expressing an opinion on the effectiveness of the ETF’s internal control. An audit also includes evaluating the appropriateness of accounting policies used and the reasonableness of accounting estimates made by management, as well as evaluating the overall presentation of the financial statements.
We believe that the audit evidence we have obtained in our audits is sufficient and appropriate to provide a basis for our audit opinion.
Opinion
In our opinion, the financial statements present fairly, in all material respects, the financial position of the ETF as at December 31, 2016 and 2015, and its financial performance and its cash flows for the years then ended in accordance with International Financial Reporting Standards.
Chartered Professional Accountants, Licensed Public AccountantsMarch 15, 2017Toronto, Canada
Horizons Active Corporate Bond ETF
92964 - Horizons HAB.indd 16 2017-03-06 8:29 AM

17
2016 2015
Assets Cash and cash equivalents $ 2,366,880 $ 9,355,419 Investments 513,101,093 518,946,944 Margin deposits (note 12) 499 1,184,171 Amounts receivable relating to accrued income 4,006,809 4,286,097
Total assets 519,475,281 533,772,631
Liabilities Accrued expenses 267,982 259,850 Distribution payable 1,485,013 1,564,776 Derivative liabilities (note 3) 374,054 443,242
Total liabilities 2,127,049 2,267,868
Total net assets (note 2) $ 517,348,232 $ 531,504,763
Total net assets, Class E $ 513,863,643 $ 528,300,839 Number of redeemable units outstanding, Class E (note 9) 48,004,813 49,547,344 Total net assets per unit, Class E $ 10.70 $ 10.66
Total net assets, Advisor Class $ 3,484,589 $ 3,203,924 Number of redeemable units outstanding, Advisor Class (note 9) 325,000 300,000 Total net assets per unit, Advisor Class $ 10.72 $ 10.68
(See accompanying notes to financial statements)
Approved on behalf of the Board of Directors of the Manager:
______________________ _______________________Steven J. Hawkins Taeyong Lee
Statements of Financial PositionAs at December 31,
Horizons Active Corporate Bond ETF
92964 - Horizons HAB.indd 17 2017-03-06 8:29 AM

18
2016 2015
Income Interest income for distribution purposes $ 20,771,641 $ 21,233,260 Securities lending income (note 8) 50,900 37,727 Net realized gain on sale of investments and derivatives 5,231,164 626,779 Net realized loss on foreign exchange (26,730) (490,509) Net change in unrealized depreciation of investments and derivatives (3,410,720) (7,729,102) Net change in unrealized appreciation (depreciation) of foreign exchange (22,984) 19,476
22,593,271 13,697,631
Expenses Management fees (note 10) 2,971,543 3,078,668 Audit fees 21,868 20,981 Independent Review Committee fees 7,151 8,515 Custodial fees 35,242 41,516 Legal fees 3,229 7,428 Securityholder reporting costs 70,615 72,618 Administration fees 67,627 42,578 Transaction costs 7,086 7,577 Other expenses 191 1,259
3,184,552 3,281,140
Amounts that were payable by the investment fund that were paid or absorbed by the Manager (22,399) –
3,162,153 3,281,140
Increase in net assets for the year $ 19,431,118 $ 10,416,491
Increase in net assets, Class E $ 19,329,343 $ 10,375,352 Increase in net assets per unit, Class E 0.40 0.21
Increase in net assets, Advisor Class $ 101,775 $ 41,139 Increase in net assets per unit, Advisor Class 0.33 0.14
(See accompanying notes to financial statements)
Statements of Comprehensive IncomeFor the Years Ended December 31,
Horizons Active Corporate Bond ETF
92964 - Horizons HAB.indd 18 2017-03-06 8:29 AM

19
Statements of Changes in Financial PositionFor the Years Ended December 31,
2016 2015
Total net assets at the beginning of the year $ 531,504,763 $ 521,508,153
Increase in net assets 19,431,118 10,416,491 Redeemable unit transactions Proceeds from the issuance of securities of the investment fund 13,486,380 59,229,256 Aggregate amounts paid on redemption of securities of the investment fund (29,513,383) (41,778,173) Securities issued on reinvestment of distributions 4,300,799 80,538 Distributions: From net investment income (17,626,766) (17,951,502) From net realized capital gains (4,234,679) –
Total net assets at the end of the year $ 517,348,232 $ 531,504,763
Total net assets at the beginning of the year, Class E $ 528,300,839 $ 518,533,572
Increase in net assets, Class E 19,329,343 10,375,352 Redeemable unit transactions Proceeds from the issuance of securities of the investment fund 13,213,670 58,415,168 Aggregate amounts paid on redemption of securities of the investment fund (29,513,383) (41,243,688) Securities issued on reinvestment of distributions 4,274,341 80,538 Distributions: From net investment income (17,532,946) (17,860,103) From net realized capital gains (4,208,221) –
Total net assets at the end of the year, Class E $ 513,863,643 $ 528,300,839
Total net assets at the beginning of the year, Advisor Class $ 3,203,924 $ 2,974,581
Increase in net assets, Advisor Class 101,775 41,139 Redeemable unit transactions Proceeds from the issuance of securities of the investment fund 272,710 814,088 Aggregate amounts paid on redemption of securities of the investment fund – (534,485) Securities issued on reinvestment of distributions 26,458 – Distributions: From net investment income (93,820) (91,399) From net realized capital gains (26,458) –
Total net assets at the end of the year, Advisor Class $ 3,484,589 $ 3,203,924
(See accompanying notes to financial statements)
Horizons Active Corporate Bond ETF
92964 - Horizons HAB.indd 19 2017-03-06 8:29 AM

20
Statements of Cash FlowsFor the Years Ended December 31,
2016 2015
Cash flows from operating activities:Increase in net assets for the year $ 19,431,118 $ 10,416,491 Adjustments for: Net realized gain on sale of investments and derivatives (5,231,164) (626,779) Net realized gain (loss) on currency forward contracts 774,020 (2,965,078) Net change in unrealized depreciation of investments and derivatives 3,410,720 7,729,102 Net change in unrealized depreciation (appreciation) of foreign exchange 10,984 (11,382) Purchase of investments (159,213,746) (174,890,490) Proceeds from the sale of investments 166,036,833 149,401,585 Margin deposits 1,183,672 (1,142,187) Amounts receivable relating to accrued income 279,288 (263,905) Accrued expenses 8,132 (25,836)
Net cash from (used in) operating activities 26,689,857 (12,378,479)
Cash flows from financing activities: Amount received from the issuance of units 13,486,380 59,229,256 Amount paid on redemptions of units (29,513,383) (41,778,173) Distributions paid to unitholders (17,640,409) (17,787,846)
Net cash used in financing activities (33,667,412) (336,763)
Net decrease in cash and cash equivalents during the year (6,977,555) (12,715,242)Effect of exchange rate fluctuations on cash and cash equivalents (10,984) 11,382 Cash and cash equivalents at beginning of year 9,355,419 22,059,279
Cash and cash equivalents at end of year $ 2,366,880 $ 9,355,419
Interest received, net of withholding taxes $ 21,050,929 $ 20,969,355
(See accompanying notes to financial statements)
Horizons Active Corporate Bond ETF
92964 - Horizons HAB.indd 20 2017-03-06 8:29 AM

21
Schedule of InvestmentsAs at December 31, 2016
Par Value/ Average Fair Security Contracts Cost Value
CANADIAN FIXED INCOME SECURITIES (88.33%)Corporate Bonds (84.95%) 407 International Inc., Callable, 4.45%, 2041/11/15 5,428,000 $ 6,138,489 $ 6,018,473 407 International Inc., Callable, 3.83%, 2046/05/11 3,142,000 3,132,557 3,151,908 Access Justice Durham Ltd., Series ‘A’, 5.02%, 2039/08/31 1,736,978 2,058,684 1,963,369 AGT Ltd., 8.80%, 2025/09/22 2,145,000 2,848,529 2,980,380 Air Canada, Callable, 4.75%, 2023/10/06 1,770,000 1,770,000 1,753,406 Algonquin Power Co., Callable, 5.50%, 2018/07/25 1,575,000 1,572,291 1,651,413 Algonquin Power Co., Restricted, 4.82%, 2021/02/15 2,080,000 2,078,752 2,227,281 Alimentation Couche-Tard Inc., Series ‘5’, Restricted, Callable, 3.60%, 2025/06/02 4,332,000 4,332,396 4,445,837 Alliance Pipeline L.P., Series ‘A’, 7.18%, 2023/06/30 547,311 677,763 624,663 Alliance Pipeline L.P., Callable, 6.77%, 2025/12/31 1,013,726 1,196,704 1,148,446 Allied Properties REIT, Series ‘B’, Callable, 3.93%, 2022/11/14 880,000 880,000 891,100 AltaGas Ltd., Series ‘7’, Callable, 4.07%, 2020/06/01 3,180,000 3,374,150 3,379,088 AltaGas Ltd., Callable, 4.12%, 2026/04/07 1,534,000 1,533,126 1,607,434 AltaGas Ltd., Callable, 5.16%, 2044/01/13 1,300,000 1,280,526 1,370,676 Aon Finance N.S. 1 ULC, Callable, 4.76%, 2018/03/08 2,790,000 2,799,519 2,880,845 Arrow Lakes Power Corp., Callable, 5.52%, 2041/04/05 1,881,915 1,881,915 2,137,506 Bank of Montreal, 1.88%, 2021/03/31 1,020,000 1,021,950 1,018,987 Bank of Montreal, 1.61%, 2021/10/28 5,532,000 5,483,148 5,430,709 Bank of Montreal, Series ‘F’, Variable Rate, Callable, 6.17%, 2023/03/28 4,670,000 5,331,064 4,928,074 Bank of Montreal, Variable Rate, 3.12%, 2024/09/19 1,284,000 1,284,000 1,300,997 Bank of Montreal, Variable Rate, Callable, 3.32%, 2026/06/01 3,252,000 3,251,545 3,306,017 Bank of Montreal Subordinated Notes Trust, Variable Rate, Callable, 5.75%, 2022/09/26 500,000 561,789 515,304 Bank of Nova Scotia (The), 1.90%, 2021/12/02 5,000,000 4,978,300 4,964,118 Bank of Nova Scotia (The), Variable Rate, Callable, 3.04%, 2024/10/18 11,419,000 11,624,863 11,783,799 Bell Canada, Series ‘EZ’, Callable, 7.00%, 2027/09/24 2,200,000 2,497,893 2,813,746 Bell Canada, Series ‘M-17’, Callable, 6.10%, 2035/03/16 1,315,000 1,586,810 1,587,777 Bell Canada, Callable, 4.75%, 2044/09/29 3,940,000 3,905,404 4,076,524 BP L.P., Sinkable, Restricted, 3.24%, 2020/01/09 6,394,041 6,488,097 6,526,210 Brookfield Asset Management Inc., Callable, 4.54%, 2023/03/31 2,155,000 2,182,487 2,321,758 Brookfield Asset Management Inc., Callable, 4.82%, 2026/01/28 1,350,000 1,429,515 1,462,890 Brookfield Renewable Partners ULC, Series ‘10’, Callable, 3.63%, 2027/01/15 1,770,000 1,769,115 1,731,841 Canadian Imperial Bank of Commerce, 1.70%, 2018/10/09 52,000 52,362 52,303 Canadian Imperial Bank of Commerce, 1.90%, 2021/04/26 1,831,000 1,830,048 1,830,326 Canadian Imperial Bank of Commerce, Variable Rate, Callable, 3.42%, 2026/01/26 6,775,000 6,775,000 6,905,934 Canadian Natural Resources Ltd., 3.31%, 2022/02/11 3,168,000 3,167,525 3,236,657 Canadian Natural Resources Ltd., Callable, 3.55%, 2024/06/03 1,600,000 1,594,128 1,618,112 Canadian Western Bank, 2.53%, 2018/03/22 4,800,000 4,800,000 4,838,844 Canadian Western Bank, Variable Rate, Callable, 3.46%, 2024/12/17 5,800,000 5,855,350 5,893,494
Horizons Active Corporate Bond ETF
92964 - Horizons HAB.indd 21 2017-03-06 8:29 AM

22
Par Value/ Average FairSecurity Contracts Cost Value
Schedule of Investments (continued)As at December 31, 2016
Capital City Link General Partnership, Sinkable, Callable, 4.39%, 2046/03/31 3,985,000 4,024,163 4,083,602 Capital Desjardins Inc., Series ‘G’, Callable, 5.19%, 2020/05/05 4,560,000 5,071,859 5,002,257 Central 1 Credit Union, Variable Rate, Callable, 3.06%, 2026/10/14 4,759,000 4,757,049 4,717,098 Chip Mortgage Trust, Series ‘16-1’, 2.98%, 2041/11/15 780,000 780,000 775,047 Choice Properties L.P., Series ‘10’, Callable, 3.60%, 2022/09/20 1,800,000 1,876,878 1,877,469 Choice Properties REIT, Series ‘E’, Callable, 2.30%, 2020/09/14 2,920,000 2,917,342 2,927,384 CIBC Capital Trust, Series ‘A’, Callable, 9.98%, 2019/06/30 5,875,000 7,628,313 6,909,088 Comber Wind L.P., Sinkable, Callable, 5.13%, 2030/11/15 5,351,083 5,394,677 5,763,709 Cominar REIT, Series ‘7’, 3.62%, 2019/06/21 3,087,000 3,087,225 3,147,801 Cominar REIT, Series ‘10’, 4.25%, 2023/05/23 2,100,000 2,100,000 2,123,374 Co-operators Financial Services Ltd., Callable, 5.78%, 2020/03/10 300,000 328,479 323,486 Crombie REIT, 3.99%, 2018/10/31 1,315,000 1,315,000 1,348,187 Crombie REIT, Series ‘C’, 2.78%, 2020/02/10 3,170,000 3,162,646 3,138,199 CT REIT, Series ‘A’, Callable, 2.85%, 2022/06/09 3,600,000 3,600,000 3,618,486 CU Inc., Callable, 4.54%, 2041/10/24 5,653,000 6,317,516 6,339,336 Daimler Canada Finance Inc., 1.80%, 2019/12/16 750,000 749,955 750,268 Emera Inc., 2.90%, 2023/06/16 1,775,000 1,775,000 1,770,051 Empire Life Insurance Co. (The), Restricted, Variable Rate, Callable, 2.87%, 2023/05/31 4,550,000 4,550,000 4,557,348 Empire Life Insurance Co. (The), Variable Rate, Callable, 3.38%, 2026/12/16 2,280,000 2,280,000 2,286,773 Enbridge Inc., Callable, 4.57%, 2044/03/11 3,970,000 3,980,440 3,925,947 Enbridge Income Fund (The), Callable, 3.95%, 2024/11/19 5,642,000 5,643,231 5,959,465 Enbridge Pipelines Inc., Callable, 3.45%, 2025/09/29 4,554,000 4,699,746 4,731,932 Enbridge Pipelines Inc., Callable, 3.00%, 2026/08/10 3,363,000 3,362,697 3,334,537 EnerCare Solutions Inc., 4.30%, 2017/11/30 5,155,000 5,150,773 5,257,448 EnerCare Solutions Inc., Callable, 4.60%, 2020/02/03 2,840,000 2,873,336 2,982,628 Fairfax Financial Holdings Ltd., Callable, 5.84%, 2022/10/14 1,815,000 1,874,296 2,025,602 First Capital Realty Inc., Series ‘L’, Callable, 5.48%, 2019/07/30 500 534 542 First Capital Realty Inc., Series ‘Q’, Callable, 3.90%, 2023/10/30 1,800,000 1,925,694 1,882,208 Ford Credit Canada Ltd., Callable, 3.70%, 2018/08/02 5,750,000 5,830,787 5,916,958 Ford Credit Canada Ltd., Restricted, Callable, 2.92%, 2020/09/16 3,600,000 3,600,000 3,642,349 Ford Credit Canada Ltd., 2.58%, 2021/05/10 1,258,000 1,258,000 1,249,358 Ford Credit Canada Ltd., 3.28%, 2021/07/02 1,700,000 1,739,729 1,733,011 FortisAlberta Inc., Callable, 4.11%, 2044/09/29 3,150,000 3,245,584 3,280,471 FortisBC Energy Inc., Callable, 3.67%, 2046/04/09 350,000 349,492 339,474 General Motors Financial of Canada Ltd., Restricted, Callable, 3.08%, 2020/05/22 1,350,000 1,349,446 1,368,750 Genworth MI Canada Inc., 5.68%, 2020/06/15 1,000,000 1,090,360 1,080,206 Genworth MI Canada Inc., Callable, 4.24%, 2024/04/01 2,100,000 2,100,000 2,119,919 Gibson Energy Inc., Restricted, Callable, 5.38%, 2022/07/15 3,500,000 3,500,000 3,502,188 Grand Renewable Solar L.P., Series ‘1A’, Sinkable, Restricted, Callable, 3.93%, 2035/01/31 1,220,832 1,220,832 1,209,802 Granite REIT Holdings L.P., Callable, 3.79%, 2021/07/05 3,370,000 3,370,000 3,457,963 Great Canadian Gaming Corp., Callable, 6.63%, 2022/07/25 1,140,000 1,160,007 1,199,375 Great-West Lifeco Inc., Callable, 6.67%, 2033/03/21 1,160,000 1,421,750 1,517,276
Horizons Active Corporate Bond ETF
92964 - Horizons HAB.indd 22 2017-03-06 8:29 AM

23
Par Value/ Average FairSecurity Contracts Cost Value
Schedule of Investments (continued)As at December 31, 2016
H&R REIT, Series ‘F’, Callable, 4.45%, 2020/03/02 3,272,000 3,538,575 3,460,672 Health Montreal Collective L.P., Sinkable, Callable, 6.72%, 2049/09/30 6,210,000 8,168,919 7,718,553 Home Trust Co. (The), 3.40%, 2018/12/10 8,350,000 8,346,994 8,440,802 HSBC Bank Canada, 1.82%, 2020/07/07 4,115,000 4,114,835 4,090,910 Hydro One Inc., Callable, 4.17%, 2044/06/06 5,754,000 6,080,808 6,112,714 Industrial Alliance Insurance and Financial Services Inc., Variable Rate, Callable, 3.30%, 2028/09/15 4,199,000 4,197,950 4,242,214 Intact Financial Corp., 6.40%, 2039/11/23 2,890,000 3,379,148 3,791,830 Inter Pipeline Ltd., Series ‘7’, Callable, 3.17%, 2025/03/24 2,250,000 2,250,000 2,267,698 Inter Pipeline Ltd., Callable, 4.64%, 2044/05/30 2,715,000 2,715,000 2,746,945 Iron Mountain Canada Operations ULC, Callable, 5.38%, 2023/09/15 1,065,000 1,065,000 1,074,319 Kingston Solar L.P., Series ‘1A’, Sinkable, 3.57%, 2035/07/31 1,225,000 1,225,000 1,170,692 Laurentian Bank of Canada, 3.28%, 2018/10/15 3,860,000 3,932,270 3,952,083 Laurentian Bank of Canada, 2.81%, 2019/06/13 4,390,000 4,389,166 4,467,806 Loblaw Cos. Ltd., Callable, 4.86%, 2023/09/12 3,738,000 3,741,803 4,193,288 Manufacturers Life Insurance Co. (The), Variable Rate, Callable, 3.94%, 2022/09/21 3,575,000 3,575,000 3,637,701 Manulife Financial Capital Trust II, Series ‘1’, Variable Rate, Callable, 7.41%, 2019/12/31 1,200,000 1,352,610 1,366,199 Morguard Corp., Series ‘B’, 4.01%, 2020/11/18 400,000 400,000 403,485 North West Redwater Partnership / NWR Financing Co. Ltd., Series ‘H’, Restricted, Callable, 4.15%, 2033/06/01 2,843,000 2,835,807 2,976,564 North West Redwater Partnership / NWR Financing Co. Ltd., Callable, 4.05%, 2044/07/22 2,845,000 2,822,058 2,903,574 Nova Scotia Power Inc., Callable, 4.15%, 2042/03/06 2,400,000 2,373,264 2,477,318 Parkland Fuel Corp., Callable, 5.75%, 2024/09/16 920,000 920,000 948,367 Pembina Pipeline Corp., Series ‘7’, Callable, 3.71%, 2026/08/11 2,200,000 2,199,098 2,221,843 Pembina Pipeline Corp., Series ‘4’, Callable, 4.81%, 2044/03/25 3,615,000 3,611,638 3,602,203 Reliance L.P., Callable, 4.57%, 2017/03/15 6,230,000 6,311,819 6,260,384 RioCan REIT, Series ‘Q’, Callable, 3.85%, 2019/06/28 1,880,000 2,017,466 1,968,266 RioCan REIT, 2.19%, 2020/08/26 840,000 840,000 836,424 Rogers Communications Inc., Callable, 5.34%, 2021/03/22 1,478,500 1,723,292 1,666,400 Rogers Communications Inc., Callable, 4.00%, 2024/03/13 1,800,000 1,914,984 1,938,201 Royal Bank of Canada, 2.35%, 2019/12/09 1,600,000 1,643,520 1,632,864 Royal Bank of Canada, 1.58%, 2021/09/13 3,000,000 2,988,570 2,939,497 Royal Bank of Canada, 2.33%, 2023/12/05 4,900,000 4,847,570 4,866,886 Royal Bank of Canada, Variable Rate, Callable, 3.04%, 2024/07/17 6,630,000 6,638,396 6,698,925 Royal Bank of Canada, Variable Rate, Callable, 3.31%, 2026/01/20 4,140,000 4,138,303 4,202,020 Royal Bank of Canada, Variable Rate, Callable, 3.45%, 2026/09/29 4,700,000 4,697,979 4,790,127 Scotiabank Tier I Trust, Variable Rate, Callable, 7.80%, 2019/06/30 2,700,000 3,309,860 3,034,625 SEC L.P. and Arci Ltd., Sinkable, Callable, 5.19%, 2033/08/29 6,435,535 6,526,977 6,746,435 SGTP Highway Bypass L.P., Series ‘A’, Sinkable, Callable, 4.11%, 2045/01/31 3,600,000 3,600,000 3,626,210 Shaw Communications Inc., Callable, 4.35%, 2024/01/31 1,740,000 1,739,582 1,856,003 Smart REIT, Series ‘P’, Callable, 3.44%, 2026/08/28 2,600,000 2,603,510 2,493,779
Horizons Active Corporate Bond ETF
92964 - Horizons HAB.indd 23 2017-03-06 8:29 AM

24
SNC-Lavalin Innisfree McGill Finance Inc., Callable, 6.63%, 2044/06/30 6,279,345 8,141,420 8,012,084 Sobeys Inc., 3.52%, 2018/08/08 3,515,000 3,629,546 3,558,865 Sun Life Capital Trust II, Callable, 5.86%, 2019/12/31 3,550,000 4,140,130 3,889,323 Sun Life Financial Inc., Variable Rate, Callable, 5.59%, 2023/01/30 2,800,000 3,099,432 2,916,209 Sun Life Financial Inc., Variable Rate, Callable, 2.60%, 2025/09/25 3,150,000 3,147,953 3,177,370 Suncor Energy Inc., Callable, 5.39%, 2037/03/26 1,380,000 1,472,511 1,543,261 TD Capital Trust IV, Series ‘1’, Variable Rate, Callable, 9.52%, 2019/06/30 2,925,000 3,733,161 3,410,206 TD Capital Trust IV, Variable Rate, Callable, 6.63%, 2021/06/30 1,550,000 1,722,360 1,792,418 TELUS Corp., Callable, 2.35%, 2022/03/28 6,490,000 6,472,414 6,453,777 TELUS Corp., Callable, 5.15%, 2043/11/26 3,450,000 3,629,821 3,674,649 TELUS Corp., Series ‘CP’, Callable, 4.85%, 2044/04/05 1,505,000 1,592,350 1,537,812 Toronto-Dominion Bank (The), Variable Rate, Callable, 5.76%, 2017/12/18 3,475,000 3,874,250 3,615,466 Toronto-Dominion Bank (The), 1.91%, 2023/07/18 2,044,000 2,054,976 1,988,966 Toronto-Dominion Bank (The), Variable Rate, Callable, 2.69%, 2025/06/24 6,806,000 6,805,252 6,793,294 TransCanada PipeLines Ltd., Callable, 3.30%, 2025/07/17 1,200,000 1,198,476 1,245,520 TransCanada PipeLines Ltd., Callable, 4.55%, 2041/11/15 3,014,000 3,040,089 3,149,624 Union Gas Ltd., Callable, 4.88%, 2041/06/21 1,969,000 1,957,207 2,281,804 Veresen Inc., Callable, 3.95%, 2017/03/14 4,150,000 4,306,780 4,169,564 Videotron Ltd., Callable, 6.88%, 2021/07/15 2,800,000 3,096,800 2,904,125
437,380,329 439,491,781
Municipal Bonds (1.53%) Aéroports de Montréal, Series ‘I’, Callable, 5.47%, 2040/04/16 2,415,000 2,782,524 3,096,862 City of Toronto, 3.25%, 2046/06/24 2,250,000 2,248,650 2,099,604 Greater Toronto Airports Authority, Callable, 4.53%, 2041/12/02 2,365,000 2,468,206 2,714,679
7,499,380 7,911,145
Mortgage Backed Securities (0.82%) SP L.P. and SP1 L.P., Restricted, 3.21%, 2019/06/15 4,170,463 4,262,146 4,251,714
Provincial Bonds (0.57%) Province of Ontario, 2.90%, 2046/12/02 3,154,000 3,059,580 2,956,141
Government Bonds (0.46%) Government of Canada, 2.25%, 2025/06/01 2,250,000 2,343,802 2,359,377
TOTAL CANADIAN FIXED INCOME SECURITIES 454,545,237 456,970,158
U.S. FIXED INCOME SECURITIES (8.63%)Corporate Bonds (8.63%) Ally Financial Inc., 3.25%, 2018/02/13 2,250,000 2,809,847 3,043,620 AT&T Inc., Series ‘Maple’, Restricted, 3.83%, 2020/11/25 4,320,000 4,320,000 4,555,310 Bank of America Corp., 3.23%, 2022/06/22 2,500,000 2,560,700 2,571,670
Par Value/ Average FairSecurity Contracts Cost Value
Schedule of Investments (continued)As at December 31, 2016
Horizons Active Corporate Bond ETF
92964 - Horizons HAB.indd 24 2017-03-06 8:29 AM

25
Schedule of Investments (continued)As at December 31, 2016
Par Value/ Average FairSecurity Contracts Cost Value
Citigroup Inc., 3.39%, 2021/11/18 4,540,000 4,538,865 4,732,269 Great-West Lifeco Finance (Delaware) L.P. II, Variable Rate, Callable, 7.13%, 2068/06/26 3,275,000 3,753,717 3,507,757 ILFC E-Capital Trust I, Variable Rate, Callable, 4.67%, 2065/12/21 3,500,000 3,719,857 4,135,362 JPMorgan Chase & Co., 3.19%, 2021/03/05 2,255,000 2,370,681 2,342,785 Manulife Finance Delaware L.P., Variable Rate, Callable, 5.06%, 2041/12/15 2,600,000 2,193,111 2,754,780 Merrill Lynch & Co. Inc., Variable Rate, Callable, 5.29%, 2022/05/30 1,950,000 1,842,750 1,923,263 Molson Coors International L.P., Series ‘Maple’ Callable, 2.84%, 2023/07/15 5,355,000 5,353,983 5,307,876 Northgroup Preferred Capital Corp., Variable Rate, Callable, 6.38%, 2049/01/29 2,800,000 3,223,680 3,750,021 Wells Fargo & Co., 2.51%, 2023/10/27 1,915,000 1,915,000 1,881,698 Wells Fargo & Co., Series ‘O’, Restricted, 3.87%, 2025/05/21 4,050,000 4,050,000 4,160,322
42,652,191 44,666,733
TOTAL U.S. FIXED INCOME SECURITIES 42,652,191 44,666,733
GLOBAL FIXED INCOME SECURITIES (2.22%)Corporate Bonds (2.22%) Brookfield Infrastructure Partners L.P., 3.46%, 2017/10/10 4,290,000 4,322,316 4,349,202 Heathrow Funding Ltd., 3.00%, 2021/06/17 1,560,000 1,548,113 1,605,973 HSBC Holdings PLC, Variable Rate, Perpetual, 6.88%, 2021/06/01 3,880,000 5,122,235 5,509,027
10,992,664 11,464,202
TOTAL GLOBAL FIXED INCOME SECURITIES 10,992,664 11,464,202
DERIVATIVES (-0.07%)Currency Forwards (-0.07%) Currency forward contract to buy C$16,019,565 for US$12,220,000 maturing March 15, 2017 – (374,054)
TOTAL DERIVATIVES – (374,054)
TOTAL INVESTMENT PORTFOLIO (99.11%) $ 508,190,092 $ 512,727,039
Cash and cash equivalents (0.46%) 2,366,880 Margin deposits (0.00%) 499 Other assets less liabilities (0.43%) 2,253,814
TOTAL NET ASSETS (100.00%) $ 517,348,232
(See accompanying notes to financial statements)
Horizons Active Corporate Bond ETF
92964 - Horizons HAB.indd 25 2017-03-06 8:29 AM

26
Notes to Financial StatementsFor the Years Ended December 31, 2016 and 2015
1. REPORTING ENTITY
Horizons Active Corporate Bond ETF (“Horizons HAB” or the “ETF”) is an investment trust established under the laws of the Province of Ontario by Declaration of Trust and effectively began operations on July 14, 2010. The address of the ETF’s registered office is: c/o AlphaPro Management Inc., 26 Wellington Street East, Suite 700, Toronto, Ontario, M5E 1S2.
The ETF is offered for sale on a continuous basis by its prospectus in both class E units (“Class E”) and advisor class units (“Advisor Class”) which trade on the Toronto Stock Exchange (“TSX”) under the symbols HAB and HAB.A, respectively. Advisors are directly compensated with a service fee on a trailing quarterly basis (the “Service Fee”). The only difference between the Advisor Class and existing Class E units of the ETF is that the Advisor Class charges higher management fees that include the Service Fees paid to the advisor (see note 10). The purchase and sale process for the Advisor Class units is identical to that of any other ETF listed on the TSX. An investor may buy or sell units of the ETF on the TSX only through a registered broker or dealer in the province or territory where the investor resides. Investors are able to trade units of the ETF in the same way as other securities traded on the TSX, including by using market orders and limit orders and may incur customary brokerage commissions when buying or selling units.
The investment objective of Horizons HAB is to seek long-term moderate capital growth and generate high income. Ho-rizons HAB invests primarily in a portfolio of debt securities of Canadian and U.S. companies, directly, or through invest-ments in securities of other investment funds, including exchange traded funds. Horizons HAB, to the best of its ability, seeks to hedge its non-Canadian dollar currency exposure to the Canadian dollar at all times.
AlphaPro Management Inc. (“AlphaPro” or the “Manager”) is the manager and trustee of the ETF. The Manager has ap-pointed Horizons ETFs Management (Canada) Inc. (“Horizons Management” or the “Investment Manager”), an affiliate of the Manager, to act as the investment manager to the ETF.
The Investment Manager is responsible for implementing the ETF’s investment strategies and for engaging the services of Fiera Capital Corporation (“Fiera” or the “Sub-Advisor”), to act as the sub-advisor to the ETF. The Manager and Investment Manager are both members of the Mirae Asset Financial Group (“Mirae Asset”).
Termination of Advisor Class Units
On December 29, 2016, the Manager announced that it plans to eliminate the Advisor Class units of the ETF. As of January 31, 2017, investment professionals will no longer be able to purchase Advisor Class units on behalf of their clients and this class of units is expected to be fully eliminated by the end of April, 2017.
2. BASIS OF PREPARATION
(i) Statement of compliance
These financial statements have been prepared in accordance with International Financial Reporting Standards (“IFRS”). Any mention of total net assets, net assets, net asset value or increase (decrease) in net assets is referring to net assets or increase (decrease) in net assets attributable to holders of redeemable units as reported under IFRS.
These financial statements were authorized for issue on March 15, 2017 by the Board of Directors of the Manager.
(ii) Basis of measurement
The financial statements have been prepared on the historical cost basis except for financial instruments at fair value though profit or loss, which are measured at fair value.
Horizons Active Corporate Bond ETF
92964 - Horizons HAB.indd 26 2017-03-06 8:29 AM

27
Notes to Financial Statements (continued)For the Years Ended December 31, 2016 and 2015
(iii) Functional and presentation currency
These financial statements are presented in Canadian dollars, which is the ETF’s functional currency.
3. SIGNIFICANT ACCOUNTING POLICIES
The accounting policies set out below have been applied consistently to all periods presented in these financial statements.
(a) Financial instruments
(i) Recognition, initial measurement and classification
Financial assets and financial liabilities at fair value through profit or loss (“FVTPL”) are initially recognized on the trade date, at fair value (see below), with transaction costs recognized in the statements of comprehensive income. Other finan-cial assets and financial liabilities are recognized on the date on which they are originated at fair value.
The ETF classifies financial assets and financial liabilities into the following categories:
• Financial assets at fair value through profit or loss:
- Held for trading: derivative financial instruments
- Designated as at fair value through profit or loss: debt securities and equity investments
• Financial assets at amortized cost: All other financial assets are classified as loans and receivables
• Financial liabilities at fair value through profit or loss:
- Held for trading: derivative financial instruments
• Financial liabilities at amortized cost: all other financial liabilities are classified as other financial liabilities
(ii) Fair value measurement
Fair value is the price that would be received to sell an asset or paid to transfer a liability in an orderly transaction be-tween market participants at the measurement date in the principal or, in its absence, the most advantageous market to which the ETF has access at that date. The fair value of a liability reflects its non-performance risk.
Investments are valued at fair value as of the close of business on each day upon which a session of the TSX is held (“Valu-ation Date”) and based on external pricing sources to the extent possible. Investments held that are traded in an active market through recognized public stock exchanges, over-the-counter markets, or through recognized investment deal-ers, are valued at their closing sale price. However, such prices may be adjusted if a more accurate value can be obtained from recent trading activity or by incorporating other relevant information that may not have been reflected in pricing obtained from external sources. Short-term investments, including notes and money market instruments, are valued at amortized cost which approximates fair value.
Investments held that are not traded in an active market, including some derivative financial instruments, are valued us-ing observable market inputs where possible, on such basis and in such manner as established by the Manager. Deriva-tive financial instruments are recorded in the statements of financial position according to the gain or loss that would be realized if the contracts were closed out on the Valuation Date. Margin deposits, if any, are included in the schedule of investments as margin deposits. See also the summary of fair value measurements in note 7.
Horizons Active Corporate Bond ETF
92964 - Horizons HAB.indd 27 2017-03-06 8:29 AM

28
Notes to Financial Statements (continued)For the Years Ended December 31, 2016 and 2015
Fair value policies used for financial reporting purposes are the same as those used to measure the net asset value (“NAV”) for transactions with unitholders.
The fair value of other financial assets and liabilities approximates their carrying values due to the short-term nature of these instruments.
(iii) Offsetting
Financial assets and liabilities are offset and the net amount presented in the statements of financial position when there is a legally enforceable right to offset the recognized amounts and there is an intention to settle on a net basis, or to real-ize the asset and settle the liability simultaneously.
Income and expenses are presented on a net basis for gains and losses from financial instruments at fair value through profit or loss and foreign exchange gains and losses.
(iv) Specific instruments
Cash and cash equivalents
Cash and cash equivalents consist of cash on deposit and short-term, interest bearing notes with a term to maturity of less than three months from the date of purchase.
Forward foreign exchange contracts
Forward foreign exchange contracts, if any, are valued at the current market value thereof on the Valuation Date. The val-ue of these forward contracts is the gain or loss that would be realized if, on the Valuation Date, the positions were to be closed out and recorded as derivative assets and/or liabilities in the statements of financial position and as a net change in unrealized appreciation (depreciation) of investments and derivatives in the statements of comprehensive income. When the forward contracts are closed out or mature, realized gains or losses on forward contracts are recognized and are included in the statements of comprehensive income in net realized gain (loss) on sale of investments and derivatives. The Canadian dollar value of forward foreign exchange contracts is determined using forward currency exchange rates supplied by an independent service provider.
Redeemable units
The redeemable units are measured at the present value of the redemption amounts and are considered a residual amount of the net assets attributable to holders of redeemable units. They are classified as financial liabilities as a result of the ETF’s requirement to distribute net income and capital gains to unitholders and because the ETF has multiple classes of units with different features, as described in note 10.
(b) Investment income
Investment transactions are accounted for as of the trade date. Realized gains and losses from investment transactions are calculated on a weighted average cost basis. The difference between fair value and average cost, as recorded in the financial statements, is included in the statements of comprehensive income as part of the net change in unrealized ap-preciation (depreciation) of investments and derivatives. Interest income for distribution purposes from investments in bonds and short-term investments represents the coupon interest received by the ETF accounted for on an accrual basis.
Horizons Active Corporate Bond ETF
92964 - Horizons HAB.indd 28 2017-03-06 8:29 AM

29
The ETF does not amortize premiums paid or discounts received on the purchase of fixed income securities. The ETF does not use the effective interest method. Dividend income is recognized on the ex-dividend date. Distribution income from investments in other funds or ETFs is recognized when earned.
Income from derivatives is shown in the statements of comprehensive income as net realized gain (loss) on sale of invest-ments and derivatives; net change in unrealized appreciation (depreciation) of investments and derivatives; and, interest income for distribution purposes, in accordance with its nature.
Income from securities lending, if any, is included in “Securities lending income” on the statements of comprehensive income and is recognized when earned. Any securities on loan continue to be displayed in the schedule of investments and the market value of the securities loaned and collateral held is determined daily (see note 8).
If the ETF incurs withholding taxes imposed by certain countries on investment income and capital gains, such income and gains are recorded on a gross basis and the related withholding taxes are shown as a separate expense in the state-ments of comprehensive income.
(c) Foreign currency
Transactions in foreign currencies are translated into the ETF’s reporting currency using the exchange rate prevailing on the trade date. Monetary assets and liabilities denominated in foreign currencies at the reporting date are translated at the year-end exchange rate. Foreign exchange gains and losses are presented as “Net realized gain (loss) on foreign exchange”, except for those arising from financial instruments at fair value through profit or loss, which are recognized as a component within “Net realized gain (loss) on sale of investments and derivatives” and “Net change in unrealized appre-ciation (depreciation) of investments and derivatives” in the statements of comprehensive income.
(d) Cost basis
The cost of portfolio investments is determined on an average cost basis.
(e) Increase (decrease) in net assets attributable to holders of redeemable units per unit
The increase (decrease) in net assets per unit by class in the statements of comprehensive income represents the change in net assets attributable to holders of redeemable units from operations attributable to each class divided by the weighted average number of units of that class outstanding during the reporting year. Income, expenses other than management fees, and realized and unrealized capital gains (losses) are distributed amongst the different classes of units in proportion to the amount invested in them. For management fees please refer to note 10.
(f) Unitholder transactions
The value at which units are issued or redeemed is determined by dividing the net asset value of the class by the total number of units outstanding of that class on the Valuation Date. Amounts received on the issuance of units and amounts paid on the redemption of units are included in the statements of changes in financial position.
(g) Amounts receivable (payable) relating to portfolio assets sold (purchased)
In accordance with the ETF’s policy of trade date accounting for sale and purchase transactions, sales/purchase transac-tions awaiting settlement represent amounts receivable/payable for securities sold/purchased, but not yet settled as at the reporting date.
Horizons Active Corporate Bond ETF
Notes to Financial Statements (continued)For the Years Ended December 31, 2016 and 2015
92964 - Horizons HAB.indd 29 2017-03-06 8:29 AM

30
(h) Net assets attributable to holders of redeemable units per unit
Net assets attributable to holders of redeemable units per unit is calculated for each class of units of the ETF by taking the respective class’ proportionate share of the ETF’s net assets attributable to holders of redeemable units and dividing by the number of units of that class outstanding on the Valuation Date.
(i) Transaction costs
Transaction costs are incremental costs that are directly attributable to the acquisition, issue or disposal of an investment, which include fees and commissions paid to agents, advisors, brokers and dealers, levies by regulatory agencies and secu-rities exchanges, and transfer taxes and duties. Transaction costs are expensed and are included in “Transaction costs” in the statements of comprehensive income.
(j) Future accounting changes
The International Accounting Standards Board (“IASB”) has issued the following new standards and amendments to exist-ing standards that are not yet effective.
IFRS 9, Financial Instruments (“IFRS 9”):
In July 2014, the IASB issued IFRS 9, Financial Instruments, to replace International Accounting Standard 39, Financial In-struments – Recognition and Measurement (“IAS 39”). IFRS 9 addresses classification and measurement, impairment and hedge accounting.
The new standard requires assets to be classified based on the ETF’s business model for managing the financial assets and contractual cash flow characteristics of the financial assets. Financial assets will be measured at fair value through profit and loss unless certain conditions are met which permit measurement at amortized cost or value through other compre-hensive income.
The classification and measurement of liabilities remain generally unchanged, with the exception of liabilities recorded at fair value through profit and loss. For financial liabilities designated at fair value through profit and loss, IFRS 9 requires the presentation of the effects of changes in the ETF’s own credit risk in other comprehensive income instead of net income.
IFRS 9 is effective for fiscal years beginning on January 1, 2018, though early adoption is permitted. The Manager is cur-rently assessing the impact of this new standard on the ETF’s financial statements.
4. CRITICAL ACCOUNTING ESTIMATES AND JUDGEMENTS
In preparing these financial statements, the Manager has made judgements, estimates and assumptions that affect the application of accounting policies and the reported amounts of assets, liabilities, income and expenses. Actual results may differ from these estimates. Estimates and underlying assumptions are reviewed on an ongoing basis. Revisions to estimates are recognized prospectively.
The ETF may hold financial instruments that are not quoted in active markets, including derivatives. The determination of the fair value of these instruments is the area with the most significant accounting judgements and estimates that the ETF has made in preparing the financial statements. See note 7 for more information on the fair value measurement of the ETF’s financial instruments.
Horizons Active Corporate Bond ETF
Notes to Financial Statements (continued)For the Years Ended December 31, 2016 and 2015
92964 - Horizons HAB.indd 30 2017-03-06 8:29 AM
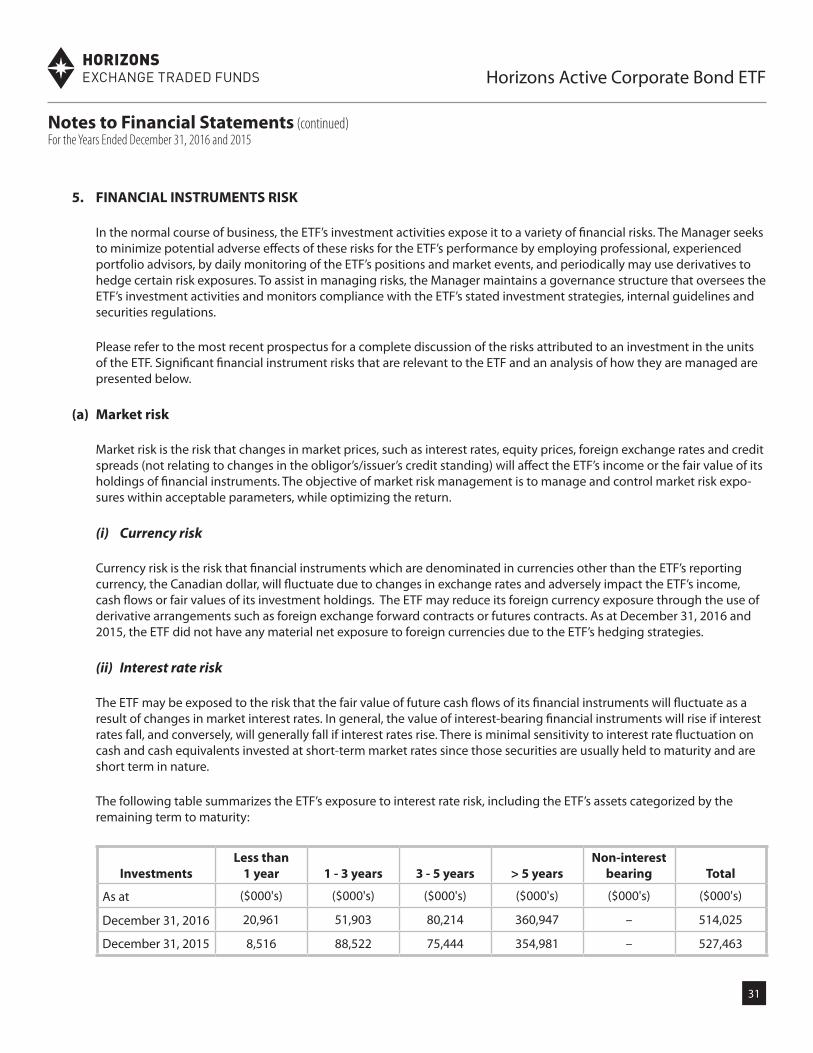
31
5. FINANCIAL INSTRUMENTS RISK
In the normal course of business, the ETF’s investment activities expose it to a variety of financial risks. The Manager seeks to minimize potential adverse effects of these risks for the ETF’s performance by employing professional, experienced portfolio advisors, by daily monitoring of the ETF’s positions and market events, and periodically may use derivatives to hedge certain risk exposures. To assist in managing risks, the Manager maintains a governance structure that oversees the ETF’s investment activities and monitors compliance with the ETF’s stated investment strategies, internal guidelines and securities regulations.
Please refer to the most recent prospectus for a complete discussion of the risks attributed to an investment in the units of the ETF. Significant financial instrument risks that are relevant to the ETF and an analysis of how they are managed are presented below.
(a) Market risk
Market risk is the risk that changes in market prices, such as interest rates, equity prices, foreign exchange rates and credit spreads (not relating to changes in the obligor’s/issuer’s credit standing) will affect the ETF’s income or the fair value of its holdings of financial instruments. The objective of market risk management is to manage and control market risk expo-sures within acceptable parameters, while optimizing the return.
(i) Currency risk
Currency risk is the risk that financial instruments which are denominated in currencies other than the ETF’s reporting currency, the Canadian dollar, will fluctuate due to changes in exchange rates and adversely impact the ETF’s income, cash flows or fair values of its investment holdings. The ETF may reduce its foreign currency exposure through the use of derivative arrangements such as foreign exchange forward contracts or futures contracts. As at December 31, 2016 and 2015, the ETF did not have any material net exposure to foreign currencies due to the ETF’s hedging strategies.
(ii) Interest rate risk
The ETF may be exposed to the risk that the fair value of future cash flows of its financial instruments will fluctuate as a result of changes in market interest rates. In general, the value of interest-bearing financial instruments will rise if interest rates fall, and conversely, will generally fall if interest rates rise. There is minimal sensitivity to interest rate fluctuation on cash and cash equivalents invested at short-term market rates since those securities are usually held to maturity and are short term in nature.
The following table summarizes the ETF’s exposure to interest rate risk, including the ETF’s assets categorized by the remaining term to maturity:
InvestmentsLess than
1 year 1 - 3 years 3 - 5 years > 5 yearsNon-interest
bearing Total
As at ($000's) ($000's) ($000's) ($000's) ($000's) ($000's)
December 31, 2016 20,961 51,903 80,214 360,947 – 514,025
December 31, 2015 8,516 88,522 75,444 354,981 – 527,463
Horizons Active Corporate Bond ETF
Notes to Financial Statements (continued)For the Years Ended December 31, 2016 and 2015
92964 - Horizons HAB.indd 31 2017-03-06 8:29 AM

32
The percentage of the ETF’s net assets exposed to interest rate risk as at December 31, 2016 was 99.4% (December 31, 2015 – 99.2%). The amount by which the net assets of the ETF would have increased or decreased, as at December 31, 2016, had the prevailing interest rates been lowered or raised by 1%, assuming a parallel shift in the yield curve, with all other variables remaining constant, was $30,914,961 (December 31, 2015 – $31,162,909). The ETF’s interest rate sensitivity was determined based on portfolio weighted duration. In practice, actual results may differ from this sensitivity analysis.
(iii) Other market risk
Other market risk is the risk that the value of financial instruments will fluctuate as a result of changes in market prices (other than those arising from interest rate risk or currency risk), whether caused by factors specific to an individual investment, its issuer, or all factors affecting all instruments traded in a market or market segment. The Manager has im-posed internal risk management controls on the ETF which are intended to limit the loss on its trading activities.
The table below shows the estimated impact on the ETF of a 1% increase or decrease in a broad-based market index, based on historical correlation, with all other factors remaining constant, as at the dates shown. In practice, actual results may differ from this sensitivity analysis and the difference could be material. The historical correlation may not be repre-sentative of future correlation.
Comparative Index December 31, 2016 December 31, 2015
BofA Merrill Lynch Canada Corporate Bond Index $4,581,137 $4,701,977
(b) Credit risk
Credit risk on financial instruments is the risk of a financial loss occurring as a result of the default of a counterparty on its obligation to the ETF. It arises principally from debt securities held, and also from derivative financial assets, cash and cash equivalents, and other receivables. The ETF’s maximum credit risk exposure as at the reporting date is represented by the respective carrying amounts of the financial assets in the statements of financial position. The ETF’s credit risk policy is to minimise its exposure to counterparties with perceived higher risk of default by dealing only with counterparties that meet the credit standards set out in the ETF’s prospectus and by taking collateral.
Analysis of credit quality
The ETF’s credit risk exposure by designated rating of the invested portfolio as at December 31, 2016 and 2015 is listed as follows:
Debt or Derivative Securities by Credit Rating Percentage of Net Asset Value (%)
December 31, 2016 December 31, 2015
AAA 0.8% 1.6%
AA 4.9% 5.8%
A 37.2% 38.2%
BBB 52.2% 50.7%
BB 4.3% 2.1%
B – 0.8%
Total 99.4% 99.2%
Horizons Active Corporate Bond ETF
Notes to Financial Statements (continued)For the Years Ended December 31, 2016 and 2015
92964 - Horizons HAB.indd 32 2017-03-06 8:29 AM

33
Designated ratings are obtained by Standard & Poor’s, Moody’s and/or Dominion Bond Rating Services. Where more than one rating is obtained for a security, the lowest rating has been used. Credit risk is managed by dealing with counterpar-ties the ETF believes to be creditworthy and by regular monitoring of credit exposures. The maximum exposure to any one debt issuer as of December 31, 2016 was 4.9% (December 31, 2015 – 4.4%) of the net assets of the ETF.
(c) Liquidity risk
Liquidity risk is the risk that the ETF will encounter difficulty in meeting the obligations associated with its financial liabili-ties that are settled by delivering cash or another financial asset. The ETF’s policy and the investment manager’s approach to managing liquidity is to ensure, as far as possible, that it will always have sufficient liquidity to meet its liabilities when due, under both normal and stress conditions, including estimated redemptions of shares, without incurring unaccept-able losses or risking damage to the ETF’s reputation. Liquidity risk is managed by investing the majority of the ETF’s as-sets in investments that are traded in an active market and can be readily disposed. The ETF aims to retain sufficient cash and cash equivalent positions to maintain liquidity; therefore, the liquidity risk for the ETF is considered minimal.
6. NET CHANGES FROM FINANCIAL INSTRUMENTS AT FAIR VALUE THROUGH PROFIT OR LOSS
Net changes in fair value on financial assets and financial liabilities at fair value through profit or loss presented in the table below are comprised of the following: net realized gain (loss) on sale of investments and derivatives, net change in unrealized appreciation (depreciation) of investments and derivatives, dividend income and interest income for distribution purposes. Their classifications between held for trading and designated at fair value are presented in the following table:
Net Changes at FVTPL ($)
Category December 31, 2016 December 31, 2015
Financial assets (liabilities) at FVTPL:
Held for trading 843,208 (3,104,986)
Designated at fair value 21,688,216 16,693,360
Total financial assets (liabilities) at FVTPL 22,531,424 13,588,374
7. FAIR VALUE MEASUREMENT
Below is a classification of fair value measurements of the ETF’s investments based on a three level fair value hierarchy and a reconciliation of transactions and transfers within that hierarchy. The hierarchy of fair valuation inputs is summa-rized as follows:
• Level 1: securities that are valued based on quoted prices in active markets.
• Level 2: securities that are valued based on inputs other than quoted prices that are observable, either directly as prices, or indirectly as derived from prices.
• Level 3: securities that are valued with significant unobservable market data.
Horizons Active Corporate Bond ETF
Notes to Financial Statements (continued)For the Years Ended December 31, 2016 and 2015
92964 - Horizons HAB.indd 33 2017-03-06 8:29 AM

34
Changes in valuation methods may result in transfers into or out of an investment’s assigned level. The following is a summary of the inputs used as at December 31, 2016 and 2015 in valuing the ETF’s investments and derivatives carried at fair values:
December 31, 2016 December 31, 2015
Level 1 ($) Level 2 ($) Level 3 ($) Level 1 ($) Level 2 ($) Level 3 ($)
Financial Assets
Bonds – 508,849,379 – – 514,535,988 –
Mortgage Backed Securities – 4,251,714 – – 4,410,956 –
Total Financial Assets – 513,101,093 – – 518,946,944 –
Financial Liabilities
Currency Forward Contracts – (374,054) – – (443,242) –
Total Financial Liabilities – (374,054) – – (443,242) –
Net Financial Assets and Liabilities – 512,727,039 – – 518,503,702 –
There were no significant transfers made between Levels 1 and 2 as a result of changes in the availability of quoted market prices or observable market inputs during the years shown. In addition, there were no investments or transactions classified in Level 3 for the years ended December 31, 2016 and 2015.
8. SECURITIES LENDING
In order to generate additional returns, the ETF is authorized to enter into securities lending agreements with borrowers deemed acceptable in accordance with National Instrument 81-102 – Investment Funds (“NI 81-102”). Under a securities lending agreement, the borrower must pay the ETF a negotiated securities lending fee, provide compensation to the ETF equal to any distributions received by the borrower on the securities borrowed, and the ETF must receive an acceptable form of collateral in excess of the value of the securities loaned. Although such collateral is marked to market, the ETF may be exposed to the risk of loss should a borrower default on its obligations to return the borrowed securities and the collat-eral is insufficient to reconstitute the portfolio of loaned securities. Revenue, if any, earned on securities lending transac-tions during the year is disclosed in the ETF’s statements of comprehensive income.
The aggregate closing market value of securities loaned and collateral received as at December 31, 2016 and 2015 was as follows:
As at Securities Loaned Collateral Received
December 31, 2016 $23,392,748 $24,584,700
December 31, 2015 $26,331,073 $27,699,492
Collateral may comprise, but is not limited to, cash and obligations of or guaranteed by the Government of Canada or a province thereof; by the United States government or its agencies; by some sovereign states; by permitted supranational agencies; and short-term debt of Canadian financial institutions, if, in each case, the evidence of indebtedness has a des- ignated rating as defined by NI 81-102.
Horizons Active Corporate Bond ETF
Notes to Financial Statements (continued)For the Years Ended December 31, 2016 and 2015
92964 - Horizons HAB.indd 34 2017-03-06 8:29 AM

35
The table below presents a reconciliation of the securities lending income as presented in the statements of comprehen-sive income for the years ended December 31, 2016 and 2015. It shows the gross amount of securities lending revenues generated from the securities lending transactions of the ETF, less any taxes withheld and amounts earned by parties entitled to receive payments out of the gross amount as part of any securities lending agreements.
For the years endedDecember 31,
2016% of Gross
IncomeDecember 31,
2015% of Gross
Income
Gross securities lending income $97,955 $67,797
Withholding taxes (25,246) 25.78% (13,907) 20.51%
Lending Agents’ fees:
Canadian Imperial Bank of Commerce (21,809) 22.26% (16,163) 23.84%
Net securities lending income paid to the ETF $50,900 51.96% $37,727 55.65%
9. REDEEMABLE UNITS
The ETF is authorized to issue an unlimited number of redeemable, transferable Class E units and Advisor Class units each of which represents an equal, undivided interest in the net assets of the ETF. Each unit entitles the owner to one vote at meetings of unitholders. Each unit is entitled to participate equally with all other units with respect to all payments made to unitholders, other than management fee distributions, whether by way of income or capital distributions and, on liq-uidation, to participate equally in the net assets of the ETF remaining after satisfaction of any outstanding liabilities that are attributable to units of that class of the ETF. All units will be fully paid and non-assessable, with no liability for future assessments, when issued and will not be transferable except by operation of law.
On December 29, 2016, the Manager announced that it plans to eliminate the Advisor Class units of the ETF. As of January 31, 2017, investment professionals will no longer be able to purchase Advisor Class units on behalf of their clients and this class of units is expected to be fully eliminated by the end of April, 2017.
The redeemable units issued by the ETF provide an investor with the right to require redemption for cash at a value proportionate to the investor’s share in the ETF’s net assets at each redemption date. They are classified as liabilities as a result of the ETF’s requirement to distribute net income and capital gains to unitholders and because the ETF has multiple classes of units with different features, as described in note 10. The ETF’s objectives in managing the redeemable units are to meet the ETF’s investment objective, and to manage liquidity risk arising from redemptions. The ETF’s management of liquidity risk arising from redeemable units is discussed in note 5.
On any trading day, which is defined as the day that a net asset value of the ETF is being struck, unitholders of the ETF may (i) redeem units of the ETF for cash at a redemption price per unit equal to 95% of the closing price for units of the ETF on the TSX on the effective day of the redemption, where the units being redeemed are not equal to a prescribed number of units (“PNU”) or a multiple PNU; (ii) redeem, less any applicable redemption charge as determined by the Manager in its sole discretion from time to time, a PNU or a multiple PNU of the ETF for cash equal to the net asset value of that number of units; or (iii) redeem units of the ETF for cash at a redemption price equal to the net asset value of the ETF if the redemption is made pursuant to a systematic withdrawal plan by a distribution reinvestment plan participant.
Units of the ETF are issued or redeemed on a daily basis at the net asset value per security that is determined as at 4:00 p.m. (Eastern Time) each business day. Purchase and redemption orders are subject to a 9:30 a.m. (Eastern Time) cut-off time.
Horizons Active Corporate Bond ETF
Notes to Financial Statements (continued)For the Years Ended December 31, 2016 and 2015
92964 - Horizons HAB.indd 35 2017-03-06 8:29 AM

36
The ETF is required to distribute any net income and capital gains that it has earned in the year. Income earned by the ETF is distributed to unitholders at least once per year, if necessary, and these distributions are either paid in cash or rein-vested by unitholders into additional units of the ETF. Net realized capital gains, if any, are typically distributed in Decem-ber of each year to unitholders. The annual capital gains distributions are not paid in cash but rather, are reinvested and reported as taxable distributions and used to increase each unitholder’s adjusted cost base for the ETF. Distributions paid to holders of redeemable units are recognized in the statements of changes in financial position.
Please consult the ETF’s most recent prospectus for a full description of the subscription, exchange and redemption fea-tures of the ETF’s units.
For the years ended December 31, 2016 and 2015, the number of units issued by subscription and/or distribution rein-vestment, the number of units redeemed, the total and average number of units outstanding was as follows:
Class of Units Year
Beginning Units
Outstanding Units
Issued Units
Redeemed
Ending Units
Outstanding
Average Units
Outstanding
Class E2016 49,547,344 1,232,469 (2,775,000) 48,004,813 48,297,388
2015 48,014,916 5,357,428 (3,825,000) 49,547,344 49,666,026
Advisor Class2016 300,000 25,000 – 325,000 307,036
2015 275,000 75,000 (50,000) 300,000 300,890
10. EXPENSES
Management fees
The Manager appoints the Investment Manager and provides, or oversees the provision of, administrative services re-quired by the ETF including, but not limited to: negotiating contracts with certain third-party service providers, such as portfolio managers, custodians, registrars, transfer agents, auditors and printers; authorizing the payment of operating expenses incurred on behalf of the ETF; arranging for the maintenance of accounting records for the ETF; preparing re-ports to unitholders and to the applicable securities regulatory authorities; calculating the amount and determining the frequency of distributions by the ETF; preparing financial statements, income tax returns and financial and accounting information as required by the ETF; ensuring that unitholders are provided with financial statements and other reports as are required from time to time by applicable law; ensuring that the ETF complies with all other regulatory requirements, including the continuous disclosure obligations of the ETF under applicable securities laws; administering purchases, redemptions and other transactions in units of the ETF; and dealing and communicating with unitholders of the ETF. The Manager provides office facilities and personnel to carry out these services, if not otherwise furnished by any other ser-vice provider to the ETF. The Manager also monitors the investment strategies of the ETF to ensure that the ETF complies with its investment objectives, investment strategies and investment restrictions and practices.
In consideration for the provision of these services, the Manager receives a monthly management fee at the annual rate of 0.50%, plus applicable sales taxes, of the net asset value of the ETF’s Class E units and 1.00%, plus applicable sales taxes, of the net asset value of the ETF’s Advisor Class units, calculated and accrued daily and payable monthly in arrears.
The Manager, and not the ETF, will pay to registered dealers a service fee equal to 0.50% per year of the net asset value of Advisor Class units held by clients of the registered dealer. No service fees are paid to registered dealers in respect of Class E units.
Horizons Active Corporate Bond ETF
Notes to Financial Statements (continued)For the Years Ended December 31, 2016 and 2015
92964 - Horizons HAB.indd 36 2017-03-06 8:29 AM

37
The Investment Manager and Sub-Advisor are compensated for their services out of the management fees without any further cost to the ETF. Any expenses of the ETF which are waived or absorbed by the Manager are paid out of the man-agement fees received by the Manager.
Other expenses
Unless otherwise waived or absorbed by the Manager, the ETF pays all of its operating expenses, including but not limited to: audit fees; trustee and custodial expenses; valuation, accounting and record keeping costs; legal expenses; permitted prospectus preparation and filing expenses; costs associated with delivering documents to unitholders; listing and annual stock exchange fees; index licensing fees, if applicable; CDS Clearing and Depository Services Inc. fees; bank related fees and interest charges; extraordinary expenses; unitholder reports and servicing costs; registrar and transfer agent fees; costs of the Independent Review Committee; income taxes; sales taxes; brokerage expenses and commissions; and withholding taxes.
The Manager, at its discretion, may waive and/or absorb a portion of the fees and/or expenses otherwise payable by the ETF. The waiving and/or absorption of such fees and/or expenses by the Manager may be terminated at any time, or con-tinued indefinitely, at the discretion of the Manager.
11. BROKER COMMISSIONS, SOFT DOLLARS AND RELATED PARTY TRANSACTIONS
An affiliate of National Bank of Canada (“NBC”) and National Bank Financial Inc. (“NBF”) holds an indirect minority interest in the Manager. NBF acts or may act as a designated broker, an underwriter and/or a registered trader (market maker). NBC, NBF and its affiliates may, at present or in the future, engage in business with the ETF, the issuers of securities mak-ing up the investment portfolio of the ETF, or with the Manager or any funds sponsored by the Manager or its affiliates, including by making loans, executing brokerage transactions, entering into derivative transactions or providing advisory or agency services.
Brokerage commissions paid on securities transactions may include amounts paid to related parties of the Manager for brokerage services provided to the ETF.
Research and system usage related services received in return for commissions generated with specific dealers are gener-ally referred to as soft dollars.
Total brokerage commissions paid to dealers in connection with investment portfolio transactions, soft dollar transac-tions incurred and amounts paid to related parties of the Manager for the years ended December 31, 2016 and 2015 were as follows:
Year Ended Brokerage Commissions Paid
Soft Dollar Transactions
Amount Paid to Related Parties
December 31, 2016 $nil $nil $nil
December 31, 2015 $3,287 $nil $nil
In addition to the information contained in the table above, the management fees paid to the Manager described in note 10 are related party transactions, as the Manager is considered to be a related party to the ETF. Fees paid to the Indepen-dent Review Committee are also considered to be related party transactions. Both the management fees and fees paid to the Independent Review Committee are disclosed in the statements of comprehensive income.
Horizons Active Corporate Bond ETF
Notes to Financial Statements (continued)For the Years Ended December 31, 2016 and 2015
92964 - Horizons HAB.indd 37 2017-03-06 8:29 AM

38
The ETF may invest in other ETFs managed by the Manager or its affiliates, in accordance with the ETF’s investment objec-tives and strategies. Such investments, if any, are disclosed in the schedule of investments.
12. COLLATERAL WITH FUTURES COMMISSION MERCHANTS
The ETF may maintain accounts with Futures Commission Merchants (“FCMs”) to conduct futures trading activities. The futures trading activities, where applicable, are typically, but not limited to, fixed income and currency futures for the purposes of hedging. The FCMs require the maintenance of minimum margin deposits. These requirements are met by the collateral from the ETF held at the FCMs. Collateral held with FCMs is included as part of “Margin deposits” in the state-ments of financial position. The collateral held with FCMs as at December 31, 2016 and 2015 is as follows:
As at Collateral held with FCMs
December 31, 2016 $499
December 31, 2015 $1,184,171
13. INCOME TAX
The ETF has qualified as a mutual fund trust under the Income Tax Act (Canada) (the “Tax Act”) and accordingly, is not taxed on the portion of taxable income that is paid or allocated to unitholders. As well, tax refunds (based on redemp-tions and realized and unrealized gains during the year) may be available that would make it possible to retain some net capital gains in the ETF without incurring any income taxes.
14. TAX LOSSES CARRIED FORWARD
Capital losses for income tax purposes may be carried forward indefinitely and applied against capital gains realized in future years. Non-capital losses carried forwards may be applied against future years’ taxable income. Non-capital losses that are realized in the current taxation year may be carried forward for 20 years. As at December 31, 2016, the ETF had no net capital or non-capital losses available.
15. OFFSETTING OF FINANCIAL INSTRUMENTS
In the normal course of business, the ETF may enter into various master netting arrangements or other similar agree-ments that do not meet the criteria for offsetting in the statements of financial position but still allow for the related amounts to be set off in certain circumstances, such as bankruptcy or termination of the contracts. The following table shows financial instruments that may be eligible for offset, if such conditions were to arise, as at December 31, 2016 and 2015. The “Net” column displays what the net impact would be on the ETF’s statements of financial position if all amounts were set-off.
Amounts Offset ($) Amounts Not Offset ($) Net ($)
Financial Assets and Liabilities as at December 31, 2016
Gross Assets
(Liabilities)
Gross Assets (Liabilities)
Offset
Net Amounts
Financial Instruments
Cash Collateral Pledged
Derivative assets – – – – – –
Derivative liabilities (374,054) – (374,054) – – (374,054)
Horizons Active Corporate Bond ETF
Notes to Financial Statements (continued)For the Years Ended December 31, 2016 and 2015
92964 - Horizons HAB.indd 38 2017-03-06 8:29 AM

39
Amounts Offset ($) Amounts Not Offset ($) Net ($)
Financial Assets and Liabilities as at December 31, 2015
Gross Assets
(Liabilities)
Gross Assets (Liabilities)
Offset
Net Amounts
Financial Instruments
Cash Collateral Pledged
Derivative assets – – – – – –
Derivative liabilities (443,242) – (443,242) – – (443,242)
16. INTERESTS IN SUBSIDIARIES, ASSOCIATES AND UNCONSOLIDATED STRUCTURED ENTITIES
The ETF may invest in units of other ETFs as part of its investment strategies (“Investee ETF(s)”). The nature and purpose of these Investee ETFs generally, is to manage assets on behalf of third party investors in accordance with their investment objectives, and are financed through the issue of units to investors.
In determining whether the ETF has control or significant influence over an Investee ETF, the ETF assesses voting rights, the exposure to variable returns, and its ability to use the voting rights to affect the amount of the returns. In instances where the ETF has control over an Investee ETF, the ETF qualifies as an investment entity under IFRS 10 - Consolidated Financial Statements, and therefore accounts for investments it controls at fair value through profit and loss. The ETF’s pri-mary purpose is defined by its investment objectives and uses the investment strategies available to it as defined in the ETF’s prospectus to meet those objectives. The ETF also measures and evaluates the performance of any Investee ETFs on a fair value basis.
Investee ETFs over which the ETF has control or significant influence are categorized as subsidiaries and associates, re-spectively. All other Investee ETFs are categorized as unconsolidated structured entities. Investee ETFs may be managed by the Manager, its affiliates, or by third-party managers.
Investments in Investee ETFs are susceptible to market price risk arising from uncertainty about future values of those Investee ETFs. The maximum exposure to loss from interests in Investee ETFs is equal to the total fair value of the invest-ment in those respective Investee ETFs at any given point in time. The fair value of Investee ETFs, if any, are disclosed in investments in the statements of financial position and listed in the schedule of investments.
As at December 31, 2016 and 2015, the ETF had no exposure to subsidiaries, associates or unconsolidated structured entities.
Horizons Active Corporate Bond ETF
Notes to Financial Statements (continued)For the Years Ended December 31, 2016 and 2015
92964 - Horizons HAB.indd 39 2017-03-06 8:29 AM

ALPHA BENCHMARK BETAPRO
ETF Solutions for every investorTM
Innovation is our capital. Make it yours.
sInnovation is our capital. Make it yours.
Horizons Exchange Traded Funds | 26 Wellington Street East, Suite 700 | Toronto, Ontario, M5E 1S2
T 416 933 5745 | TF 1 866 641 5739 | w horizonsetfs.com
ManagerAlphaPro Management Inc.26 Wellington Street East, Suite 700Toronto, OntarioM5E 1S2Tel: 416-933-5745Fax: 416-777-5181Toll Free: [email protected]
CustodianCIBC Mellon Trust Company320 Bay StreetP.O. Box 1Toronto, OntarioM5H 4A6
AuditorsKPMG LLPBay Adelaide Centre333 Bay Street, Suite 4600Toronto, OntarioM5H 2S5
Registrar and Transfer AgentCST Trust Company320 Bay StreetP.O. Box 1Toronto, OntarioM5H 4A6
92964 - Horizons HAB.indd 42 2017-03-06 8:29 AM