hope bay project€¦ · executive summary the hope bay socio-economic monitoring program (semp) is...
TRANSCRIPT
The business of sustainability
Hope Bay Project
2018 Socio-economic Monitoring Program
May 2019
Project No.: 0462113-0008

www.erm.com Version: D.1 Project No.: 0462113-0008 Client: TMAC Resources Inc. May 2019
May 2019
Hope Bay Project
2018 Socio-economic Monitoring Program
ERM Consultants Canada Ltd.
1111 West Hastings Street
15th Floor
Vancouver, British Columbia
Canada V6E 2J3
© Copyright 2019 by ERM Worldwide Group Ltd and/or its affiliates (“ERM”).
All rights reserved. No part of this work may be reproduced or transmitted in any form,
or by any means, without the prior written permission of ERM.

EXECUTIVE SUMMARY
The Hope Bay Socio-economic Monitoring Program (SEMP) is conducted annually in compliance with the revised Term and Condition No. 28 of the Amended Doris North Project Certificate No. 003 issued by the Nunavut Impact Review Board (NIRB).
The purpose of the SEMP is, among other things, to verify the accuracy of socio-economic impact predictions made in the Doris North Final Environmental Impact Assessment (FEIS) and Madrid-Boston FEIS and to determine the effectiveness of planned mitigation measures.
With revisions to the SEMP Plan, the SEMP report consists now of 60 socio-economic indicators. TMAC provided data for 42 indicators. The remaining community-level indicators required data from other sources, including the Government of Canada (GC), Government of Nunavut (GN), Nunavut Bureau Statistics (NBS), Nunavut Housing Corporation (NHC), Royal Canadian Mounted Police (RCMP), and Nunavut Arctic College (NAC).
KEY RESULTS FROM THE HOPE BAY SEMP FOR 2018 INCLUDE THE FOLLOWING:
ECONOMIC DEVELOPMENT
TMAC paid $9.8 million to the Kitikmeot Inuit Association (KIA), Nunavut Tunngavik Incorporated (NTI) and the Kitikmeot Corporation to promote the social, economic, and cultural well-being of Inuit in Nunavut.
TMAC paid $1.3 million to the GN in territorial taxes that support the provision of government programs and services.
CONTRACTING AND BUSINESS EXPENDITURES
The Project had a positive effect on business development in the Kitikmeot represented by an increase in the number of registered Inuit Firms and an increase in procurement from Inuit owned businesses.
$182.5 million in contracts awarded to businesses
$68.0 million in contracts awarded to Inuit owned businesses
EMPLOYMENT
TMAC and contractors hired up to 598 workers with an average workforce effort of 2,034 hours per worker.
PROJECT EMPLOYMENT SINCE 2014:
Up to 51 Kitikmeot Inuit (8% of total workforce)
and 14 Inuit from outside of the Kitikmeot (2% of total workforce) worked at the Project. Highest level of employment by community was the following:
Employee turnover rate for all Project employees falls within what would be expected for a project of this type.
TMAC will work towards hiring more women and increasing the number of hours worked by women as the Project advances.
0
100
200
300
400
500
600
700
Q1 Q2 Q3 Q4 Q1 Q2 Q3 Q4 Q1 Q2 Q3 Q4 Q1 Q2 Q3 Q4 Q1 Q2 Q3 Q4
2014 2015 2016 2017 2018
Average on Site (workers at any one time)
Total on Site (individual workers)
Cambridge Bay
Kugluktuk
Gjoa Haven
Kugaaruk
Taloyoak
8% • Women
3% • Inuit Women
24
11
9
8
6 EMPL
OYM
ENT
BY C
OM
MU
NIT
Y
Female participation in the workforce was relatively low.

EXECUTIVE SUMMARY (continued)
TMAC paid salaries totaling $22.0 million; of that, $1.9 million was paid to Inuit workers.
Inuit employees held a mix of unskilled, semi-skilled and skilled positions, while being underrepresented in professional and management positions.
By department, Inuit employees worked in site operations and site services, and to a lesser degree in exploration and underground mining.
TMAC provided 133 hours of general training to Inuit workers, 213.5 hours of health & safety related training, and 8,290 hours of work-related training.
EDUCATION AND TRAINING
TMAC spent an estimated $85,500 to support school-based initiatives including Career Awareness Sessions, High School Awards, and Mining Matters events.
To increase the understanding of Project employment opportunities, TMAC hosted five Community Information Sessions and five High School Information Sessions.
POPULATION DEMOGRAPHICS
TMAC employees did not migrate to the Kitikmeot region.
COMMUNITY INFRASTRUCTURE AND PUBLIC SERVICES
The demand for public housing continues to grow in the Kitikmeot. In 2018, the number of people on public housing waitlist significantly exceeded the number of available public housing:
There were no new approvals under the Nunavut Down Payment Assistance Program (NDAP) in 2018/19 in any of the communities. Housing status of Project employees is unknown; the housing status survey is to be developed in the coming year.
54%
135%119%
77%104%
CambridgeBay
Gjoa Haven Kugaaruk Kugluktuk Taloyoak
Public housing waitlist as a percentage of available housing stock
Project use of GN emergency services continues to be negligible with no utilization in 2018.
The demand for police services generally increased in Kitikmeot communities, with the exception of Taloyoak. In 2018, there were 4,688 police calls in the region:
INDIVIDUAL AND COMMUNITY HEALTH AND WELLNESS
Between October 2017 and September 2018, the Project reported 14 new counselling and life smart coaching cases.
Ten Inuit left TMAC employment, with five terminated by TMAC and five voluntary terminations. Reasons for leaving included an alternative employment opportunity in a home community, dissatisfaction with work hours, as well as family commitments or conflicts with lifestyle and rotational work.
Country foods were served to Project employees 20 times in 2018 and Inuit workers regularly utilized the Country Food Kitchen.
It does not appear that the Project increased the cost of food in the region as prices decreased in 2018 in Cambridge Bay, Gjoa Haven and Taloyoak:
1,545
838
343
1,380
5821%
10%
2%
24%
-5%-10%-5%0%5%10%15%20%25%30%
0
500
1,000
1,500
2,000
CambridgeBay
GjoaHaven
Kugaaruk Kugluktuk Taloyoak
Number of police calls in 2018Percent change from 2017 to 2018
-6%
6%
14%
-1%
-2%
2%
Taloyoak
Kugluktuk
Kugaaruk
Gjoa Haven
Cambridge Bay
Kitikmeot Average

www.erm.com Version: D.1 Project No.: 0462113-0008 Client: TMAC Resources Inc. May 2019 Page iii
HOPE BAY PROJECT 2018 Socio-economic Monitoring Program
ACKNOWLEDGEMENTS
ACKNOWLEDGEMENTS
This report was prepared for TMAC Resources Inc. (TMAC) by Klaudia Sieminska (BA, MA), Dr. Kent
Gustavson (B.Sc., M.Sc., Ph.D.) and Veronica Mauel (BA, MSEM) of ERM Consultants Canada Ltd.
(ERM). Project management was provided by Nicole Bishop (B.Sc.). Marc Wen (M.Sc., R.P.Bio.) was the
Partner in-Charge. The help and information provided by Alex Buchan, Julia Micks, Ikey Evalik and others
of TMAC is gratefully acknowledged. This report also benefited from comments provided by the Hope Bay
Socio economic Monitoring Working Group and the Kitikmeot Socio-economic Monitoring Committee.

www.erm.com Version: D.1 Project No.: 0462113-0008 Client: TMAC Resources Inc. May 2019 Page v
HOPE BAY PROJECT 2018 Socio-economic Monitoring Program
CONTENTS
CONTENTS
EXECUTIVE SUMMARY ............................................................................................................................... I
ACKNOWLEDGEMENTS ............................................................................................................................ III
ACRONYMS AND ABBREVIATIONS ........................................................................................................ XI
1. INTRODUCTION .............................................................................................................................. 1-1
1.1 Hope Bay Project Overview ............................................................................................................... 1-1
1.2 Description of Socio-economic Monitoring Program .......................................................................... 1-1
1.2.1 Compliance Requirements ............................................................................................... 1-1
1.2.1.1 Nunavut Land Claims Agreement ............................................................... 1-1
1.2.1.2 NIRB Project Certificate .............................................................................. 1-1
1.2.2 Kitikmeot Region Socio-economic Monitoring Committee ................................................ 1-4
1.2.3 Project Socio-economic Management and Mitigation....................................................... 1-5
1.2.3.1 Inuit Impact and Benefit Agreement Implementation Committee ................ 1-5
1.2.3.2 TMAC Social Responsibility ........................................................................ 1-5
1.3 Purpose of this Report ....................................................................................................................... 1-6
1.4 Structure of this Report ...................................................................................................................... 1-7
2. METHODS ........................................................................................................................................ 2-1
2.1 Indicators ........................................................................................................................................... 2-1
2.2 Data Analysis and Interpretation ........................................................................................................ 2-1
2.2.1 Quantitative Data ........................................................................................................... 2-11
2.2.2 Qualitative Information ................................................................................................... 2-11
2.2.3 Charts, Graphs, and Infographics .................................................................................. 2-11
2.2.4 Community Data Challenges .......................................................................................... 2-12
3. ECONOMIC DEVELOPMENT ......................................................................................................... 3-1
3.1 Growth of Revenues to Inuit Organizations ........................................................................................ 3-1
3.1.1 Predictions ....................................................................................................................... 3-1
3.1.2 Results ............................................................................................................................. 3-1
3.1.3 Interpretation .................................................................................................................... 3-1
3.2 Growth in Revenues to the Government of Nunavut .......................................................................... 3-1
3.2.1 Predictions ....................................................................................................................... 3-1
3.2.2 Results ............................................................................................................................. 3-1
3.2.3 Interpretation .................................................................................................................... 3-1
3.3 Growth in Mining Industry Expenditures ............................................................................................. 3-2
3.3.1 Predictions ....................................................................................................................... 3-2
3.3.2 Results ............................................................................................................................. 3-2
3.3.3 Interpretation .................................................................................................................... 3-2
3.4 Effects Management and Mitigation ................................................................................................... 3-2
4. CONTRACTING AND BUSINESS EXPENDITURES ..................................................................... 4-1
4.1 Procurement Expenditures ................................................................................................................. 4-1
4.1.1 Predictions ....................................................................................................................... 4-1

www.erm.com Version: D.1 Project No.: 0462113-0008 Client: TMAC Resources Inc. May 2019 Page vi
HOPE BAY PROJECT 2018 Socio-economic Monitoring Program
CONTENTS
4.1.2 Results ............................................................................................................................. 4-1
4.1.3 Interpretation .................................................................................................................... 4-1
4.2 Procurement from Nunavut Businesses ............................................................................................. 4-1
4.2.1 Predictions ....................................................................................................................... 4-1
4.2.2 Results ............................................................................................................................. 4-1
4.2.3 Interpretation .................................................................................................................... 4-1
4.3 Procurement from Kitikmeot Businesses ........................................................................................... 4-2
4.3.1 Predictions ....................................................................................................................... 4-2
4.3.2 Results ............................................................................................................................. 4-2
4.3.3 Interpretation .................................................................................................................... 4-2
4.4 Procurement from Inuit Firms ............................................................................................................. 4-2
4.4.1 Predictions ....................................................................................................................... 4-2
4.4.2 Results ............................................................................................................................. 4-2
4.4.3 Interpretation .................................................................................................................... 4-3
4.5 Business Development ...................................................................................................................... 4-3
4.5.1 Predictions ....................................................................................................................... 4-3
4.5.2 Results ............................................................................................................................. 4-3
4.5.3 Interpretation .................................................................................................................... 4-6
4.6 Effects Management and Mitigation ................................................................................................... 4-6
5. EMPLOYMENT ................................................................................................................................ 5-1
5.1 Overall Employment ........................................................................................................................... 5-1
5.1.1 Predictions ....................................................................................................................... 5-1
5.1.2 Results ............................................................................................................................. 5-1
5.1.3 Interpretation .................................................................................................................... 5-1
5.2 Inuit and Kitikmeot Employment ......................................................................................................... 5-3
5.2.1 Predictions ....................................................................................................................... 5-3
5.2.2 Results ............................................................................................................................. 5-3
5.2.3 Interpretation .................................................................................................................... 5-6
5.3 Gender Equity .................................................................................................................................... 5-6
5.3.1 Predictions ....................................................................................................................... 5-6
5.3.2 Results ............................................................................................................................. 5-6
5.3.3 Interpretation .................................................................................................................... 5-6
5.4 Employment Income .......................................................................................................................... 5-7
5.4.1 Predictions ....................................................................................................................... 5-7
5.4.2 Results ............................................................................................................................. 5-7
5.4.3 Interpretation .................................................................................................................... 5-7
5.5 Employee Retention ........................................................................................................................... 5-8
5.5.1 Predictions ....................................................................................................................... 5-8
5.5.2 Results ............................................................................................................................. 5-8
5.5.3 Interpretation .................................................................................................................... 5-8
5.6 Worker Health and Safety .................................................................................................................. 5-8
5.6.1 Predictions ....................................................................................................................... 5-8

www.erm.com Version: D.1 Project No.: 0462113-0008 Client: TMAC Resources Inc. May 2019 Page vii
HOPE BAY PROJECT 2018 Socio-economic Monitoring Program
CONTENTS
5.6.2 Results ............................................................................................................................. 5-8
5.6.3 Interpretation .................................................................................................................... 5-9
5.7 On-the-job Training ............................................................................................................................ 5-9
5.7.1 Predictions ....................................................................................................................... 5-9
5.7.2 Results ........................................................................................................................... 5-10
5.7.3 Interpretation .................................................................................................................. 5-11
5.8 Apprenticeships ................................................................................................................................ 5-12
5.8.1 Predictions ..................................................................................................................... 5-12
5.8.2 Results ........................................................................................................................... 5-12
5.8.3 Interpretation .................................................................................................................. 5-12
5.9 Skill Levels ....................................................................................................................................... 5-12
5.9.1 Predictions ..................................................................................................................... 5-12
5.9.2 Results ........................................................................................................................... 5-12
5.9.3 Interpretation .................................................................................................................. 5-13
5.10 Retention of Skilled Workers in Community Roles ........................................................................... 5-14
5.10.1 Predictions ..................................................................................................................... 5-14
5.10.2 Results ........................................................................................................................... 5-14
5.10.3 Interpretation .................................................................................................................. 5-14
5.11 Effects Management and Mitigation ................................................................................................. 5-15
6. EDUCATION AND TRAINING ......................................................................................................... 6-1
6.1 Availability of Post Secondary Education ........................................................................................... 6-1
6.1.1 Predictions ....................................................................................................................... 6-1
6.1.2 Results ............................................................................................................................. 6-1
6.1.3 Interpretation .................................................................................................................... 6-1
6.2 Participation in Post Secondary Education ........................................................................................ 6-1
6.2.1 Predictions ....................................................................................................................... 6-1
6.2.2 Results ............................................................................................................................. 6-1
6.2.3 Interpretation .................................................................................................................... 6-1
6.3 Investment in Education ..................................................................................................................... 6-1
6.3.1 Predictions ....................................................................................................................... 6-1
6.3.2 Results ............................................................................................................................. 6-2
6.3.3 Interpretation .................................................................................................................... 6-2
6.4 Understanding of Employment Opportunities ..................................................................................... 6-2
6.4.1 Predictions ....................................................................................................................... 6-2
6.4.2 Results ............................................................................................................................. 6-2
6.4.3 Interpretation .................................................................................................................... 6-2
6.5 High-School Participation ................................................................................................................... 6-3
6.5.1 Predictions ....................................................................................................................... 6-3
6.5.2 Results ............................................................................................................................. 6-3
6.5.3 Interpretation .................................................................................................................... 6-6
6.6 High School Completion ..................................................................................................................... 6-6
6.6.1 Predictions ....................................................................................................................... 6-6
www.erm.com Version: D.1 Project No.: 0462113-0008 Client: TMAC Resources Inc. May 2019 Page viii
HOPE BAY PROJECT 2018 Socio-economic Monitoring Program
CONTENTS
6.6.2 Results ............................................................................................................................. 6-6
6.6.3 Interpretation .................................................................................................................... 6-6
6.7 Effects Management and Mitigation ................................................................................................... 6-6
7. POPULATION DEMOGRAPHICS ................................................................................................... 7-1
7.1 Population Stability ............................................................................................................................. 7-1
7.1.1 Predictions ....................................................................................................................... 7-1
7.1.2 Results ............................................................................................................................. 7-1
7.1.3 Interpretation .................................................................................................................... 7-3
7.2 Effects Management and Mitigation ................................................................................................... 7-3
8. COMMUNITY INFRASTRUCTURE AND PUBLIC SERVICES ...................................................... 8-1
8.1 Housing Availability ............................................................................................................................ 8-1
8.1.1 Predictions ....................................................................................................................... 8-1
8.1.2 Results ............................................................................................................................. 8-1
8.1.3 Interpretation .................................................................................................................... 8-2
8.2 Housing Status ................................................................................................................................... 8-2
8.2.1 Predictions ....................................................................................................................... 8-2
8.2.2 Results ............................................................................................................................. 8-2
8.2.3 Interpretation .................................................................................................................... 8-2
8.3 Project Use of Emergency Services ................................................................................................... 8-2
8.3.1 Predictions ....................................................................................................................... 8-2
8.3.2 Results ............................................................................................................................. 8-2
8.3.3 Interpretation .................................................................................................................... 8-3
8.4 Demand for Health and Social Services ............................................................................................. 8-3
8.4.1 Predictions ....................................................................................................................... 8-3
8.4.2 Results ............................................................................................................................. 8-3
8.4.3 Interpretation .................................................................................................................... 8-5
8.5 Demand for Police Services ............................................................................................................... 8-5
8.5.1 Predictions ....................................................................................................................... 8-5
8.5.2 Results ............................................................................................................................. 8-7
8.5.3 Interpretation .................................................................................................................. 8-10
8.6 Effects Management and Mitigation ................................................................................................. 8-10
9. INDIVIDUAL AND COMMUNITY HEALTH AND WELLNESS ....................................................... 9-1
9.1 Work-life Balance ............................................................................................................................... 9-1
9.1.1 Predictions ....................................................................................................................... 9-1
9.1.2 Results ............................................................................................................................. 9-1
9.1.3 Interpretation .................................................................................................................... 9-1
9.2 Household Financial Management ..................................................................................................... 9-1
9.2.1 Predictions ....................................................................................................................... 9-1
9.2.2 Results ............................................................................................................................. 9-2
9.2.3 Interpretation .................................................................................................................... 9-2
9.3 Spending Decisions and Lifestyle Choices ........................................................................................ 9-2

www.erm.com Version: D.1 Project No.: 0462113-0008 Client: TMAC Resources Inc. May 2019 Page ix
HOPE BAY PROJECT 2018 Socio-economic Monitoring Program
CONTENTS
9.3.1 Predictions ....................................................................................................................... 9-2
9.3.2 Results ............................................................................................................................. 9-2
9.3.3 Interpretation .................................................................................................................... 9-5
9.4 Country Foods Consumption ............................................................................................................. 9-5
9.4.1 Predictions ....................................................................................................................... 9-5
9.4.2 Results ............................................................................................................................. 9-5
9.4.3 Interpretation .................................................................................................................... 9-8
9.5 Food Security ..................................................................................................................................... 9-8
9.5.1 Predictions ....................................................................................................................... 9-8
9.5.2 Results ............................................................................................................................. 9-8
9.5.3 Interpretation .................................................................................................................... 9-9
9.6 Household Economic Self-sufficiency ................................................................................................ 9-9
9.6.1 Predictions ....................................................................................................................... 9-9
9.6.2 Results ............................................................................................................................. 9-9
9.6.3 Interpretation .................................................................................................................. 9-10
9.7 Effects Management and Mitigation ................................................................................................. 9-10
10. CONCLUSIONS ............................................................................................................................. 10-1
10.1 Summary of Results ......................................................................................................................... 10-1
10.2 Management Response ................................................................................................................... 10-3
11. REFERENCES ............................................................................................................................... 11-1
APPENDIX A SUMMARY OF PROJECT ACTIVITIES, 2013 TO 2018
List of Tables
Table 1.1-1: Construction and Operation Schedule for the Hope Bay Project .................................................. 1-3
Table 2.1-1: Valued Socio-economic Components (VSECs) ............................................................................ 2-2
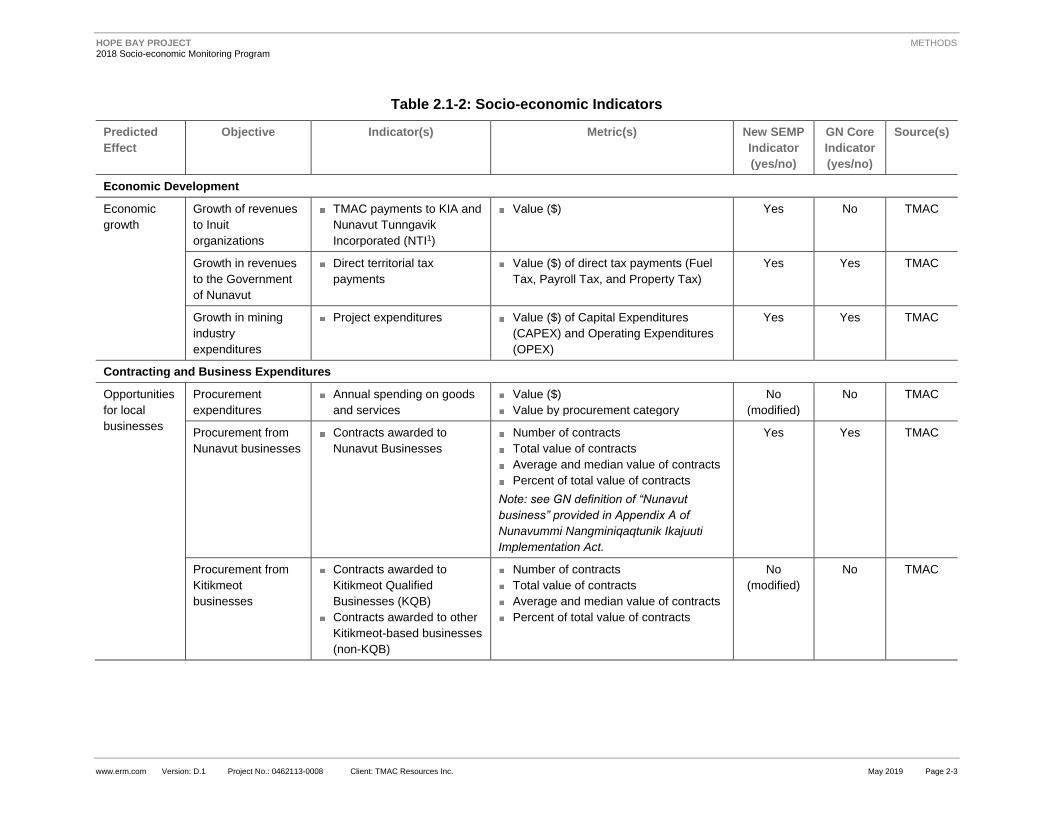
Table 2.1-2: Socio-economic Indicators ........................................................................................................... 2-3
Table 3.3-1: Project Expenditures (Millions Canadian Dollars) ......................................................................... 3-2
Table 3.4-1: Economic Development Management and Mitigation Measures .................................................. 3-3
Table 4.2-1: Contracts Awarded to Nunavut Businesses (Million Dollars), 2017 and 2018 .............................. 4-1
Table 4.3-1: Contracts Awarded to Kitikmeot Businesses (Million Dollars), 2017 and 2018 ............................. 4-2
Table 4.4-1: Contracts Awarded to Inuit Businesses (Million Dollars), 2017 and 2018 .................................... 4-3
Table 4.5-1: Profile of Registered Inuit Firms in the Kitikmeot Region, March 2018 ......................................... 4-4
Table 4.6-1: Contracting and Business Expenditures Management and Mitigation Measures ......................... 4-7
Table 5.1-1: Workforce Effort by Project Employees and Contractors, 2014 to 2018 ....................................... 5-1
Table 5.2-1: Project Workforce Effort (Employees and Contractors), 2015 to 2018 ......................................... 5-3
Table 5.3-1: Workforce Effort by Women, 2015 to 2017 .................................................................................. 5-6
Table 5.4-1: Total TMAC Payroll (Kitikmeot-based and On-site, million), 2015 to 2018 ................................... 5-7
Table 5.4-2: Total TMAC Payroll for Inuit Employees by Community, 2017 and 2018 ..................................... 5-7
Table 5.5-1: Turnover Rate for All Employees and for Inuit Employees, 2017 and 2018 ................................. 5-8

www.erm.com Version: D.1 Project No.: 0462113-0008 Client: TMAC Resources Inc. May 2019 Page x
HOPE BAY PROJECT 2018 Socio-economic Monitoring Program
CONTENTS
Table 5.6-1: Hope Bay Project Lost Time Incidences ....................................................................................... 5-9
Table 5.6-2: Hope Bay Project Injuries ............................................................................................................. 5-9
Table 5.7-1: On-the-job Training Courses, 2013 to 2017 ............................................................................... 5-10
Table 5.7-2: Training Delivered by TMAC to Non-Inuit Workers in 2018 ........................................................ 5-10
Table 5.7-3: Training Delivered by TMAC to Inuit Workers in 2018 ................................................................ 5-11
Table 5.9-1: Inuit Workers (Employees and Contractors) by Category, 2018 ................................................. 5-13
Table 5.9-2: Inuit Workers (Employees and Contractors) by Department, 2016, 2017, and 2018 .................. 5-14
Table 5.11-1: Employment Management and Mitigation Measures ................................................................ 5-15
Table 6.7-1: Education and Training Management and Mitigation Measures ................................................... 6-8
Table 7.2-1: Population Stability Management and Mitigation Measures ......................................................... 7-3
Table 8.1-1: Number of People on the Public Housing Waitlist – Total and as a Percentage of
Available Public Housing Stock .......................................................................................................... 8-1
Table 8.5-1: Police Calls for Services, 2010 to 2018 ........................................................................................ 8-7
Table 8.6-1: Infrastructure and Public Services Management and Mitigation Measures ................................ 8-11
Table 9.5-1: NFPS – Comparison of 24 Select Food Items Basket, 2014 to 2018 ........................................... 9-9
Table 9.7-1: Health and Wellness Management and Mitigation Measures ..................................................... 9-12
List of Figures
Figure 1.1-1: Hope Bay Project Location .......................................................................................................... 1-2
Figure 5.1-1: Number of Project Employees and Contractors, 2014 to 2018 ................................................... 5-2
Figure 5.2-1: Inuit and Kitikmeot Employment (Number of Workers), 2018...................................................... 5-4
Figure 5.2-2: Kitikmeot Workers by Community, 2018 ..................................................................................... 5-5
Figure 6.5-1: Public School Enrollment by Community, 2003 to 2017 .............................................................. 6-4
Figure 6.5-2: Kitikmeot Public School Enrollment by Grade, 2003 to 2017 ...................................................... 6-5
Figure 6.6-1: Secondary School Graduates by Community, 2001/02 to 2016/17 ............................................. 6-7
Figure 7.1-1: Population by Community and in the Kitikmeot Region (Estimate and Percentage
Change from Previous Year), 2001 to 2017 ....................................................................................... 7-2
Figure 8.4-1: Health Centre Visits by Community and Region (Total and per Capita), 2003 to 2016 ............... 8-4
Figure 8.4-2: Social Assistance Average Monthly Caseload by Community (Total and per
100,000 Persons), 2004 to 2017 ........................................................................................................ 8-6
Figure 8.5-1: Police Calls for Services (Total and per Capita), 2010 to 2018 ................................................... 8-8
Figure 8.5-2: Criminal Code Violations for the Kitikmeot Region and by Community (Total Number
and per 100,000 Persons), 2001 to 2017 ........................................................................................... 8-9
Figure 9.3-1: Sale of Alcoholic Beverages in Nunavut, 2004/05 to 2016/17 ..................................................... 9-3
Figure 9.3-2: Impaired Driving Criminal Violations (Total Number and per 100,000 Persons),
2001-2017 .......................................................................................................................................... 9-4
Figure 9.3-3: Drug-Related Criminal Violations (Total Number and per 100,000 Persons), 2001-2017 ........... 9-6
Figure 9.3-4: Assault-Related Criminal Violations (Total Number and per 100,000 Persons),
2001-2017 .......................................................................................................................................... 9-7
Figure 9.6-1: Low Income Families & Non-family Persons (Total and as a Percentage of All Families
and Non-Family Persons), 2004-2015 ............................................................................................. 9-11

www.erm.com Version: D.1 Project No.: 0462113-0008 Client: TMAC Resources Inc. May 2019 Page xi
HOPE BAY PROJECT 2018 Socio-economic Monitoring Program
ACRONYMS AND ABBREVIATIONS
ACRONYMS AND ABBREVIATIONS
the Belt The Hope Bay Belt
CAPEX Capital Expenditure
Care and
Maintenance
Project activities consisting of regular site and infrastructure maintenance, and
ongoing environmental monitoring to ensure a safe and stable condition.
Project development and operation activities are suspended.
CIRNAC Crown-Indigenous Relations and Northern Affairs Canada
CPA Chartered Professional Accountants
CPI Consumer Price Index
Doris Doris Project (also known as the Doris North Project in regulatory approvals
and permits)
EFAP Employee and Family Assistance Program
ERM ERM Consultants Canada Ltd.
FAI First Aid Injury
FEIS Final Environmental Impact Statement
GC Government of Canada
GN Government of Nunavut
HR Human Resources
HSLP Health Safety and Loss Prevention
IIBA Inuit Impact and Benefit Agreement
INAC Indigenous and Northern Affairs Canada (now CIRNAC)
Inuit Aboriginal peoples of northern Canada and Greenland. In the context of
Nunavut, those with status under the Nunavut Agreement.
IQ Inuit Qaujimajatuqangit
KIA Kitikmeot Inuit Association
KitSEMC Kitikmeot Socio-Economic Monitoring Committee
KQB Kitikmeot Qualified Businesses
MAI Medical Aid Injury
MMC Miramar Mining Corporation. The parent company that owned the Doris Project
prior to Hope Bay Mining Limited.
NAC Nunavut Arctic College
NAICS North American Industry Classification System
NBS Nunavut Bureau of Statistics
NDAP Nunavut Down Payment Assistance Program
NFPS Nunavut Food Price Survey

www.erm.com Version: D.1 Project No.: 0462113-0008 Client: TMAC Resources Inc. May 2019 Page xii
HOPE BAY PROJECT 2018 Socio-economic Monitoring Program
ACRONYMS AND ABBREVIATIONS
NHC Nunavut Housing Corporation
NIRB Nunavut Impact Review Board
Non-KQB Other Kitikmeot-based businesses
NTI Nunavut Tunngavik Incorporated
NWB Nunavut Water Board
Nunavummiut Residents of Nunavut
OPEX Operating Expenditures
Phase 2 (Madrid-
Boston) Project
Phase 2 represents the next stage of continued mining operations within the
Hope Bay Greenstone Belt, including mining at Madrid North, Madrid South and
Boston sites, supported by continued operations at Doris and Roberts Bay.
PME Personal Mobile Equipment
RCMP Royal Canadian Mounted Police
RWI Restricted Work Injury
SEMWG Socio-economic Monitoring Working Group
SEMC Socio-economic Monitoring Committee
SEMP Socio-economic Monitoring Program
the Project Hope Bay Project
TIA Tailings Impoundment Area
TMAC TMAC Resources Inc.
TPD Tonnes per day
VSEC Valued Socio-economic Component

www.erm.com Version: D.1 Project No.: 0462113-0008 Client: TMAC Resources Inc. May 2019 Page 1-1
HOPE BAY PROJECT 2018 Socio-economic Monitoring Program
INTRODUCTION
1. INTRODUCTION
1.1 Hope Bay Project Overview
TMAC Resources Inc. (TMAC) holds mineral claims, leases and one Inuit Mineral Exploration Agreement
that comprise an approximately 20 × 80 km property (Figure 1.1-1). These mineral holdings comprise the
Hope Bay Belt (the Belt), on which the primary gold deposits Doris, Madrid North, Madrid South and
Boston are located. The Belt is host to numerous other prospective areas which suggest that economic
reserves will continue to be delineated, permitted and developed, creating a multigenerational operation.
Through a staged approach, the Hope Bay Project (the Project) is scheduled to achieve mine operations
in the Belt through mining at Doris, Madrid North and South, and the Boston deposit.
Following acquisition of the Project by TMAC in March 2013, planning and permitting, advanced
exploration and construction activities were focused on bringing Doris into gold production in early 2017.
In 2016, the Nunavut Impact Review Board (NIRB) and Nunavut Water Board (NWB) granted an
amendment to the Doris North Project Certificate (NIRB Project Certificate 003) and Doris Type A Water
Licence (NWB Type A Water Licence 2AM-DOH1323), respectively, to expand mine operations to
six years and mine the full Doris deposit. Mining and milling rates were amended to a nominal
1,000 tonnes per day (tpd) to 2,000 tpd. The Madrid-Boston Project includes the construction and
operation of commercial mining at the Madrid (North and South) and Boston sites, and the continued
operation of Roberts Bay and the Doris site to support mining at Madrid and Boston. The Madrid-Boston
Project Final Environmental Impact Statement (FEIS) was submitted to NIRB in December 2017, the
FEIS final hearing was held in May 2018, and Project Certificate No. 009 was awarded in November
2018. Water use in 2018 was conducted in accordance with Type A Water Licence 2AM-DOH1323,
the Type B Water Licences 2BB-BOS1727 for Boston, the Type B Water Licences 2BB-MAE1727 for
Advanced Exploration at Madrid, and the Type B Water Licence 2BE-HOP1222 for regional exploration.
Construction of Madrid-Boston is scheduled to start in 2019. A summary of Project activities from 2013 to
2018 is provided in Appendix A. Construction and operation schedule for various components of the
Hope Bay Project is provided in Table 1.1-1.
1.2 Description of Socio-economic Monitoring Program
1.2.1 Compliance Requirements
1.2.1.1 Nunavut Land Claims Agreement
Article 12 Part 7 of the Nunavut Land Claims Agreement (the Nunavut Agreement) provides for the
establishment of a project-specific monitoring program as part of the terms and conditions contained in a
NIRB Project Certificate. Subsection 12.7.2 describes the purpose of such a monitoring program as follows:
a. to measure the relevant effects of projects on the ecosystemic and socio-economic environments
of the Nunavut Settlement Area;
b. to determine whether and to what extent the land or resource used in question is carried out
within the predetermined terms and conditions; and
c. to assess the accuracy of the predictions contained in the project impact statements.
1.2.1.2 NIRB Project Certificate
The Socio-economic Monitoring Program (SEMP) for the Doris Project was first designed in 2007 based
on the findings of the Final Environmental Impact Statement (FEIS) and to meet the requirements of
Condition No. 28 of the Doris North Project Certificate (NIRB No. 003, issued on September 15, 2006 and
renewed on April 11, 2013).

!(
!(
!(
!(!(
!(
!(
^̀̂̀
^̀ Boston Camp
Madrid Camp Doris Camp
Bathurst Inlet(Kingaok)
Gjoa Haven(Ursuqtuq) Kugaaruk
Taloyoak
Kugluktuk
Omingmaktok(Bay Chimo)
Yellowknife
Cambridge Bay(Ekaluktutiak)
Prince of Wales Island
SomersetIsland
VictoriaIsland
BanksIsland
SouthamptonIsland
NunavutNorthwest Territories
BrodeurPeninsula
BordenPeninsula
DevonIsland
Melville IslandBathurstIsland
Bathurst Inlet
Coronation Gulf
Queen Maud Gulf
Foxe Basin
Amundsen Gulf
Arctic Ocean
McClin toc k Channel
Gulf of Boothia
Viscount Melville Sound
Parry Channel
80°0'0"W
100°0'0"W
100°0'0"W120°0'0"W
70°0'
0"N
70°0'
0"N
65°0'
0"N
65°0'
0"N
0 150 300
Kilometres
1:8,800,000
Date: March 06, 2019Projection: Canada Lambert Conformal Conic
!( Community!( Study Community
Kitikmeot Region
Service Layer Credits: Copyright:© 2013 ESRI, i-cubed, GeoEye
Figure 1.1-1: Hope Bay Project LocationGIS # HB-16-044Project No.: 0462113-0008 Client: TMAC RESOURCES INCwww.erm.com

www.erm.com Version: D.1 Project No.: 0462113-0008 Client: TMAC Resources Inc. May 2019 Page 1-3
HOPE BAY PROJECT 2018 Socio-economic Monitoring Program
INTRODUCTION
Table 1.1-1: Construction and Operation Schedule for the Hope Bay Project
Phase Project
Year
Calendar
Year
Length
of Phase
(Years)
Description of Activities
Construction 1 - 4 2019 - 2022 4 Roberts Bay: construction of access road (Year 1),
marine dock and additional fuel facilities
(Year 2 – Year 3)
Doris: expansion of the Doris tailings impoundment
area (TIA) and accommodation facility (Year 1)
Madrid North: construction of concentrator and road to
Doris TIA (Year 1 – Year 2)
All-weather Road: construction (Year 1 – Year 3)
Boston: site preparation and installation of all
infrastructures including process plant (Year 2 – Year 5)
Operation 5 - 14 2023 - 2032 10 Roberts Bay: sealift operations (Year 1 – Year 14)
Doris: processing and infrastructure use
(Year 1 – Year 14)
Madrid North: mining (Year 1 – 13); ore transport to
Doris process plant (Year 1 -13); ore processing and
concentrate transport to Doris process plant
(Year 2 – Year 13)
Madrid South: mining (Year 11 – Year 14); ore
transport to Doris process plant (Year 11 – Year 14)
All-weather Road: operational (Year 4 – Year 14)
Boston: winter access road operating (Year 1 – Year 3);
mining (Year 4 – Year 11); ore transport to Doris
process plant (Year 4 – Year 6); and processing ore
(Year 5 – Year 11)
Reclamation
and Closure
15 - 17 2033 - 2035 3 Roberts Bay: facilities will be operational during closure
(Year 15 – Year 17)
Doris: camp and facilities will be operational during
closure (Year 15 – Year 17); mine, process plant, and
TIA decommissioning (Year 15 – Year 17)
Madrid North: all components decommissioned
(Year 15 – Year 17)
Madrid South: all components decommissioned
(Year 15 – Year 17)
All-weather Road: road will be operational
(Year 15 – Year 16); decommissioning (Year 17)
Boston: all components decommissioned
(Year 15 – Year 17)
Temporary
Closure
NA NA NA All Sites: Care and maintenance activities, generally
consisting of closing down operations, securing
infrastructure, removing surplus equipment and
supplies, and implementing on-going monitoring and site
maintenance activities.

www.erm.com Version: D.1 Project No.: 0462113-0008 Client: TMAC Resources Inc. May 2019 Page 1-4
HOPE BAY PROJECT 2018 Socio-economic Monitoring Program
INTRODUCTION
In 2015, an application to amend the Doris Project Certificate was made to NIRB to address proposed
changes to the Project. Subsequently, an amended Project Certificate (No. 003, dated September 23, 2016)
was issued. Revised Term and Condition No. 28 of the amended Project Certificate states, in summary:
The Hope Bay Belt Socio-economic Monitoring Committee is continued and renamed as the
Hope Bay Socio-economic [Monitoring] Working Group (SEMWG), with invited members including
TMAC, the Government of Nunavut (GN), Indigenous and Northern Affairs Canada (INAC, now
Crown-Indigenous Relations and Northern Affairs Canada, CIRNAC), and the Kitikmeot Inuit
Association (KIA).
The central focus of the SEMWG shall be on collaborating to ensure that the SEMP Plan provides for
appropriate Project-specific socio-economic effects monitoring.
The Hope Bay SEMP shall apply to the Project as described in both the 2005 FEIS and the 2015
Amendment application.
TMAC, reflecting the input of the SEMWG, shall produce an annual Hope Bay SEMP report.
In 2018, the Phase 2 (Madrid-Boston) Project received NIRB approval and a new Project Certificate
(November 2018) was issued for the Phase 2 Project. Term and Condition No. 34 of this new Project
Certificate provides the following:
The Proponent shall continue to be an active member in the [SEMWG]. Invited members of this
Working Group shall include the Proponent, the Government of Nunavut, Indigenous and Northern
Affairs Canada, and the Kitikmeot Inuit Association. Working Group members may invite new
participants on an as needed basis.
The central focus of the [SEMWG] shall be on collaborating to ensure that the Hope Bay Socio-economic
Monitoring Plan provides for appropriate Project-specific socioeconomic effects monitoring as required
throughout the life of the Project. The Hope Bay Socio-Economic Monitoring Plan shall apply to the
Project as described in the Final Environmental Impact Statement (FEIS) for the [Phase 2] Project.
Reflecting the input of the SEMWG, TMAC will continue to report annually to NIRB on implementation of
the Hope Bay SEMP. TMAC will continue to prepare one annual Hope Bay SEMP report, covering all
activities within the Hope Bay Belt including development and mining of the Doris, Madrid North, Madrid
South and Boston deposits.
1.2.2 Kitikmeot Region Socio-economic Monitoring Committee
In addition to the Hope Bay SEMWG and SEMP, the Nunavut Agreement also provides for a regional
Kitikmeot socio-economic monitoring committee (SEMC). The regional SEMC is to complement and
support the work of the Project-specific Socio-economic Monitoring Working Groups. The objectives of
the Kitikmeot SEMC are as follows:
to ensure that major development projects comply with their permits by meeting their socio-economic
monitoring requirements during the environmental assessment, approval, and monitoring processes
as required by NIRB and the Nunavut Agreement;
to bring together communities, governments and their agencies, Regional Inuit Associations, and
Project proponents in a unique forum that encourages discussion and information-sharing among
all parties;
to collect baseline data that is validated by local and traditional knowledge;
to provide a consistent participation forum for stakeholders; and

www.erm.com Version: D.1 Project No.: 0462113-0008 Client: TMAC Resources Inc. May 2019 Page 1-5
HOPE BAY PROJECT 2018 Socio-economic Monitoring Program
INTRODUCTION
to support the Project-specific Socio-economic Monitoring Working Groups by collecting and
disseminating information, facilitating meetings, and reporting to NIRB.
In this regard, the Hope Bay SEMP relies on the work of the Kitikmeot SEMC, in particular with respect to
data and information for the community-level socio-economic indicators defined for the monitoring program.
1.2.3 Project Socio-economic Management and Mitigation
The Project instituted a number of operational plans, procedures, and standards to better manage and
mitigate adverse Project-related socio-economic effects, and to enhance positive effects.
These measures stem from both internal corporate requirements and from potential adverse effects
identified during the environmental approval processes.
In particular, TMAC is committed to establishing and maintaining the following plans to support the
implementation and monitoring of socio-economic mitigation measures for the Project:
The Community Involvement Plan describes how TMAC identifies and engages with community
stakeholders, and how they will provide information, solicit feedback, and report on engagement
activities and outcomes. The Plan also outlines TMAC’s commitments to workplace conduct,
community complaints procedure, workforce communications, local procurement, and other related
programs. The Plan provides for community meetings and career awareness sessions in the
Kitikmeot region, as well as for participation in regional events organized by third parties.
The Human Resources Plan provides a framework for human resources management including
education and training (on-the-job, and through collaboration with regional agencies and institutions),
recruitment, hiring, orientation, and compensation. The plan also includes human resource provisions
for temporary or final closure.
The Inuit Impact and Benefit Agreement (IIBA) between TMAC and the KIA also provides for the
implementation of many socio-economic mitigation measures. In particular, the IIBA provides provisions for
Inuit employment, business development and procurement, training, and socio-economic impact monitoring.
1.2.3.1 Inuit Impact and Benefit Agreement Implementation Committee
In accordance with Article 26 of the Nunavut Agreement, in March 2015, TMAC entered into a new IIBA
with the KIA for the Hope Bay Project. TMAC and the KIA have jointly established an IIBA Implementation
Committee whose purpose is to ensure that the provisions of the IIBA are met. The Implementation
Committee meets on a regular basis to consider Inuit employment, contracting, training, and other
Project-related matters. Kitikmeot Inuit are key Project stakeholders, and as such, this local
Implementation Committee has been instrumental in addressing a number of real and potential Project
impacts to the satisfaction of TMAC and the KIA.
1.2.3.2 TMAC Social Responsibility
TMAC has instituted a Corporate Social Responsibility Committee of its Board of Directors. This
committee is responsible for establishing and implementing social responsibility policies for TMAC, as
well as monitoring company performance against these policies and as compared to applicable laws and
regulations. This committee, in conjunction with other TMAC committees, meets periodically and, thus far,
the Board of Directors has instituted the following applicable policies and procedures.
Anti-bribery and Anti-corruption Policy
The Anti-bribery and Anti-corruption Policy provides a procedure to ensure that TMAC, including
directors, officers, employees, agents, contractors, sub-contractors, and consultants conduct business:

www.erm.com Version: D.1 Project No.: 0462113-0008 Client: TMAC Resources Inc. May 2019 Page 1-6
HOPE BAY PROJECT 2018 Socio-economic Monitoring Program
INTRODUCTION
in an honest and ethical manner reflecting the highest standards of integrity; in compliance with all laws,
instruments, rules and regulatory requirements applicable to TMAC; and in a manner that does not
contravene anti-bribery and anti-corruption laws that apply to TMAC, including without limitation the
Criminal Code (1985) and Corruption of Foreign Public Officials Act (1998).
Code of Ethical Business Conduct
The Code of Ethical Business Conduct sets out acceptable standards of behaviour for TMAC employees
working on behalf of the company, including the following: setting a positive work environment;
environmental management; managing conflicts of interest; accepting of gifts and entertainment; fair
dealing and competitive practices; and public, community, and government relations.
Alcohol and Drug Policy
The Alcohol and Drug Policy restricts the possession and use of alcohol and drugs at the Hope Bay
Project, including provisions for site access and enforcement.
Search and Surveillance Policy
The Search and Surveillance Policy sets out the principles and procedures TMAC will employ to ensure
the safety and security of company facilities and personnel through searches and surveillance activities.
Community Complaints Procedure
This procedure provides direction on how to address community complaints. This includes how to
document, investigate, and resolve community concerns; a process for members of the community to report
concerns related to Project activities and operations; a clear procedure for dealing with concerns; steps to
effectively communicate with a community member reporting a concern; and a monitoring mechanism.
Whistleblower Policy
This policy has been put in place to handle complaints, reports or concerns made by an individual
regarding questionable accounting practices, violations or suspected violations of any applicable law, or
any other suspected wrongdoing according to our Code of Ethical Business Conduct. This policy provides
protection to a complainant acting in good faith against any form of retaliation, and provides for a
complaint reporting procedure.
1.3 Purpose of this Report
The Hope Bay SEMP applies to all of TMAC’s current, planned, and future activities within the Belt, including:
the ongoing mining activities at the Doris site as described in NIRB Amendment No. 1 of Project
Certificate No. 003 (dated September 23, 2016);
the Phase 2 (Madrid-Boston) Project, including activities at the Doris, Madrid (North and South) and
Boston sites, as described in Project Certificate No. 009 (November 2018);
ongoing mineral exploration in the Belt; and
any future amendments or additional development activities within the Belt, in accordance with any
associated Terms and Conditions that may be issued for the related Project Certificate(s).
For the above components and activities, the SEMP applies to full life-of-mine including exploration,
development, construction, operation, and closure and reclamation.

www.erm.com Version: D.1 Project No.: 0462113-0008 Client: TMAC Resources Inc. May 2019 Page 1-7
HOPE BAY PROJECT 2018 Socio-economic Monitoring Program
INTRODUCTION
The purposes of the SEMP are as follows:
ensure compliance with conditions of the amended Project Certificate (NIRB No. 003) for the Doris
mine and the new Project Certificate (NIRB No. 009) for the Phase 2 (Madrid-Boston) mine;
ensure compliance with the relevant sections of the Nunavut Agreement, and the relevant directives as
outlined in the Environmental Impact Statement Guidelines provided by NIRB (NIRB 2003; AMEC 2007);
fulfill best practices in social responsibility; and
provide relevant and timely information to community development management.
Specific objectives of the Hope Bay SEMP are to:
verify the accuracy of the socio-economic impact predictions made in the Doris North Project FEIS
(2006), the 2015 Amendment Application for the Doris North Project, and subsequent impact
assessments for other Hope Bay Project components that may be developed (e.g., Phase 2);
review the findings of the SEMP in collaboration with other members of the Hope Bay SEMWG, to
identify socio-economic changes in the Kitikmeot communities and consider the potential influence of
the Project on these changes;
determine the effectiveness of mitigation measures, and add or adjust mitigation measures if
measures are shown to be ineffective (adaptive management);
identify any unanticipated effects, and adaptively mitigate as appropriate;
consider and incorporate, when appropriate, Inuit Qaujimajatuqangit (IQ) into the SEMP, ensuring
that, wherever possible, the monitoring program design and methodologies are culturally appropriate;
provide an annual report to NIRB that will meet the reporting requirements as set out in Amendment
No. 1 of Project Certificate No. 003, Project Certificate No. 009, and the Hope Bay SEMWG TOR; and
periodically review and modify the SEMP to improve its effectiveness, if considered necessary by
Hope Bay SEMWG members.
This 2018 Hope Bay SEMP report supersedes the 2017 report and provides the results of the SEMP to
date. The report supports the defined purpose and objectives of the Hope Bay SEMP.
1.4 Structure of this Report
This report is organized in the following order. Section 2 provides information on the socio-economic
indicators and their respective sources, as well as information on the approach to data analysis and
interpretation. Section 3 through 9 review and evaluate objectives of the Hope Bay Project as related to
economic development, contracting and business expenditures, employment, education and training,
population demographics, community infrastructure and public services, as well as individual and
community health and wellness. Each objective includes a prediction, results section (data and findings),
and interpretation. Predictions are stated with respect to the outgoing activities at the Doris site and
several exploration activities (the Hope Bay Project), as well as planned construction and operation
activities at Madrid-Boston (the extension and continuation of the Hope Bay Project)1. Finally, Section 10
summarizes results and delivers a management response.
1 The Madrid-Boston Project consists of proposed mine operations at the Madrid North, Madrid South and Boston deposits, and it is
part of a staged approach to continuous development of the Hope Bay Project.

www.erm.com Version: D.1 Project No.: 0462113-0008 Client: TMAC Resources Inc. May 2019 Page 2-1
HOPE BAY PROJECT 2018 Socio-economic Monitoring Program
METHODS
2. METHODS
2.1 Indicators
The SEMP was originally based on the predicted impacts and mitigation measures as described in the
FEIS for the Doris North Project (MMC 2005). This was the basis of the indicators included in the SEMP
Plan as originally developed in 2007 and in annual monitoring reports produced since the beginning of
construction at Doris (with the first annual report issued in 2012).
The updated SEMP Plan (ERM 2019) considers the 2007 SEMP and the experience of annual reporting
to date, including the availability and usefulness of data and indicators. The updated monitoring program
also incorporates information from the 2015 Amendment Application for the Doris Project (ERM 2015),
and the FEIS for the Madrid-Boston (Phase 2) Project (NIRB 2012; TMAC 2017).
The socio-economic effects assessment of Phase 2 provides the basis for the SEMP indicator framework.
Phase 2 components and activities are representative of all Project components and activities that may
have socio-economic effects. Indicators have been selected in order to provide information related to the
identified potential effects of the Project, so that the monitoring program can determine whether effects
occur—and are managed—as predicted.
Table 2.1-1 summarizes the valued socio-economic components (VSECs) for the SEMP, and the potential
socio-economic effects associated with each VSEC. Both beneficial and potentially adverse effects are
considered and included in the SEMP.
Indicators for the Hope Bay SEMP have been selected as they are one or more of the following
(ERM 2019):
Indicators identified in the IIBA between TMAC and the KIA (dated March 2015), including
requirements for annual reporting to the IIBA Implementation Committee;
Indicators related to the potential socio-economic effects of the Project, as identified in the Phase 2
FEIS;
Core indicators as recently recommended by the GN for Project-specific SEMPs in Nunavut
(GN Department of Economic Development & Transportation 2018); and/or
Indicators that provide useful context or otherwise inform the interpretation of the impacts of the
Project, including indicators identified by the Working Group as important to measure.
The selected indicators are used to identify changes in socio-economic conditions that may be of
concern, not to fully characterize or explain the reasons behind the observed changes. Changes in
monitored elements of the community may result directly or indirectly from Project activities, or may be
unrelated to the Project. As is the purpose of a monitoring system, the indicators are used to identify
areas of potential concern for further investigation.
Altogether, there are 36 objectives comprising 60 indicators identified for the seven VSECs (Table 2.1-2).
This includes both Project indicators (i.e., data to be collected by TMAC) and community indicators
(i.e., data to be gathered from community, regional, territorial, and other public sources).
2.2 Data Analysis and Interpretation
The following sections outline how data collection (type, frequency, and source), analysis, and
interpretation is accomplished. Results for 2018, as well as historical data where available, are presented
in Chapters 3 to 9 according to VSEC and the objectives defined for each VSEC.

www.erm.com Version: D.1 Project No.: 0462113-0008 Client: TMAC Resources Inc. May 2019 Page 2-2
HOPE BAY PROJECT 2018 Socio-economic Monitoring Program
METHODS
Table 2.1-1: Valued Socio-economic Components (VSECs)
VSEC and Rationale Predicted Potential Effects
Construction and Operation Closure (Temporary or Final)
Economic Development
Project-related employment and
procurement will be a driver for
economic growth and increased
government and Inuit organization
revenues
Increased economic growth Reduced economic growth
Contracting and Business
Expenditures
Project-related procurement of goods
and services will create business
opportunities and increased income and
employment
Opportunities for local
businesses
Reduced business
opportunities
Employment
The Project will create jobs through
direct and spin-off employment, resulting
in greater labour force capacity and
potential competition for labour among
employers
Increased employment and
income opportunities
Increased labour force capacity
(education, skills, experience)
Increased competition for labour
Reduced employment and
income opportunities
Education and Training
The Project will increase local demand
for education and training, and have a
positive influence on youths’ outlook on
education and future opportunities
Increased demand for education
and training programs
Improved perceptions of
education and employment
benefits
Population Demographics
Related to employment opportunities,
the Project may result in population
migration
Increased in-migration to
Kitikmeot communities
Community Infrastructure and
Public Services
Related to employment opportunities,
increasing demand for local housing,
infrastructure, and services
Increased demand for housing
Increased demand for local
services
Individual and Community Health and
Wellness
Factors associated with Project
employment may affect well-being,
including changes to family relationships
due to rotational work schedule,
changes in spending due to increased
income, and changes to traditional
harvesting activities and food costs
Changes to family stability
(positive and adverse effects)
Changes to family spending
(positive and adverse effects)
Changes to food security and
cost of living (positive and
adverse effects)
Changes to family stability
(positive and adverse
effects)
www.erm.com Version: D.1 Project No.: 0462113-0008 Client: TMAC Resources Inc. May 2019 Page 2-3
HOPE BAY PROJECT 2018 Socio-economic Monitoring Program
METHODS
Table 2.1-2: Socio-economic Indicators
Predicted
Effect
Objective Indicator(s) Metric(s) New SEMP
Indicator
(yes/no)
GN Core
Indicator
(yes/no)
Source(s)
Economic Development
Economic
growth
Growth of revenues
to Inuit
organizations
TMAC payments to KIA and
Nunavut Tunngavik
Incorporated (NTI1)
Value ($) Yes No TMAC
Growth in revenues
to the Government
of Nunavut
Direct territorial tax
payments
Value ($) of direct tax payments (Fuel
Tax, Payroll Tax, and Property Tax)
Yes Yes TMAC
Growth in mining
industry
expenditures
Project expenditures Value ($) of Capital Expenditures
(CAPEX) and Operating Expenditures
(OPEX)
Yes Yes TMAC
Contracting and Business Expenditures
Opportunities
for local
businesses
Procurement
expenditures
Annual spending on goods
and services
Value ($)
Value by procurement category
No
(modified)
No TMAC
Procurement from
Nunavut businesses
Contracts awarded to
Nunavut Businesses
Number of contracts
Total value of contracts
Average and median value of contracts
Percent of total value of contracts
Note: see GN definition of “Nunavut
business” provided in Appendix A of
Nunavummi Nangminiqaqtunik Ikajuuti
Implementation Act.
Yes Yes TMAC
Procurement from
Kitikmeot
businesses
Contracts awarded to
Kitikmeot Qualified
Businesses (KQB)
Contracts awarded to other
Kitikmeot-based businesses
(non-KQB)
Number of contracts
Total value of contracts
Average and median value of contracts
Percent of total value of contracts
No
(modified)
No TMAC

www.erm.com Version: D.1 Project No.: 0462113-0008 Client: TMAC Resources Inc. May 2019 Page 2-4
HOPE BAY PROJECT 2018 Socio-economic Monitoring Program
METHODS
Predicted
Effect
Objective Indicator(s) Metric(s) New SEMP
Indicator
(yes/no)
GN Core
Indicator
(yes/no)
Source(s)
Procurement from
Inuit Firms
Contracts awarded to all
Inuit Firms (including KQB
and non-KQB)
Number of contracts
Total value of contracts
Average and median value of contracts
Percent of total value of contracts
No Yes TMAC
Business
development
Number of Kitikmeot
Qualified Businesses
Number of registered Inuit
firms in the Kitikmeot region
Total number
Number of new businesses in past year
No No KIA, NTI
Employment
Increased
employment
and income
opportunities
Overall employment Workforce size Total number of Kitikmeot-based and
on-site workers (TMAC and contractors)
Annual average number of
Kitikmeot-based and on-site workers
(TMAC and contractors)
No Yes
(modified)
TMAC
Workforce effort Total annual hours worked
Average hours per worker
No Yes TMAC
Inuit and Kitikmeot
employment
Kitikmeot Inuit workforce size
(resident of Kitikmeot region)
Kitikmeot Inuit workforce
effort
Total number of workers on site (TMAC
and contractors)
Annual average number of workers
on site
Total annual hours worked
Average hours per worker
Employment rate (hours worked by Inuit
and Kitikmeot worker as share of total
hours worked)
No
(modified)
Yes TMAC
Other Inuit workforce size
(not resident of Kitikmeot
region)
Other Inuit workforce effort
No
(modified)
Yes TMAC
Other regional workforce size
(non-Inuit Kitikmeot residents)
Other regional workforce
effort
No
(modified)
No TMAC
Kitikmeot workers by
community
Number of workers from each Kitikmeot
community (point of hire)
Percent of total Kitikmeot workers
Yes Yes
(modified)
TMAC

www.erm.com Version: D.1 Project No.: 0462113-0008 Client: TMAC Resources Inc. May 2019 Page 2-5
HOPE BAY PROJECT 2018 Socio-economic Monitoring Program
METHODS
Predicted
Effect
Objective Indicator(s) Metric(s) New SEMP
Indicator
(yes/no)
GN Core
Indicator
(yes/no)
Source(s)
Gender equity Workforce effort by women Total hours worked in year
Employment rate (hours worked by
women as share of total hours worked)
No Yes TMAC
Workforce effort by Inuit
women
Total hours worked in year
Employment rate (hours worked by Inuit
women as share of total hours worked
by Inuit)
Yes Yes TMAC
Employment income Payroll
Payroll for Inuit workers
Total value ($) No Yes TMAC
Payroll by Kitikmeot
community
Total value ($) No No TMAC
Employee retention Employee turnover rate Non-Inuit employee turnover rate, as
represented by total number of non-
Inuit departures as share of total
number of non-Inuit employees
[(period starting + ending number of
employees)/2]
Inuit employee turnover rate as
represented by total number of Inuit
departures as share of total number of
Inuit employees
Yes Yes TMAC
Worker health and
safety
Lost time incidents Number of lost time incidents
Lost workday incident rate
([lost workday cases][200,000]/[hours
worked])
No
(modified)
Yes
(modified)
TMAC
Utilization of site medic Per capita visits to site medic Yes Yes TMAC

www.erm.com Version: D.1 Project No.: 0462113-0008 Client: TMAC Resources Inc. May 2019 Page 2-6
HOPE BAY PROJECT 2018 Socio-economic Monitoring Program
METHODS
Predicted
Effect
Objective Indicator(s) Metric(s) New SEMP
Indicator
(yes/no)
GN Core
Indicator
(yes/no)
Source(s)
Increased
labour force
capacity
(education,
skills,
experience)
On-the-job training On-the-job training courses Number of courses and course
sessions
Number of training hours, by basic
category (general, health and safety,
specific)
No
(modified)
Yes TMAC
Inuit participation in on-the-
job training
Number of training hours for Inuit
workers, by basic category (general,
health and safety, specific)
Number of training hours for Inuit
workers as share (%) of number of
training hours for all employees, by
basic category
No
(modified)
Yes TMAC
Apprenticeships Apprenticeships with the
Project
Number of apprenticeships No Yes TMAC
Inuit apprentices Number of apprenticeships, as share
(%) of total
Skill levels Inuit employees, by job
category (skill level)
Number of Inuit employees by job
category (e.g., management,
professionals, skilled trades, skilled
technicians, semi-skilled, unskilled)
Inuit share (%) of total number of
employees by job category
Yes Yes TMAC
Inuit employees, by
department
Number of Inuit employees by
department (e.g., environment, mining,
site operations, site services)
Inuit share (%) of total number of
employees by department
No
(modified)
No TMAC
Increased
competition
for labour
Retention of skilled
workers in
community roles
Number of skilled workers
leaving employment in
community for employment
at mine
Number of workers employed in local
roles immediately prior to accepting
employment with Project
No
(modified)
No TMAC

www.erm.com Version: D.1 Project No.: 0462113-0008 Client: TMAC Resources Inc. May 2019 Page 2-7
HOPE BAY PROJECT 2018 Socio-economic Monitoring Program
METHODS
Predicted
Effect
Objective Indicator(s) Metric(s) New SEMP
Indicator
(yes/no)
GN Core
Indicator
(yes/no)
Source(s)
Education and Training
Increased
demand for
education
and training
programs
Availability of
post-secondary
education
Courses related to
employment in mining
industry
Number of mining programs/courses
offered by Nunavut Arctic College
(NAC) in the Kitikmeot region
Number of mining support service
programs/ courses offered by NAC in
the Kitikmeot region
Yes No NAC
Participation in
post-secondary
education
Enrolment of Kitikmeot
students in post-secondary
education
Number of students enrolled in past
year (NAC and other institutions), total,
and by home community
Enrollment by NAC program type
Yes No KIA, GN,
NAC
Investment in
education
Investments in school-
based initiatives
Total value ($), including financial,
material and in-kind support
Yes Yes TMAC
Improved
perceptions
of education
and
employment
benefits
Understanding of
employment
opportunities
Community and student
outreach events
Number of community information
sessions and/or career awareness
sessions
Number of high school information
and/or career awareness sessions
Number of sponsored student
competitions
Number of sponsored student
achievement awards
Yes
(aligned
with IIBA)
No TMAC
High school
participation
Public school enrollment, by
community
Number enrolled Yes No NBS, GN
Public school attendance
(truancy) rate
Days attended as percent of total
school days
Yes No NBS, GN
High school
completion
High school completion, by
community
Total number of graduates No Yes NBS, GN

www.erm.com Version: D.1 Project No.: 0462113-0008 Client: TMAC Resources Inc. May 2019 Page 2-8
HOPE BAY PROJECT 2018 Socio-economic Monitoring Program
METHODS
Predicted
Effect
Objective Indicator(s) Metric(s) New SEMP
Indicator
(yes/no)
GN Core
Indicator
(yes/no)
Source(s)
Population Demographics
Increased
in-migration
to Kitikmeot
region
Population stability Population of Kitikmeot
communities
Total population, by year
Annual change in population
No Yes NBS
Migration of employees
to/from Kitikmeot
communities
Number of direct employees who have
relocated to or from a Kitikmeot
community in past year (including
community of origin/destination)
Net migration of direct employees to
LSA communities (Cambridge Bay and
Kugluktuk)
Number of direct employees who have
relocated to or from the Kitikmeot
region in the past year (including
community of origin/destination)
No Yes TMAC
Community Infrastructure and Public Services
Increased
demand for
housing
Housing availability Housing need, by
community
Public housing waitlist as percentage of
available public housing stock
Yes No NHC
Approved home ownership
assistance applications, by
community
Number of approved Nunavut Down
Payment Assistance Program (NDAP)
applications
Yes No NHC
Housing status Housing status of project
employees
Per housing survey
Note: housing survey to be developed with
Nunavut Housing Corporation (NHC), GN,
and KitSEMC, and administered to
Nunavummiut employees.
Yes Yes NHC
Increased
demand for
local services
Project use of
emergency services
Use of GN emergency
services by the Project
Number of times emergency health
services utilized
No Yes TMAC
Demand for health
and social services
Visits to health centres, by
community
Number of annual visits
Number of annual visits per capita
No Yes NBS

www.erm.com Version: D.1 Project No.: 0462113-0008 Client: TMAC Resources Inc. May 2019 Page 2-9
HOPE BAY PROJECT 2018 Socio-economic Monitoring Program
METHODS
Predicted
Effect
Objective Indicator(s) Metric(s) New SEMP
Indicator
(yes/no)
GN Core
Indicator
(yes/no)
Source(s)
Social assistance caseload,
by community
Total social assistance average monthly
caseload
Per capita social assistance average
monthly caseload per capita
No Yes
(modified)
NBS, DFS
Demand for police
services
Police calls for service, by
community
Total number of calls annually
Annual calls per capita
No No RCMP
Criminal violations, by
region and community
Total number
Rate per capita
Note: the types of criminal violations
(alcohol, drug, assault) are described
under the Individual and Community
Health and Wellness VSEC.
No Yes NBS
Individual and Community Health and Wellness
Changes to
family
stability
Work-life balance Ability of Inuit workers to
balance employment and
family and/or traditional
lifestyle
Inuit employee turnover rate (refer to
Employment VSEC)
Yes Yes TMAC
Inuit workers who report resignation due
to homesickness, family commitments,
incompatibility with traditional lifestyle,
and/or emotional stress factors
No
(modified)
No TMAC
Utilization of Employee and
Family Assistance Program
(EFAP)
Number of instances EFAP utilized No Yes TMAC
Changes to
family
spending
Household financial
management
Financial management
training for workers
Number of workers who attended
financial management training
Number of Inuit workers who attended
financial management training
Yes No TMAC
Spending decisions
and lifestyle choices
Sale of alcoholic beverages,
by community
Annual dollar value spent on alcoholic
beverages
Note: data only available regarding sales
through registered Nunavut distributors.
Yes No GN

www.erm.com Version: D.1 Project No.: 0462113-0008 Client: TMAC Resources Inc. May 2019 Page 2-10
HOPE BAY PROJECT 2018 Socio-economic Monitoring Program
METHODS
Predicted
Effect
Objective Indicator(s) Metric(s) New SEMP
Indicator
(yes/no)
GN Core
Indicator
(yes/no)
Source(s)
Types of criminal violations,
by region and community
Total number of impaired driving
violations, and rate per capita
Total number of drug-related violations,
and rate per capita
Total number of assault violations, and
rate per capita
Note: Refer back to “Demand for police
services” for total number/rate of criminal
violations.
No No NBS
Changes to
food security
and cost of
living
Country foods
consumption
Consumption of country
foods at TMAC camp
Number of workers who use the
Country Food Kitchen at site
Number of days that TMAC canteen
offered country foods
Yes No TMAC
Food security Food costs, by community Cost of Nunavut Food Price Survey
(NFPS) food basket ($)
Inflation rate (cost of basket compared
to previous year)
Comparison of Kitikmeot region to
Nunavut
No No NBS
Household
economic self-
sufficiency
Low-income households
(families and non-family
persons), by community
Nunavut taxfilers with low income
Note that social assistance caseload is
included under “Demand for health and
social services.”
Yes No NBS
Project employment income Refer to payroll statistics provided under
Employment VSEC to evaluate how
workers’ income relates to changes in low-
income households, social assistance, and
cost of living.
- - TMAC
1 This information is confidential, and will require permission of the KIA and NTI prior to its release. Reporting of this indicator is conditional on TMAC receiving the necessary permissions.

www.erm.com Version: D.1 Project No.: 0462113-0008 Client: TMAC Resources Inc. May 2019 Page 2-11
HOPE BAY PROJECT 2018 Socio-economic Monitoring Program
METHODS
For new or modified SEMP indicators there is a lack of historical data and therefore only the most recent
observations are provided. This affects consistency of how data for various indicators are reported
throughout this document and reduces the possibility for cross-comparison. Going forward and subject to
availability, those indicators will be updated annually.
2.2.1 Quantitative Data
Where available, quantitative data are reported and analyzed to investigate changes in socio-economic
characteristics over a given time period. Where relevant, data are also used to identify potential or
probable links with the Project.
Trend Analysis
Data are statistically evaluated to identify trends. Specific analyses are considered based on each
particular data set, with the goal of removing the influence of outliers and focusing on meaningful trends
and patterns.
Where trends or specific changes are identified, they are considered in the context of the Project to
determine the potential for a cause-and-effect relationship. This includes a review of the Project’s
employment numbers, procurement expenditures, training records, and other activities which could directly
or indirectly alter the affected VSEC. TMAC expects that correlation and causation may not always be
clear. However, the company is committed to identifying potential interactions for discussion with the
Working Group and KitSEMC, and to implementing further study or mitigative actions if warranted.
Community statistics may be influenced by a variety of factors unrelated to the Project, including changes
in local resources (e.g., increasing/decreasing social services, healthcare, education, or policing staff),
policy directions (e.g., heightened commitment to enforce alcohol regulations), program outcomes
(e.g., promoting use of health clinic), and other initiatives. Notable changes, trends, or outliers will be
explained where possible.
Industry Averages
Where available, Project data is compared to relevant industry averages. Comparative analysis notes
potential disparities in data sources, collection, reliability, or other factors.
2.2.2 Qualitative Information
No qualitative indicators are included in the SEMP at this time. However, qualitative information will be
used to evaluate and interpret quantitative data and trends. This may include reports and observations
from TMAC, the KIA, the GN, KitSEMC members, hamlets, and local service providers regarding activities
and events in the study communities.
TMAC may also incorporate qualitative information in the absence of quantitative data—for example,
if annual data for the above indicators is discontinued2 or delayed—in an attempt to fill the data gap.
2.2.3 Charts, Graphs, and Infographics
To aid the interpretation and analysis of monitoring data, the reports incorporates visual representations
including charts, graphs, and infographics. Visuals are used to highlight key trends and features, and to
compare and contrast changes over time.
2 If an indicator is discontinued or unreliable, it may be adjusted in accordance with the SEMP evaluation process described in
Section 6.

www.erm.com Version: D.1 Project No.: 0462113-0008 Client: TMAC Resources Inc. May 2019 Page 2-12
HOPE BAY PROJECT 2018 Socio-economic Monitoring Program
METHODS
2.2.4 Community Data Challenges
Communities in Nunavut are small and there are inherent data collection and interpretation challenges.
This impacts the extent to which community-level data can be meaningfully provided and interpreted.
Some of the main challenges include the following:
Data from sources such as the NBS are typically not available for the most recent year. In this report,
the most recent NBS data are for 2017 or prior while all Project-related data are provided for 2018.
Labour force surveys and other regular publications by Statistics Canada typically only include larger
cities and metropolitan areas. Iqaluit is typically the only community in Nunavut to be represented in
these reports. Therefore, there are generally less socio economic data (annual or more frequently)
compared to larger communities in Canada.
The Kitikmeot communities are small, ranging from approximately 900 in Kugaaruk to 1,800 in
Cambridge Bay in 2016. Due to confidentiality concerns, statistics are regularly masked (i.e., not
disclosed) to protect the identity of individuals within small sub-groups. TMAC’s data about the
workforce is similarly protected where confidentiality concerns are identified.
Also reflecting their small size, community-level data (where it is available) is often subject to
challenges in determining statistically significant changes. Some datasets from previous years show
marked fluctuations in terms of percent-change, although real numbers may be small.
Because the number of individuals involved in providing community-based services is also small,
challenges can exist from the disproportionate effects of staff turnover, staff vacancies and individual
staff choice in fulfilling roles and responsibilities (such as data collection) that can affect tracking
community trends. Whether detected change is real can be more a question of whether there are
personnel in the positions, how a public or community service was delivered (i.e., compliance effort),
or variations in data collection effort.

www.erm.com Version: D.1 Project No.: 0462113-0008 Client: TMAC Resources Inc. May 2019 Page 3-1
HOPE BAY PROJECT 2018 Socio-economic Monitoring Program
ECONOMIC DEVELOPMENT
3. ECONOMIC DEVELOPMENT
3.1 Growth of Revenues to Inuit Organizations
3.1.1 Predictions
TMAC will make payments to the Kitikmeot Inuit Association (KIA) and the Nunavut Tunngavik
Incorporated (NTI) consisting of royalties, exploration and production lease rents, land tenure payments,
water compensation, and the Inuit Impact and Benefit Agreement (IIBA) implementation payments. Also,
as specified in the IIBA between the KIA and TMAC, TMAC will make payments to the KIA for training
and business development. It is predicted that these payments will result in growth of revenue to Inuit-
owned organization.
3.1.2 Results
In 2018, TMAC made payments totalling $2.6 million to the KIA and another $7.2 million to the NTI.
An estimated $38,400 was paid to the Kitikmeot Corporation. KIA also indirectly benefits through the
revenue of its affiliated businesses that provide services to the Project (Source: A. Buchan, pers. comm.).
3.1.3 Interpretation
The mandate of the KIA is to defend, preserve, and promote social, cultural, and economic benefits for
Kitikmeot Inuit, while the NTI ensures that the federal and territorial governments fulfill obligations under
the Nunavut Agreement with respect to the management of land, water, and wildlife. The Kitikmeot
Corporation is responsible for business development activities, employment and training.
In 2018, TMAC made payments of $9.8 million to the KIA, NTI, and the Kitikmeot Corporation. These
contributions facilitate a greater degree of economic activity than would be possible without the Project
and help to promote the social, economic, and cultural well-being of Inuit in Nunavut.
3.2 Growth in Revenues to the Government of Nunavut
3.2.1 Predictions
TMAC will pay the Nunavut Payroll Tax, the Nunavut Petroleum Tax, and the Nunavut Property Tax,
which in turn will increase revenues to the Government of Nunavut (GN).
3.2.2 Results
In 2018, TMAC made payments totaling $1.3 million to the GN. Additionally, $590,000 was paid in
property taxes (A. Buchan, pers. comm.).
Additional benefits were from the purchase of diesel fuel by the Project, with tax paid at the wholesale
level. In 2018, $79.4 million was spent on diesel and jet fuel, spare parts, and other consumables,
compared to $66.3 in 2017 (TMAC 2018).
3.2.3 Interpretation
The GN gained $1.3 million dollars paid in various taxes by the Project, with additional benefits from the
sale of diesel fuel to the Project. Payments to the GN help to promote the social, economic, and cultural
well-being of Inuit in Nunavut.

www.erm.com Version: D.1 Project No.: 0462113-0008 Client: TMAC Resources Inc. May 2019 Page 3-2
HOPE BAY PROJECT 2018 Socio-economic Monitoring Program
ECONOMIC DEVELOPMENT
3.3 Growth in Mining Industry Expenditures
3.3.1 Predictions
Project spending, including Project capital expenditures (CAPEX) and Project operating expenditures
(OPEX), will increase mining industry expenditures in Nunavut and contribute to the economic growth and
development in the Kitikmeot region.
3.3.2 Results
Project capital and operating expenditures have been increasing with the level of on-site activities. In
2018, TMAC spent a total of $220.1 million (including other losses/expenses) compared to $81.7 million
in 2017 (Table 3.3-1).
Table 3.3-1: Project Expenditures (Millions Canadian Dollars)
2017 2018
Cost of sales
Production costs $56.4 $118.6
Royalties and selling expenses $1.4 $4.0
Depreciation $11.0 $49.6
$68.8 $172.2
General and Administrative
Salaries and wages $9.2 $7.8
Share-base payments $3.2 $6.7
Other corporate $3.1 $2.9
$15.5 $17.4
Other (net expense/loss) ($2.6) $30.5
Source: TMAC (2019)
3.3.3 Interpretation
Project expenditures reached $220.1 million in 2018, representing an increase of 169% over 2017.
Project expenditures support direct employment opportunities, procurement of goods and services from
businesses, as well as numerous spinoff opportunities in the Kitikmeot region.
3.4 Effects Management and Mitigation
Table 3.4-1 lists the programs and measures designed to mitigate and manage potential effects related to
economic development.

www.erm.com Version: D.1 Project No.: 0462113-0008 Client: TMAC Resources Inc. May 2019 Page 3-3
HOPE BAY PROJECT 2018 Socio-economic Monitoring Program
ECONOMIC DEVELOPMENT
Table 3.4-1: Economic Development Management and Mitigation Measures
Program/Mitigation
Measure
Purpose/Description/Outcome
IIBA The IIBA sets out principles and methods to, among other purposes, maximize Inuit
training, employment and business opportunities arising from the operation of the Project,
and provide a mechanism through which effective communication and cooperation can
take place. Key features of the IIBA include provisions for, among others: setting annual
and long-term Inuit training targets; setting annual Inuit employment targets; first
opportunity to Kitikmeot Inuit residents for employment, followed by non-resident Inuit;
establishment and administration of a Training and Education Fund; promotion of Inuit
content in procurement, including requirement to engage Kitikmeot Qualified Businesses
for certain types of goods and services; and establishment, under certain conditions, of a
Business Development Fund.
TMAC Liaison TMAC Liaison will work with the appropriate TMAC department to, among other
responsibilities, assist TMAC to maximize Kitikmeot Qualified Business procurement
by identifying businesses interested in procurement opportunities, considering
opportunities for capacity building, and development and assisting Kitikmeot Qualified
Businesses to access available business opportunities.
Community
Involvement Plan
TMAC will maintain communications with Kitikmeot communities over the life of the
Project, and share information to assist in the development of collaborative adaptive
management measures, should unanticipated impacts arise and mitigation be required.
Communication TMAC will communicate the Project’s schedule to ensure that local governments, local
and regional businesses, and other interested institutions/organizations are aware of
Project activities as well as any opportunities that can contribute to business growth in the
Kitikmeot region.

www.erm.com Version: D.1 Project No.: 0462113-0008 Client: TMAC Resources Inc. May 2019 Page 4-1
HOPE BAY PROJECT 2018 Socio-economic Monitoring Program
CONTRACTING AND BUSINESS EXPENDITURES
4. CONTRACTING AND BUSINESS EXPENDITURES
4.1 Procurement Expenditures
4.1.1 Predictions
The Project will purchase goods and services from businesses in Nunavut and beyond. The provision of
business contracts will support economic prosperity and create new economic opportunities.
4.1.2 Results
In 2018, TMAC spent $182.5 million on contracts with businesses from Nunavut and beyond. Of that, 60%
was spent on services, 37% on materials and supplies, and 3% on corporate expenses (A. Buchan, pers.
comm.). To compare, in 2017, a total of $148.1 million was spent on the purchase of goods and services.
4.1.3 Interpretation
Project procurement expenditures increased by 23% between 2017 and 2018. Project expenditures
continue to contribute to the economic prosperity in Nunavut and the rest of Canada.
4.2 Procurement from Nunavut Businesses
4.2.1 Predictions
The Project will provide contract and subcontract opportunities to Nunavut businesses. The provision of
business contracts will support economic prosperity and create new economic opportunities.
4.2.2 Results
In 2018, TMAC awarded $68.0 million in contracts to Nunavut businesses, representing an increase of
39% over the previous year (Table 4.2-1). In general, an estimated 37% of the total value of contracts
awarded by TMAC was awarded to Nunavut businesses in 2018.
Table 4.2-1: Contracts Awarded to Nunavut Businesses (Million Dollars), 2017 and 2018
2017 2018
Number of Contracts 15 14
Total Value of Contracts $49.0 $68.0
Average Value of Contracts $3.3 $4.9
Median Value of Contracts $0.7 $2.8
Percent of Total 33% 37%
Source: A. Buchan, pers. comm.
4.2.3 Interpretation
TMAC continues to procure an increasing share of goods and services from territorial businesses, with
more than a third of total value of contracts awarded to businesses in Nunavut.
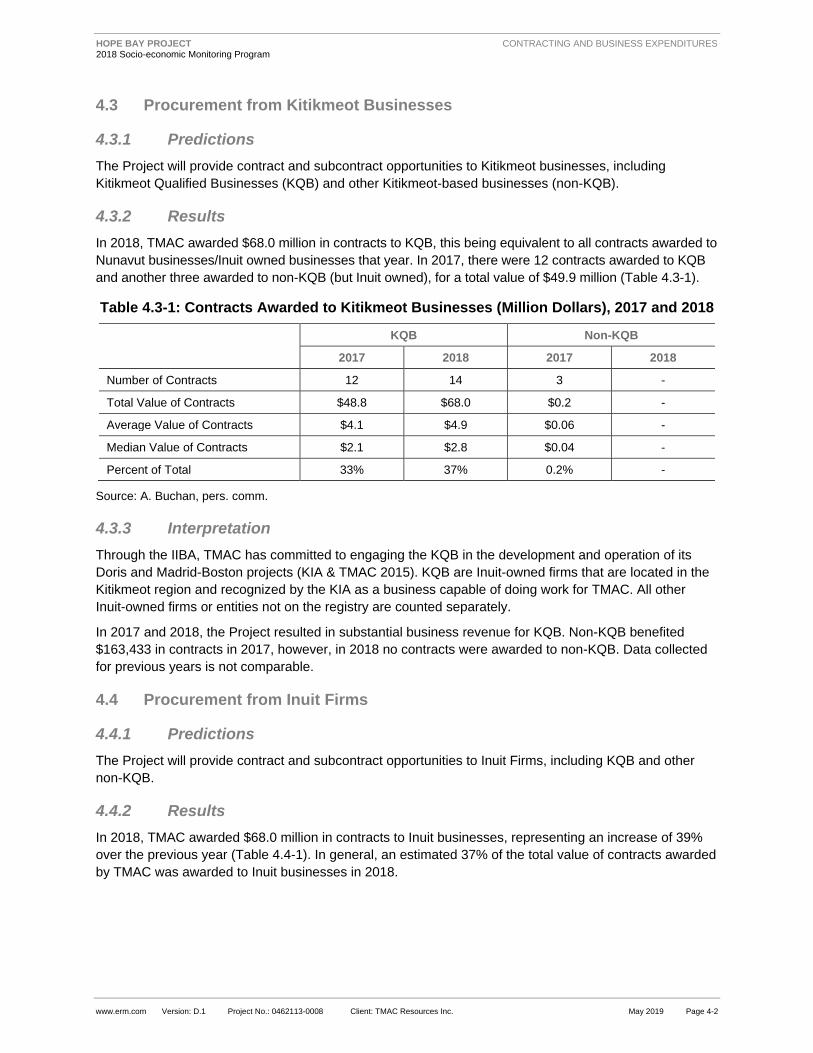
www.erm.com Version: D.1 Project No.: 0462113-0008 Client: TMAC Resources Inc. May 2019 Page 4-2
HOPE BAY PROJECT 2018 Socio-economic Monitoring Program
CONTRACTING AND BUSINESS EXPENDITURES
4.3 Procurement from Kitikmeot Businesses
4.3.1 Predictions
The Project will provide contract and subcontract opportunities to Kitikmeot businesses, including
Kitikmeot Qualified Businesses (KQB) and other Kitikmeot-based businesses (non-KQB).
4.3.2 Results
In 2018, TMAC awarded $68.0 million in contracts to KQB, this being equivalent to all contracts awarded to
Nunavut businesses/Inuit owned businesses that year. In 2017, there were 12 contracts awarded to KQB
and another three awarded to non-KQB (but Inuit owned), for a total value of $49.9 million (Table 4.3-1).
Table 4.3-1: Contracts Awarded to Kitikmeot Businesses (Million Dollars), 2017 and 2018
KQB Non-KQB
2017 2018 2017 2018
Number of Contracts 12 14 3 -
Total Value of Contracts $48.8 $68.0 $0.2 -
Average Value of Contracts $4.1 $4.9 $0.06 -
Median Value of Contracts $2.1 $2.8 $0.04 -
Percent of Total 33% 37% 0.2% -
Source: A. Buchan, pers. comm.
4.3.3 Interpretation
Through the IIBA, TMAC has committed to engaging the KQB in the development and operation of its
Doris and Madrid-Boston projects (KIA & TMAC 2015). KQB are Inuit-owned firms that are located in the
Kitikmeot region and recognized by the KIA as a business capable of doing work for TMAC. All other
Inuit-owned firms or entities not on the registry are counted separately.
In 2017 and 2018, the Project resulted in substantial business revenue for KQB. Non-KQB benefited
$163,433 in contracts in 2017, however, in 2018 no contracts were awarded to non-KQB. Data collected
for previous years is not comparable.
4.4 Procurement from Inuit Firms
4.4.1 Predictions
The Project will provide contract and subcontract opportunities to Inuit Firms, including KQB and other
non-KQB.
4.4.2 Results
In 2018, TMAC awarded $68.0 million in contracts to Inuit businesses, representing an increase of 39%
over the previous year (Table 4.4-1). In general, an estimated 37% of the total value of contracts awarded
by TMAC was awarded to Inuit businesses in 2018.

www.erm.com Version: D.1 Project No.: 0462113-0008 Client: TMAC Resources Inc. May 2019 Page 4-3
HOPE BAY PROJECT 2018 Socio-economic Monitoring Program
CONTRACTING AND BUSINESS EXPENDITURES
Table 4.4-1: Contracts Awarded to Inuit Businesses (Million Dollars), 2017 and 2018
Inuit Owned (KQB) Other Inuit Businesses
2017 2018 2017 2018
Number of Contracts 12 14 3 -
Total Value of Contracts $48.8 $68.0 $0.2 -
Average Value of Contracts $4.1 $4.9 $0.06 -
Median Value of Contracts $2.1 $2.8 $0.04 -
Percent of Total 33% 37% 0.2% -
Source: A. Buchan, pers. comm.
4.4.3 Interpretation
TMAC continues to procure an increasing share of goods and services from Inuit-owned businesses with
more than a third of total purchases procured from Inuit-owned businesses. In 2018, all purchases in
Nunavut were made in the Kitikmeot from Inuit-owned firms.
4.5 Business Development
4.5.1 Predictions
The Project will provide contract and subcontract opportunities to Kitikmeot businesses and Inuit Firms.
This will help existing businesses grow and expand in capacity. Also, new businesses may be created
if there is demand for specific goods or services not already available in the Kitikmeot region. This
prediction is investigated for KQB and Inuit Firms in the Kitikmeot region.
4.5.2 Results
Kitikmeot Qualified Businesses
In 2018, there were 35 KQB with 20 KQB in Cambridge Bay, two in Gjoa Haven, five in Kugluktuk and
three in Taloyoak; another four KQB were in Iqaluit and one in Arviat (Table 4.5-1).
Registered Inuit Firms in the Kitikmeot
In February of 2019, there were 70 registered Inuit firms in the business registry maintained by NTI
(Table 4.5-1), an increase from 62 in the previous year. While the number of registered Inuit businesses
increased in Cambridge Bay (from 32 to 41) and Kugaaruk, it decreased in other Kitikmeot communities.
The development of new businesses in Cambridge Bay may have been supported by direct and spinoff
Project impacts (development at the Doris Mine preceding TMAC’s proposed development at Madrid and
Boston sites) or by other mining projects and exploration in the region. A number of businesses provide
services not explicitly related to mining but do service the mining industry. Examples include medical and
safety services, expediting and logistical services, site management, catering, and janitorial services.
A number of these businesses have benefitted from business opportunities associated with the Project.

www.erm.com Version: D.1 Project No.: 0462113-0008 Client: TMAC Resources Inc. May 2019 Page 4-4
HOPE BAY PROJECT 2018 Socio-economic Monitoring Program
CONTRACTING AND BUSINESS EXPENDITURES
Table 4.5-1: Profile of Registered Inuit Firms in the Kitikmeot Region, March 2018
Business Name KQB Business Services Summary
Cambridge Bay – 41 Businesses
Kingaunmiut Services Ltd Aviation Charter, Fuel Supply, Health & Safety, Logistic,
Cargo Shipping, Expediting, Aerodrome Management,
Trucking, Lodging
Kitikmeot Camp Solutions Limited Camp Management & Operations including Hospitality
(food services, janitorial & housekeeping) and
Maintenance (including all utilities)
Nanook Woodworking Ltd. Carpentry and Furniture Manufacturing, Renovation
Kitnuna Projects Inc Construction
Qillaq Construction Inc. Construction and Supplier of Construction materials,
including all Trades
Inukshuk Enterprises Ltd Construction, Cartage, Garage, Property Management,
Arcade
Kalvik Enterprises Incorporated Construction, Renovations, Repairs, Rentals
Ikpik Inc. Consulting Services
Geotech Ekutak Ltd. Drilling and Underground Drilling
Medic North Nunavut Ltd. Emergency Medical Services, Medical Equipment Supply
Kitikmeot BBE Expediting Ltd. Expediting and Logistics
Nunavut Expediting Services Ltd Expediting, Camp Building & Supply
Nunavut Resources Corporation Exploration Finance, Mine-related Infrastructure
Development, Regional infrastructure Development and
Financing, Investment Banking & Corporate Finance
Advisory Services
Kitikmeot Air Ltd Fixed Wing Aircraft Charter Service
Nuna Logistics Limited Freight hauling, Open Pit Mining, Crushing, Training
Services, Mine Site Services & Construction, Mine Site
Infrastructure Rental
5140 Nunavut Ltd General Contracting and Retail Sales of Modular Buildings
Vandenbrink, Clarissa Gift baskets and Event Planning
Kitikmeot Helicopters Ltd Helicopter Contracting Service
Kitikmeot Cleaning Services Janitorial Cleaning & Retail
A&R Cleaning Ltd Janitorial Services
Angulalik, Gwen Language Consulting, Teaching, Interpreting and
Translating
Nunavut Arctic Transportation
Company
Marine Transportation Industry
Kitnuna Pharmacy Ltd Pharmacy Services, Medical Supplies
5364 Nunavut Ltd Plumbing and Heating
Jago Services Inc Plumbing, Heating and Electrical
Kiilliniq Corporation Ltd Property Management

www.erm.com Version: D.1 Project No.: 0462113-0008 Client: TMAC Resources Inc. May 2019 Page 4-5
HOPE BAY PROJECT 2018 Socio-economic Monitoring Program
CONTRACTING AND BUSINESS EXPENDITURES
Business Name KQB Business Services Summary
Kitikmeot Blasting Services Ltd. Provide Explosives and Explosive Related Services
Kitikmeot Region Properties Inc. Real Estate Development
Kitikmeot Corporation Real Estate Development and Management; Mine
Development and Production Services; Other
Aurizon Investments Ltd Real Estate Investment, Residential Housing Complex and
Hotel
5379 Nunavut Ltd. Restaurant
Lyall, Donna Salon
Nuna West Mining Ltd Site Preparation & Infrastructure Development, Construction
Management & Site Earthworks & Infrastructure
Ikaluktutiak Co-operative Ltd. Store, Inns North Hotel
Kitikmeot Tire Mine Service Ltd. Supply Tire and Tire Services and Related Products &
Services
Go Cargo Taxi Limited Taxi & Vehicle Rentals
Otokiak, Amanda Taxi Services & Rentals
Kitnuna Corporation Trade & Services
Kitnuna Petroleum Ltd Trade & Services
Kitikmeot Cementation Underground Mine Development and Production Services
Kitnuna Expediting Services Ltd Expediting, Airport Ground Handling and Purchasing
Services
Gjoa Haven – 8 Businesses
Arktis Piusitippaa Incorporated Engineering, Professional Consulting Services
CAP Enterprises Ltd Heavy Equipment, Construction, Goods and Services for
Gjoa Haven
Porter, Megal and Aglukkaq Sylvia Hotel Accommodations
4660 Nunavut Ltd Outfitting and Tourism
Porter, Wally Renovations, General Construction, Vehicle Rentals,
Property Management
Qikiqtaq Co-operative Ltd Store, Inns North Hotel, Post Office
Porter, Stanley Taxi
Mitqut Construction Inc. Construction
Kugaaruk – 2 Businesses
Guys Arctic Char Harvest and Sell Arctic Char
Koomiut Co-operative Association Store, Inns North Hotel
Kugluktuk – 8 Businesses
Summit Air Kitikmeot Ltd. Air Charter Services including Rotary Wing and Fixed Wing
for Cargo and Passenger Transportation
Atco-5296 Buildings and Services Ltd Camp Projects - Servicers, Facilities Maintenance and
Logistic Services Contractor
Ryfan Kitikmeot Ltd. Construction and Contracting

www.erm.com Version: D.1 Project No.: 0462113-0008 Client: TMAC Resources Inc. May 2019 Page 4-6
HOPE BAY PROJECT 2018 Socio-economic Monitoring Program
CONTRACTING AND BUSINESS EXPENDITURES
Business Name KQB Business Services Summary
Aivgak Services Ltd Convenience Store, Restaurant, Taxi
5296 Nunavut Ltd General Office Support Services
Taps Servicing Professional Cleaning Services
JMS Supplies Ltd Retail Sales of Building Supplies, Residential Furniture,
Recreational Vehicles and Outdoor Equipment
Kugluktuk Co-operative Ltd Store, Cable TV
Kitikmeot Savik Inc. Structural Steel Supply and Installation
Kikiak Contracting Ltd Trade and Services
Akhak Mining Services Ltd. (summary not available)
Taloyoak – 8 Businesses
Aqsaqniq Airways Ltd Air Charter Services
Matrix Kitikmeot Logistics Ltd Camps, Logistics and Aviation Management
Lyall Construction Ltd Gravel Hauling and General Contracting
Boothia Ventures Ltd Hotel
Aqsaqniq Ltd Hotel and Restaurant, Cable, General Contracting
Pizzo-Lyall, John Charles Moving of Mail, Cargo, and Personal Effects
Paleajook Co-operative Ltd Retail, Inns North Hotel, Cable TV, Post Office
Tuqanie Truck Rental Truck Rental
Source: A. Buchan, pers. comm.; NTI (2019)
4.5.3 Interpretation
The Project is believed to have had a positive effect on Kitikmeot business development. In 2018, there
were 70 registered Inuit Firms in the Kitikmeot region of which 30 were KQB. Many businesses in the
Kitikmeot region provide mining services. The development of these businesses may have been
supported by the Project or by other mining projects and exploration in the region. Additionally, there are
businesses whose descriptions are not explicitly related to mining that provide services to the mining
industry, including: medical and safety services, expediting and logistical services, site management,
catering, and janitorial services. A number of these businesses have benefitted from business
opportunities associated with the Project.
4.6 Effects Management and Mitigation
Table 4.6-1 lists the programs and measures designed to mitigate and manage potential effects related to
contracting and business expenditures.

www.erm.com Version: D.1 Project No.: 0462113-0008 Client: TMAC Resources Inc. May 2019 Page 4-7
HOPE BAY PROJECT 2018 Socio-economic Monitoring Program
CONTRACTING AND BUSINESS EXPENDITURES
Table 4.6-1: Contracting and Business Expenditures Management and
Mitigation Measures
Program/Mitigation
Measure
Purpose/Description/Outcome
IIBA The IIBA sets out principles and methods to, among other purposes, maximize Inuit
training, employment and business opportunities arising from the operation of the Project,
and provide a mechanism through which effective communication and cooperation can
take place. Key features of the IIBA include provisions for, among others: promotion of
Inuit content in procurement, including requirement to engage Kitikmeot Qualified
Businesses for certain types of goods and services; bid preparation training program for
Inuit; offering contracts open only to Kitikmeot Qualified Businesses; and establishment of
a Business Development Fund to invest in building the capacity for Inuit business
development in the Kitikmeot region.
TMAC Liaison TMAC Liaison will work with the appropriate TMAC department to, among other
responsibilities, assist TMAC to maximize Kitikmeot Qualified Business procurement
by identifying businesses interested in procurement opportunities, considering
opportunities for capacity building and development and assisting Kitikmeot Qualified
Businesses to access available business opportunities.
Community
Involvement Plan
TMAC will maintain communications with Kitikmeot communities over the life of the
Project, and share information to assist in the development of collaborative adaptive
management measures, should unanticipated impacts arise and mitigation be required.
Communication TMAC will communicate Project’s schedule to ensure that local governments, local and
regional businesses and other interested institutions/organizations are aware of Project
activities as well as any opportunities that can contribute to business growth in the
Kitikmeot region. TMAC will:
provide assistance, feedback, information, and lead time to contractors from the
Kitikmeot communities on bids and bidding policies;
require and monitor local content plans on major bids;
waive bond provisions at tender for Inuit owned businesses;
provide annual business opportunities forecast; and
promote awareness of procurement opportunities within the Kitikmeot region.

www.erm.com Version: D.1 Project No.: 0462113-0008 Client: TMAC Resources Inc. May 2019 Page 5-1
HOPE BAY PROJECT 2018 Socio-economic Monitoring Program
EMPLOYMENT
5. EMPLOYMENT
5.1 Overall Employment
5.1.1 Predictions
The Project will provide a number of employment opportunities in construction and operation, including
employment for on-site and off-site workers, as well as contractors. Success will be reflected by the total
workforce size and effort.
5.1.2 Results
Workforce Size
Figure 5.1-1 shows the total and average number of on-site workers for TMAC and contractors. The total
number of workers has been increasing with an increase in operating activities and as many as
598 workers in 2017 and 20183. The average number of on-site workers was highest in 2018 Q3 at
268 workers, an increase of 35% since 2017 Q3. Off-site employment included three full-time positions
in the Cambridge Bay office and seasonal staff, if required (A. Buchan, pers. comm.). Total TMAC
workforce as of December 31, 2018 was 254 workers.
Workforce Effort
Project workforce effort is trending upward with a six-fold increase over the last five years in the total
annual hours worked. The average hours worked per worker were 2,033 in 2018, slightly below a full-time
position of 2,080 hours per year, however representing a 30% increase in average hours worked since
2017 (Table 5.1-1).
Table 5.1-1: Workforce Effort by Project Employees and Contractors, 2014 to 2018
2014 2015 2016 2017 2018
Total annual hours worked 195,876 295,284 697,272 815,412 1,126,932
Average hours per worker 1,567 1,588 1,638 1,566 2,034
Source: A. Buchan, pers. comm.
5.1.3 Interpretation
Project activities resumed in April 2013 and included site maintenance, environmental compliance
monitoring, and exploration work. Relative employment increased in 2014 from 2013 due to the size of
the exploration program. In 2014, environmental compliance monitoring work continued. In 2015 and
2016, work at the site increased substantially with focus on a path to production. In 2017, TMAC
commenced commercial production at the Doris mine. The total employment has been significantly
increasing with an increase in the Project on-site activities and production.
3 Workforce size and effort are calculated using monthly Hope Bay Headcount sheets that track on-site presence of Project
employees (both TMAC and contractors). Those estimates also include visitors, and do not take into account employees that may
be on leave or otherwise employed but not on site during a reporting period. A new system has been developed for each separate
employer that will be better able to track total employment going forward.

Figure 5.1-1: Number of Project Employees and Contractors, 2014 to 2018
www.erm.com Project No.: Client: Graphics: HB-19ERM-005a0462113 TMAC RESOURCES INC.
7
48
75
35 21 58
90 99 106
146 16
2 178
167
171
199
157
234
264
268
263
21
135
167 17
7
88
134
244
278
276
406
533
488 50
1 512
598
472
544
576 59
8
590
0
100
200
300
400
500
600
700
Q1 Q2 Q3 Q4 Q1 Q2 Q3 Q4 Q1 Q2 Q3 Q4 Q1 Q2 Q3 Q4 Q1 Q2 Q3 Q4
2014 2015 2016 2017 2018
Average on Site (workers at any one time)Total on Site (individual workers)

www.erm.com Version: D.1 Project No.: 0462113-0008 Client: TMAC Resources Inc. May 2019 Page 5-3
HOPE BAY PROJECT 2018 Socio-economic Monitoring Program
EMPLOYMENT
5.2 Inuit and Kitikmeot Employment
5.2.1 Predictions
The Project will provide employment to residents of the Kitikmeot region. As outlined in the IIBA, priority to
hiring employees at the Hope Bay Project is in the following order: 1) Kitikmeot Inuit and other Nunavut
Inuit residents in the Kitikmeot region; 2) all other Kitikmeot and Nunavut Inuit; 3) residents of the
Kitikmeot region; and 4) all others. Success will be reflected in the workforce effort by Inuit and Kitikmeot
residents and their share of total employment.
5.2.2 Results
Workforce Size
In 2018, there were as many as 51 Kitikmeot Inuit working at the Project, representing 7% to 10% of the
total workforce size (Figure 5.2-1). There were also up to 14 Inuit from outside of the Kitikmeot region
working at the Project, comprising on average 2% of the total workforce. Other regional workforce
consisted of one non-Inuit Kitikmeot resident. TMAC workforce as of December 31, 2018 included 23 Inuit
workers, representing 9% of total TMAC workforce.
Workforce Effort
Total workforce effort by Inuit workers remained relatively unchanged between 2017 and 2018, however
with different composition (Table 5.2-1). In 2018, the workforce effort by Kitikmeot Inuit decreased
compared to 2017, while it increased for Kitikmeot Inuit living elsewhere. In general, Inuit workforce effort
comprised 10% of the total workforce effort.
Table 5.2-1: Project Workforce Effort (Employees and Contractors), 2015 to 2018
2015 2016 2017 2018
Total annual hours
worked
Kitikmeot Inuit 27,204 76,920 98,376 87,552
Kitikmeot Inuit living elsewhere 5,688 12,288 14,040 24,312
Other regional workforce - - - 2,256
Average hours
per worker
Kitikmeot Inuit - - - 2,009
Kitikmeot Inuit living elsewhere - - - 2,282
Other regional workforce - - - 2,256
Percent of total
hours worked
Kitikmeot Inuit 9% 12% 12% 8%
Kitikmeot Inuit living elsewhere 2% 2% 2% 2%
Other regional workforce - - - 0.2%
Source: A. Buchan, pers. comm.
Kitikmeot Workers by Community
By community, up to 24 workers were from Cambridge Bay, 11 from Kugluktuk, nine from Gjoa Haven,
eight from Kugaaruk and six from Taloyoak (Figure 5.2-2).
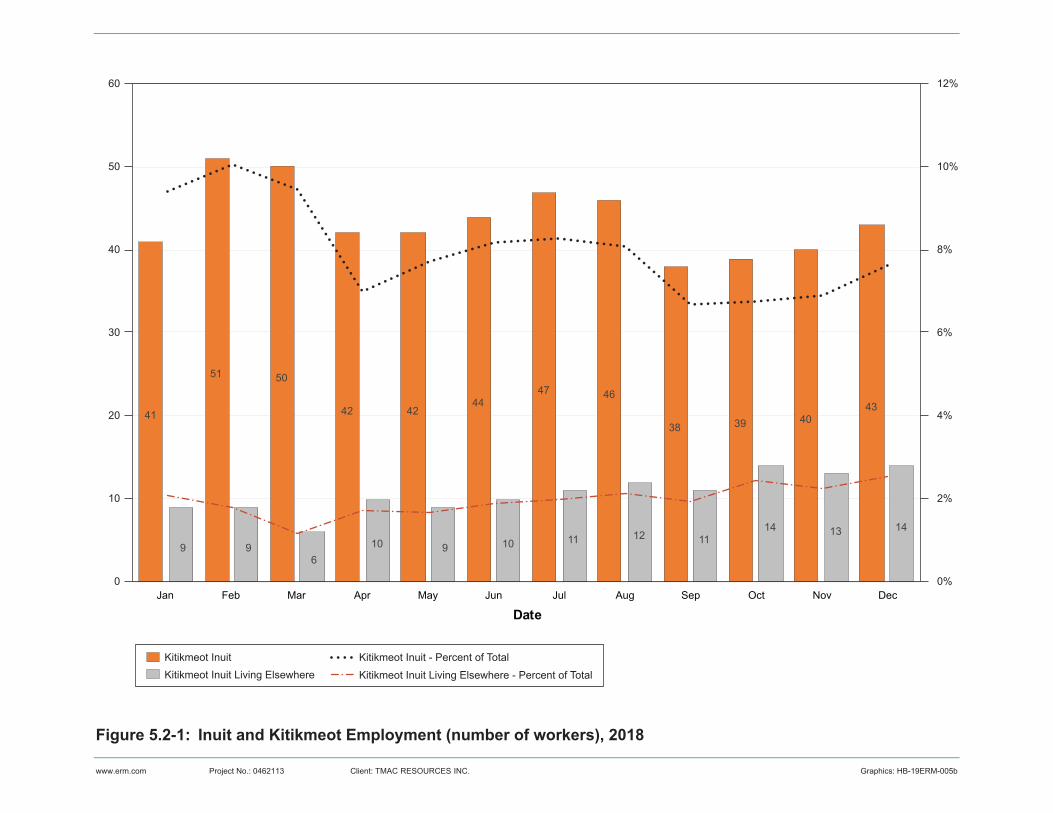
Figure 5.2-1: Inuit and Kitikmeot Employment (number of workers), 2018
www.erm.com Project No.: Client: Graphics: HB-19ERM-005b0462113 TMAC RESOURCES INC.
Jan Feb Mar Apr May Jun Jul Aug Sep Oct Nov Dec
Date
41
51 50
42 4244
47 46
38 39 4043
9 96
10 9 10 11 12 1114 13 14
0%
2%
4%
6%
8%
10%
12%
0
10
20
30
40
50
60
Kitikmeot InuitKitikmeot Inuit Living Elsewhere
Kitikmeot Inuit - Percent of Total
Kitikmeot Inuit Living Elsewhere - Percent of Total

Figure 5.2-2: Kitikmeot Workers by Community, 2018 (Source: A. Buchan, pers. comm.)
www.erm.com Project No.: Client: Graphics: HB-19ERM-005c0462113 TMAC RESOURCES INC.
2124
2018 17
1921 21
1620
22 22
6
8
9
87
87 8
7
4
59
3
58
56
66 3
44
2
16
10 10
119
910
10
8 68
8
6
53
2
3
2
34
3 53
3
0%
2%
4%
6%
8%
10%
12%
0
10
20
30
40
50
60
Jan Feb Mar Apr May Jun Jul Aug Sep Oct Nov Dec
Date
Cambridge Bay Gjoa Haven KugaarukPercent of TotalKugluktuk Taloyoak

www.erm.com Version: D.1 Project No.: 0462113-0008 Client: TMAC Resources Inc. May 2019 Page 5-6
HOPE BAY PROJECT 2018 Socio-economic Monitoring Program
EMPLOYMENT
5.2.3 Interpretation
As affirmed by the IIBA signed in March of 2015, TMAC is committed to maximize Inuit employment. This
includes priority for hiring Kitikmeot Inuit and other Nunavut Inuit residents in the Kitikmeot region and all
other Kitikmeot and Nunavut Inuit, followed by hiring residents of the Kitikmeot region and others (KIA &
TMAC 2015).
In 2018, there were as many as 51 Kitikmeot Inuit working at the Project, representing 7% to 10% of the
total workforce size. Census data collected in 2016 informs that 50 people worked in mining in the
Kitikmeot region, representing about 2% of all employment by North American Industry Classification
System (NAICS); the regional unemployment rate was 28% that year (GC 2019a).
TMAC has been successful in engaging Inuit as part of the Project workforce and will continue its efforts
to increase the share of Inuit employment. Some contractors have employed a smaller proportion of Inuit,
and TMAC expects that they will significantly improve employment of Inuit. Through the provisions of the
IIBA regarding the use of KQB, it is expected that the employment of Inuit by contractors will increase.
5.3 Gender Equity
5.3.1 Predictions
TMAC is committed to gender equality. Women will be encouraged to enter into the non-traditional role of
working in the mining sector. Success will be reflected in the workforce effort by women and Inuit women
and their share of total employment.
5.3.2 Results
Workforce Effort by Women
For 2015 and 2016, women represented approximately 7% of the total hours worked by TMAC and
contractors, and 9% in 2017 (Table 5.3-1). In 2018, although the workforce effort by women increased,
proportionally, the share of workforce effort by women decreased to 8%.
Table 5.3-1: Workforce Effort by Women, 2015 to 2017
2015 2016 2017 2018
Total hours worked 21,096 47,088 69,912 87,468
Percentage of total 7% 7% 9% 8%
Source: A. Buchan, pers. comm.
Workforce Effort by Inuit Women
In 2018, workforce effort by Inuit women was 30,648 hours, or 3% of total workforce effort. This type of
data for previous years is not available.
5.3.3 Interpretation
Since 2015, female participation has been relatively low, representing less than 10% of the total
workforce effort. TMAC expects to the have the opportunity to hire more women and increase the number
of hours worked by women as the Project advances. Further improvements are expected over time.
Nationally, women are also underrepresented in the mining industry and account for only 16% of the total
mining labour force (MiHR 2019).
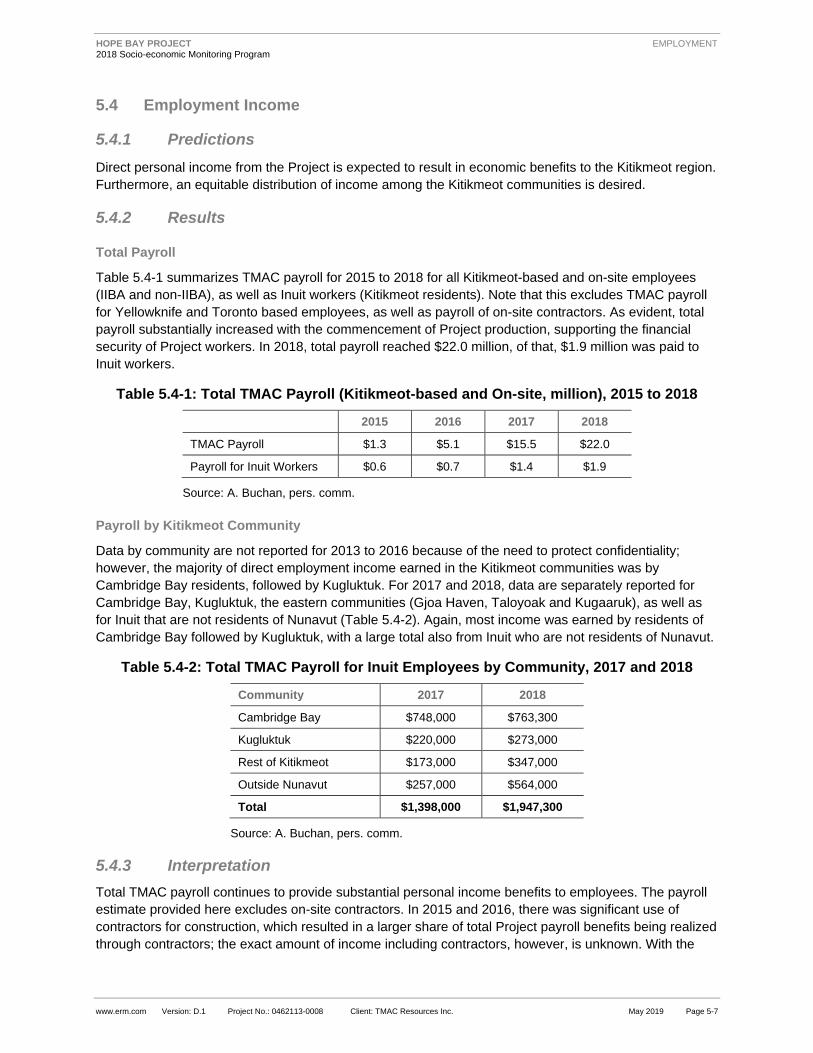
www.erm.com Version: D.1 Project No.: 0462113-0008 Client: TMAC Resources Inc. May 2019 Page 5-7
HOPE BAY PROJECT 2018 Socio-economic Monitoring Program
EMPLOYMENT
5.4 Employment Income
5.4.1 Predictions
Direct personal income from the Project is expected to result in economic benefits to the Kitikmeot region.
Furthermore, an equitable distribution of income among the Kitikmeot communities is desired.
5.4.2 Results
Total Payroll
Table 5.4-1 summarizes TMAC payroll for 2015 to 2018 for all Kitikmeot-based and on-site employees
(IIBA and non-IIBA), as well as Inuit workers (Kitikmeot residents). Note that this excludes TMAC payroll
for Yellowknife and Toronto based employees, as well as payroll of on-site contractors. As evident, total
payroll substantially increased with the commencement of Project production, supporting the financial
security of Project workers. In 2018, total payroll reached $22.0 million, of that, $1.9 million was paid to
Inuit workers.
Table 5.4-1: Total TMAC Payroll (Kitikmeot-based and On-site, million), 2015 to 2018
2015 2016 2017 2018
TMAC Payroll $1.3 $5.1 $15.5 $22.0
Payroll for Inuit Workers $0.6 $0.7 $1.4 $1.9
Source: A. Buchan, pers. comm.
Payroll by Kitikmeot Community
Data by community are not reported for 2013 to 2016 because of the need to protect confidentiality;
however, the majority of direct employment income earned in the Kitikmeot communities was by
Cambridge Bay residents, followed by Kugluktuk. For 2017 and 2018, data are separately reported for
Cambridge Bay, Kugluktuk, the eastern communities (Gjoa Haven, Taloyoak and Kugaaruk), as well as
for Inuit that are not residents of Nunavut (Table 5.4-2). Again, most income was earned by residents of
Cambridge Bay followed by Kugluktuk, with a large total also from Inuit who are not residents of Nunavut.
Table 5.4-2: Total TMAC Payroll for Inuit Employees by Community, 2017 and 2018
Community 2017 2018
Cambridge Bay $748,000 $763,300
Kugluktuk $220,000 $273,000
Rest of Kitikmeot $173,000 $347,000
Outside Nunavut $257,000 $564,000
Total $1,398,000 $1,947,300
Source: A. Buchan, pers. comm.
5.4.3 Interpretation
Total TMAC payroll continues to provide substantial personal income benefits to employees. The payroll
estimate provided here excludes on-site contractors. In 2015 and 2016, there was significant use of
contractors for construction, which resulted in a larger share of total Project payroll benefits being realized
through contractors; the exact amount of income including contractors, however, is unknown. With the

www.erm.com Version: D.1 Project No.: 0462113-0008 Client: TMAC Resources Inc. May 2019 Page 5-8
HOPE BAY PROJECT 2018 Socio-economic Monitoring Program
EMPLOYMENT
start of operation in 2017, the share of contractor employment decreased as the number of direct TMAC
employees increased. The Project also made significant contributions to incomes in the Kitikmeot region,
increasing considerably from previous years with the start of operation.
5.5 Employee Retention
5.5.1 Predictions
Some workers and their families may find rotational employment stressful, leading to termination of
employment (voluntary turnover). Low turnover rates for non-Inuit and Inuit employee are desired.
5.5.2 Results
Employee turnover rate is calculated as the number of permanent employee terminations divided by the
number of permanent employees at the end of the period. Annual turnover rate for all employees was 35%
in 2017 and 17% in 2018. For Inuit employees, it was 105% for 2017 and 43% for 2018 (Table 5.5-1).
Table 5.5-1: Turnover Rate for All Employees and for Inuit Employees, 2017 and 2018
2017 2018
Q1 Q2 Q3 Q4 Q1 Q2 Q3 Q4
All Permanent
Employees
7% 10% 7% 12% 6% 6% 4% 4%
Inuit Employees 11% 45% 24% 32% 9% 8% 12% 13%
Source: A. Buchan, pers. comm.
5.5.3 Interpretation
Turnover rate in the mining industry averages at 10%, with 5% representing terminations and layoffs,
3% representing voluntary turnover and 2% representing retirement (MiHR 2017). However, remote mining
operations experience turnover higher than industry average due to the remote and rotational nature of the
work. Employee turnover rate for all Project employees falls within what would be expected for a project of
this type. Turnover rates for Inuit workers tend to be substantially higher, however, with an improvement in
2018. Challenges in employee retention in the mining industry are not uncommon for remote camps with
rotational schedules and are often attributed to the remoteness of the mine and the need of long commute,
as well as emotional stress resulting from being away from family and friends.
5.6 Worker Health and Safety
5.6.1 Predictions
Project-related workplace accidents measured as lost time incidents and utilization of site medic should
be minimal in number and severity.
5.6.2 Results
Lost Time Incidents
Number of lost time incidences and the lost workday incident rate are shown in Table 5.6-1. The number
of lost time incidents was highest in 2017 with six incidents and the highest incident rate of 97.9. In
addition to lost time incidents, there were seven modified work days in 2017. In 2018, there was only
one lost time incident.

www.erm.com Version: D.1 Project No.: 0462113-0008 Client: TMAC Resources Inc. May 2019 Page 5-9
HOPE BAY PROJECT 2018 Socio-economic Monitoring Program
EMPLOYMENT
Table 5.6-1: Hope Bay Project Lost Time Incidences
Year Number of Lost Time
Incidences
Total Lost
Time (days)
Lost Workday
Incident Rate
2014 3 58 59.2
2015 0 0 0.0
2016 1 1 0.3
2017 6 399 97.9
2018 1 68 12.1
Source: A. Buchan, pers. comm.
Note: Lost work incident rate is the number of lost workday cases times 200,000 divided by hours worked; it returns the number of days lost from work due to work related injury or illness for every 100 employees.
Utilization of Site Medic
In 2017, there were 72 injuries that required medical or first aid, while in 2018 there were 73 injuries
(Table 5.6-2).
Table 5.6-2: Hope Bay Project Injuries
2017 2018
Restricted Work Injury (RWI) 0 3
Medical Aid Injury (MAI) 3 2
First Aid Injury (FAI) 69 68
Total 72 73
Total per capita1 0.12 0.12
Source: A. Buchan, pers. comm.
1 Per the total number of on-site workers.
5.6.3 Interpretation
The number of lost time incidents was highest in 2017 at six, decreasing to one incident in 2018. TMAC
maintains a highly safety-conscious work environment and a rigorous safety program. TMAC is committed
to avoiding workplace accidents; all lost time incidences are investigated and corrective actions identified
and implemented. The company promotes a Zero Harm culture, as it believes that all injuries and
accidents are preventable.
5.7 On-the-job Training
5.7.1 Predictions
TMAC is committed to providing training for workers to maximize their abilities and opportunities for
career advancement. On-the-job training is measured as the number of on-the-job training courses
delivered to non-Inuit and Inuit workers.

www.erm.com Version: D.1 Project No.: 0462113-0008 Client: TMAC Resources Inc. May 2019 Page 5-10
HOPE BAY PROJECT 2018 Socio-economic Monitoring Program
EMPLOYMENT
5.7.2 Results
On-the-job Training Courses
Table 5.7-1 summarizes on-the-job training courses for 2013 through 2017 related to safety, mobile
equipment use and underground mining4.
Table 5.7-1: On-the-job Training Courses, 2013 to 2017
Year Topic Area Number of Workers Trained Number of Training Sessions
2013 Various, including Safety 118 527
2014 Various, including Safety 138 494
2015 Safety 314 2,235
Mobile Equipment 211 965
Underground Mining 59 340
2016 Safety 655 3,282
Mobile Equipment 375 1,482
Underground Mining 61 443
2017 Safety 1,458 3,809
Mobile Equipment 501 1,440
Underground Mining 118 342
Source: A. Buchan, pers. comm.
In 2018, TMAC delivered 7,343 hours of training to non-Inuit individuals that consisted of site general
orientation, mill and mine orientation, light vehicle and mobile equipment operation, as well as general
training5 (Table 5.7-2). In addition, 1,218 hours of HR-related training was delivered to Project employees.
HR-related training consisted of Social Media Policy, Cultural Awareness Training, Respectful Workplace
Policy Presentation, Fitness for Work Policy Presentation, and Niagara Supervisory training.
Table 5.7-2: Training Delivered by TMAC to Non-Inuit Workers in 2018
Type Number of Workers Trained Hours of Training
Site Orientation 553 2,765
Mill Orientation 91 455
Mine Orientation 27 125
General 183 1,464
Light Vehicle 245 980
Mobile Equipment 177 708
WHMIS 423 846
Total 1,699 7,343
Source: A. Buchan, pers. comm.
4 Safety training sessions typically include firefighting tests, bear training, first aid, and others. Mobile equipment training includes
training with Ford pickups, snow mobile, personal mobile equipment (PME), telehandler, genie lift, tucker, rimpull, and others.
Underground mine training include training for site-specific equipment, underground hard rock mining, specialty hard rock common
core modules, first line underground mine supervisory, and generic first line supervisor.
5 General training included Lock Out / Tag Out, Confined Space, Fall Arrest, Respirator Care and Use, and similar.

www.erm.com Version: D.1 Project No.: 0462113-0008 Client: TMAC Resources Inc. May 2019 Page 5-11
HOPE BAY PROJECT 2018 Socio-economic Monitoring Program
EMPLOYMENT
Additional training was delivered by contractors and included general, health & safety and job-specific
training.
Inuit Participation in On-the-job Training Courses
TMAC remains committed to the ongoing training of workers in keeping with their interests to maximize
their abilities and opportunities for career development. In 2018, TMAC provided 133 hours of general
training to Inuit workers, 213.5 hours of health & safety related training, and 8,290 hours of work-related
training6 (Table 5.7-3). Seventeen individual Career Development Plans were developed for TMAC Inuit
employees. In addition, 44 hours of HR-related training was delivered to Project employees. HR-related
training consisted of Social Media Policy, Cultural Awareness Training, Respectful Workplace Policy
Presentation, and Fitness for Work Policy Presentation.
Table 5.7-3: Training Delivered by TMAC to Inuit Workers in 2018
Department General Health & Safety Specific
Electrical 7 10 290
Environment 15 0 62
Exploration 5 96 4
Maintenance 0 2 100
Mill 96 86 5,976
Site Services 10 19.5 1,808
Warehouse 0 0 50
Total 133 213.5 8,290
Source: A. Buchan, pers. comm.
Additional training was delivered by contractors and included job shadowing and job-specific training.
5.7.3 Interpretation
A substantial amount of on-the-job training has been provided to Project workers, including Inuit workers.
Training is based on job needs and existing skills.
Through the IIBA signed in March of 2015, TMAC is committed to maximizing Inuit training arising from
the Hope Bay Project. Training opportunities may include on-the-job technical training and skills
development in a variety of areas such as underground mining, surface operations, mill processing,
geotechnical, and environmental. TMAC will also allow trades training on-site. Additionally, the IIBA
commits TMAC to developing Career Development Plans for all Inuit employees (KIA & TMAC 2015).
6 General training included site and mill orientation. Health & safety training included fall arrest, confine space, chemical awareness,
emergency response, first aid, lock out tag out, WHMIS refresher, respirator care & maintenance, mill evacuation, and caustic review.
Work-related (specific) training included: batch ILR resin, breaking reagent containing lines, cleaning magnet, conveyor safety, crushing
circuit, reagent circuit, sample collection, sodium cyanide mix, site drivers, kubota light vehicle, pick up, aerial work platform, mine cat,
scissor lift, aircraft ground crew, aircraft ramp, tele handler, loaders, skid steer, snow mobile, waste management, fork lift, reach stacker,
aircraft de-icing, fuel transfer sealift, and overhead crane.

www.erm.com Version: D.1 Project No.: 0462113-0008 Client: TMAC Resources Inc. May 2019 Page 5-12
HOPE BAY PROJECT 2018 Socio-economic Monitoring Program
EMPLOYMENT
5.8 Apprenticeships
5.8.1 Predictions
There is no specific Project prediction identified as related to apprenticeship positions for non-Inuit and
Inuit. However, apprenticeship position might be offered at the Project, leading to an increase in
transferable skills.
5.8.2 Results
No apprenticeship roles were awarded in 2013, 2014, or 2015. However, in 2015 TMAC provided in-kind
support to Geotech Egutak to deliver their diamond drill-training program. Similarly, no apprenticeships
were offered in 2016 or 2017. In 2018, a warehousing apprenticeship was identified for an Inuit employee
of TMAC and efforts have been made with the GN and the Government of Alberta to register this applicant.
TMAC plans to look at opportunities for long-term trades training and apprenticeships at the site.
5.8.3 Interpretation
One warehousing apprenticeship has been identified for an Inuit employee of TMAC. One apprenticeship
position has been created thus far. Efforts have been made but have been hampered due to the
challenges registering apprenticeships in other jurisdictions when the apprenticeship is not registered
in Nunavut.
5.9 Skill Levels
5.9.1 Predictions
The Project is expected to provide employment opportunities to Inuit. Although it is desirable to realize
employment across a range of job categories, it is expected that Inuit employment will, at least initially,
be concentrated in positions reflecting current labour force experience.
5.9.2 Results
Inuit Employees by Job Category
Table 5.9-1 provides a summary of skill level of Inuit workers employed by TMAC, Kitikmeot Camp
Solutions and Nuna West in 2018. All three companies achieved Inuit participation as a share of total
employment. Inuit comprised 11% of all TMAC’s employees, 45% of Kitikmeot Camp Solutions
employees, and 25% of Nuna West employees. Additionally, Inuit share of workforce was 9% at GeoTech
and 5% at Kitikmeot Cementation; skill level information is not available for these two subcontractors.
Inuit employees held a mix of unskilled, semi-skilled and skilled positions, while being underrepresented
in professional and management positions.
Inuit Employees by Department
In 2013, after the acquisition by TMAC, most employment, including Kitikmeot Inuit employment, was
concentrated between two job categories: geology and environment. The distribution of TMAC employees
between these two categories was approximately equal. All other employment was contract-related.
In October of 2013, two Inuit employees were permanently employed in Community and External Affairs,
and the balance of TMAC Inuit employees were employed in geology and environment.

www.erm.com Version: D.1 Project No.: 0462113-0008 Client: TMAC Resources Inc. May 2019 Page 5-13
HOPE BAY PROJECT 2018 Socio-economic Monitoring Program
EMPLOYMENT
Table 5.9-1: Inuit Workers (Employees and Contractors) by Category, 2018
Job Category TMAC Kitikmeot Camp Solutions Nuna West
Inuit
Employees
Inuit Share
(est.)
Inuit
Employees
Inuit Share Inuit
Employees
Inuit Share
Unskilled 14 100% 9 100% 0 0%
Semi Skilled 15 65% 23 48% 0 0%
Skilled 5 3% 2 14% 27 26%
Professional 2 4% 0 0% 0 0%
Management 1 2% 0 0% 0 0%
Total 37 12% 34 45% 27 25%
Source: A. Buchan, pers. comm.
Notes: Estimates include all Inuit workers hired in 2018. Consequently, ‘Inuit Share’ is the share of all Inuit hired in 2018 as a percentage of all employees hired in 2018. However, it is important to note that some employees resigned or were dismissed and the resulting share of active Inuit employees, as a percentage of total employment, might be different. Additionally, the Inuit share of total employment based on the number of workers for contractors is higher than the share based on the number of hours worked, because employment tenure is typically shorter for Inuit workers compared to non-Inuit workers due to resignations or terminations.
In 2015, Inuit workers employed by TMAC and TMAC’s contractors worked mainly in site services,
exploration, and environment. For site services, the number of Inuit workers varied from three to 17 at any
one time; for exploration, there were between two and 14 workers; for environment, there were three or
fewer workers at any one time. Inuit workers employed directly by TMAC worked in environment and
External and Community Relations, with as many as five employees in environment and three in External
and Community Relations in peak months.
For 2016, 2017, and 2018, the number of Inuit workers in each job category is shown in Table 5.9-2.
In 2016, most Inuit workers were in construction and site services, followed by underground mining and
exploration. In 2017 and 2018, with the initiation of production, most Inuit workers were in site operations
and site services, and to a lesser degree in exploration and underground mining. Further, in 2018, TMAC
began recruitment for the Surface Operations Trainee positions. These include working within the Site
Services, Waste Management and Power House departments.
5.9.3 Interpretation
In 2018, Inuit employees held a mix of unskilled, semi-skilled and skilled positions, while being
underrepresented in professional and management positions. This is consistent with predictions for this
indicator. By departments, Inuit employees mostly worked in site services, followed by site operations,
exploration and mining.
Inuit employment continues to be diverse across work areas. The range of duties discharged by Inuit at
site reflects the labour force experience, on-the-job training efforts by TMAC, and Project needs. The
move from construction in 2016 to operation in 2017 is reflected in the distribution of job types. TMAC
expects this to evolve further over time as Inuit increasingly obtain relevant skills as well as awareness
the variety of employment opportunities available at the Project.

www.erm.com Version: D.1 Project No.: 0462113-0008 Client: TMAC Resources Inc. May 2019 Page 5-14
HOPE BAY PROJECT 2018 Socio-economic Monitoring Program
EMPLOYMENT
Table 5.9-2: Inuit Workers (Employees and Contractors) by Department,
2016, 2017, and 2018
Job Category Number of Inuit Workers Inuit Share of Total
2016 2017 2018 (est.) 2018 (est.)
Logistics 3 0 0 0%
Exploration 9 1 10 13%
Construction 23 0 0 0%
Site Operations 7 30 15 8%
Site Services 32 56 71 37%
Mining 11 15 9 5%
Environment 3 2 5 56%
External and Community Relations 3 3 3 N/A
Health & Safety, Other 0 0 0 0%
Total 91 107 113 16%
Source: A. Buchan, pers. comm.
Notes: Includes all active and inactive employees. Based on employment for TMAC, Geotech, Nuna West, Kitikmeot Camp Supplies, and Kitikmeot Cementation. N/A-Not available.
5.10 Retention of Skilled Workers in Community Roles
5.10.1 Predictions
The Project is expected to offer relatively well-paying jobs and will require workers with skills and
experience also required by other employers in local and regional communities. As a result, local and
regional employers may find it difficult to find workers with the necessary skills. However, it is also
predicted that those with a full-time job may be reluctant to leave it for a job at the Project because of the
relatively short-term duration of the work and/or the requirement to be away from home for work rotations.
5.10.2 Results
There were no previous hamlet employees working for the Project in 2013 or 2014. In 2015 and 2016,
there was a number of on-site contract staff with extensive heavy equipment experience, some of whom
have worked for the Hamlets of Kugluktuk and Cambridge Bay on a casual basis. It is possible that some
on-site contract staff may have previously been employed as drivers for hamlet water and sewer services.
There were no known previous hamlet employees working for the Project in 2017. For 2013 through
2017, data on other local and regional businesses and their ability to retain workers were not collected.
Four Inuit workers hired at the Project in 2018 were previously in casual or on call roles, mainly in Water
and Sewer Departments at Hamlets. Common explanation provided for leaving employment in community
for employment at the mine was under-employed (not getting enough hours of work).
5.10.3 Interpretation
The Project has a positive impact on unemployment in the Kitikmeot communities. Since 2013, few skilled
workers have left employment in community for employment at the mine. This implies that workers hired
by the Project were from the pool of unemployed. In 2018, the reason cited for leaving community
employment was working less than full-time.

www.erm.com Version: D.1 Project No.: 0462113-0008 Client: TMAC Resources Inc. May 2019 Page 5-15
HOPE BAY PROJECT 2018 Socio-economic Monitoring Program
EMPLOYMENT
5.11 Effects Management and Mitigation
Table 5.11-1 lists the programs and measures designed to mitigate and manage potential effects related
to employment.
Table 5.11-1: Employment Management and Mitigation Measures
Program/Mitigation
Measure
Purpose/Description/Outcome
IIBA The IIBA sets out principles and methods to, among other purposes, maximize Inuit
training, employment and business opportunities arising from the operation of the Project,
and provide a mechanism through which effective communication and cooperation can
take place. Key features of the IIBA related to employment include provisions for, among
others: setting annual Inuit employment targets; and first opportunity to resident Kitikmeot
Inuit for employment, followed by non-resident Inuit.
Human Resources
Plan
The Human Resources Plan supports the provisions of the IIBA and, more broadly,
provides a framework for human resources management at the Hope Bay Project which
ensures that the needs of all TMAC personnel are addressed throughout the life of the
Project. The Plan addresses human resources, Inuit employment, education and
orientation and employee wellness. In conjunction with the IIBA, specific measures
include, among others: to build cultural awareness and enforce harassment policies;
promote awareness of employment opportunities within Kitikmeot communities;
collaborate with training institutions; develop and implement a recruitment strategy;
career development plans for Inuit employees; collaborate and partner with relevant
agencies and contractors to ensure skill requirements are being met; and collaborate with
education and training providers to develop training programs geared toward the long-
term employment of women in non-traditional occupations.
Community
Involvement Plan
TMAC will maintain communications with Kitikmeot communities over the life of the
Project, and share information to assist in the development of collaborative adaptive
management measures, should unanticipated impacts arise and mitigation be required.
TMAC will also host a community information and career awareness session in all
Kitikmeot communities at least annually. Information will be provided to communities on:
labour needs of the Project; skills, behaviours and qualifications required for employment
at the Project; available training opportunities and educational support programs; and
career opportunities in related fields.
Health and Safety
Management Plan
The purpose of this plan is to detail the Health Safety and Loss Prevention (HSLP)
policies and systems adopted by TMAC and to provide the framework for their
implementation. The TMAC Management Team is committed to providing a healthy and
safe working environment for all personnel. The objectives are: to have all personnel
appropriately trained, responsible and accountable for safety management; to incorporate
industry best practice for health and safety standards in the engineering, design and
processes implemented at all workplaces; to comply with all relevant standards and
codes of practice, and regulatory requirements; and to provide effective training, efficient
communication and continuous review of occupational health and safety practices.
Communication
with GN
TMAC will provide the GN updated information regarding the labour force needs of the
Project.

www.erm.com Version: D.1 Project No.: 0462113-0008 Client: TMAC Resources Inc. May 2019 Page 6-1
HOPE BAY PROJECT 2018 Socio-economic Monitoring Program
EDUCATION AND TRAINING
6. EDUCATION AND TRAINING
6.1 Availability of Post Secondary Education
6.1.1 Predictions
The Project could improve the availability of post-secondary education in the Kitikmeot region. Residents
and youth seeking to take advantage of Project related employment could increase the demand for
post-secondary education, increasing the ability of Nunavut Arctic College (NAC) to provide more courses
and programs targeting employment in the mining industry.
6.1.2 Results
In the Kitikmeot region, post-secondary education is offered by the NAC, with a central campus is in
Cambridge Bay. NAC is responsible for all college programming and provides programs in all Kitikmeot
communities through Community Learning Centres. Programs offered through the NAC include trades,
certificates and diplomas, career development, academic studies, and continuing education.
The 2019-2020 program informs that the Kitikmeot NAC campus is not currently offering any mining-
related courses (Acbayaan 2019). Trades courses such as electrician, underground miner certificate, and
pre-apprenticeships are offered in Rankin Inlet, while diploma in environmental technology is offered in
Pond Inlet and Iqaluit.
In previous years (2016/2017 school year), the Kitikmeot Campus offered a two-year Environmental
Technology Program and camp cook training (NAC 2016).
6.1.3 Interpretation
There are currently no mining-related programs offered in the Kitikmeot region. However, there have
been a number of short-term mine related training offerings in the region.
6.2 Participation in Post Secondary Education
6.2.1 Predictions
The Project could affect enrolments of Kitikmeot students in post-secondary education. The effect is
predicted to be positive, with an increasing number of students choosing to enrol and graduate to then be
able to take advantage of the Project related employment opportunities.
6.2.2 Results
Enrollment in the NAC Kitikmeot campus has increased from 170 full-time students in 2012 to 208 in
2016. In the 2016/2017 school year, the Kitikmeot Campus offered a two-year Environmental Technology
Program with ten enrolled students and camp cook training with eight enrolled (NAC 2016).
6.2.3 Interpretation
Most recent enrollment data by community and NAC program type are not available.
6.3 Investment in Education
6.3.1 Predictions
TMAC will support investments in school-based initiatives. Support can include the provision of financial
support, school material and/or in kind support.

www.erm.com Version: D.1 Project No.: 0462113-0008 Client: TMAC Resources Inc. May 2019 Page 6-2
HOPE BAY PROJECT 2018 Socio-economic Monitoring Program
EDUCATION AND TRAINING
6.3.2 Results
Investment in school-based initiatives in 2018 included:
Career Awareness Sessions hosted in each Kitikmeot High School – $45,000.
High School Awards (cash prizes, plaques and air charter site for recipients) – $29,500.
Mining Matters events delivered in three out of five Kitikmeot High Schools – $11,000.
Information is not available for prior years.
6.3.3 Interpretation
In 2018, TMAC spent an estimated $85,500 to support school-based initiatives including Career
Awareness Sessions, High School Awards, and Mining Matters events. The ability of TMAC to make
investments in Education in the region has been hampered by the inability to obtain approval from local
District Education Authorities and Education officials to deliver Mining Matters programming in both Gjoa
Haven and Kugaaruk.
6.4 Understanding of Employment Opportunities
6.4.1 Predictions
TMAC will host community outreach events such as community information sessions or career awareness
sessions in all Kitikmeot communities at least annually to encourage Inuit to attain the skills and
education qualifications necessary to take advantage of Project employment opportunities.
6.4.2 Results
The first annual TMAC Community Information Tour was hosted in October and November 2017 in each
of the five Kitikmeot communities. Information was provided to communities on: labour needs of the
Project; skills, behaviours and qualifications required for employment at the Project; available training
opportunities and educational support programs; and career opportunities in related fields (e.g., science,
technology, professional services). During the 2017 Community Information Tour, TMAC also met with
representatives of the GN Department of Education, Kitikmeot School Operations, and high school
principals. Discussions focused on obtaining input as to how to best position future TMAC support of
secondary school awards and promotion of a science based curriculum delivery. TMAC also participated
in the planning the 2016 and 2017 Kitikmeot Career Fairs with representatives of the GN Department of
Family Services.
In 2018, TMAC hosted five Community Information Sessions and five High School Information Sessions.
TMAC also sponsored 10 student awards (ten awards: five academic, and five IQ Principles).
6.4.3 Interpretation
In 2018, TMAC hosted ten Community and High School Information Sessions and sponsored 10 student
awards. TMAC’s involvement in community and student outreach events continues to increase with an
increase in Project activities. TMAC committed to host community information and career awareness
session in all Kitikmeot communities at least annually to encourage Inuit to attain the skills and education
qualifications necessary to take advantage of employment opportunities.

www.erm.com Version: D.1 Project No.: 0462113-0008 Client: TMAC Resources Inc. May 2019 Page 6-3
HOPE BAY PROJECT 2018 Socio-economic Monitoring Program
EDUCATION AND TRAINING
6.5 High-School Participation
6.5.1 Predictions
The Project could affect high-school enrollment and attendance by improving the prospects of finding
employment for Kitikmeot residents with a high school diploma. This effect is predicted to be positive,
increasing the educational attainment in the Kitikmeot region.
6.5.2 Results
Public School Enrollment
Public school enrollment represents the number of full- and part-time students registered in school as of
September 30 and include all elementary and secondary schools in Nunavut and all students enrolled in
Kindergarten through Grade 12. Enrollment data are provided for the period of 2003 to 2017 for all
Kitikmeot communities and the Kitikmeot region in general (Figure 6.5-1). As shown, although public
school enrollment fluctuated over 2003 to 2017, enrollment increased in 2013 with continued growth
through 2017, increasing by 4% for Nunavut and 11% for the Kitikmeot region. Kugaaruk experienced the
highest increase in public school enrollment of 31% from 2013 to 2017, followed by Gjoa Haven at 12%,
Kugluktuk and Taloyoak at 8%, and Cambridge Bay at 3%. In fact, the Kitikmeot region led the increase
in public school enrollment in Nunavut. In 2017, there were 68 more students enrolled in Nunavut
compared to 2016. Of that, enrollment in the Kitikmeot region increased by 71 students, while it
decreased by 53 students in Qikiqtani and increased by 50 in Kivalliq (NBS 2018k).
High school enrollment is only available at the regional level for 2003 through 2017 (Figure 6.5-2). While
the number of students enrolled in Grade 9 through 12 varied over the investigated period, it generally
increased over the last five years (note that 2015 data is not available) by 59% in Grade 9, 54% in
Grade 10, 35% in Grade 11, and 36% in Grade 12 (NBS 2018l).
Information for 2018 was not available at the time of writing this report.
Public School Attendance and Truancy Rates
Public school attendance rate represents the percentage of total school days for which students attended
school while public school truancy rate represents the percentage of total school days for which students
had unexcused absences from school. Most recent updates on the public school attendance rate are from
the 2013/2014 school year when the Kitikmeot region had an attendance rate of 58%, compared to 71%
for Nunavut as a whole. Across Kitikmeot communities, Kugluktuk and Cambridge Bay had the highest
attendance rate of 83%, followed by Taloyoak (70%) and Gjoa Haven (56%); attendance rate for
Kugaaruk was not calculated for that year. For high school students (Grades 9 through 12) attendance
rates are only available at the regional level. In 2013/2014 school year, high school attendance rate
varied from a low of 55% for Grade 9 and increasing with seniority to a high of 65% for Grade 12
(NBS 2015b).
Most recent public school truancy rates available at the time of writing this report are for the 2010/2011
school year. In that year, truancy rates were 25% for the Kitikmeot region, and 22% for Nunavut as a
whole. For Kitikmeot communities, truancy rates were highest for Gjoa Haven (34%) and Kugluktuk
(32%), followed by Taloyoak (26%), Kugaaruk (24%), and Cambridge Bay (15%). For high school
students (Grade 9 through 12) truancy rates are only available at the regional level. In the 2010/2011
school year, truancy rate for Grade 9 was 35%, it was 42% for Grade 10, 36% for Grade 11 and 26% for
Grade 12 (NBS 2012).

Figure 6.5-1: Public School Enrollment by Community, 2003 to 2017
www.erm.com Project No.: Client: Graphics: HB-19ERM-003a0462113 TMAC RESOURCES INC.
0
500
1,000
1,500
2,000
2,500
0
50
100
150
200
250
300
350
400
450
500
2003 2004 2005 2006 2007 2008 2009 2010 2011 2012 2013 2014 2015 2016 2017
Year
Cambridge Bay Gjoa Haven KugaarukKitikmeotKugluktuk Taloyoak
NBS 2018k
Num
ber of Enrolments in the K
itikmeot R
egionN
umbe
r of E
nrol
men
ts in
the
Kiti
kmeo
t Com
mun
ities

Figure 6.5-2: Kitikmeot Public School Enrollment by Grade, 2003 to 2017
www.erm.com Project No.: Client: Graphics: HB-19ERM-003b0462113 TMAC RESOURCES INC.
NSB 2018lGrade 9Grade 10
Grade 11Grade 12
124 127 13093
13288
11797 102 92 99
136 132157
186 171
220
214161
156
168172 177
159125
194
253 193
60 98
91
93148
123
11296
117
105
106
102
105143
35
43
64
46
65
8167
69
73
101
95
115
132 129
0
100
200
300
400
500
600
700
2003 2004 2005 2006 2007 2008 2009 2010 2011 2012 2013 2014 2016 2017
Year
Num
ber o
f Stu
dent
s

www.erm.com Version: D.1 Project No.: 0462113-0008 Client: TMAC Resources Inc. May 2019 Page 6-6
HOPE BAY PROJECT 2018 Socio-economic Monitoring Program
EDUCATION AND TRAINING
6.5.3 Interpretation
With an increase in employment opportunities available to Kitikmeot residents, there appears to be a
re-enforcement of the direct link between education and employment, and a positive change in school
enrollment (an increase in high school enrollment). However, while high school enrollment generally
increased in the Kitikmeot communities in the last five years, due to the lack of data, it cannot be
determined whether there was an improvement in the public school attendance rate or a reduction in the
truancy rate.
6.6 High School Completion
6.6.1 Predictions
The Project could affect retention rates of youth in school, potentially impacting high school graduation
numbers. The effect is predicted to be positive, with an increasing number of students choosing to remain
in school, graduate and take advantage of the Project related employment opportunities.
6.6.2 Results
The number of secondary school graduates are summarized by community from 2001 to 2017
(Figure 6.6-1; at the time of writing, data for 2018 have yet to be released). The number of graduates
includes students who completed secondary school but excludes those who completed equivalency or
upgrading programs. In the Kitikmeot region, the number of graduates fluctuated with a small number of
high school graduates between 2002 and 2013, however a peak in graduation during that time period of
36 in 2008 and 30 in 2010. Since 2013, the number of graduates increased with 34 graduates in the
Kitikmeot in 2014, 31 in 2015, 37 in 2016 and 36 in 2017 (NBS 2017c).
Information for 2018 was not available at the time of writing this report.
6.6.3 Interpretation
There was an increase in the number of high school graduates in the Kitikmeot communities since 2014
possibly indicating a re-enforcement of the direct link between education and employment.
6.7 Effects Management and Mitigation
Table 6.7-1 lists the programs and measures designed to mitigate and manage potential effects related to
education and training.

Figure 6.6-1: Secondary School Graduates by Community, 2001/02 to 2016/17
www.erm.com Project No.: Client: Graphics: HB-19ERM-003c0462113 TMAC RESOURCES INC.
NBS 2017cYear
Num
ber
of G
radu
ates
3 3 42
4 4
7
4
9
5 4 4
12
4
12 12
1 1
2 7
10
6
11
4
5
7
6
3
5
6
6 7
4
3
4
1
2
6
6
7
15
5
7
8 6
7
3
4
4
1
5
12
9
9
3
9
4
8
13
7 8
1 11
1
2
4
1
2
1
5
4
1
4 3
0
5
10
15
20
25
30
35
40
2001
/02
2002
/03
2003
/04
2004
/05
2005
/06
2006
/07
2007
/08
2008
/09
2009
/10
2010
/11
2011
/12
2012
/13
2013
/14
2014
/15
2015
/16
2016
/17
Cambridge Bay Gjoa Haven KugaarukKugluktuk Taloyoak

www.erm.com Version: D.1 Project No.: 0462113-0008 Client: TMAC Resources Inc. May 2019 Page 6-8
HOPE BAY PROJECT 2018 Socio-economic Monitoring Program
EDUCATION AND TRAINING
Table 6.7-1: Education and Training Management and Mitigation Measures
Program/Mitigation
Measure
Purpose/Description/Outcome
IIBA The IIBA sets out principles and methods to, among other purposes, maximize Inuit
training, employment and business opportunities arising from the operation of the Project,
and provide a mechanism through which effective communication and cooperation can
take place. Key features of the IIBA related to education and training include provisions
for, among others: setting of annual and long-term training targets (including
apprenticeships) that are achievable by TMAC using commercially reasonable efforts;
creating, maintaining and annually updating a list of relevant education and training
opportunities for Inuit; annually evaluating and reporting on the Inuit Training Target
achievements, Inuit training and recruitment plans, improving compliance with Inuit
Training Targets, and funded activities (among others); and establishment and
administration of a Training and Education Fund.
Human Resources
Plan
The Human Resources Plan supports the provisions of the IIBA and, more broadly,
provides a framework for human resources management at the Hope Bay Project which
ensures that the needs of all TMAC personnel are addressed throughout the life of the
Project. The Plan addresses human resources, Inuit employment, education and
orientation and employee wellness. In conjunction with the IIBA, specific measures
include, among others: to build cultural awareness and enforce harassment policies;
promote awareness of employment opportunities within Kitikmeot communities;
collaborate with training institutions; develop and implement a recruitment strategy;
career development plans for Inuit employees; collaborate and partner with relevant
agencies and contractors to ensure skill requirements are being met; and collaborate with
education and training providers to develop training programs geared toward the long-
term employment of women in non-traditional occupations.
TMAC will communicate with the Department of Education headquarters staff on any
planned initiatives relating to youth employment, and other programs that may relate to
education, in order to identify common points of interest and action that would help
integrate the Proponent’s activities into the existing education program, and
communication and delivery plans.
Community
Involvement Plan
TMAC will host a community information and career awareness session in all Kitikmeot
communities at least annually. Information will be provided to communities on: labour
needs of the Project; skills, behaviours and qualifications required for employment at the
Project; available training opportunities and educational support programs; and career
opportunities in related fields. TMAC will continue to engage GN representatives of
relevant departments and agencies on training development and career awareness
information. TMAC will also sponsor competitions and achievement awards at the
secondary school level in fields relevant to or related to mining sector careers.

www.erm.com Version: D.1 Project No.: 0462113-0008 Client: TMAC Resources Inc. May 2019 Page 7-1
HOPE BAY PROJECT 2018 Socio-economic Monitoring Program
POPULATION DEMOGRAPHICS
7. POPULATION DEMOGRAPHICS
7.1 Population Stability
7.1.1 Predictions
The Project is predicted to have a negligible effect on in-migration given that the Project has agreed to
maintain multiple points of hire across the Kitikmeot region and to transport workers from their
communities. Also, the fly-in/fly-out nature of the operation means that there is no advantage for
non-Kitikmeot employees to move to the Kitikmeot region.
7.1.2 Results
Population of Kitikmeot Communities
The total population within the Kitikmeot region increased from 5,062 to 6,453 residents (by 27%) from
2001 through 2012. The largest increase of 36% was in the community of Gjoa Haven, followed by
Kugaaruk (29%), Cambridge Bay (27%), Taloyoak (25%), and Kugluktuk (22%; Figure 7.1-1). Since,
the population in the territory grew annually at 2% in 2013, 2015, 2017 and 1% in 2014 and 2016, with
an estimated 6,993 residents in the region in 2017 (NBS 2018j). Population also grew in all Kitikmeot
communities, with no indication of population decline:
Cambridge Bay is the largest community in the Kitikmeot region. Recent population growth in the
community was moderate with 2 to 3% annual growth from 2013 to 2017. The community had an
estimated 1,985 residents in 2017.
Kugluktuk is the second largest community with fluctuating population growth of 1 to 2% from 2013 to
2017. The community had 1,664 residents in 2017.
Gjoa Haven’s population grew at 1 to 2% from 2013 to 2016, and 3% in 2017. In 2017, the community
had 1,484 residents.
Taloyoak, had a population growth of 1 to 2% from 2013 to 2017 (with no change in 2016). Population
estimates indicate that the community had 989 residents in 2017.
Kugaaruk, the smallest community in the Kitikmeot region, had an annual population growth of 1% in
2013 and 2014, in 2015 there was no change, while in 2016 population declined by 1%. In 2017,
there were 860 residents, representing a 3% population growth over the previous year (Figure 7.1-1).
Information for 2018 was not available at the time of writing this report.
Recent migration patterns, as well as births and deaths estimates, are available for Nunavut as a whole.
Nunavut has, on average, more out-immigrants than in-migrants. For the period of 2001 to 2018, the
number of in-migrants exceeded the number of out-migrants in 2001, 2002, 2009, 2011, 2013 and 2018.
Nunavut experienced the largest out-migration in 2018, with a recorded 1,453 out-migrants however a net
migration of 179. Historically, a notable out-migration trend extended from 2003 through 2008. Data
suggest that a second out-migration trend took place from 2012 through 2017, with a net out-migration of
406 persons during the timespan (NBS 2018c).
Births and deaths data indicate that Nunavut has, on average, five live births per each death. The high
birth-to-death ratio supports natural population growth in the region and in Nunavut, because net migration
is primarily negative with more individuals moving out of than into the territory (NBS 2018h, 2018i).
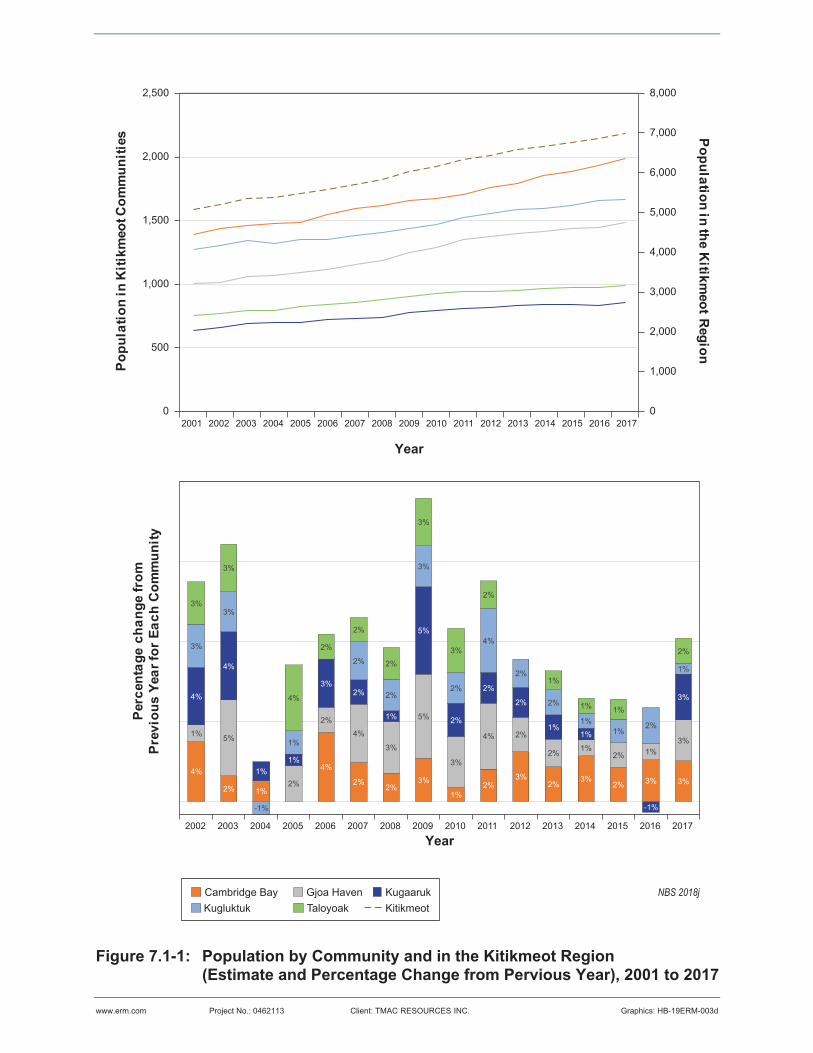
Figure 7.1-1: Population by Community and in the Kitikmeot Region (Estimate and Percentage Change from Pervious Year), 2001 to 2017
www.erm.com Graphics: HB-19ERM-003d0462113 TMAC RESOURCES INC.Project No.: Client:
Popu
latio
n in
Kiti
kmeo
t Com
mun
ities Population in the K
itikmeot R
egion
Year
Year
0
1,000
2,000
3,000
4,000
5,000
6,000
7,000
8,000
0
500
1,000
1,500
2,000
2,500
2001 2002 2003 2004 2005 2006 2007 2008 2009 2010 2011 2012 2013 2014 2015 2016 2017
4%
2% 1%
4%
2%2%
3%
1%2%
3%2%
3%2% 3% 3%
1% 5%
2%
2%
4%
3%
5%
3%
4% 2%
2% 1%2% 1%
3%
4%
4%
1%1%
3%2%
1%
5%
2%
2%
2%
1%1%
-1%
3%
3%
3%
-1%
1%
2%
2%
3%
2%
4%
2%
2%
1%1%
2%
1%
3%
3%
4%
2%
2%
2%
3%
3%
2%
1%
1% 1%
2%
2002 2003 2004 2005 2006 2007 2008 2009 2010 2011 2012 2013 2014 2015 2016 2017
Cambridge Bay Gjoa Haven KugaarukKitikmeotKugluktuk Taloyoak
Perc
enta
ge c
hang
e fr
omPr
evio
us Y
ear f
or E
ach
Com
mun
ity
NBS 2018j

www.erm.com Version: D.1 Project No.: 0462113-0008 Client: TMAC Resources Inc. May 2019 Page 7-3
HOPE BAY PROJECT 2018 Socio-economic Monitoring Program
POPULATION DEMOGRAPHICS
Over the next 15 years (2019 to 2035), it is predicted that the Kitikmeot region will have an annual
population growth of approximately 1% per year, with a progressively decreasing annual growth by 2035.
In 2018, highest annual growth (above 1%) is predicted for the communities of Gjoa Haven, Kugaaruk and
Taloyoak. Cambridge Bay and Kugluktuk are expected to have slower population growth of less than 1%
(NBS 2014).
Migration of Employees
In 2018, two TMAC employees moved from Cambridge Bay to Edmonton. Although there were no TMAC
employees who moved to the Kitikmeot from elsewhere, two employees moved within the region in 2018:
one employee hired in Cambridge Bay returned home to the community of Taloyoak, and one employee
moved from Kugluktuk to Cambridge Bay.
7.1.3 Interpretation
Total population, along with other demographic indicators, is a key element of any socio-economic
monitoring program. Population statistics and projections are used to assess the need for housing,
education, and government services (e.g., health care and social services), so that resources can be
allocated according to the pace of population change. The increased population of the Kitikmeot region
means, in general, an increase in the demand for infrastructure and services.
Population growth results from a number of factors including natural population changes (net births and
deaths) and migration. In the Kitikmeot region, growth has been driven by a relatively high birth to-death
ratio. Regional population increases were modest since 2013 at 1% to 2% per year and remain on par
with the territorial (1%-2%) and national (1%) trend. In addition, no TMAC employees from outside of the
Kitikmeot have moved to the region. Considering the increased levels of Project activity in 2015 through
2017, the Project does not appear to be a driver for population growth.
7.2 Effects Management and Mitigation
Table 7.2-1 lists measures designed to mitigate and manage potential effects related to changes in
population.
Table 7.2-1: Population Stability Management and Mitigation Measures
Program/Mitigation
Measure
Purpose/Description/Outcome
Fly-in/fly-out rotation Project workers will be accommodated at site in camps while on rotation. TMAC
provides air transportation for all Kitikmeot residents, Inuit and non-Inuit, from their
home community to site if employed by the Project, in order to avoid in-migration to
these communities.
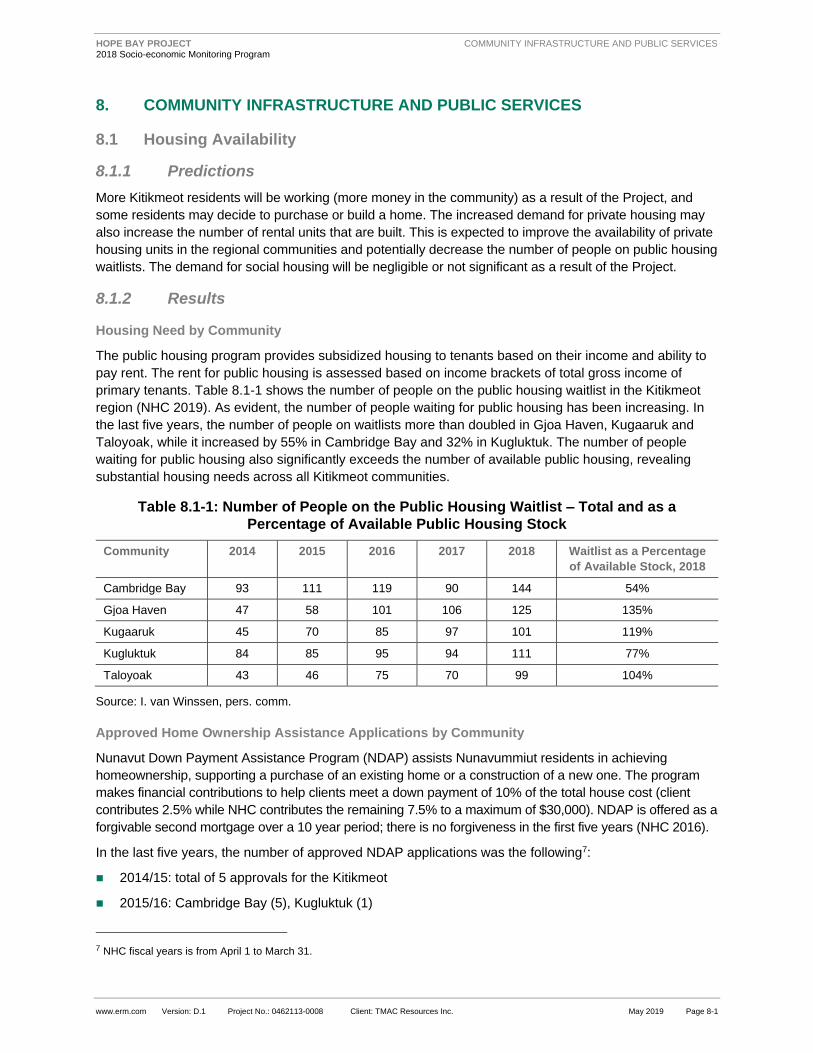
www.erm.com Version: D.1 Project No.: 0462113-0008 Client: TMAC Resources Inc. May 2019 Page 8-1
HOPE BAY PROJECT 2018 Socio-economic Monitoring Program
COMMUNITY INFRASTRUCTURE AND PUBLIC SERVICES
8. COMMUNITY INFRASTRUCTURE AND PUBLIC SERVICES
8.1 Housing Availability
8.1.1 Predictions
More Kitikmeot residents will be working (more money in the community) as a result of the Project, and
some residents may decide to purchase or build a home. The increased demand for private housing may
also increase the number of rental units that are built. This is expected to improve the availability of private
housing units in the regional communities and potentially decrease the number of people on public housing
waitlists. The demand for social housing will be negligible or not significant as a result of the Project.
8.1.2 Results
Housing Need by Community
The public housing program provides subsidized housing to tenants based on their income and ability to
pay rent. The rent for public housing is assessed based on income brackets of total gross income of
primary tenants. Table 8.1-1 shows the number of people on the public housing waitlist in the Kitikmeot
region (NHC 2019). As evident, the number of people waiting for public housing has been increasing. In
the last five years, the number of people on waitlists more than doubled in Gjoa Haven, Kugaaruk and
Taloyoak, while it increased by 55% in Cambridge Bay and 32% in Kugluktuk. The number of people
waiting for public housing also significantly exceeds the number of available public housing, revealing
substantial housing needs across all Kitikmeot communities.
Table 8.1-1: Number of People on the Public Housing Waitlist – Total and as a
Percentage of Available Public Housing Stock
Community 2014 2015 2016 2017 2018 Waitlist as a Percentage
of Available Stock, 2018
Cambridge Bay 93 111 119 90 144 54%
Gjoa Haven 47 58 101 106 125 135%
Kugaaruk 45 70 85 97 101 119%
Kugluktuk 84 85 95 94 111 77%
Taloyoak 43 46 75 70 99 104%
Source: I. van Winssen, pers. comm.
Approved Home Ownership Assistance Applications by Community
Nunavut Down Payment Assistance Program (NDAP) assists Nunavummiut residents in achieving
homeownership, supporting a purchase of an existing home or a construction of a new one. The program
makes financial contributions to help clients meet a down payment of 10% of the total house cost (client
contributes 2.5% while NHC contributes the remaining 7.5% to a maximum of $30,000). NDAP is offered as a
forgivable second mortgage over a 10 year period; there is no forgiveness in the first five years (NHC 2016).
In the last five years, the number of approved NDAP applications was the following7:
2014/15: total of 5 approvals for the Kitikmeot
2015/16: Cambridge Bay (5), Kugluktuk (1)
7 NHC fiscal years is from April 1 to March 31.

www.erm.com Version: D.1 Project No.: 0462113-0008 Client: TMAC Resources Inc. May 2019 Page 8-2
HOPE BAY PROJECT 2018 Socio-economic Monitoring Program
COMMUNITY INFRASTRUCTURE AND PUBLIC SERVICES
2016/17: Cambridge Bay (8), Gjoa Haven (1), Kugluktuk (2)
2017/18: Cambridge Bay (1), Gjoa Haven (2)
2018/19: no approvals8
8.1.3 Interpretation
In the last five years, there was an increase in the number of applicants waiting for public housing. The
NHC reported that following the announcement of the new needs-based allocation methodology, potential
tenants were encouraged to complete applications for public housing, which increased the number of
applicants on the waitlist despite the construction of new public housing unit. Therefore, the increased
demand for public housing has been acknowledged to be a result of the announcement of the new
allocation methodology and call for new applicants. The number of people on the waitlists can also
increase with growing population, declining condition of available housing stock and varying
socio-economic challenges. It is unlikely that the Project affected the demand for public housing.
With respect to the NDAP approvals, although there was an increase in approvals in the 2016/17 fiscal
year, afterwards, the number of approval declined. A positive impact of Project employment on the
number of NDAP approvals is not evident.
8.2 Housing Status
8.2.1 Predictions
Kitikmeot residents employed by the Project will be able to accumulate wealth and seek alternative
housing arrangements (i.e., leave public housing and rent private housing or purchase/build a house),
given the higher personal income. Other employees may continue to rent, or live with relatives or friends
while not on-site.
8.2.2 Results
Housing status of Project employees is to be determined with the help of a housing survey to be
developed with NHC, GN, and KitSEMC, and administered to Nunavummiut employees. The required
survey has not been developed yet. Consequently, data for this indicator is not available.
8.2.3 Interpretation
The housing survey has not been developed.
8.3 Project Use of Emergency Services
8.3.1 Predictions
The Project may increase demand on emergency services in Kitikmeot communities due to Project
related accidents. Project-related workplace accidents should be minimal in number and severity and this
effect is predicted to be minor.
8.3.2 Results
Medical aid was not required in 2013 or 2015. In 2014, one Project worker required medical aid. In 2016,
two workers were seen at the health centre in Cambridge Bay for minor injuries due to separate incidences
8 As of February 22, 2019.

www.erm.com Version: D.1 Project No.: 0462113-0008 Client: TMAC Resources Inc. May 2019 Page 8-3
HOPE BAY PROJECT 2018 Socio-economic Monitoring Program
COMMUNITY INFRASTRUCTURE AND PUBLIC SERVICES
of “slips, trips, and falls”. One worker returned to work the same day, and another resulted in one day of
lost-time. In 2017, one TMAC employee required emergency medical attention and extended recovery time
was required; this was due to an illness that was not work related. In 2018, Project did not use GN
emergency health services.
8.3.3 Interpretation
Although there have been incidents resulting in use of local health services (peaking at two incidences
in 2016, with one additional incident in 2017), this is commensurate with increased levels of activity at
the site. TMAC monitors health and safety performance and adjusts its activities to avoid injuries and
other incidents. Overall, the number of incidences remains very low and the Project has not resulted in
significantly increased demand on health care services in Kitikmeot communities as a result of
Project-related emergencies.
8.4 Demand for Health and Social Services
8.4.1 Predictions
Project employees who are Kitikmeot residents will have access to health care services while at site,
potentially reducing the annual number of health centre visits in the region. However, some Project
employees may elect to engage in high risk behaviours while off site and off rotation (e.g., alcohol and
drug use) increasing demand for health care or social services. However, it is not expected that a large
number of employees will participate in risky behaviours and minimal adverse effects are predicted on
health care and social services. Additionally, through the provision of employment and income, the
Project has the potential to reduce the number of people who require social assistance.
8.4.2 Results
Visits to Health Centres
The number of community health centre visits in the Kitikmeot region increased from 40,768 in 2003 to
42,216 in 2016, however with notable year-to-year variation over the investigated period. Figure 8.4-1
shows a general drop in the number of health centre visits leading up to and including 2009, followed by
an increase in 2010 through 2014. In 2015, the number of health centre visits dropped to 39,049 across
the Kitikmeot region, increasing again in 2016 to 42,216 (NBS 2018e). Number of visits to health centers
in each community are shown in Figure 8.4-1.
At the time of writing, data for 2017 and 2018 have yet to be released.
On a per capita basis, there was an overall decrease in health centre visits between 2003 and 2009
within the Kitikmeot region (i.e., from 7.6 to 4.6 visits per person annually; Figure 8.4-1). While the rate of
visits in the Kitikmeot region has since increased (6.3 visits per person in 2013, 6.6 in 2014, 5.7 in 2015
and 6.1 in 2016), this level of demand is low compared to the per capita rates experienced earlier in the
past decade (e.g., 7.6 and 7.7 annual visits per person in 2003 and 2004, respectively); it is also relatively
low in relation to other parts of Nunavut (NBS 2018d).
Cambridge Bay, Gjoa Haven, and Kugluktuk have typically had lower rates of health centre visits while
Taloyoak and Kugaaruk have had higher rates (2003 to 2016; Figure 8.4-1). In 2016, Kugluktuk had the
lowest rate of regional health centre visits at 4.9 visits per person annually, lower than Cambridge Bay
(5.8), Gjoa Haven (5.4) and Taloyoak (6.2). Kugaaruk had the highest rate of health centre visits per
capita (9.8 visits per person, an increase from 7.2 from the previous year). In general, from 2003 through
2016, the per capita rate of health centre visits varied within the Kitikmeot communities by approximately
one to two per capita visits per year.
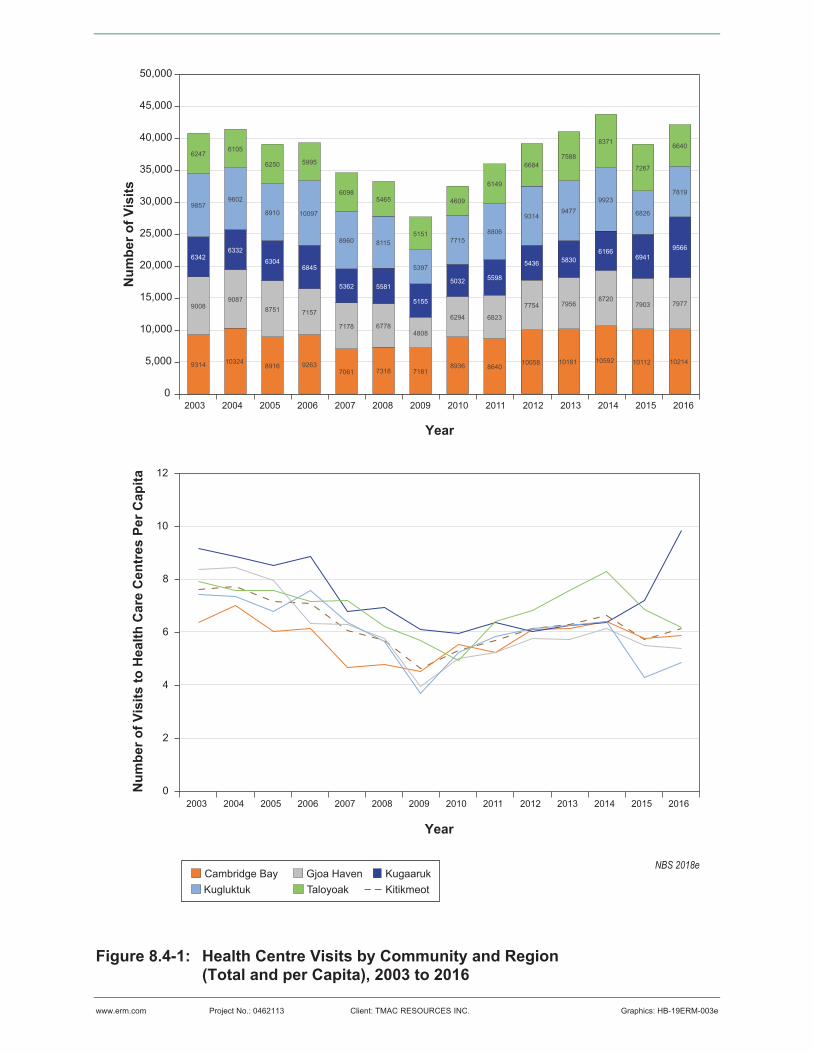
Figure 8.4-1: Health Centre Visits by Community and Region (Total and per Capita), 2003 to 2016
www.erm.com Graphics: HB-19ERM-003e0462113 TMAC RESOURCES INC.Project No.: Client:
9314 103248916 9263
7061 7316 71818936 8640
10058 10181 10592 10112 10214
90089087
8751 7157
7178 67784808
6294 6823
7754 79568720
7903 7977
63426332
63046845
5362 5581
5155
5032 5598
5436 58306166
69419566
98579602
8910 10097
8960 8115
5397
77158806
93149477
9923
6826
7819
62476105
6250 5995
60985465
5151
4609
6149
66847588
8371
7267
6640
0
5,000
10,000
15,000
20,000
25,000
30,000
35,000
40,000
45,000
50,000
2003 2004 2005 2006 2007 2008 2009 2010 2011 2012 2013 2014 2015 2016
Num
ber o
f Vis
its to
Hea
lth C
are
Cen
tres
Per
Cap
ita
Year
Num
ber o
f Vis
its
0
2
4
6
8
10
12
2003 2004 2005 2006 2007 2008 2009 2010 2011 2012 2013 2014 2015 2016
Cambridge Bay Gjoa Haven KugaarukKitikmeotKugluktuk Taloyoak
Year
NBS 2018e

www.erm.com Version: D.1 Project No.: 0462113-0008 Client: TMAC Resources Inc. May 2019 Page 8-5
HOPE BAY PROJECT 2018 Socio-economic Monitoring Program
COMMUNITY INFRASTRUCTURE AND PUBLIC SERVICES
Social Assistance Caseload
The number of social assistance cases represents the number of households receiving social assistance
or income support. Social assistance data (monthly average) are available from 2004 to 2017. In the
Kitikmeot region, the number of social assistance cases trended upward from a low of 672 cases in 2004
to a high of 1,093 in 2013, thereafter gradually decreasing to 973 cases in 2017 (NBS 2018m). Data by
community are provided in Figure 8.4-2.
The rate of social assistance caseloads (per 100,000 persons) highlights the difference in caseloads in
Cambridge Bay in comparison to other Kitikmeot communities, and the regional trend. The rate of social
assistance caseloads varied on annual basis being generally lowest in Cambridge Bay and highest in
Taloyoak (Figure 8.4-2). The rate trended upward for Kugaaruk from 2004 to 2013, moderately
decreasing afterwards. Similar trend took place in Kugluktuk, but of a smaller change. In general, since
2013, there was a general decrease in the rate of social assistance caseloads in the Kitikmeot, with a
small increase in 2016 in Cambridge Bay and another in 2017 in Kugluktuk (NBS 2018m).
Information for 2018 was not available at the time of writing this report.
8.4.3 Interpretation
While the number of visits to health centres (and the per capita rate) generally increased since 2010 (with
a small dip in 2015), the number of visits to health centres in the last five years (2012 to 2016) is similar to
the level of demand experienced earlier in the past decade (2003 to 2006), when the region had a smaller
population. Visits to health centres are typically determined by a number of diverse factors, many of which
are not related to the Project. The Project also has a number of measures to ensure that there is no
impact on local services. For example, Project workers have access to first aid facilities and medical
personnel while on-site. Additionally, Project employees who are not Kitikmeot residents are expected to
continue to access health services in their home communities.
With respect to social assistance, there was a general decrease in the number of social assistance
caseloads (and rate) since 2013 indicating that the need for social assistance decreased across Kitikmeot
communities. While it is possible that Project-related employment and income as well as associated
spinoff opportunities benefiting Kitikmeot residents reduced the need for social assistance, a direct
correlation cannot be determined with certainty. The need for social assistance is likely to fluctuate as
Project employment levels and individual employment patterns fluctuate.
8.5 Demand for Police Services
8.5.1 Predictions
Observation of changes in overall crime rate provide a broad overview of more specific indicators of crime
and safety. Increased income from Project-related employment can lead to increased alcohol and drug
use and other unhealthy choices or behaviours. This may result in increased demand for police services
(measured as police calls for service) and the overall crime rate. However, it is expected that the majority
of employees will experience positive benefits of increased income and not engage in high-risk
behaviours, unproductive spending, or potentially criminal activities.

Figure 8.4-2: Social Assistance Average Monthly Caseload by Community (Total and per 100,000 Persons), 2004 to 2017
www.erm.com Graphics: HB-19ERM-003f0462113 TMAC RESOURCES INC.Project No.: Client:
0
5,000
10,000
15,000
20,000
25,000
2004 2005 2006 2007 2008 2009 2010 2011 2012 2013 2014 2015 2016 2017
119 134 112 103 79 93 127 121 107 132 139 122 132 134
187214 223 224
231248
276 254 261299 306
298 264 256
7072 86 94 94
109
128 146 152
188 177178
170 150141133 147 161 156
184
211 212 228
261 253236
224 237
155178 172
191 196
207
200 186206
213 208217
204 196
0
200
400
600
800
1,000
1,200
2004 2005 2006 2007 2008 2009 2010 2011 2012 2013 2014 2015 2016 2017
Num
ber o
f Soc
ial A
ssis
tant
Cas
eloa
dspe
r 100
,000
Per
sons
Year
Num
ber o
f Ave
rage
Mon
thly
Cas
eloa
dsby
Com
mun
ity
Cambridge Bay Gjoa Haven KugaarukKitikmeotKugluktuk Taloyoak
Year
NBS 2018m

www.erm.com Version: D.1 Project No.: 0462113-0008 Client: TMAC Resources Inc. May 2019 Page 8-7
HOPE BAY PROJECT 2018 Socio-economic Monitoring Program
COMMUNITY INFRASTRUCTURE AND PUBLIC SERVICES
8.5.2 Results
Police Calls
Data on the number of police calls were available for the period of 2010 to 2018. Over that time, the
number of police calls generally trended upward in the Kitikmeot region, however with varying trends in
the communities (Table 8.5-1; Figure 8.5-1). Cambridge Bay had the highest number of police calls in
2012. The communities of Gjoa Haven, Kugaaruk and Kugluktuk had the highest number of police calls
in 2018, while calls in Taloyoak peaked in 2016. From 2017 through 2018, the number of police calls
increased in all communities with the exception of Taloyoak where there was a 5% decrease in police
calls. In 2018, there was a total of 4,688 police calls the Kitikmeot region.
Table 8.5-1: Police Calls for Services, 2010 to 2018
Community Calls for Service (Number of Calls)
2010 2011 2012 2013 2014 2015 2016 2017 2018 Change
from 2017
to 2018
% Change
from 2017
to 2018
Cambridge Bay 1,408 1,541 1,718 1,403 1,317 1,409 1,651 1,532 1,545 13 1%
Gjoa Haven 426 444 576 466 472 723 716 764 838 74 10%
Kugaaruk 76 192 217 195 256 320 312 336 343 7 2%
Kugluktuk 804 1,010 1,180 1,057 996 919 1,113 1,113 1,380 267 24%
Taloyoak 394 540 450 390 434 543 736 613 582 -31 -5%
Total 3,108 3,727 4,141 3,511 3,475 3,914 4,528 4,358 4,688 330 8%
Sources:
Data for years 2010, 2011 and 2012 were provided by G. Elliot (pers. comm.).
Data for 2013 were received from R. Head (pers. comm.).
Data for 2014 were provided by M. Sirotic (pers. comm.).
Data for 2015 and 2016 were provided by J-G Lalonde (pers. comm.) through the GN Department of Economic
Development and Transportation (Mineral and Petroleum Resources).
For 2017 and 2018 data were provided by PSE K. Chenier (pers. comm.).
On a per capita basis, the highest number of police calls is in Cambridge Bay, followed by Kugluktuk,
Taloyoak, Gjoa Haven and Kugaaruk (Figure 8.5-1). On an annual basis, there is less than one police call
per capita in all communities. Per capita calls appear to be trending upward for Taloyoak, Gjoa Haven
and Kugaaruk. In Cambridge Bay and Kugluktuk, police calls per capita increased in 2016, however
remained below previously recorded levels of 2012.
Criminal Code Violations (Including Traffic)
The total number of criminal code violations and the crime rate (violations per 100,000 people) are
summarized for all Kitikmeot communities and the region as a whole from 2001 through 2017 (Figure 8.5-2).
Between 2003 and 2012, criminal code violations in the Kitikmeot region remained relatively stable at an
average of 2,300 violations per year, decreasing to below 2,000 violations in 2013 through 2015, although
the number of violations varied year to year for each community. In 2016 and 2017 there was an increase in
the number of violations in most Kitikmeot communities (NBS 2018f).

Figure 8.5-1: Police Calls for Services (Total and per Capita), 2010 to 2018
www.erm.com Graphics: HB-19ERM-0060462113 TMAC RESOURCES INC.Project No.: Client:
Polic
e C
alls
Per
Cap
ita
Year
Tota
l Pol
ice
Cal
ls
Year
1408
426
76
804
394
1541
444
192
1010
540
1718
576
217
1180
450
1403
466
195
1057
390
1317
472
256
996
434
1409
723
320
919
543
1651
716
312
1113
736
1532
764
336
1113
613
1545
838
343
1380
582
0
500
1000
1500
2000
2500
3000
3500
4000
4500
5000
2010 2011 2012 2013 2014 2015 2016 2017 2018
0
0.2
0.4
0.6
0.8
1
1.2
2010 2011 2012 2013 2014 2015 2016 2017
Notes: Population estimates for 2018 were not available at the time of writing this report; per capita police calls as a result were not estimated for 2018.
Cambridge Bay Gjoa Haven KugaarukKitikmeotKugluktuk Taloyoak

Figure 8.5-2: Criminal Code Violations for the Kitikmeot Region and by Community(Total Number and per 100,000 Persons), 2001 to 2017
www.erm.com Graphics: HB-19ERM-003g0462113 TMAC RESOURCES INC.Project No.: Client:
0
10,000
20,000
30,000
40,000
50,000
60,000
70,000
80,000
90,000
2001 2002 2003 2004 2005 2006 2007 2008 2009 2010 2011 2012 2013 2014 2015 2016 2017
692 743926 828 878
1,222 1,1311,239 1,196 1,105
945 993
716593 661
946 948
185 169
257213
239
140 225
290476
329
274379
203244
324
352 444
2468
130
140 50
47 70
59
38
39
57
84
7887
92
121150
444
719
9411,038
685
898711
500
602
623
587
690
712
590
537
640
683
92
161
163 231
305
235
128 182
173
276
306
246
208
236
316
445
436
0
500
1,000
1,500
2000
2,500
3,000
2001 2002 2003 2004 2005 2006 2007 2008 2009 2010 2011 2012 2013 2014 2015 2016 2017
Crim
e R
ate
(Num
ber o
f Vio
latio
ns P
er 1
00,0
00 P
erso
ns)
Year
Num
ber o
f Vio
latio
ns
Cambridge Bay Gjoa Haven KugaarukKitikmeotKugluktuk Taloyoak
CanadaNunavut
Year
NBS 2018f

www.erm.com Version: D.1 Project No.: 0462113-0008 Client: TMAC Resources Inc. May 2019 Page 8-10
HOPE BAY PROJECT 2018 Socio-economic Monitoring Program
COMMUNITY INFRASTRUCTURE AND PUBLIC SERVICES
With respect to the overall crime rate (expressed as the number of criminal code violations per
100,000 persons), Canada, Nunavut and the Kitikmeot all experienced a decrease in the overall crime
rate in 2013 and 2014, with all rates trending upward in the following years (2015 through 2017).
However, while the crime rate was higher in 2016 and 2017, only Taloyoak had an increase in crime rate
above previously recorded levels. In general, Kugaaruk has the lowest number of criminal code violations
and the lowest crime rate of all Kitikmeot communities, while Cambridge Bay has the largest number of
criminal code violations and generally the highest crime rate (Figure 8.5-2).
Information for 2018 was not available at the time of writing this report.
8.5.3 Interpretation
A direct correlation between changes in Project-related employment and income, and changes in the
demand for police services and crime in the Kitikmeot communities is not evident. Although the number of
police calls was higher in 2016, 2017, and 2018, and there was an overall increase in crime in 2016 and
2017, on a per capita basis, those rates fall within previously recorded levels. The change in the number
of police calls by community as well as the overall crime rate can result from many interacting and
complex factors, such as changes in population size, changes in employment and income levels (due to
the Hope Bay Project or other projects in the communities), levels of alcohol and drug availability, the
relationship between the residents and the Royal Canadian Mounted Police (RCMP), and the availability
and use of community services.
8.6 Effects Management and Mitigation
Table 8.6-1 lists the programs and measures designed to mitigate and manage potential effects related to
community infrastructure and public services.

www.erm.com Version: D.1 Project No.: 0462113-0008 Client: TMAC Resources Inc. May 2019 Page 8-11
HOPE BAY PROJECT 2018 Socio-economic Monitoring Program
COMMUNITY INFRASTRUCTURE AND PUBLIC SERVICES
Table 8.6-1: Infrastructure and Public Services Management and Mitigation Measures
Program/Mitigation Measure Purpose/Description/Outcome
Health and Safety
Management Plan
The purpose of this plan is to detail the Health Safety and Loss Prevention
(HSLP) policies and systems adopted by TMAC and to provide the framework
for their implementation. The TMAC Management Team is committed to
providing a healthy and safe working environment for all personnel. The
objectives are: to have all personnel appropriately trained, responsible and
accountable for safety management; to incorporate industry best practice for
health and safety standards in the engineering, design and processes
implemented at all workplaces; to comply with all relevant standards and
codes of practice, and regulatory requirements; and to provide effective
training, efficient communication and continuous review of occupational health
and safety practices.
Employee and Family
Assistance Program (EFAP)
The EFAP provides Inuit employees and their families with services to assist
them with dealing with personal problems, family matters, mental health
concerns, and alcohol, drug and gambling dependencies.
Fly-in/fly-out rotation Project workers will be accommodated at site in camps while on rotation.
TMAC provides air transportation for all Kitikmeot residents, Inuit and
non-Inuit, from their home community to site if employed by the Project, in
order to avoid in-migration to these communities.
Family communications While on site, employees have access to communications facilities to allow
communication with spouses and families.
Community Involvement Plan TMAC will maintain communications with service providers within the
Kitikmeot communities over the life of the Project, and share information to
assist in the development of collaborative adaptive management measures,
should unanticipated impacts arise and mitigation be required.
Alcohol and Drug Policy The Alcohol and Drug Policy restricts the possession and use of alcohol and
drugs at the Hope Bay Project, including provisions for site access and
enforcement.
TMAC Liaison The TMAC Liaison assists in identifying and developing wellness initiatives
for the workforce, and aids in identifying wellness needs of employees, as
appropriate.

www.erm.com Version: D.1 Project No.: 0462113-0008 Client: TMAC Resources Inc. May 2019 Page 9-1
HOPE BAY PROJECT 2018 Socio-economic Monitoring Program
INDIVIDUAL AND COMMUNITY HEALTH AND WELLNESS
9. INDIVIDUAL AND COMMUNITY HEALTH AND WELLNESS
9.1 Work-life Balance
9.1.1 Predictions
Some workers and their families may find rotational employment stressful leading to termination of
employment. Project employees may also seek Employee and Family Assistance Program (EFAP)
assistance to deal with personal problems, family matters, mental health concerns, and alcohol, drug and
gambling dependencies.
9.1.2 Results
Ability of Inuit Workers to Balance Employment and Family, Traditional Lifestyle
Turnover data for Inuit workers are provided in Section 5.5.2.
In 2018, ten Inuit left TMAC employment, with five terminated by TMAC and five who left voluntarily. Of
those who left voluntarily, two left for other employment in their community, one left due to dissatisfaction
with work hours, and two resigned due to either family commitments or conflicts with their lifestyle and
rotational work.
Utilization of Employee and Family Assistance Program (EFAP)
TMAC implemented an EFAP in 2014 for permanent, full-time employees and have continued to provide
the EFAP. TMAC’s EFAP is not available to contractors, although suppliers working on the Project may
offer a similar program to their employees.
TMAC’s employee count was too low in 2014, 2015, and 2016 to report and ensure adequate privacy of
information on usage under the EFAP. The data, therefore, have been supressed to protect
confidentiality. TMAC can confirm that the program has been accessed by employees in those years.
TMAC’s EFAP will be available to a larger number of workers during the operations phase as the number
of permanent, full-time TMAC employees will substantially increase. For 2017, the first year of operation,
utilization of the EFAP was low – a total of 1.5 persons (standardized measure) accessed the service.
Between October 2017 and September 2018, there were 14 new counselling and life smart coaching cases.
9.1.3 Interpretation
Turnover rates for Inuit workers tend to be substantially higher, compared to the turnover rates for the
overall TMAC workforce and industry trends. In 2018, half of Inuit workers who left TMAC employment
resulted from voluntary turnover. Reasons for leaving included an alternative employment opportunity in a
home community, dissatisfaction with work hours, as well as family commitments or conflicts with lifestyle
and rotational work. An EFAP continues to be available to and accessed by employees every year to help
TMAC employees deal with personal problems.
9.2 Household Financial Management
9.2.1 Predictions
Increased income from Project-related employment can lead to poor spending choices and unhealthy
behaviours. To address this, TMAC will offer financial management programs for Project employees to
improve their financial security and well-being.

www.erm.com Version: D.1 Project No.: 0462113-0008 Client: TMAC Resources Inc. May 2019 Page 9-2
HOPE BAY PROJECT 2018 Socio-economic Monitoring Program
INDIVIDUAL AND COMMUNITY HEALTH AND WELLNESS
9.2.2 Results
Atuqtuarvik’s Corporation Chartered Professional Accountants (CPA) offered financial literacy training to
Cambridge Bay workers on a pilot basis in 2018 with significant promotion by TMAC, however the training
had no attendees.
9.2.3 Interpretation
Financial literacy training offered to Cambridge Bay workers was not attended by Project employees.
9.3 Spending Decisions and Lifestyle Choices
9.3.1 Predictions
Increased income from Project-related employment can lead to increased alcohol and drug use and other
unhealthy choices or criminal behaviours. Project employment and associated increase in personal
income has the potential to result in a more frequent purchase of alcoholic beverages in the Kitikmeot
communities. Increased income has the potential to increase criminal behaviour, impaired driving
violations, drug violations, domestic violence and gambling activity levels in Kitikmeot communities.
Changes to family spending are expected to occur primarily during the period of transition to Project
employment, followed by adjustment or stabilization as the new circumstances (employment and income)
become the norm.
9.3.2 Results
Sale of Alcoholic Beverages
Data on the sale of alcoholic beverages for Nunavut were retrieved from Statistics Canada; information is
not available at a regional level. Total sales for Nunavut as well as per capita sales (for inhabitants of
15 years of age and over) for Nunavut and Canada are shown in Figure 9.3-1. Sales peaked in 2011/12
at $5.8 million, thereafter decreasing and remaining relatively flat from 2013 to 2017 at $5.3 to
$5.6 million. In 2016/17, per capita sales in Nunavut were approximately $209, being substantially lower
compared to the Canadian average of $738.
Information for 2018 was not available at the time of writing this report.
Criminal Violations: Impaired Driving
The number of impaired driving violations in each community fluctuated over time with the highest
number of violations in 2006 and 2007 in the community of Cambridge Bay (Figure 9.3-2). Between 2008
and 2011 there was an overall decrease in the number of violations with a spike in 2012 in Cambridge
Bay and Kugluktuk. Subsequently, while violations generally decreased in 2013, 2014 and 2015, they
increased in the Kitikmeot by 116% in 2016 and by 76% in 2017. Overall, Cambridge Bay has the highest
rate of impaired driving violations compared to the other Kitikmeot communities, with the community of
Kugaaruk generally having fewest impaired driving violations and the lowest impaired driving violation
rate per 100,000 persons (NBS 2018g).
Information for 2018 was not available at the time of writing this report.

Figure 9.3-1: Sale of Alcoholic Beverages in Nunavut, 2004/05 to 2016/17
www.erm.com Project No.: Client: Graphics: HB-19ERM-005d0462113 TMAC RESOURCES INC.
$3.6
$4.7 $4.7 $4.8$5.1
$5.3$5.7 $5.8 $5.7
$5.3 $5.4 $5.6$5.3
$0
$100
$200
$300
$400
$500
$600
$700
$800
$0.0
$1.0
$2.0
$3.0
$4.0
$5.0
$6.0
$7.0
2004/
2005
2005/
2006
2006/
2007
2007/
2008
2008/
2009
2009/
2010
2010/
2011
2011/
2012
2012/
2013
2013/
2014
2014/
2015
2015/
2016
2016/
2017
Sales per Capita
Tota
l Sal
es in
Nun
avut
(mill
ions
)
Nunavut - Total Sales (millions) Sales per CapitaNunvaut - Sales per capita
Statistics Canada 2019

Figure 9.3-2: Impaired Driving Criminal Violations (Total Number and per 100,000 Persons), 2001-2017
www.erm.com Graphics: HB-19ERM-003h0462113 TMAC RESOURCES INC.Project No.: Client:
1823 25 22 24
64
53
3932
2319
35
2216
1017
21
31
6
2 1
2
8
12
14
8
2
6
4
2
3
4
173
1
6
1
1
1
2
11
10
13
2421
16
1519
512
14
8
21
12
7
6
9
19
1
4
113
5 5
7 2
4
5
8
7
3
9
4
0
10
20
30
40
50
60
70
80
90
100
2001 2002 2003 2004 2005 2006 2007 2008 2009 2010 2011 2012 2013 2014 2015 2016 2017
0
500
1,000
1,500
2,000
2,500
3,000
3,500
4,000
4,500
2001 2002 2003 2004 2005 2006 2007 2008 2009 2010 2011 2012 2013 2014 2015 2016 2017
Num
ber o
f Vio
latio
ns p
er 1
00,0
00 P
erso
ns
Year
Cambridge Bay Gjoa Haven KugaarukKugluktuk Taloyoak
Num
ber o
f Vio
latio
ns
Year
NBS 2018g

www.erm.com Version: D.1 Project No.: 0462113-0008 Client: TMAC Resources Inc. May 2019 Page 9-5
HOPE BAY PROJECT 2018 Socio-economic Monitoring Program
INDIVIDUAL AND COMMUNITY HEALTH AND WELLNESS
Criminal Violations: Drug-Related
Figure 9.3-3 shows the number of drug-related violations in each community between 2001 and 2017.
As evident, there was a notable spike in the number of drug-related violations in Taloyoak in 2005, in
Cambridge Bay in 2009 and 2010, and in Kugluktuk in 2013. Most recently, a trend towards fewer
drug-related violations began in 2014 with modest growth to date. Since 2013 and continuing through
2016, Kugluktuk had the highest number of drug-related violations in the Kitikmeot region with violations
decreasing over the period; while in 2017, there was a substantial increase in drug-related violations in
Taloyoak (from 2 to 12). The number of drug-related violations per 100,000 followed a similar pattern
(NBS 2018g).
Information for 2018 was not available at the time of writing this report.
Criminal Violations: Assault
The number of assaults in each community fluctuated between 2001 and 2017 with the communities of
Cambridge Bay and Kugluktuk generally having higher rates of assaults (Figure 9.3-4). There were
notable spikes in the number of assaults in Kugluktuk (2003 and 2004), Cambridge Bay (2008), Gjoa
Haven (2009), and Taloyoak (2011). Since 2013, the number of assaults in the Kitikmeot region remained
relatively low (as compared to other years) with higher year to year variation across communities, and the
number of assaults generally decreasing in Cambridge Bay and Kugluktuk, but increasing in Gjoa Haven,
Kugaaruk and Taloyoak (NBS 2018g).
Information for 2018 was not available at the time of writing this report.
9.3.3 Interpretation
The Project does not appear to have an effect on the sale of alcoholic beverages given that the sales
mostly decreased since 2012. However, as the information is not available at the regional level it is
difficult to fully investigate the effect of Project income on the purchase of alcoholic beverages in the
Kitikmeot region. Further, in 2015, 2016 and 2017, there was an increase in total impaired driving
violations and as well as assault-related violations in the Kitikmeot region; while drug-related violations
increased in 2017. By community, while violations increased in some communities, they decreased in
others. There is also a substantial inter-annual variation in the number of violations. These factors make it
challenging to assess the effect of Project income on the number of violations in each community,
however, a possible positive correlation cannot be discarded.
9.4 Country Foods Consumption
9.4.1 Predictions
Country foods play an important role in the diets of Nunavummiut and TMAC will facilitate access to
country foods for Project employees. Country foods will be served on site to those employed by the
Project. Also, access to Country Food Kitchens will be provided to Project employees for individual
food preparation.
9.4.2 Results
TMAC canteen serves country foods to Project employees every three weeks and on special holidays.
In 2018, country foods were served to workers up to 20 times.
In 2018, Inuit workers used the cultural cabin on regular basis. Individual users are not logged in as the
facility is open on a continual basis. Consequently, the number of workers who utilized the Country Food
Kitchen is unknown.

Figure 9.3-3: Drug-Related Criminal Violations (Total Number and per 100,000 Persons), 2001-2017
www.erm.com Graphics: HB-19ERM-003i0462113 TMAC RESOURCES INC.Project No.: Client:
0
500
1,000
1,500
2,000
2,500
3,000
3,500
4,000
4,500
2001 2002 2003 2004 2005 2006 2007 2008 2009 2010 2011 2012 2013 2014 2015 2016 2017
8 9 813
5
128
14
29
36
15
2116
8 7 6 6
15
2 2
1
1
3
4
4
6
8
5 1
1 1 2
12
1
38
5
2
1
1
9 58
2 2 1
4
4
11
11
18
7
15
6
10
8
12
10
10
30
10 13
9
4
3 8
7
13
34
7
2
4
3
4
11
8
4
5
8
6
8
0
10
20
30
40
50
60
70
2001 2002 2003 2004 2005 2006 2007 2008 2009 2010 2011 2012 2013 2014 2015 2016 2017
Num
ber o
f Vio
latio
ns p
er 1
00,0
00 P
erso
ns
Year
Cambridge Bay Gjoa Haven KugaarukKugluktuk Taloyoak
Num
ber o
f Vio
latio
ns
Year
NBS 2018g
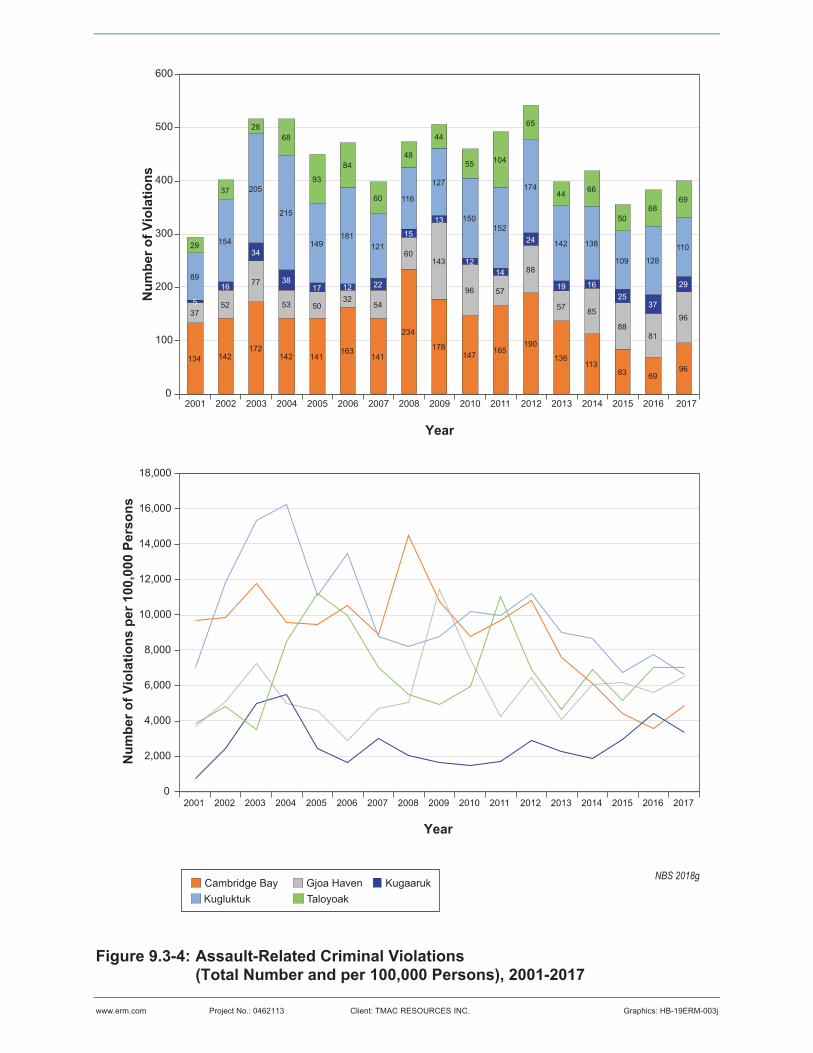
Figure 9.3-4: Assault-Related Criminal Violations (Total Number and per 100,000 Persons), 2001-2017
www.erm.com Graphics: HB-19ERM-003j0462113 TMAC RESOURCES INC.Project No.: Client:
0
2,000
4,000
6,000
8,000
10,000
12,000
14,000
16,000
18,000
2001 2002 2003 2004 2005 2006 2007 2008 2009 2010 2011 2012 2013 2014 2015 2016 2017
134 142172
142 141163
141
234
178147 165
190
136113
83 6996
3752
77
53 5032
54
60143
96 57
88
57 85
8881
96
5
16
34
3817 12 22
15
13
1214
24
19 1625
37
2989
154
205
215
149181
121
116
127
150152
174
142 138
109 128
11029
37
2868
93
84
60
48
44
55 104
65
44 66
5068
69
0
100
200
300
400
500
600
2001 2002 2003 2004 2005 2006 2007 2008 2009 2010 2011 2012 2013 2014 2015 2016 2017
Num
ber o
f Vio
latio
ns p
er 1
00,0
00 P
erso
ns
Year
Cambridge Bay Gjoa Haven KugaarukKugluktuk Taloyoak
Num
ber o
f Vio
latio
ns
Year
NBS 2018g

www.erm.com Version: D.1 Project No.: 0462113-0008 Client: TMAC Resources Inc. May 2019 Page 9-8
HOPE BAY PROJECT 2018 Socio-economic Monitoring Program
INDIVIDUAL AND COMMUNITY HEALTH AND WELLNESS
9.4.3 Interpretation
Country foods are served to Project employees up to 20 times a year. Inuit workers also regularly utilize
the Country Food Kitchen.
9.5 Food Security
9.5.1 Predictions
There could be a minor increase in the cost of living (the cost of food) in the communities as a result of
the Project. However, the Project can also reduce food insecurity through increased employment and
income. Employees who choose to use their income productively (e.g., spending on nutritious foods,
purchasing equipment to support harvesting) have the potential to positively impact food security not only
in their own households but also amongst their extended family network, due to the Inuit cultural practice
of sharing food (and country foods in particular).
9.5.2 Results
The Nunavut Food Price Survey (NFPS) is an annual survey conducted in March each year by the
Nunavut Bureau of Statistics (NBS) in each of Nunavut’s 25 communities. NBS started the NFPS as a
pilot in 2013 and began regularly reporting food price data in 2014/2015. The NFPS provides information
on prices by calculating the average cost of an item from all stores in a community. The survey includes
141 regularly priced items selected based on the groups in the Nunavut Food Guide, with the exception
of 19 non-food items. NBS provides an annual comparison of 24 select food items basket9 by region
and community.
Table 9.5-1 provides the average price of a food basket at the community and regional levels as well as
the percentage difference for the most recent year (2018) in comparison to the territorial average. While
trends are difficult to discern, the cost of a food basket was higher in 2015 in comparison to 2014 in each
community by 7% to 17%. In 2016, food prices increased in Cambridge Bay (by 2%) however decreased
in other Kitikmeot communities, and in the region as a whole. In 2017, prices decreased by 9% in
Kugaaruk and Kugluktuk while they increased by 5% in Taloyoak and 4% in Cambridge Bay, and
remained at the same level in Gjoa Haven. In 2018, prices decreased in Cambridge Bay, Gjoa Haven and
Taloyoak, but increased in Kugaaruk and Kugluktuk. In general, the cost of food was higher in Kugaaruk
and Taloyoak compared to other communities (NBS 2015a, 2016, 2017b, 2018a).
A comparison of food prices documented by NFPS and the Canada Consumer Price Index (CPI) food
basket indicates that prices are substantially higher in the Kitikmeot communities in comparison to the
Canadian average. In 2017, apples and white bread cost $6.85 and $6.68 in the Kitikmeot region, while
average costs in Canada were $3.85 and $2.81, respectively. In a regional context, Kitikmeot food prices
were higher compared to the Nunavut average every year for which the data were collected. Compared to
the national average, food costs in the Kitikmeot region are at least twice the Canadian average
(NBS 2017a, 2018b).
9 The 24 select food items basket includes: 2% milk (2l), apples (1kg), baby food in jars (128ml), bananas (1kg), canned baked
beans (398ml), canned cream of mushroom (284ml), canned pink salmon (213g), carrots (1kg), eggs (12 large), frozen corn (750g),
frozen french fries (650g-1kg), frozen pizza (one unit, >799g), ground beef (1kg), instant rice (700g), macaroni and cheese dinner
(200-225g), margarine (454g), pork chops (1kg), potatoes (2.27kg), quick oatmeal (900g-1kg), soda crackers (450g), spaghetti
noodles (500g), white bread (570g), white flour (2.5kg), and wieners (450-500g).

www.erm.com Version: D.1 Project No.: 0462113-0008 Client: TMAC Resources Inc. May 2019 Page 9-9
HOPE BAY PROJECT 2018 Socio-economic Monitoring Program
INDIVIDUAL AND COMMUNITY HEALTH AND WELLNESS
Table 9.5-1: NFPS – Comparison of 24 Select Food Items Basket, 2014 to 2018
Community March
2014
March
2015
March
2016
March
2017
March
2018
Difference
with Nunavut
2018
2017-2018
Difference
Kitikmeot Average $165.81 $182.75 $180.90 $177.30 181.15 5% 2%
Cambridge Bay $152.41 $166.46 $169.68 $175.80 173.13 -1% -2%
Gjoa Haven $165.84 $181.24 $178.47 $178.64 177.06 2% -1%
Kugaaruk $174.47 $204.02 $201.98 $184.07 210.23 21% 14%
Kugluktuk $161.57 $174.39 $169.60 $154.64 163.86 -6% 6%
Taloyoak $174.76 $187.61 $184.75 $193.36 181.54 4% -6%
Source: NBS (NBS 2015a, 2016, 2017b, 2018a)
9.5.3 Interpretation
The cost of food in Nunavut is determined by a number of factors including the cost to transport food from
southern Canada. Programs that subsidize transport costs aim to regulate the cost of certain food and non-
food items. The extent to which changing food subsidies influence the price of specific items is unknown.
In 2018, TMAC began to provide free air freight on company air charter flights for the Kugluktuk High
School to bring in fresh produce to be used in education programming and for a breakfast program. This
significantly reduces the cost of food for high school student programming in Kugluktuk. TMAC will
continue to look at ways in which company operations can contribute to lowering the cost of food and
supporting education in the region.
The Project entered operations in 2017 and employed local workers. The NFPS indicates that it is
common for prices to both rise and fall in the Kitikmeot communities and a Project-related impact on
prices is not apparent.
9.6 Household Economic Self-sufficiency
9.6.1 Predictions
Project-related employment will increase personal and family income for households in the Kitikmeot
region. This, in turn, has the potential to improve households’ economic self-sufficiency and to decrease
the number of low-income households in the region.
9.6.2 Results
Low-income Households
Low-income metrics, set at 50% of adjusted median household income, represents a relative measure of
low income10 for Kitikmeot communities. Low-income data were collected for all Kitikmeot taxfilers for
2004 to 2016 and include data on couple families11, lone parent families12 and persons not in a census
10 The measure is categorized according to the number of persons present in the household.
11 A couple family consists of a couple living together (married or common-law, including same-sex couples) living at the same
address with or without children.
12 A lone-parent family is a family with only one parent, male or female, and with at least one child.

www.erm.com Version: D.1 Project No.: 0462113-0008 Client: TMAC Resources Inc. May 2019 Page 9-10
HOPE BAY PROJECT 2018 Socio-economic Monitoring Program
INDIVIDUAL AND COMMUNITY HEALTH AND WELLNESS
family13 (Figure 9.6-1)14. In 2016, data was not available for the total number of families and persons not
in a census data and therefore it was not possible to calculate the share of low-income families as a
percentage of total. Data for 2017 and 2018 have yet to be released.
In the Kitikmeot region, the number of low-income families and non-family persons was lower from 2004
through 2006 and in 2010 compared to other years. From 2011 through 2014, the number of low-income
families and non-family persons trended upward for all communities. In 2015, there was a small decrease in
the number of low-income families and non-family persons in Gjoa Haven and Kugluktuk, with no change in
Cambridge Bay and Kugaaruk, and an increase in Taloyoak. In 2016, the number of low-income families
and non-family persons decreased in all communities with the exception of Cambridge Bay. In general, 31%
of families and non-family persons were classified as low income in Cambridge Bay in 2015, compared to
39% in Gjoa Haven, 46% in Kugaaruk, 43% in Kugluktuk and 48% in Taloyoak15 (NBS 2017d).
Project Employment Income
Total employment income increased with the commencement of Project production, supporting the
financial security of Inuit workers. In 2015, TMAC paid $0.6 million in payroll to Inuit workers. In 2018,
income earned by Inuit workers increased to $1.9 million.
9.6.3 Interpretation
Most recent data for low income families and non-family persons are available for 2016. In 2015 and
2016, there was a decrease in the number of low-income families in the region, however, at a community
level the number of low-income families increased in Cambridge Bay and Taloyoak. Further, while there
was some activity at the Hope Bay Project in 2015 and 2016, operations and an increase in hiring began
in 2017 with significant increase in salaries paid to Inuit workers. Due to the lack of more recent data on
low income families, it is challenging to determine whether there was a decrease in the number of low-
income families in the Kitikmeot region as a result of Project-related employment and income. However,
as a large proportion of Hope Bay recruitment was from the pool of unemployed persons within the
region, some positive effect on low income families can be expected.
9.7 Effects Management and Mitigation
Table 9.7-1 lists the programs and measures designed to mitigate and manage potential effects related to
individual and community health and wellness.
13 Persons not part of a couple or lone-parent family.
14 All low income data should be interpreted with caution as the data are subject to rounding.
15 This estimate is not available for 2016.

Figure 9.6-1: Low Income Families and Non-family Persons (Total and as aPercentage of all Families and Non-Family Persons), 2004-2015
www.erm.com Graphics: HB-19ERM-003k0462113 TMAC RESOURCES INC.Project No.: Client:
0
0.1
0.2
0.3
0.4
0.5
0.6
2004 2005 2006 2007 2008 2009 2010 2011 2012 2013 2014 2015
150 160 150 170 190 180 160 170 180 190 200 200 210
140 120 120120
120 130100
120130
150170 160 140
60 70 7070
80 70
7070
90100
110 11090
160 150 170170
190 190
180170
180
200
220200
19090
8090
100
100 100
90100
120
120
130150
140
0
100
200
300
400
500
600
700
800
900
2004 2005 2006 2007 2008 2009 2010 2011 2012 2013 2014 2015 2016
Perc
enta
ge o
f Tot
al
Year
Year
Num
ber o
f Fam
ilies
& N
on-fa
mily
Pe
rson
s in
Com
mun
ities
Cambridge Bay Gjoa Haven Kugaaruk NunavutKitikmeotKugluktuk Taloyoak
NBS 2017d

www.erm.com Version: D.1 Project No.: 0462113-0008 Client: TMAC Resources Inc. May 2019 Page 9-12
HOPE BAY PROJECT 2018 Socio-economic Monitoring Program
INDIVIDUAL AND COMMUNITY HEALTH AND WELLNESS
Table 9.7-1: Health and Wellness Management and Mitigation Measures
Program/Mitigation Measure Purpose/Description/Outcome
Employee and Family
Assistance Program (EFAP)
The EFAP provides Inuit employees and their families with services to assist
them with dealing with personal problems, family matters, mental health
concerns, and alcohol, drug and gambling dependencies.
Family Communications While on site, employees have access to communications facilities to allow
communication with spouses and families.
Community Involvement Plan TMAC will maintain communications with service providers within the Kitikmeot
communities over the life of the Project, and share information to assist in the
development of collaborative adaptive management measures, should
unanticipated impacts arise and mitigation be required.
Alcohol and Drug Policy The Alcohol and Drug Policy restricts the possession and use of alcohol and
drugs at the Hope Bay Project, including provisions for site access and
enforcement (policy of “zero tolerance” at the Project).
Country Foods TMAC will serve country foods on site, commensurate with the level of demand
and nutritional needs of Inuit employees. TMAC will also provide country food
kitchens and cultural activities at the Project as determined by the
Implementation committee and as space permits.
Financial Training TMAC will reach out to third parties to deliver financial management programs
such as financial literacy, financial planning and personal budgeting as
identified in the Human Resources Plan. Third parties will be engaged to
provide the necessary expertise in financial literacy training, and may include
financial institutions, post-secondary education institutions (e.g., Nunavut Arctic
College) and/or government. In particular, TMAC will approach GN Family
Services (or other GN department as appropriate) to solicit input and/or
participate in the delivery of programming to Project workers.
TMAC Liaison The TMAC Liaison assists in identifying and developing wellness initiatives
for the workforce, and aids in identifying wellness needs of employees, as
appropriate.

www.erm.com Version: D.1 Project No.: 0462113-0008 Client: TMAC Resources Inc. May 2019 Page 10-1
HOPE BAY PROJECT 2018 Socio-economic Monitoring Program
CONCLUSIONS
10. CONCLUSIONS
10.1 Summary of Results
A total of 60 socio-economic indicators comprise the SEMP. TMAC provided data for 42 indicators.
The remaining community-level indicators required data from other sources, including the GC, GN, NBS,
NHC, RCMP, and NAC. The socio-economic indicators are updated annually and, where possible,
include information for the most recent calendar year. However, due to the revisions of the SEMP Plan,
the SEMP report has now a number of new or modified indicators for which historical data is not
available. This resulted in variation of how the collected data were reported and interpreted. Going
forward, all indicators will be updated annually if possible.
Key results from the Hope Bay SEMP for 2018 include the following:
Economic Development
TMAC made payments of $9.8 million to the KIA, NTI and the Kitikmeot Corporation to promote the
social, economic, and cultural well-being of Inuit in Nunavut.
TMAC made payments of $1.3 million in various taxes to the GN; additional benefits were from the
purchase of diesel fuel by the Project, with tax paid at the wholesale level.
TMAC spent $220 million in CAPEX and OPEX supporting employment, procurement of goods and
services, and spinoff opportunities in the Kitikmeot and beyond.
Contracting and Business Expenditures
TMAC spent $182.5 million on contracts with businesses from Nunavut and beyond.
TMAC awarded $68.0 million in contracts to Nunavut businesses, this being equivalent to all
contracts awarded to KQB/Inuit owned businesses that year.
The Project had a positive effect on Kitikmeot business development represented by an increase in
the number of registered Inuit Firms in the Kitikmeot region.
Employment
TMAC and contractors hired up to 598 workers with an average workforce effort of 2,034 hours per
worker.
There were as many as 51 Kitikmeot Inuit working at the Project, representing 8% to 10% of the total
workforce size.
There were up to 14 Inuit from outside of the Kitikmeot region working at the Project, comprising on
average 2% of the total workforce.
By community, up to 24 workers were from Cambridge Bay, 11 from Kugluktuk, nine from Gjoa
Haven, eight from Kugaaruk and six from Taloyoak.
TMAC workforce as of December 31, 2018 included 23 Inuit workers, representing 9% of total TMAC
workforce.
Workforce effort by women represented 8% of the total workforce effort.
Workforce effort by Inuit women represented 3% of the total workforce effort.
Total employment income reached $22.0 million for all workers, of that, $1.9 was paid to Inuit workers.

www.erm.com Version: D.1 Project No.: 0462113-0008 Client: TMAC Resources Inc. May 2019 Page 10-2
HOPE BAY PROJECT 2018 Socio-economic Monitoring Program
CONCLUSIONS
Employee turnover rate for all Project employees, including Inuit, is as expected for a Project such
as this.
There was one lost time incident and 73 minor injuries.
TMAC provided 7,343 hours of training to non-Inuit workers that consisted of Site General
Orientation, Mill Orientation, Mine Orientation, General (workplace specific), Light Vehicle Operation,
and Mobile Equipment Operation. Additional 1,218 hours of training delivered to non-Inuit workers
consisted of Social Media Policy, Cultural Awareness Training, Respectful Workplace Policy
Presentation, Fitness for Work Policy Presentation, and Niagara Supervisory training.
TMAC provided 133 hours of general training to Inuit workers, 213.5 hours of health & safety related
training, and 8,290 hours of work-related training. Another 44 hours of training for Inuit workers
included Social Media Policy, Cultural Awareness Training, Respectful Workplace Policy
Presentation, and Fitness for Work Policy Presentation.
One apprenticeship position has been created thus far at the Project.
Inuit employees held a mix of unskilled, semi-skilled and skilled positions, while being
underrepresented in professional and management positions.
By department, Inuit employees worked in site operations and site services, and to a lesser degree in
exploration and underground mining.
Four skilled workers have left employment in community for employment at the mine.
Education and Training
The Kitikmeot NAC campus is not currently offering any mining-related courses.
TMAC spent an estimated $85,500 to support school-based initiatives including Career Awareness
Sessions, High School Awards, and Mining Matters events.
TMAC hosted ten Community and High School Information Sessions and sponsored 10 student
awards.
High school enrollment remained relatively stable in the Kitikmeot region in 2017; information for 2018
was not available at the time of writing this report.
High school completion in 2017 increased in Gjoa Haven and Kugluktuk, remained the same in
Cambridge Bay, and decreased in Kugaaruk and Taloyoak; information for 2018 was not available at
the time of writing this report.
Population Demographics
Population increased in all communities in 2017 by 1 to 3%, 2% for the region; information for 2018
was not available at the time of writing this report.
Population increases remain on par with the territorial (1%-2%) and national (1%) trend.
TMAC employees did not migrate to the Kitikmeot region.
Community Infrastructure and Public Services
The number of people on public housing waitlist increased in all communities and significantly
exceeded the number of available public housing.
Housing status of Project employees is unknown; the housing status survey is to be developed in the
coming years.

www.erm.com Version: D.1 Project No.: 0462113-0008 Client: TMAC Resources Inc. May 2019 Page 10-3
HOPE BAY PROJECT 2018 Socio-economic Monitoring Program
CONCLUSIONS
The Project did not use GN emergency services.
Information on visits to health centres in 2017 and 2018 was not available at the time of writing
this report.
The number of social assistance cases slightly decreased in 2017; information for 2018 was not
available at the time of writing this report.
There was an increase in the number of police calls in all communities with the exception of Taloyoak
were the number of calls decreased.
There was an increase in the overall crime rate in 2017; information for 2018 was not available at the
time of writing this report.
Individual and Community Health and Wellness
In 2018, ten Inuit left TMAC employment, with five terminated by TMAC and five voluntary
terminations. Reasons for leaving included an alternative employment opportunity in a home
community, dissatisfaction with work hours, as well as family commitments or conflicts with lifestyle
and rotational work.
Between October 2017 and September 2018, there were 14 new counselling and life smart coaching
cases.
Project employees did not attend financial literacy training offered to Cambridge Bay workers.
The regional sale of alcoholic beverages decreased in 2017; information for 2018 was not available at
the time of writing this report.
Impaired driving violations, drug-related violations and the number of assaults all increased in 2017;
information for 2018 was not available at the time of writing this report.
Country foods were served to Project employees up to 20 times and Inuit workers regularly utilized
the Country Food Kitchen.
Food prices as reported by NFPS increased in Kugaaruk and Kugluktuk, but decreased in the
remaining communities.
Low-income information for families for 2017 and 2018 was not available at the time of writing
this report.
10.2 Management Response
The review and analysis of Project-specific indicators and trends over time suggest the following
management responses:
Continue to encourage and support the participation of women in the Project’s workforce.
As enabled by the provisions of the IIBA, continue to encourage contractors to rely on Inuit workers,
and demonstrate a preference for Kitikmeot Qualified Businesses and other contractors with Inuit
content as defined by the IIBA.
As enabled by the provisions of the IIBA, continue to support the development of skills and worker
readiness for employment by working with the KIA, GN, Nunavut Arctic College and other organizations.
Identify opportunities for job shadowing, apprenticeships, and summer students as circumstances
allow and communicate with local communities once opportunities becomes available.

www.erm.com Version: D.1 Project No.: 0462113-0008 Client: TMAC Resources Inc. May 2019 Page 10-4
HOPE BAY PROJECT 2018 Socio-economic Monitoring Program
CONCLUSIONS
Review employee use of the EFAP and other Project provisions, and determine whether the
appropriate supports are in place for employees who are homesick or experiencing emotional stress.
Continue to encourage Kitikmeot Inuit to seek employment with the Project.
Monitor the diversity of job types held by Inuit. TMAC expects this to evolve further over time as Inuit
skill levels increase as well as interest in mining career opportunities.
Continue to work with GN and Nunavut Arctic College on the development and implementation of
courses and programs that are relevant to the mining industry for Inuit.
TMAC will continue to track Project-specific indicators as defined by the Hope Bay SEMP, and respond to
any issues or concerns arising in consultation with NIRB, the GN, CIRNAC, and the KIA, as appropriate.
TMAC will continue to participate in and contribute to the Kitikmeot SEMC.

www.erm.com Version: D.1 Project No.: 0462113-0008 Client: TMAC Resources Inc. May 2019 Page 11-1
HOPE BAY PROJECT 2018 Socio-economic Monitoring Program
REFERENCES
11. REFERENCES
Definitions of the acronyms and abbreviations used in this reference list can be found in the Glossary and
Abbreviations section.
1985. Criminal Code, RSC. C.C-46.
1998. Corruption of Foreign Public Officials Act, SC. C.34.
Acbayaan, J. 2019. Nunavut Arctic College: 2019-2020 Academic Programs.
https://static1.squarespace.com/static/5b1954d75cfd798b94327249/t/5c707c2371c10b85e96e7d
54/1550875685922/2019-2020+Academic+Program.pdf (accessed March 2019).
AMEC. 2007. Miramar Hope Bay Limited Socio-Economic Monitoring Program for the Doris North Gold
Project. August 2007.
ERM. 2015. Doris North Project: Revisions to TMAC Resources Inc. Amendment Application No. 1 of
Project Certificate No. 003 and Water Licence 2AM-DOH1323 – Package 4 Identification of
Potential Environmental Effects and Proposed Mitigation. Prepared for TMAC Resources Inc. by
ERM Consultants Canada Ltd.: Vancouver, BC (accessed March 2019).
ERM. 2019. Hope Bay Project: 2018 Socio-economic Monitoring Program. Prepared for TMAC
Resources Inc. by ERM Consultants Canada Ltd.: Vancouver, BC (accessed March 2019).
GC. 2019a. Census Profile, 2016 Census Statistics Canada. https://www12.statcan.gc.ca/census-
recensement/2016/dp-pd/prof/index.cfm?Lang=E (accessed March 2019).
GC. 2019b. Sales of Alcoholic Beverages Types by Liquor Authorities and other Retail Outlets, by Value,
Volume, and Absolute Volume. Statistics Canada.
https://www150.statcan.gc.ca/t1/tbl1/en/cv.action?pid=1010001001 (accessed March 2019).
KIA & TMAC. 2015. March 30, 2015 Hope Bay Belt Project Inuit Impact and Benefit Agreement (IIBA)
between Kikikmeot Inuit Association (KIA) and TMAC Resources Inc.
MiHR. 2017. Canadian Mining Labour Market Outlook. https://www.mihr.ca/pdf/publications/National-
Report-2017_EN_WEB.pdf (accessed March 2019).
MiHR. 2019. Canadian Mining Labour Market Outlook. https://www.mihr.ca/pdf/publications/WEB_
MiHR_Labour_Market_Outlook_2019.pdf (accessed March 2019).
MMC. 2005. Chapters 25 and 26 of the Doris North Technical Report – FEIS (accessed March 2019).
NAC. 2016. Nunavut Arctic College: Kitikmeot Socio Economic Meeting. http://nunavutsemc.com/wp-
content/uploads/2016/12/Socio-Economic-Meeting-2016.pdf (accessed March 2019).
NBS. 2012. Nunavut Public School Truancy Rate: 2001-2002 to 2010-2011.
http://www.stats.gov.nu.ca/en/Social%20education.aspx (accessed January 2019).
NBS. 2014. Nunavut Deaths by Month, 1999 to 2013.xls
http://www.stats.gov.nu.ca/en/Population%20deaths.aspx (accessed June 2016).
NBS. 2015a. Nunavut Food Price Survey, Comparison of 24 Select Food Items Basket, 2014-2015.
http://www.stats.gov.nu.ca/en/Economic%20prices.aspx (accessed January 2019).
NBS. 2015b. Nunavut Public School Attendance Rate, 2001-2002 to 2013-2014 (5 tables).
http://www.stats.gov.nu.ca/en/Social%20education.aspx (accessed January 2019).
NBS. 2016. Nunavut Food Price Survey, Comparison of 24 Select Food Items Basket, 2015-2016.
http://www.stats.gov.nu.ca/en/Economic%20prices.aspx (accessed January 2019).

www.erm.com Version: D.1 Project No.: 0462113-0008 Client: TMAC Resources Inc. May 2019 Page 11-2
HOPE BAY PROJECT 2018 Socio-economic Monitoring Program
REFERENCES
NBS. 2017a. Nunavut Food Price Survey - Comparison of Nunavut & Canada CPI Food Price Basket
Items. http://www.stats.gov.nu.ca/en/Economic%20prices.aspx (accessed January 2019).
NBS. 2017b. Nunavut Food Price Survey, Comparison of 24 Select Food Items Basekt, 2016-2017.
http://www.stats.gov.nu.ca/en/Economic%20prices.aspx (accessed January 2019).
NBS. 2017c. Nunavut Secondary School Graduates by Community 1999-2016.
http://www.stats.gov.nu.ca/en/Social%20education.aspx (accessed January 2019).
NBS. 2017d. Nunavut Taxfilers with Low Income by Region and Community, 2004 to 2015.
http://www.stats.gov.nu.ca/en/Economic%20income.aspx (accessed January 2019).
NBS. 2018a. 2018-2017 Nunavut Food Price Survey – Comparison of 24 Select Food Items Basket.
http://www.stats.gov.nu.ca/en/Economic%20prices.aspx (accessed January 2019).
NBS. 2018b. Food Price Survey: 2017 - 2018 Price Difference Stats Update, 2018.
http://www.stats.gov.nu.ca/en/Economic%20prices.aspx (accessed January 2019).
NBS. 2018c. Nunavut Annual Migration Estimates, 1999 to 2018.
http://www.stats.gov.nu.ca/en/Population%20migration.aspx (accessed January 2019).
NBS. 2018d. Nunavut Community Health Centre Visits, 2003 to 2016 (28 tables).
http://www.stats.gov.nu.ca/en/Social%20health.aspx (accessed January 2019).
NBS. 2018e. Nunavut Community Health Centre Visits: 2003 to 2016.
http://www.stats.gov.nu.ca/en/Social%20health.aspx (accessed January 2019).
NBS. 2018f. Nunavut Criminal Violations by Region and Community, 1999 to 2017.
http://www.stats.gov.nu.ca/en/Social%20crime.aspx (accessed January 2019).
NBS. 2018g. Nunavut Criminal Violations by Type and Community, 1999 to 2017.
http://www.stats.gov.nu.ca/en/Social%20crime.aspx (accessed January 2019).
NBS. 2018h. Nunavut Deaths by Sex, Age Group, Marital Status and by Month, 1999 to 2017 (4 Tables).
http://www.stats.gov.nu.ca/en/Population%20deaths.aspx (accessed January 2019).
NBS. 2018i. Nunavut Live Births and Fetal Deaths, 2001 to 2017 (8 Tables).
http://www.stats.gov.nu.ca/en/Population%20births.aspx (accessed January 2019).
NBS. 2018j. Nunavut Population Estimates by Region and Community, 2001 to 2017.
http://www.stats.gov.nu.ca/en/Population%20estimate.aspx (accessed January 2019).
NBS. 2018k. Nunavut Public School Enrollment by Community, Region & Territory 2003 - 2017.
http://www.stats.gov.nu.ca/en/Social%20education.aspx (accessed January 2019).
NBS. 2018l. Nunavut Public School Enrolment by Grade, 2003 to 2017 (6 tables).
http://www.stats.gov.nu.ca/en/Social%20education.aspx (accessed January 2019).
NBS. 2018m. Nunavut Social Assistance Average Monthly Caseload by Community, Region and
Territory, 2004 to 2017. http://www.stats.gov.nu.ca/en/Social%20assistance.aspx (accessed
January 2019).
NHC. 2016. Nunavut Down-payment Assistance Program. https://www.gov.nu.ca/sites/default/files/fillpdf/
11.2._nhc_-_nunavut_down_payment_assistance_policy_1016.pdf (accessed March 2019).
NHC. 2019. Public Housing. http://www.nunavuthousing.ca/publichousing (accessed March 2019).
NIRB. 2003. Environmental Impact Statement (EIS) Guidelines for the Doris Hinge Project.

www.erm.com Version: D.1 Project No.: 0462113-0008 Client: TMAC Resources Inc. May 2019 Page 11-3
HOPE BAY PROJECT 2018 Socio-economic Monitoring Program
REFERENCES
NIRB. 2012. Guidelines for the Preparation of an Environmental Impact Statement for Hope Bay Mining
Ltd.’s Phase 2 Hope Bay Belt Project (NIRB File No. 12MN001). Nunavut Impact Review Board:
Cambridge Bay, NU. (accessed March 2019).
NTI. 2019. Registry. https://inuitfirm.tunngavik.com/search-the-registry/ (accessed March 2019).
TMAC. 2017. Madrid-Boston Project: Final Environmental Impact Statement. TMAC Resources Inc.:
Toronto, ON. (accessed Marfch 2019).
TMAC. 2018. Management's Discussion and Analysis. https://s1.q4cdn.com/893791552/files/doc_
financials/2018/Q4/21/TMAC-2018-Q4-MD-A.pdf (accessed March 2019).
TMAC. 2019. Audited Financial Statements. https://s1.q4cdn.com/893791552/files/doc_financials/
2018/Q4/TMAC-Financial-Statements-Q4-2018.pdf (accessed March 2019).
Personal Communications
Buchan, A. 2013-2019. Vice President, Corporate Social Responsibility. TMAC, Cambridge Bay, NU.
Personal Communication.
Elliot, G. 2010. RCMP Sargent, Iqaluit RCMP Detachment, Iqaluit, NU. Personal Communication.
Elliot, G. 2011. RCMP Sargent, Iqaluit RCMP Detachment, Iqaluit, NU. Personal Communication.
Elliot, G. 2012. RCMP Sargent, Iqaluit RCMP Detachment, Iqaluit, NU. Personal Communication.
Head. R. 2013. Sargent, Iqaluit RCMP Detachment, Iqaluit, NU. Personal Communication.
Lalonde, Jean-Guy. 2015. Sargent, Cambridge Bay RCMP Detachment, Cambridge Bay, NU. Personal
Communication.
Lalonde, Jean-Guy. 2016. Sargent, Cambridge Bay RCMP Detachment, Cambridge Bay, NU. Personal
Communication: via GN Department of Economic Development and Transportation (Mineral and
Petroleum Resources).
PSE Chenier, K. 2017. Detachment Services Assistant. Cambridge Bay RCMP. Personal
Communication.
PSE Chenier, K. 2018. Detachment Services Assistant. Cambridge Bay RCMP. Personal
Communication.
Sirotic, M. 2014. Royal Canadian Mounted Police, Iqaluit, NU. Personal Communication.
van Winssen, Ilse. 2019. Senior Policy Analyst. Nunavut Housing Corporation. Personal Communication.

www.erm.com Version: D.1 Project No.: 0462113-0008 Client: TMAC Resources Inc. May 2019
HOPE BAY PROJECT 2018 Socio-economic Monitoring Program
APPENDIX A SUMMARY OF PROJECT ACTIVITIES, 2013 TO 2018

www.erm.com Project No.: 0462113-0008 Client: TMAC Resources Inc. Page 1 of 4
HOPE BAY PROJECT 2018 Socio-economic Monitoring Program
APPENDIX A: SUMMARY OF PROJECT ACTIVITIES, 2013 TO 2018
Appendix A: Summary of Project Activities, 2013 to 2018
Activities in 2013
In March 2013, the Hope Bay Project, including existing licences and permits associated with the Doris Project, was acquired by TMAC, with Newmont remaining as the main shareholder. The acquisition of the Hope Bay Project included the signing of a Memorandum of Understanding between TMAC, Newmont and the Kitikmeot Inuit Association (KIA) to transfer existing surface access agreement to the new company. At that time, TMAC was a privately held company based in Toronto, Canada. The company’s vision and sole focus is the responsible and economically sustainable exploration, development and mining of the Belt.
TMAC took Doris Camp and the Hope Bay Project out of seasonal unmanned closure March 22, 2013 in support of advanced exploration and environmental compliance work. Environmental work began in April 2013; the exploration drilling program commenced in June 2013.
As a new corporate entity, TMAC began in 2013 to develop and implement the financial, human resource, project management, environmental management, and safety systems necessary to support and govern future operations at Hope Bay.
TMAC conducted a Kitikmeot community tour in late March to inform stakeholders about project acquisition and introduce the new company to the region. Also in late March, Doris Camp was reopened to support environmental compliance monitoring and a gold exploration program, including surface diamond drilling with a target of 30,000 metres of drilling for the year.
During the spring, summer, and fall, work at the Doris North mine site was limited to regular site maintenance activities; underground workings were still sealed and several mining-related buildings remained in care and maintenance. In August 2013, a sealift of supplies was received from the western Arctic, and previously de-mobilized equipment was shipped back from Quebec.
During 2013, TMAC continued efforts to renew the Doris North Type A Water Licence. This work culminated in September 2013 with the ten year renewal of the licence. At the end of 2013, TMAC submitted a Water Licence amendment and commensurate NIRB Project Certificate amendment package outlining proposed changes to the future operation of the Doris North Mine. With the Doris North Inuit Owned Land (IOL) commercial lease expiry set for September 2013, TMAC was successful in renewing this lease for a period of five years.
TMAC’s focus in 2013 centered on mine planning and the completion of a Preliminary Economic Assessment (PEA) of the Hope Bay Project, an assessment that would inform future development plans and form the basis for continued funding of gold mining efforts at Hope Bay.
Activities in 2014
In 2014, TMAC continued activities aimed at bringing the Hope Bay project into production. These activities included land tenure negotiations, advanced exploration, re-opening the Doris North underground workings, process plant design and mine planning, licencing and permitting, and economic analysis aimed at producing a Pre-Feasibility Study.
TMAC opened discussions with Nunavut Tunngavik Incorporated (NTI) and the KIA in order to secure long-term land tenure to the IOL parcels that comprise almost all of the Hope Bay Belt area. Significant progress was achieved in obtaining a new Mineral Exploration Agreement (MEA) to allow for continued

www.erm.com Project No.: 0462113-0008 Client: TMAC Resources Inc. Page 2 of 4
HOPE BAY PROJECT 2018 Socio-economic Monitoring Program
APPENDIX A: SUMMARY OF PROJECT ACTIVITIES, 2013 TO 2018
mineral exploration and production at Hope Bay, as well as in the drafting of a Framework Agreement that governs how TMAC can access the surface of these lands for mining and exploration in the future.
Advanced exploration work in 2014 included 67,000 metres of diamond drilling primarily focussed on upgrading resource estimates at the Doris North and Madrid deposits. Additionally, several metallurgical samples were collected and analyzed for mill design purposes.
Repair and maintenance work was conducted at the Doris Project to maintain facilities in operational readiness for continued Care and Maintenance and eventual production. In 2014, chief amongst these activities was obtaining Mine Inspector approval to open the Doris underground to TMAC personnel. Additionally, the Roberts Bay jetty was repaired, the Doris airstrip was resurfaced, the main power plant was brought on-line again, and an existing maintenance facility was enlarged.
In 2014, process plant design was advanced, and drilling results were incorporated into the TMAC business case for the Hope Bay project. These results were summarized in a new Pre Feasibility Study (PFS) which was finalized in April 2015 and included the updated and increased Doris resource estimate.
With respect to licencing and permitting, TMAC conducted a number of relevant activities in 2014. A successful field season of compliance monitoring was conducted pursuant to existing licence and permit requirements for care and maintenance. TMAC continued preparation work aimed at updating the Type A Water Licence Amendment application in line with new mine planning strategies. Also, a new Type B Water Licence application, seeking approval for bulk sampling the Madrid Deposit at two locations, was submitted in 2014.
In 2014, TMAC launched a Facebook page in order to better communicate with stakeholders, participated in initial NIRB community consultation regarding the Type A Water Licence Amendment, and completed one Kitikmeot community tour to provide the public with an update on the Hope Bay project.
TMAC took the Doris North permitted gold project out of Care and Maintenance status and began working towards completing mine construction to start gold production at the Doris Deposit in early 2017.
Activities in 2015
In March 2015, TMAC successfully concluded negotiations with both the KIA and NTI, gaining long-term surface and subsurface access to the IOL portion of the Hope Bay Project. Surface access was secured for a 20 year period by means of a Framework Agreement that provides for a number of benefits to Kitikmeot Inuit including TMAC shares, a Net Smelter Royalty, and annual payment. In exchange, the KIA granted TMAC access to Hope Bay IOL for a broad range of exploration and mine development activities. Part of the Framework Agreement provides for a new Inuit Impact and Benefit Agreement (IIBA) that applies to the entire project. The existing Doris North IIBA was replaced with this agreement. Additionally, the existing Doris North Commercial Lease was replaced with an updated and renewed version.
Under the terms of the new IIBA, TMAC and the KIA concluded two Implementation Committee meetings. The IIBA Implementation Committee is intended to facilitate and support the successful execution of IIBA employment, training and contracting provisions. Additionally, TMAC and the KIA concluded two Inuit Environmental Advisory Committee (IEAC) meetings in 2015.
With respect to subsurface rights, TMAC obtained a new MEA from the NTI for a 20 year period. Updated royalty provisions are included in this new agreement. Seven existing and expiring Mineral Concession Agreements were replaced with this one agreement. Subsequently in August, TMAC activated the Production Lease provisions of the new NTI MEA for the Doris Deposit. This sub agreement allows for the production of gold from this deposit.
In April, TMAC released a new PFS for the Hope Bay Project (RPA Inc., 2015). In brief, the PFS supported the sequential development and underground mining of the three known deposit trends at

www.erm.com Project No.: 0462113-0008 Client: TMAC Resources Inc. Page 3 of 4
HOPE BAY PROJECT 2018 Socio-economic Monitoring Program
APPENDIX A: SUMMARY OF PROJECT ACTIVITIES, 2013 TO 2018
Doris, Madrid, and Boston. The development plan in the PFS includes conventional high-grade underground mining that makes use of existing surface and underground infrastructure. The updated mineral resources estimate in the PFS includes 4.5 million ounces of gold in the Measured and Indicated categories, as well as TMAC’s first reported Proven and Probable Reserves estimate of 3.5 million ounces in support of an initial 20 year mine life.
In the 2015 Amendment Application, TMAC extended the mine life for the Doris Project from a two year period of operations to six years through mining two additional mineralized zones (Doris Connector and Doris Central zones) to be accessed via the existing Doris North portal. The expanded mining program would also increase the approved mining and milling rates to 2,000 tonnes per day, and require the restructuring of the TIA to be managed as subaerial tailings with treated effluent being transported via a pipeline for discharge into Roberts Bay. A larger anticipated workforce has required an increase to the Doris Camp size.
Also in 2015, TMAC ceased being a privately held company by means of an Initial Public Offering of its shares. This offering managed to raise aggregate gross proceeds of $135 million. These proceeds will be used to advance the Hope Bay Project. Furthermore, TMAC obtained a US $120 million senior secured term loan in July 2015. With this financing in place, TMAC was able to complete construction of the Doris mine and begin gold production in early 2017.
Operationally, TMAC continued with near deposit diamond-drill exploration by Doris and Madrid in 2015, with the addition of an airborne geophysics program focused on nearby Elu belt Crown mineral claims.
At Doris Camp, TMAC undertook a number of activities including commissioning the automated controls for the existing four generator primary powerhouse at Doris, and the purchase of construction equipment to erect the processing plant building in 2016. Further, TMAC designed and completed fabrication of the processing plant building, initiated on-site construction of the processing plant building foundations, and completed the Gekko processing plant flowsheet design. TMAC took advantage of the opening of quarries and the initiation of earthworks related to the process plant foundation construction to opportunistically advance Doris Airstrip improvements aimed at lengthening and widening the airstrip. Finally, TMAC ordered long lead time items and initiated fabrication of the processing plant.
Underground operations continued in 2015. Significant activities included delivery of narrow-vein test mining equipment via an airlift in the spring and the purchase of mobile mine equipment capable of mining at a rate of 1,000 tonnes per day for delivery via sealift. TMAC also developed a narrow vein undercut test drift at Doris to validate the PFS mining model and cost assumptions, ordered the first year mining supplies for delivery by sealift, initiated and completed the widening of the Doris Mine vent raise to incorporate escape-way infrastructure, and completed a tactical plan for mine development and production.
In the fall, TMAC successfully concluded the 2015 sealift including the purchase and delivery of 15 million litres of diesel fuel and delivery of the processing plant building materials to Hope Bay to allow for erection of the building in the second and third quarters of 2016.
In October, TMAC concluded a Kitikmeot-wide community consultation tour aimed at explaining the Doris amendment application and providing a general project update. Public meetings were well attended and valuable comments received.
Activities in 2016
In 2016, TMAC focussed on completing the construction of Doris Mine. This included earthworks to complete the TIA, establish an explosives magazine, construct the process plant building and conduct a large sealift including the shipment of machinery for the process plant. The process plant was assembled in preparation for commissioning.

www.erm.com Project No.: 0462113-0008 Client: TMAC Resources Inc. Page 4 of 4
HOPE BAY PROJECT 2018 Socio-economic Monitoring Program
APPENDIX A: SUMMARY OF PROJECT ACTIVITIES, 2013 TO 2018
Concurrent with construction, underground mining continued throughout 2016 with the aim of stockpiling a quantity of ore at the surface in advance of processing.
TMAC permitting accomplishments in 2016 included the completion two public regulatory processes which resulted in the issuance of:
an amended Doris North NIRB Project Certificate (No. 003, dated September 23, 2016); and
an amended Type A Water Licence for the Doris Project (2AM-DOH1323 issued by the NWB, dated December 16, 2016).
During the latter part of 2016, TMAC began recruitment efforts aimed at developing a production workforce for the Doris mine.
Activities in 2017
TMAC commenced commercial production at Doris Mine in 2017, processing a total of 150,700 tonnes of ore mined at a grade of 11.5 g/t, containing 55,700 ounces of gold during the year. First gold was poured at Doris Mine in February, and a mine opening ceremony was conducted including community and territorial leaders in April. The focus of work at Doris Mine has been to optimize process plant availability and throughput.
In May, TMAC obtained a Type B Water Licence from the Nunavut Water Board that allows for underground bulk sampling of the Madrid deposit at two locations. Further, in the summer of 2017, TMAC undertook an underground drilling program at Doris Mine in order to examine the gold resource at depth below a diabase dyke (BTD – Below the Dyke) that intersects the ore body. This work also included exploration work at Boston Camp to further understand the Boston deposit and to support mine planning for Phase 2 (Madrid-Boston). The drilling program at Boston confirmed high grade gold zones and the potential to increases these resources, as well as Boston’s potential exploration upside, along strike and at depth.
In 2017, NIRB concluded its review of the Hope Bay Phase 2 (Madrid-Boston) Draft Environmental Impact Statement (DEIS). TMAC conducted a series of meetings in the Kitikmeot during the fall of 2017 to provide communities with updates on the Hope Bay Project, including the DEIS. Following this, TMAC submitted the Final Environmental Impact Statement (FEIS) for the proposed Madrid-Boston development in December.
Activities in 2018
The Madrid-Boston Project Final Environmental Impact Statement was submitted to NIRB in December 2017, the FEIS final hearing was held in May 2018, and Project Certificate No. 009 was awarded in November 2018. TMAC produced over 110,000 ounces of gold during the year.
The business of sustainability
ERM has over 160 offices across the following
countries and territories worldwide
Argentina
Australia
Belgium
Brazil
Canada
Chile
China
Colombia
France
Germany
Guyana
Hong Kong
India
Indonesia
Ireland
Italy
Japan
Kazakhstan
Kenya
Malaysia
Mexico
Mozambique
Myanmar
The Netherlands
New Zealand
Norway
Panama
Peru
Poland
Portugal
Puerto Rico
Romania
Russia
Singapore
South Africa
South Korea
Spain
Sweden
Switzerland
Taiwan
Tanzania
Thailand
UK
US
Vietnam
ERM’s Vancouver Office
1111 West Hastings Street
15th Floor
Vancouver, British Columbia
Canada V6E 2J3
T: +1 604 689 9460
F: +1 604 687 4277
www.erm.com