hoorzitting senaat 5 oktober 2015 - senate of belgium · hoorzitting senaat 5 oktober 2015 ....
TRANSCRIPT

Armoede bij kinderen
Frank Vandenbroucke
Hoorzitting Senaat
5 oktober 2015

Dubbele polarisatie
• Veel kinderen (< 18) wonen in ‘zeer werk-arme huishoudens’
• Zeer werk-arme huishoudens hebben hoog risico op relatieve inkomensarmoede
• Armoede: relatieve inkomensmaatstaf
• Werkintensiteit van het huishouden: 5 deelgroepen
12/06/2014 Colloquium - Working on the structural causes of child
poverty 2

Armoederisico volgens werkintensiteit van het huishouden
3
0
10
20
30
40
50
60
70
80
VHWI HWI MWI LWI VLWI
At-
risk
-of-
po
vert
y ra
te, <
18
Household work intensity
EU27, SILC 2013
BE, SILC 2013-2014
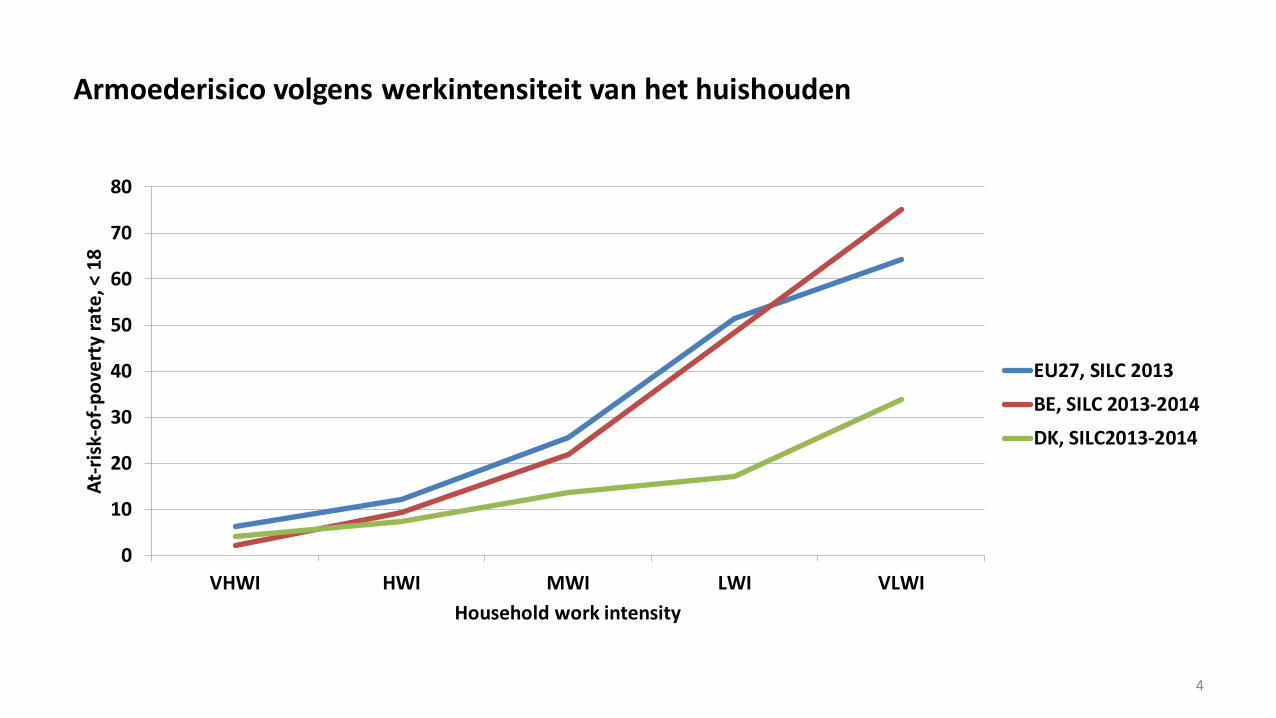
Armoederisico volgens werkintensiteit van het huishouden
4
0
10
20
30
40
50
60
70
80
VHWI HWI MWI LWI VLWI
At-
risk
-of-
po
vert
y ra
te, <
18
Household work intensity
EU27, SILC 2013
BE, SILC 2013-2014
DK, SILC2013-2014

Verdeling van de bevolking volgens werkintensiteit van het huishouden
5
0
10
20
30
40
50
60
70
VHWI HWI MWI LWI VLWI
Stru
ctu
re o
f p
op
ula
itio
n, <
18
Household Work Intensity
EU 27, SILC 2013
BE, SILC 2013-2014

Verdeling van de bevolking volgens werkintensiteit van het huishouden
6
0
10
20
30
40
50
60
70
VHWI HWI MWI LWI VLWI
Stru
ctu
re o
f p
op
ula
itio
n, <
18
Household Work Intensity
EU 27, SILC 2013
BE, SILC 2013-2014
DK, SILC 2013-2014

Bronnen
• Guio, A.-C., Vandenbroucke, F., & Vinck, J., Kinderarmoede hoger op de politieke agenda plaatsen: enkele cijfers om beter te begrijpen wat er op het spel staat. In I. Pannecoucke, W. Lahaye, J. Vrancken & R. Van Rossem (Eds.), Armoede in België. Jaarboek 2015, Ghent, Belgium: Academia Press, pp. 113-140 (NL + FR)
=> Presentatie Koning Boudewijnstichting
• Vandenbroucke, F. & Vinck, J. (2013), Bestaansonzekerheid bij kinderen: vaststellingen en uitdagingen. In: D. Dirickx (red.), Jaarboek Armoede 2013, Acco (NL).
• Vandenbroucke, F., & Vinck, J. (2015). Child poverty risks in Belgium, Wallonia and Flanders: Accounting for a worrying performance. Belgisch Tijdschrift voor Sociale Zekerheid, 57(1), pp. 51-98 (ENG).
• Corluy, V. & Vandenbroucke, F. (2015), Huishoudens zonder werk in België, Leuvense Economische Standpunten 2015/149, Faculteit Economische en Bedrijfswetenschappen-CES, KULeuven (NL).
7

CHILD POVERTY AND DEPRIVATION IN BELGIUM
Anne-Catherine Guio, Frank Vandenbroucke & Julie Vinck

Why child poverty should be a political priority?
• Large scale problem: in BE around 420.000 children (<18 years) or 18,7% at-risk-of-poverty. In EU28 +/- 20 million children or 20,8% (2011).
• Not a residual problem which can be solved by economic growth on its own.
• Some societal changes increase the risk of child poverty persisting in the future.
• Poverty threats all fundamental children’s rights.
• Intergenerational impact: consequences on nutrition, health, educational attainments, self-esteem and social relations, with long-term impact: poor children are less likely to reach their full potential when they grow up and have a higher risk of living in poverty as adults.
• Investing in children living in poverty leads to economic benefits and savings in social costs in long term. It is more costly and less successful to redress the causes of poverty at a later stage. See "Investing in children: breaking the cycle of disadvantage" (EU recommendation, 2013)
12/06/2014 Colloquium - Working on the structural causes of child poverty 9

How will we measure it?
• Child poverty is relative and multidimensional.
• Use both income poverty and child-specific material deprivation indicators a more comprehensive picture safer to rely policies on multiple measures
• Child poverty in link with household characteristics.
Keep in mind: Survey-based indicators • Confidence limits of the estimates. Lack of precision, especially at the regional level.
Data for Brussels not precise enough. • Self-declared income and deprivation (child deprivation not collected from children
themselves) • Hard-to-reach children not included.
12/06/2014 Colloquium - Working on the structural causes of child poverty 10
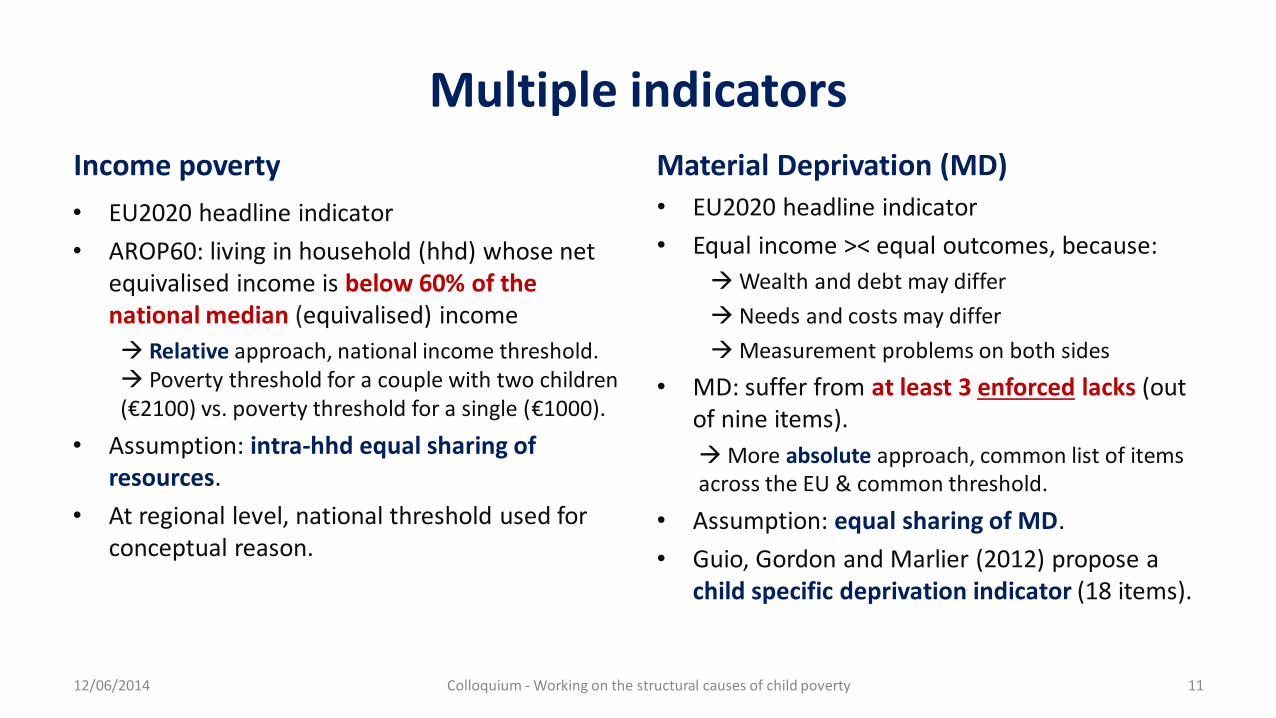
Multiple indicators
Income poverty
• EU2020 headline indicator
• AROP60: living in household (hhd) whose net equivalised income is below 60% of the national median (equivalised) income
Relative approach, national income threshold. Poverty threshold for a couple with two children (€2100) vs. poverty threshold for a single (€1000).
• Assumption: intra-hhd equal sharing of resources.
• At regional level, national threshold used for conceptual reason.
Material Deprivation (MD)
• EU2020 headline indicator
• Equal income >< equal outcomes, because:
Wealth and debt may differ
Needs and costs may differ
Measurement problems on both sides
• MD: suffer from at least 3 enforced lacks (out of nine items).
More absolute approach, common list of items across the EU & common threshold.
• Assumption: equal sharing of MD.
• Guio, Gordon and Marlier (2012) propose a child specific deprivation indicator (18 items).
12/06/2014 Colloquium - Working on the structural causes of child poverty 11

Child income poverty risk
,0
5,0
10,0
15,0
20,0
25,0
30,0
35,0
40,0
45,0
AROP60 Child [0-17] AROP60 TotalChild 0-17 Total population
12/06/2014 Colloquium - Working on the structural causes of child poverty
Source: EU-SILC 2011
! If compared to EU Regions, around 20 regions performs better/same as FL (around 10 regions /same as BR).

Child income poverty vs. child-specific material deprivation
,0
10,0
20,0
30,0
40,0
50,0
60,0
70,0
80,0
90,0
AROP60 [1-15] CHMD3 [1-15]Income poverty Deprivation
12/06/2014 Colloquium - Working on the structural causes of child poverty 13
Source: EU-SILC 2009

Child deprivation: children’s daily living conditions
0 5 10 15 20 25 30 35 40
Cumulate 3 or more problems
Indoor games
Fruits & vegetables daily
Outdoor leisure equiment
Meat, chicken or fish daily
Suitable books
School trips
Two pairs of shoes
Celebrations
Invite friends
Computer & Internet
Car
Some new clothes
Place to do homework
Home adequately warm
Leisure activities
Arrears
Replace worn-out furniture
Holiday (1 week/year)
Wallonia Flanders Brussels
High diversity among Belgian regions large disparities in daily living conditions of children within the country.
12/06/2014 Colloquium - Working on the structural causes of child poverty 14
Source: EU-SILC 2009

Regional disparities are not an exception… But require specific in depth analysis and adequate policy respons
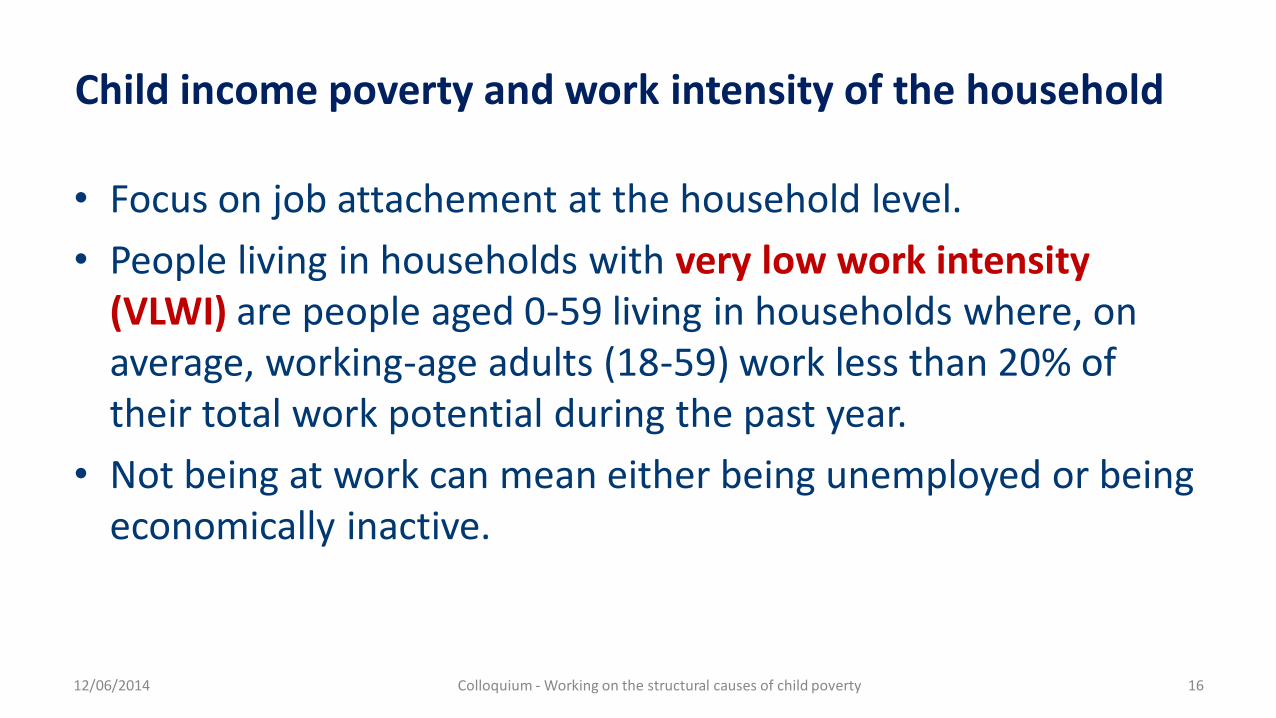
Child income poverty and work intensity of the household
• Focus on job attachement at the household level.
• People living in households with very low work intensity (VLWI) are people aged 0-59 living in households where, on average, working-age adults (18-59) work less than 20% of their total work potential during the past year.
• Not being at work can mean either being unemployed or being economically inactive.
12/06/2014 Colloquium - Working on the structural causes of child poverty 16

Child income poverty and work intensity of the household
0
5
10
15
20
25
30
35
40
45
Income poor AND very low WI [0-0,2] Income poor AND intermediate WI ]0,2-0,55]
Income poor AND high WI ]0,55-1]
12/06/2014 Colloquium - Working on the structural causes of child poverty 17
Source: EU-SILC 2011

,0
10,0
20,0
30,0
40,0
50,0
60,0
70,0
80,0
90,0
AROP60 in verylow WI HHs
AROP60 in lowWI HHs
AROP60 inmedium WI HHs
AROP60 in highWI HHs
AROP60 in veryhigh WI HHs
FL & WA - child poverty risk by work intensity (WI) group
FL ARP WA ARP
Child income poverty risk and work intensity of the household
• Low poverty risk for hhds in employment.
• BUT very high risk of poverty for those living in VLWI.
12/06/2014 Colloquium - Working on the structural causes of child poverty 18
Source: EU-SILC 2009

,0
10,0
20,0
30,0
40,0
50,0
60,0
70,0
80,0
90,0
AROP60 in verylow WI HHs
AROP60 in lowWI HHs
AROP60 inmedium WI HHs
AROP60 in highWI HHs
AROP60 in veryhigh WI HHs
FL & WA - child poverty by work intensity (WI) group (bar) and share of children in each work
intensity group (point)
FL ARP WA ARP
High child poverty risk in WA (25%), mainly due to BOTH:
• Very high share of children living in VLWI households (17%).
• AND very high risk of poverty for those living in VLWI.
• Low poverty risk for hhds in employment
VL: one of the lowest child poverty risk (10%) in the EU, mainly due to:
• Low poverty risk for hhds in employment.
• Low share of children living in VLWI hhds (6%)
• HIGH risk of poverty for those living in VLWI.
12/06/2014 Colloquium - Working on the structural causes of child poverty 19
Source: EU-SILC 2009

Lone parents (LP)
• Children living in LP hhds are at high risk of poverty: BE (43,3%), FL (24,9%) and WA (60,5%) whereas the EU27 average is 37,3% (2011).
• Share of children living in LP in WA is among the highest in the EU (19,5%) (2011).
• Children in LP have higher probability to live in very low work intensity households (VLWI): 2/3 of children living in VLWI live in lone parents hhds in WA (>< +/- 40% in FL and EU15).
• High share of VLWI within work-poor hhds in WA is explained by the higher share of LP AND the high share of VLWI among the other hhds with children living in work poverty in WA (Vandenbroucke & Vinck, 2013).
12/06/2014 Colloquium - Working on the structural causes of child poverty 20

Lone parents: impact of work intensity on child deprivation
Child deprivation risk declines with work intensity for both household types, but gradient less steep for lone parents deprivation risk remains high for lone parents working.
12/06/2014 Colloquium - Working on the structural causes of child poverty 21
Source: EU-SILC 2009
,0
10,0
20,0
30,0
40,0
50,0
60,0
70,0
80,0
Ch
ild-s
pe
cifi
c M
D3
+ ri
sk (
%)
Hhd work intensity (3 groups)
Single parents
Other householdswith children

Parents’ country of birth and child deprivation risk
Child deprivation risk declines with work intensity, but gradient less steep for children whose parents are born outside the EU. For similar work involvement, higher risk of deprivation.
In BE, non-EU have higher risk to live in VLWI (40% vs 18% at EU level). Higher share of children living with non-EU among VLWI in FL than in WA.
12/06/2014 Colloquium - Working on the structural causes of child poverty 22
Source: EU-SILC 2009
,0
10,0
20,0
30,0
40,0
50,0
60,0
70,0
80,0
Ch
ild-s
pe
cifi
c M
D3
+ ri
sk (
%)
Hhd work intensity (3 groups)
EU
Non-EU

Why high risk of poverty/deprivation among children living in low work intensity household? – Lone parent with 2 children (2y & 4y)
12/06/2014 Colloquium - Working on the structural causes of child poverty 23
Source: Storms & Bogaerts (2012)
0%
20%
40%
60%
80%
100%
120%
140%
Minimum income(OCMW/CPAS)
Minimumunemployment
benefits
Minimumdisability benefits
Minimum wage
At-risk-of-poverty threshold
Reference budget - not working -tenant private sector
Reference budget - not working -tenant social sector
Reference budget - working -tenant private sector
Reference budget - working -tenant social sector

Why high risk of poverty/deprivation among children living in low work intensity household? – Couple with 2 children (2y & 4y)
12/06/2014 Colloquium - Working on the structural causes of child poverty 24
Source: Storms & Bogaerts (2012)
0%
20%
40%
60%
80%
100%
120%
Minimum income(OCMW/CPAS)
Minimumunemployment
benefits
Minimumdisability benefits
Minimum wage
At-risk-of-poverty threshold
Reference budget - not working -tenant private sector
Reference budget - not working -tenant social sector
Reference budget - working -tenant private sector
Reference budget - working -tenant social sector

Child deprivation by income quintiles (nationally defined) Why are the poorest more deprived in WA than in FL?
0%
10%
20%
30%
40%
50%
60%
70%
Q1 Q2 Q3 Q4 Q5
Ch
ild-s
pe
cifi
c M
D3
+ ri
sk
VL WA
12/06/2014 Colloquium - Working on the structural causes of child poverty 25

Why are the poorest more deprived in WA than in FL?
1. Regional composition Q1:
– WA: higher share of (persistent) very low work intensity households, lone parents and more persistent/recurrent (monetary) poverty AND higher material deprivation risks.
– FL: higher share of non-EU parents and large families.
2. Multivariate regression analyses show an unexplained residual regional factor. FL has a lower rate of deprivation, once taken into account differences in income level, household type, work intensity of the household, educational level, country of birth…
12/06/2014 Colloquium - Working on the structural causes of child poverty 26

Risk factors – child deprivation – odds ratios
0
0,5
1
1,5
2
2,5
3
3,5
Ln(equivalisedincome)
Owner VL Non EU Very low workintensity
Single parent Primaryeducation
Significantly decrease deprivation
Significantly increase deprivation
12/06/2014 Colloquium - Working on the structural causes of child poverty 27

Poverty may be persistent/occasional with different impact on long term deprivation
12/06/2014 Colloquium - Working on the structural causes of child poverty 28
Source: Eurostat (2011)
Child persistent/non-persistent poverty rate (AROP60)
,0
5,0
10,0
15,0
20,0
25,0
30,0
35,0
40,0
45,0
Non-persistent AROP60 Child [0-17] Persistent AROP60 Child [0-17]

Risk factors – child deprivation – odds ratios – longitudinal survey
0
1
2
3
4
5
6
owner ln(equivalised
income)
VL Number ofyears inpoverty
primaryeducation
VLWI lowersecondaryeducation
Single parent
Significantly increase deprivation
Significantly decrease deprivation
12/06/2014 Colloquium - Working on the structural causes of child poverty 29
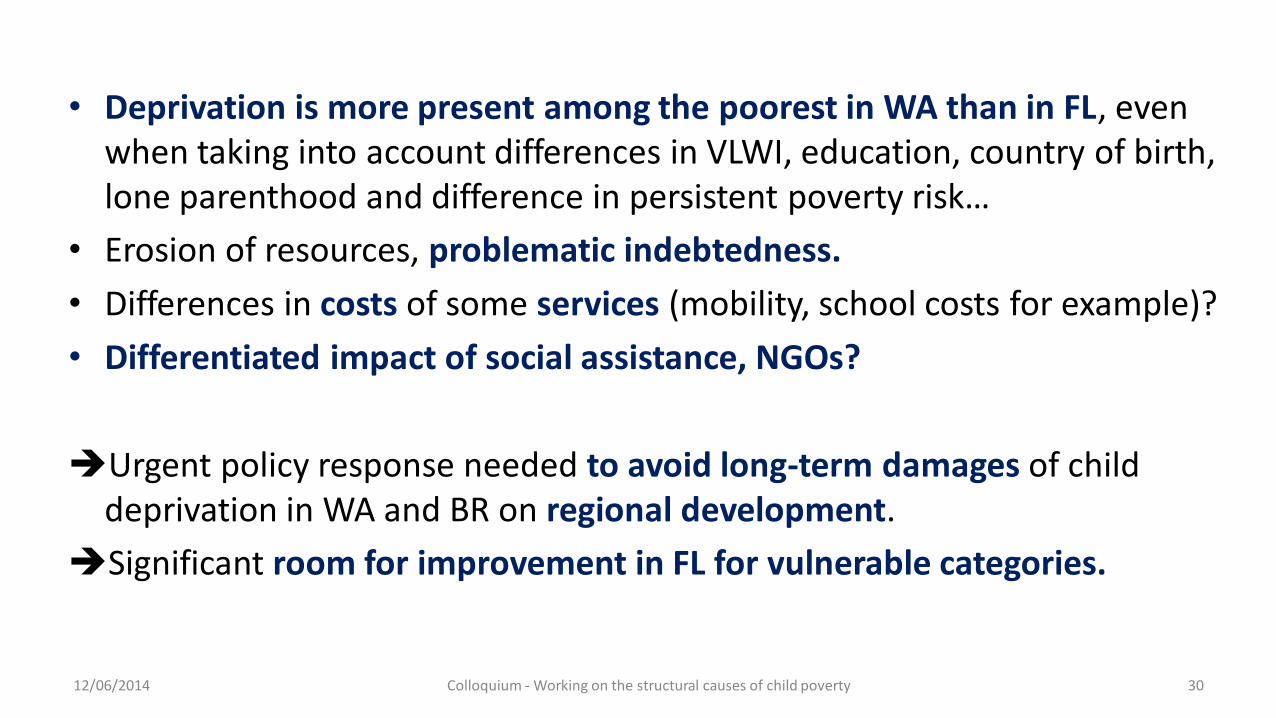
• Deprivation is more present among the poorest in WA than in FL, even when taking into account differences in VLWI, education, country of birth, lone parenthood and difference in persistent poverty risk…
• Erosion of resources, problematic indebtedness.
• Differences in costs of some services (mobility, school costs for example)?
• Differentiated impact of social assistance, NGOs?
Urgent policy response needed to avoid long-term damages of child deprivation in WA and BR on regional development.
Significant room for improvement in FL for vulnerable categories.
12/06/2014 Colloquium - Working on the structural causes of child poverty 30

Conclusions (1): what we observe • One child out of five is deprived in Belgium. • Not a residual problem which can be solved by economic growth on its own. Need investing
in children for future. • Large regional diversity, as in other countries, which deserves specific analysis and adequate
policy responses. • Household work intensity matters to explain child poverty in BE:
– In FL, low share of children living in VLWI households but high risk for those children – In WA, both high share of children living in VLWI households and high risk for those children
• But having a job not always enough to escape poverty. • Lone parents and non-EU citizens: higher risks of being VLWI and being deprived if working. • For some households with children, social transfers or minimum wage do not lift them above
poverty threshold; depends on the composition of the household • Problematic not gender neutral (LP, part-time work…) • Gap between actual resources and resources needed to reach a « decent » standard of
living for those in VLWI, or those living in hhds in which income from work is not sufficient to cover family needs (lone parents, low paid workers, large families).
12/06/2014 Colloquium - Working on the structural causes of child poverty 31

Conclusions (2): new perspectives on policy • Glass ceiling: social transfers not enough to attain poverty threshold, but rise of
social transfers constrained by risk of inactivity traps because minimum wage also lower than poverty threshold for some hhd types, such as couple or lone parents with at least two children, part-time workers etc.
Need to increase take-home pay for low wage workers, “making work pay for parents”
Need selective social programs independent of work involvement (to avoid inactivity trap and inequality among the poorest), e.g. better use of family allowances (progressive universalism)
Need to address heavy burden of some costs (housing costs, school costs (MAF in FL)…)
Need for adequate and capacitating social services (!! emancipatory role of services, e.g. child care)
Need specific regional measures (use 6th State reform). Both at regional and federal levels, urgent action needed.
12/06/2014 Colloquium - Working on the structural causes of child poverty 32

Conclusions (3): a battery of regional and federal instruments to break vicious circles
Prevention: today’s early school leavers are tomorrow’s vulnerable parents
12/06/2014 Colloquium - Working on the structural causes of child
poverty 33
0
5
10
15
20
25
30
35
2010 2011 2012
Partial indicators underpinning the Kind en Gezin ‘kansarmoede’ indicator, Antwerp
Income
Work
Education
Housing
Health
Stimulation

Conclusions (4): a battery of regional and federal instruments to break vicious circles
Opportunities:
better targeted activation (lone parents) progressive universalism in child care (sufficient supply, supportive of vulnerable parents) employment policies (decent ‘low wage’ jobs: concentrate tax measures on low paid)
Protection:
progressive universalism in child benefits:
income selectivity instead of categorial selectivity no ‘quick fixes’ w.r.t. rank of children
cost compensation for households, selective where useful and appropriate
cost of health care (the example of the maximum billing system) cost of primary and secondary education cost of housing: tough choices to be made!
12/06/2014 Colloquium - Working on the structural causes of child
poverty 34