hoo o easu e d sa y, e d sa e ew to measure disability ... · hoo o easu e d sa y, e d sa e ew to...
TRANSCRIPT

How to measure disability, the disablement o o easu e d sa y, e d sa e eprocess and early signs of disability?
• Kirsten Avlund• Professor, Dr.Med., Ph.D.Professor, Dr.Med., Ph.D.• Department of Social Medicine • Institute of Public Health • University of Copenhagen
• REVES• Copenhagen 28 May 2009
x

The disablement processp
External factors
(Social)
P th l I i t F ti l li it ti Di bilitPathology Impairments Functional limitations Disability
Genes Life Style Internal Factors
Verbrugge & Jette. Soc Sci Med, 1994.

The disablement process
• Pathologygy– Disease, injury, developmental conditions
• ImpairmentImpairment– Dysfunction and structural abnormalities in specific
body systems
• Functional limitations– Restrictions in basic physical and mental actionsp y
• Disability– Difficulties doing activities of daily lifeDifficulties doing activities of daily life

Impairments, functional limitations and disability
Impairment
A t i l
Func limitations Disability
Diffi lt i d iAnatomical,physiological,mental abnormality
Limitation inperformance at thelevel of the whole
Difficulty in doingsocially definedroles and taskse ta ab o a ty
or losslevel of the wholeperson
o es a d tas swithin a socio-cultural and
h i lphysicalenvironment
e.g.Gait assessment Walking speed Trouble walking ong p
stairs

Pathology Impairment Functional Limitation Disabililty
Denervated Atrophy of Cannot pull Change of muscle in arm due to trauma
muscle with arm job; can no longer swim recreationally y

Differentiating Functional Limitation and DisabilityDifferentiating Functional Limitation and Disability Nagi, IOM Report, 1991
DisabilityLimitation in performance of
Functional LimitationLimitation in performance Limitation in performance of
socially defined roles and tasks within a sociocultural
d h i l i t
Limitation in performance at the level of the whole organism or person
and physical environment
Functional limitation refers to organismic performance; disability refers to social performanceperformance; disability refers to social performance

M i F ti l Li it ti d Di bilitMeasuring Functional Limitations and Disability
• Functional limitations and physical disability refer to different behaviors not to differentrefer to different behaviors not to different ways of measuring the same behavior.
• Thus, you can measure functional limitations and physical disabilities using eitherand physical disabilities using either subjective or objective measures.

Examples of Objective Performance TestsExamples of Objective Performance Tests Used to Evaluate Functional Limitations
• Pegboard test• Picking up object• Picking up object• Lifting 10 pounds
G i d• Gait speed• Chair rise – single and repeated• Stair climb

M t f di bilit i l dMost measures of disability include
Mobility e g walk on stairs take long walksMobility e.g. walk on stairs, take long walks
ADL Activities of Daily Living e.g. bathing, dressing
IADL Instrumental Activities of Daily Living e.g. housework shoppinghousework, shopping

Most measures of disability are based on questions y qabout ability to perform on activity with or without
-need of helpp
-difficulties
-pain
t h i l id-technical aids
-tiredness
-reduced speed

What do the 70-year-olds do? Examples in %
Men Women p(n) (366) (368)
Mobility
Walk outside in nice weather 100 100
Walk on stairs 99 99
ADL
Wash upper body 100 100
Shoes /Stockings on/off 100 100g
IADL
Cook for guests 18 89 ***Cook for guests 18 89
Garden work 71 54 ***
P describes gender differences by Chi-Square test. *** p<0.001
Source: Avlund & Schultz-Larsen 1991

R f f i IADL i iReasons for not performing an IADL-activity
1) Irrelevant
2) N d h d i2) No need, another person does it
3) Doesn´t know how to to it
4) Not motivated
5) Physical problems5) Physical problems
6) Health problems
7) Fear of falling
8) Problems in the physical environment
Source: Myers. Med Care 1992;30:MS96-111.

Recommendations for measures ofRecommendations for measures of disablement process
• Be cautious about– Combining measures of different conceptsCombining measures of different concepts
in the disablement process– Combining measures of ADL and IADL– Combining measures of ADL and IADL

The disablement processp
Early signs of disability
P th l I i t F ti l li it ti Di bilitPathology Impairments Functional limitations Disability

Indicators of later disability
• Inflammation (Ferrucci et al. 1999; Penninx et al. 2004)
• Inflammation in the periodontium (Holm-Pedersen 2006; Avlund et al. 2009)
H d i h• Hand grip strength (Rantanen et al. 1999)
• Physical performance (Guralnik et al. 1995; Gill et al. 1996; Ostir et al. 1998)
• Difficulty with ADL (Sonn et al. 1996; Gill et l 1998)al. 1998)
• Task modification (Fried et al. 2001; Mänty et al 2006)al. 2006)
• Perceived security (Dahlin Ivanoff 2006)
• Fatigue in daily activities (Avlund et al. 1995-• 2008)

Risk of incident disability in mobility y yafter 18 months*
Difficulty Difficulty walking ½ mile climbing up
Task modification but no difficulty
walking ½ mile climbing up
3.77(1.91-7.47) 3.86(1.83-8.17)yin tasks
( ) ( )
*Adjusted by walking speed, stair climb speed, age, education, living alone, chronic diseases, depression, knee strength, balance
Source: Fried et al. J. Gerontol: Med Sci 2000; 55A: M43-M52

Task modification as indicator of early decline inTask modification as indicator of early decline in perfomance and early disease
Walking Exercise Muske Balance speed tolerance strength(sec) (sec on tread mill) (sec)
W lki ½ ilWalking ½ mile
Hi h f i Hi h d Hi h d S Hi h dHigh function Higher speed Higher speed Stronger Higher speed
Task modification
Diffi lt Sl d Sl d W k Sl dDifficulty Slower speed Slower speed Weaker Slower speed p value - Trendtest 0.001 0.001 0.001 0.001
Source: Fried et al. J Clin Epidemiol 2001; 54: 889-901
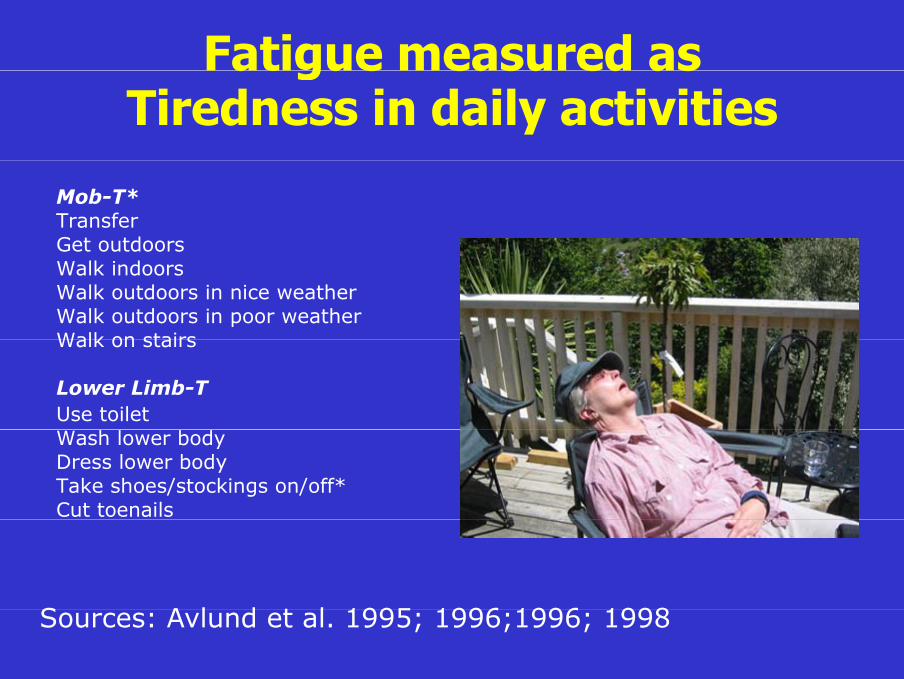
Fatigue measured asFatigue measured asTiredness in daily activities
Mob-T* Transfer Get outdoors Get outdoors Walk indoors Walk outdoors in nice weather Walk outdoors in poor weather Walk on stairs Walk on stairs Lower Limb-T Use toilet Wash lower body Dress lower body Take shoes/stockings on/off* Cut toenails
S A l d t l 1995 1996 1996 1998Sources: Avlund et al. 1995; 1996;1996; 1998

Odds ratios (95% CI) for onset of di bilit t fi f ll bdisability at five year follow-up by
fatigue at age 75
Mobility disability Disability in ADLMobility disability (n = 510)
Disability in ADL(n = 429)
Tired in 2-4 activitiesTired in 1 activity Not tired
3.2 (1.4-7.6) 1.7 (0.8-3.8) 1.0
2.1 (1.0-4.2) 2.0 (1.0-3.9) 1.0Not tired 1.0 1.0
Adjusted by sex chronic diseases cognitive function self-rated health
Adjusted by sex, chronic diseases, cognitive function, self rated health,depressive symptoms, housing tenure, social relations, physical activity
Source: Avlund et al. J Clin Epidemiol 2002Source: Avlund et al. J Clin Epidemiol 2002
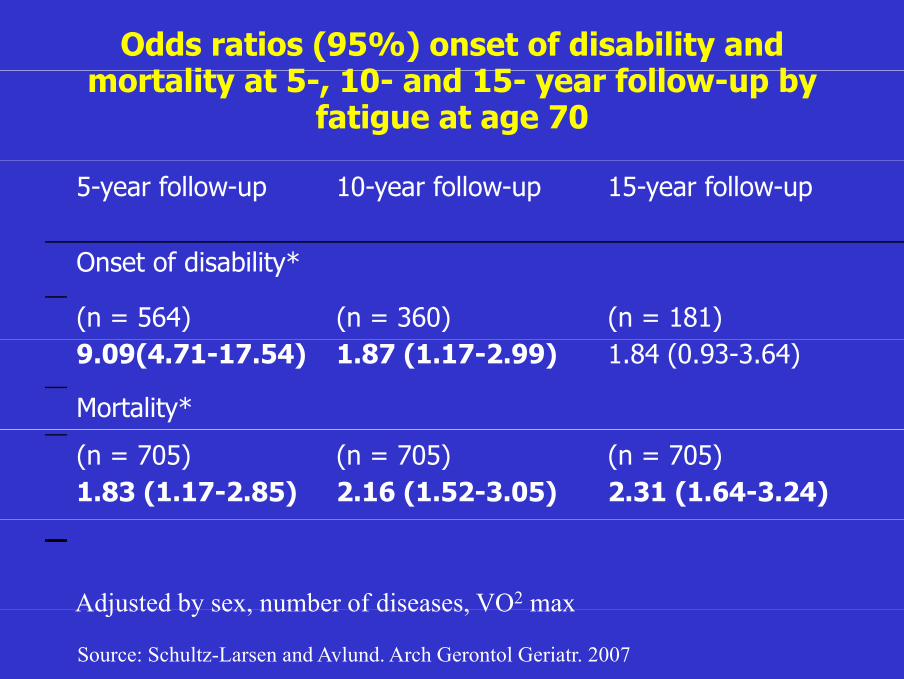
Odds ratios (95%) onset of disability and t lit t 5 10 d 15 f ll bmortality at 5-, 10- and 15- year follow-up by
fatigue at age 70
5-year follow-up 10-year follow-up 15-year follow-up
Onset of disability*
(n = 564) (n = 360) (n = 181)9.09(4.71-17.54) 1.87 (1.17-2.99) 1.84 (0.93-3.64)
Mortality*
(n = 705)1.83 (1.17-2.85)
(n = 705)2.16 (1.52-3.05)
(n = 705)2.31 (1.64-3.24)
Adjusted by sex, number of diseases, VO2 maxAdjusted by sex, number of diseases, VO max
Source: Schultz-Larsen and Avlund. Arch Gerontol Geriatr. 2007

Survival curves among 70-year-olds with and g ywithout fatigue during 21 year follow-up

Onset of walking limitation at 5-year f llfollow-up
• Measured by a 10 meter laboratory test using a stop watchusing a stop watch
• Onset of walking limitations was defined as onset into the slowest quartile ofas onset into the slowest quartile of maximal walking speed: > 1.33 m / sec.

Odds ratios (95% CI) for onset ofOdds ratios (95% CI) for onset of walking limitations at 5-year follow-up
by fatigue (n = 319)by fatigue (n = 319)
Crude Adjusted*
Tired Not tired
3.97(2.16-7.29)1.0
2.78(1.43-5.41)1.0
* Adjusted by sex, walking speed and chronic diseases at baseline
Source: Avlund, Sakari-Rantala, Rantanen et al. J Am Geriatr Soc. 2004

Fatigue measured as Ti d i d il ti iti iTiredness in daily activities is
predictive of • Onset of disability after
• 1 year (Avlund et al. 2008)
• 1½ years (Avlund et al 2003)• 1½ years (Avlund et al. 2003)
• 5 years (Avlund et al. 2002; 2003; Schultz Larsen et al 2007)Schultz-Larsen et al. 2007)
• 10 years (Avlund et al. 2003; Schultz-Larsen et al 2007)Larsen et al. 2007)
• 15 years (Schultz-Larsen et al. 2007)

Fatigue measured asTi d i d il ti iti iTiredness in daily activities is
predictive of p• Onset of disability
• Both in young, young old and oldyoung-old and old-old populations
• In different hi l litigeographic localities
•

Fatigue measured asTi d i d il ti iti iTiredness in daily activities is
predictive of p• Onset of walking limitations• (Avlund et al. 2004)
• Use of health and social services
• (Avlund et al. 2001)(Avlund et al. 2001)
• Decline in physical activity• (Elkjær et al. 2006)
• Mortality• (Avlund et al. 1998; Avlund et al. 2003;
Schultz-Larsen et al. 2007)

Factors related to fatigue in non-disabled older d ltadults
Social position
PathologyComorbiditySpecific diseases
ImpairmentsMuscle strengthPain
Walkingli i i
p Specific diseasesUse of medication
PainCognitive performance VO2 Max
limitations
P h l i l fPsychological factorsDepressive mood
Fatigue in daily activities
Sources: Schultz-Larsen 1992; Avlund et al. 1994a; 1997; 2003c; 2006; 2007

Conclusions
• Fatigue is influenced by multiple potential• Fatigue is influenced by multiple potential modifiable factors
• None of these factors explain the associations between fatigue and the various outcomes
•Fatigue may be thus be regarded as a•Fatigue may be thus be regarded as a subjective measure of frailty
•Fatigue may be used to identify non-disabled individuals at high risk of functional decline

New research questions about early signs of disability will be followed during the nextdisability will be followed during the next
years at
Th R h G i G t l t D t t f S i l• The Research Group in Gerontology at Department of Social Medicine
• In collaboration with• In collaboration with• Copenhagen Aging and Midlife Biobank (CAMB) - supported
by the VELUX FOUNDATIONby U OU O
• Danish Research Center for Ageing (DARC) - Odense, g g ( ) ,Aarhus, København – supported by the VELUX FOUNDATION
• Center for Healthy Aging (CESA) – The Faculty of Health Sciences University of Copenhagne Supported by theSciences, University of Copenhagne, Supported by the Nordea-Denmark Foundation