hong kong buy samsonite - kim eng · pdf filesee appendix i for important disclosures and...
TRANSCRIPT

SEE APPENDIX I FOR IMPORTANT DISCLOSURES AND ANALYST CERTIFICATIONS
Hong KongInitiating Coverage 18 February 2013
Samsonite Suitcase of Earnings; Initiate with BUY Strong earnings visibility. We initiate coverage on Samsonite with a BUY recommendation, with 18% upside to our Street-high TP. Our TP of HKD21.2 is derived at 18.7X FY13F PER, as we benchmark it to its global peers’ average. Our top of consensus earnings forecast implies 23.2% adjusted net profit CAGR over FY13F-14F, backed by rapidly growing sales in Asia and continuing market share gains in the developed world. We believe its sales efficiency will increase on better cross-selling opportunities arising from its multi-brand product portfolio, and as it makes further inroads into the business and casual categories.
Restructuring effort is paying off. In 2009, Samsonite carried out a series of operational and financial restructuring moves to improve its cost structure and increase autonomy across different regional markets. It has reduced in-house production to 6% of total products currently, and its asset-light model allows it to focus on its key competencies – R&D and innovation. The initiatives have been successful, as reflected by strong sales growth and good cost savings. We believe the flexible, decentralised management structure has substantially increased its responsiveness to changes within different markets, and allows better competitiveness in tailor-making products to suit different preferences.
Multi-brand strategy to capture growth. Samsonite has adopted a multi-brand strategy, as this enables the company to cover different customer groups without hurting its brand value. “Samsonite” and “American Tourister” are targeted at high-end and value-conscious customers, respectively. It has also introduced various sub-brands such as “Saxoline” and “Xtrem” to broaden its product coverage in emerging markets. The company acquired “High Sierra” and “Hartmann“ in 2012, which enabled it to extend its reach into the casual outdoor and sports segments, as well as lucrative high-end markets in US.
Growth potential waiting to be tapped. Samsonite mainly derives its sales from wholesale channels. We believe the currently low sales contribution from retail channels implies significant growth potential ahead. Samsonite’s minimal presence in the business and casual luggage categories also indicates it has significant room to grow. Last but not least, we believe Samsonite is well-poised to further grow its sales in the high-growth emerging markets, as it capitalises on its existing network and positive word of mouth recommendations. Samsonite – Summary Earnings Table Source: Company data, Maybank KE
FYE Dec (USDm) 2011A 2012F 2013F 2014FRevenue 1,565 1,762 2,051 2,384Adjusted EBITDA 248 284 336 391Adjusted Net Profit 137 167 204 254Adjusted Basic EPS (USD) 0.10 0.12 0.15 0.18Adjusted EPS growth (%) 23.24 17.45 22.17 24.16DPS (USD) 0.00 0.02 0.03 0.04PER 22.8 19.4 15.9 12.8EV/ adj. EBITDA (x) 17.4 14.7 12.0 9.9Div Yield (%) 0.0 1.0 1.3 1.6P/BV(x) 3.4 3.1 2.7 2.3Net Gearing (%) Net cash Net cash Net cash Net cashAdjusted ROE (%) 16.50 17.08 18.31 19.73Adjusted ROA (%) 16.53 20.84 22.17 22.77Consensus Net Profit (USDm) - 163 190 227
Buy
Share price: HKD17.96 Target price: HKD21.20
Jacqueline KO, CFA [email protected] (852) 2268 0633
Stock Information
Description: Samsonite is currently the largest travel luggage player globally with over 100 years of heritage. Ticker: 1910 HK Shares Issued (m): 1,407.1 Market Cap (USDm): 3,240.0 3-mth Avg Daily Turnover (USDm): 14.6 HSI: 23,445 Free Float (%): 71.00 Major Shareholders: % CVC 9.83 Wellington 8.96 RBS 5.27 CEO Timothy Charles Parker 4.16 Tainwala Ramesh Dungarmal 0.78 Key Indicators
Adjusted ROE – annualised (%) 17.1 Net cash (HKDm): 280.8 NTA/shr (HKD): 5.8 Interest cover (x): 28.0 Historical Chart
Performance: 52-week High/Low HKD18.8/HKD11.2 1-mth 3-mth 6-mth 1-yr YTD Absolute (%) 9.4 18.3 30.0 32.6 12.4 Relative (%) 10.0 7.5 13.4 23.6 8.9 * Note all stocks’ pricing date is as of 15 February 2013 closing
0.0
5.0
10.0
15.0
20.0
25.0
Feb 12 Apr 12 Jun 12 Aug 12 Oct 12 Dec 12 Feb 13
PRICE PRICE REL. TO HANG SENG INDEX
Source: Bloomberg
18 February 2013 Page 2 of 37
Samsonite International S.A.
Maybank Kim Eng vis-à-vis consensus
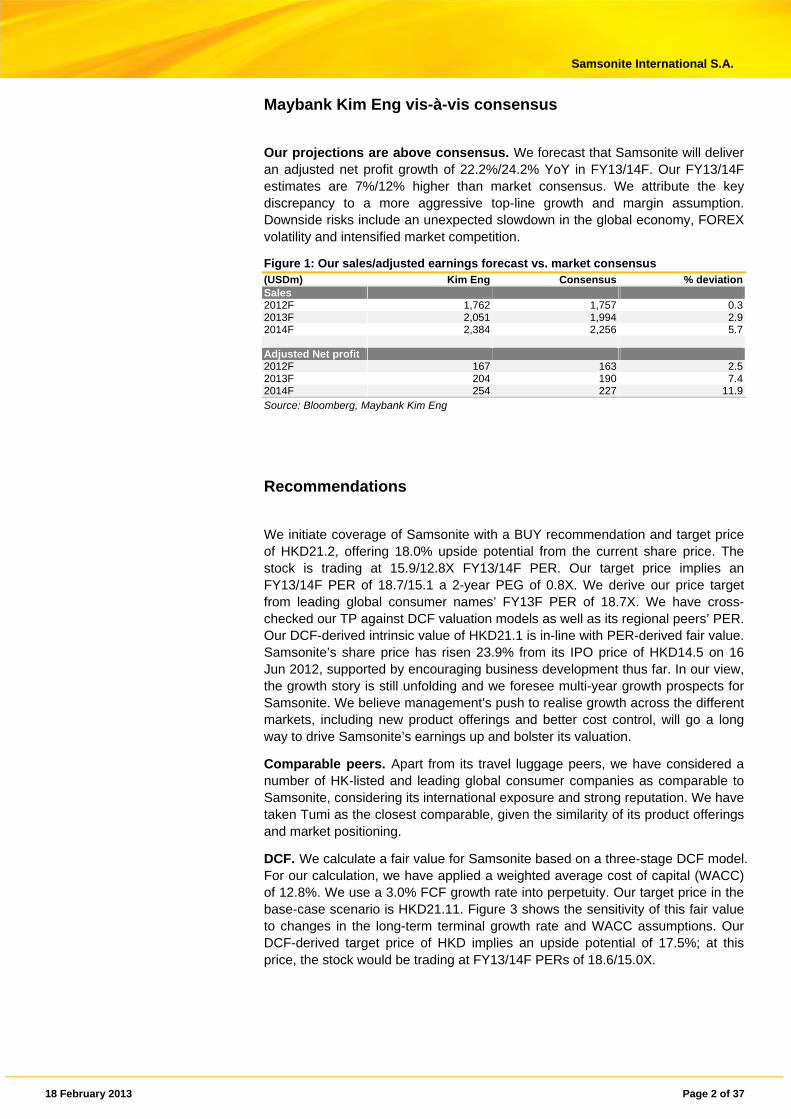
Our projections are above consensus. We forecast that Samsonite will deliver an adjusted net profit growth of 22.2%/24.2% YoY in FY13/14F. Our FY13/14F estimates are 7%/12% higher than market consensus. We attribute the key discrepancy to a more aggressive top-line growth and margin assumption. Downside risks include an unexpected slowdown in the global economy, FOREX volatility and intensified market competition.
Figure 1: Our sales/adjusted earnings forecast vs. market consensus (USDm) Kim Eng Consensus % deviationSales 2012F 1,762 1,757 0.32013F 2,051 1,994 2.92014F 2,384 2,256 5.7 Adjusted Net profit 2012F 167 163 2.52013F 204 190 7.42014F 254 227 11.9Source: Bloomberg, Maybank Kim Eng
Recommendations
We initiate coverage of Samsonite with a BUY recommendation and target price of HKD21.2, offering 18.0% upside potential from the current share price. The stock is trading at 15.9/12.8X FY13/14F PER. Our target price implies an FY13/14F PER of 18.7/15.1 a 2-year PEG of 0.8X. We derive our price target from leading global consumer names’ FY13F PER of 18.7X. We have cross-checked our TP against DCF valuation models as well as its regional peers’ PER. Our DCF-derived intrinsic value of HKD21.1 is in-line with PER-derived fair value. Samsonite’s share price has risen 23.9% from its IPO price of HKD14.5 on 16 Jun 2012, supported by encouraging business development thus far. In our view, the growth story is still unfolding and we foresee multi-year growth prospects for Samsonite. We believe management’s push to realise growth across the different markets, including new product offerings and better cost control, will go a long way to drive Samsonite’s earnings up and bolster its valuation.
Comparable peers. Apart from its travel luggage peers, we have considered a number of HK-listed and leading global consumer companies as comparable to Samsonite, considering its international exposure and strong reputation. We have taken Tumi as the closest comparable, given the similarity of its product offerings and market positioning.
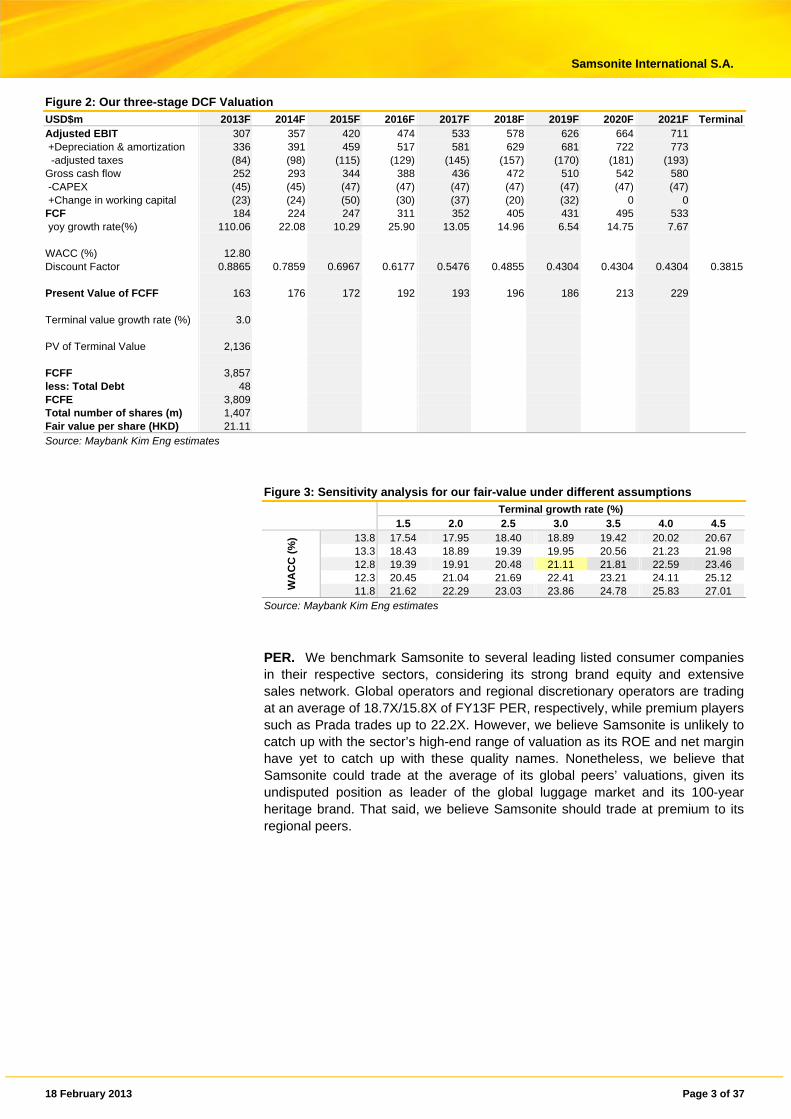
DCF. We calculate a fair value for Samsonite based on a three-stage DCF model. For our calculation, we have applied a weighted average cost of capital (WACC) of 12.8%. We use a 3.0% FCF growth rate into perpetuity. Our target price in the base-case scenario is HKD21.11. Figure 3 shows the sensitivity of this fair value to changes in the long-term terminal growth rate and WACC assumptions. Our DCF-derived target price of HKD implies an upside potential of 17.5%; at this price, the stock would be trading at FY13/14F PERs of 18.6/15.0X.
18 February 2013 Page 3 of 37
Samsonite International S.A.
Figure 2: Our three-stage DCF Valuation
USD$m 2013F 2014F 2015F 2016F 2017F 2018F 2019F 2020F 2021F TerminalAdjusted EBIT 307 357 420 474 533 578 626 664 711 +Depreciation & amortization 336 391 459 517 581 629 681 722 773 -adjusted taxes (84) (98) (115) (129) (145) (157) (170) (181) (193)Gross cash flow 252 293 344 388 436 472 510 542 580 -CAPEX (45) (45) (47) (47) (47) (47) (47) (47) (47) +Change in working capital (23) (24) (50) (30) (37) (20) (32) 0 0 FCF 184 224 247 311 352 405 431 495 533 yoy growth rate(%) 110.06 22.08 10.29 25.90 13.05 14.96 6.54 14.75 7.67 WACC (%) 12.80 Discount Factor 0.8865 0.7859 0.6967 0.6177 0.5476 0.4855 0.4304 0.4304 0.4304 0.3815 Present Value of FCFF 163 176 172 192 193 196 186 213 229 Terminal value growth rate (%) 3.0 PV of Terminal Value 2,136 FCFF 3,857 less: Total Debt 48 FCFE 3,809 Total number of shares (m) 1,407 Fair value per share (HKD) 21.11 Source: Maybank Kim Eng estimates
Figure 3: Sensitivity analysis for our fair-value under different assumptions
Terminal growth rate (%) 1.5 2.0 2.5 3.0 3.5 4.0 4.5
WA
CC
(%
) 13.8 17.54 17.95 18.40 18.89 19.42 20.02 20.67 13.3 18.43 18.89 19.39 19.95 20.56 21.23 21.98 12.8 19.39 19.91 20.48 21.11 21.81 22.59 23.46 12.3 20.45 21.04 21.69 22.41 23.21 24.11 25.12 11.8 21.62 22.29 23.03 23.86 24.78 25.83 27.01
Source: Maybank Kim Eng estimates
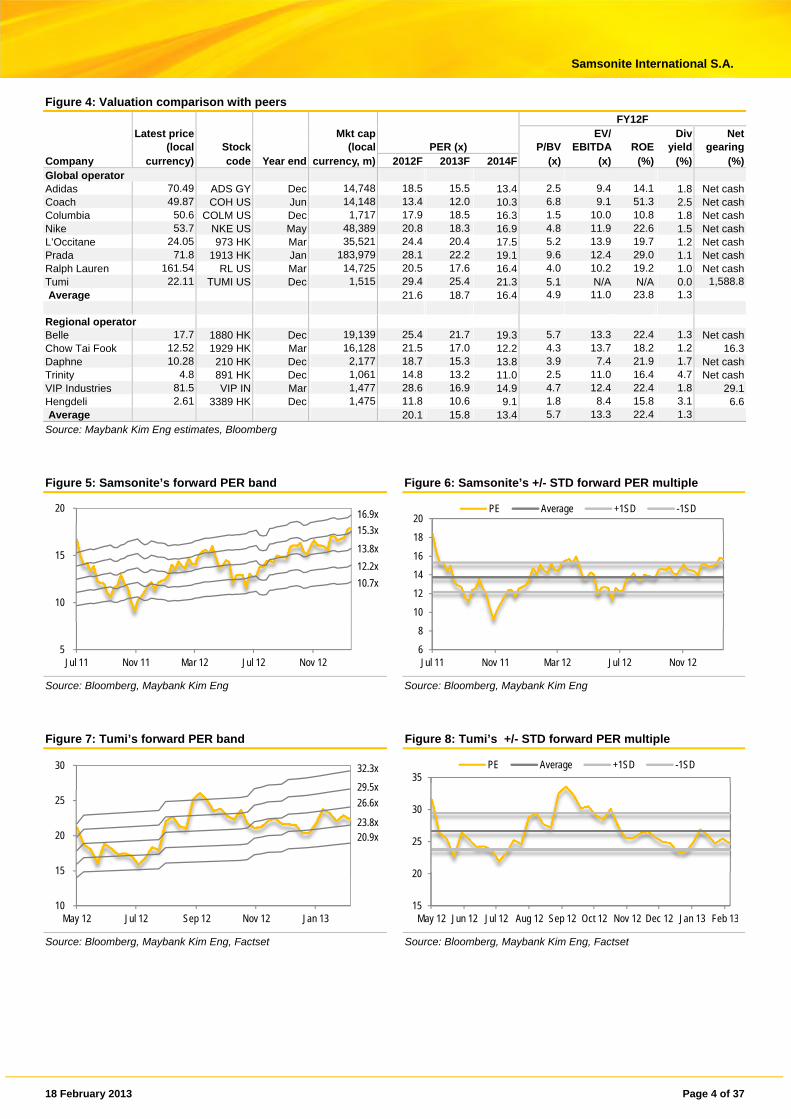
PER. We benchmark Samsonite to several leading listed consumer companies in their respective sectors, considering its strong brand equity and extensive sales network. Global operators and regional discretionary operators are trading at an average of 18.7X/15.8X of FY13F PER, respectively, while premium players such as Prada trades up to 22.2X. However, we believe Samsonite is unlikely to catch up with the sector’s high-end range of valuation as its ROE and net margin have yet to catch up with these quality names. Nonetheless, we believe that Samsonite could trade at the average of its global peers’ valuations, given its undisputed position as leader of the global luggage market and its 100-year heritage brand. That said, we believe Samsonite should trade at premium to its regional peers.
18 February 2013 Page 4 of 37
Samsonite International S.A.
Figure 4: Valuation comparison with peers
FY12F Latest price Mkt cap EV/ Div Net (local Stock (local PER (x) P/BV EBITDA ROE yield gearingCompany currency) code Year end currency, m) 2012F 2013F 2014F (x) (x) (%) (%) (%)Global operator Adidas 70.49 ADS GY Dec 14,748 18.5 15.5 13.4 2.5 9.4 14.1 1.8 Net cashCoach 49.87 COH US Jun 14,148 13.4 12.0 10.3 6.8 9.1 51.3 2.5 Net cashColumbia 50.6 COLM US Dec 1,717 17.9 18.5 16.3 1.5 10.0 10.8 1.8 Net cashNike 53.7 NKE US May 48,389 20.8 18.3 16.9 4.8 11.9 22.6 1.5 Net cashL’Occitane 24.05 973 HK Mar 35,521 24.4 20.4 17.5 5.2 13.9 19.7 1.2 Net cashPrada 71.8 1913 HK Jan 183,979 28.1 22.2 19.1 9.6 12.4 29.0 1.1 Net cashRalph Lauren 161.54 RL US Mar 14,725 20.5 17.6 16.4 4.0 10.2 19.2 1.0 Net cashTumi 22.11 TUMI US Dec 1,515 29.4 25.4 21.3 5.1 N/A N/A 0.0 1,588.8 Average 21.6 18.7 16.4 4.9 11.0 23.8 1.3 Regional operator Belle 17.7 1880 HK Dec 19,139 25.4 21.7 19.3 5.7 13.3 22.4 1.3 Net cashChow Tai Fook 12.52 1929 HK Mar 16,128 21.5 17.0 12.2 4.3 13.7 18.2 1.2 16.3Daphne 10.28 210 HK Dec 2,177 18.7 15.3 13.8 3.9 7.4 21.9 1.7 Net cashTrinity 4.8 891 HK Dec 1,061 14.8 13.2 11.0 2.5 11.0 16.4 4.7 Net cashVIP Industries 81.5 VIP IN Mar 1,477 28.6 16.9 14.9 4.7 12.4 22.4 1.8 29.1Hengdeli 2.61 3389 HK Dec 1,475 11.8 10.6 9.1 1.8 8.4 15.8 3.1 6.6 Average 20.1 15.8 13.4 5.7 13.3 22.4 1.3
Source: Maybank Kim Eng estimates, Bloomberg
Figure 5: Samsonite’s forward PER band Figure 6: Samsonite’s +/- STD forward PER multiple
Source: Bloomberg, Maybank Kim Eng Source: Bloomberg, Maybank Kim Eng
Figure 7: Tumi’s forward PER band Figure 8: Tumi’s +/- STD forward PER multiple
Source: Bloomberg, Maybank Kim Eng, Factset Source: Bloomberg, Maybank Kim Eng, Factset
5
10
15
20
Jul 11 Nov 11 Mar 12 Jul 12 Nov 12
16.9x
15.3x
13.8x
12.2x
10.7x
6
8
10
12
14
16
18
20
Jul 11 Nov 11 Mar 12 Jul 12 Nov 12
PE Average +1SD -1SD
10
15
20
25
30
May 12 Jul 12 Sep 12 Nov 12 Jan 13
32.3x
29.5x
26.6x
23.8x20.9x
15
20
25
30
35
May 12 Jun 12 Jul 12 Aug 12 Sep 12 Oct 12 Nov 12 Dec 12 Jan 13 Feb 13
PE Average +1SD -1SD
18 February 2013 Page 5 of 37
Samsonite International S.A.
Peer comparison
VF Corp. Established in 1899, US-based VF is an apparel and footwear conglomerate which owns 35 brands. Its brands include “The North Face”, “Jansport”, “Kipling”, “Wrangler”, “Timberland”, “Eagle Creek”, etc. It focuses more on casual bags and hence is not a direct competitor to Samsonite. Its sales reached USD9.5b in 2011.
VIP Industries. VIP is listed on the BSE. It is an Indian-based multinational company. Its public financial data show that majority of its sales are derived from the domestic Indian market. It owns the brand VIP and Carlton (acquired in 2004) and other local brands such as Aristocrat Luggage, Alfa, Skybags, etc.
Tumi. Tumi was founded in 1975 and listed on NYSE on 19 Apr 2012. It has been owned by Doughty Hanson & Co. since 2004. Sales reached USD272m in 9M12 with an adjusted EBITDA and net margin of 19.1%/7.3% respectively. It sells its products in over 70 countries through approximately 1,600 distribution points. Around half of its sales come from its own stores, while the rest are from its wholesale operations. Tumi’s products are renowned for their black-on-black ballistic nylon. The company operates around 100 company-owned locations in various formats including full-price stores, outlet stores and e-commerce website. Its retail sales accounted for 48% of its net sales in 2011. Travel-related items make up of around half of its sales.
Ace. Japan-based Ace was found in 1940. It has four sub-brands to tap different market segments: Ace Gene, Progres, ProtecA and ACE. Ace Gene is targeted at the businessmen, while Progres focuses on women. ProtecA is mainly for frequent travelers.
Delsey. Formed in 1911, Delsey previously specialised in the manufacture of cases for cameras and covered cases for typewriters and record players, before moving into the travel items in 1946. In 1970, Delsey created the first French, high-range, rigid ABS luggage line – the DELSEY AIRSTYLE suitcase. Delsey now has a presence in over 110 countries on five continents, and holds a market share of ~30% in its home market, France. In Jan 2007, UK-based Argan Capital partnered with the existing management team to lead a buyout of the company.
Rimowa. Founded in 1898, Cologne-based Rimowa is a famous luxury German brand. It is privately owned by the Morszeck family. Its products are renowned for their excellent materials, brilliant technology, impressive design and high-quality workmanship. Mr. Richard Morszeck, son of the founder Paul Morszeck, invented the world’s first aluminum travel case in 1937. In 2000, Dieter Moszeck invented polycarbonate (used in aerospace technology) cases for the brand. All its Rimowa cases are German-engineered and 100% crafted in its four factories in Gemany, Czech Republic, Canada and Brazil. In 2011, Rimowa Group manufactured over 750,000 cases and sold in over 65 countries around the world. Rimowa recorded sales of approximately EUR145m in FY11 (+45% YoY).
Crown. Established in 1952, Taiwan-based Crown has transformed itself from an OEM player to a manufacturer of branded travel luggage under the brands “Crown” and “Lojel”, etc.. It has a presence in over 100 countries and regions. Its main production base is located in Guangdong Zhongshan. It chalked up sales of TWD4b in 2011.
18 February 2013 Page 6 of 37
Samsonite International S.A.
Financial comparison with Tumi
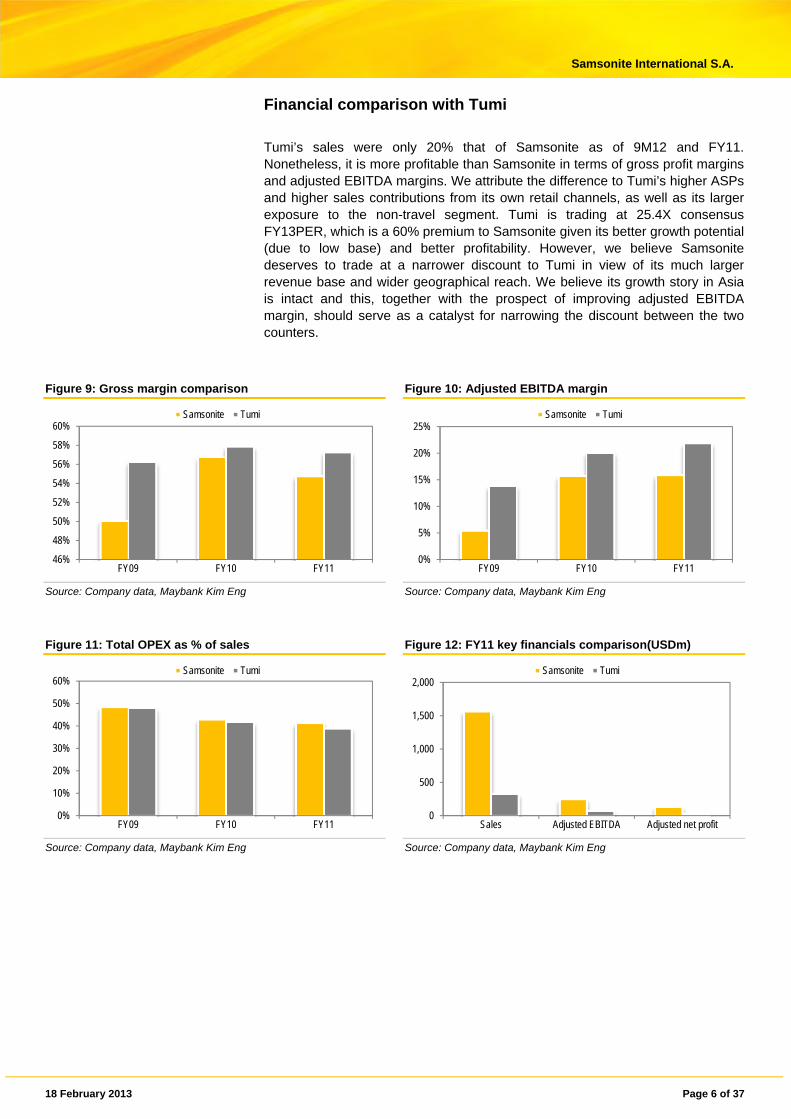
Tumi’s sales were only 20% that of Samsonite as of 9M12 and FY11. Nonetheless, it is more profitable than Samsonite in terms of gross profit margins and adjusted EBITDA margins. We attribute the difference to Tumi’s higher ASPs and higher sales contributions from its own retail channels, as well as its larger exposure to the non-travel segment. Tumi is trading at 25.4X consensus FY13PER, which is a 60% premium to Samsonite given its better growth potential (due to low base) and better profitability. However, we believe Samsonite deserves to trade at a narrower discount to Tumi in view of its much larger revenue base and wider geographical reach. We believe its growth story in Asia is intact and this, together with the prospect of improving adjusted EBITDA margin, should serve as a catalyst for narrowing the discount between the two counters.
Figure 9: Gross margin comparison Figure 10: Adjusted EBITDA margin
Source: Company data, Maybank Kim Eng Source: Company data, Maybank Kim Eng
Figure 11: Total OPEX as % of sales Figure 12: FY11 key financials comparison(USDm)
Source: Company data, Maybank Kim Eng Source: Company data, Maybank Kim Eng
46%
48%
50%
52%
54%
56%
58%
60%
FY09 FY10 FY11
Samsonite Tumi
0%
5%
10%
15%
20%
25%
FY09 FY10 FY11
Samsonite Tumi
0%
10%
20%
30%
40%
50%
60%
FY09 FY10 FY11
Samsonite Tumi
0
500
1,000
1,500
2,000
Sales Adjusted EBITDA Adjusted net profit
Samsonite Tumi
18 February 2013 Page 7 of 37
Samsonite International S.A.
Our earnings projections
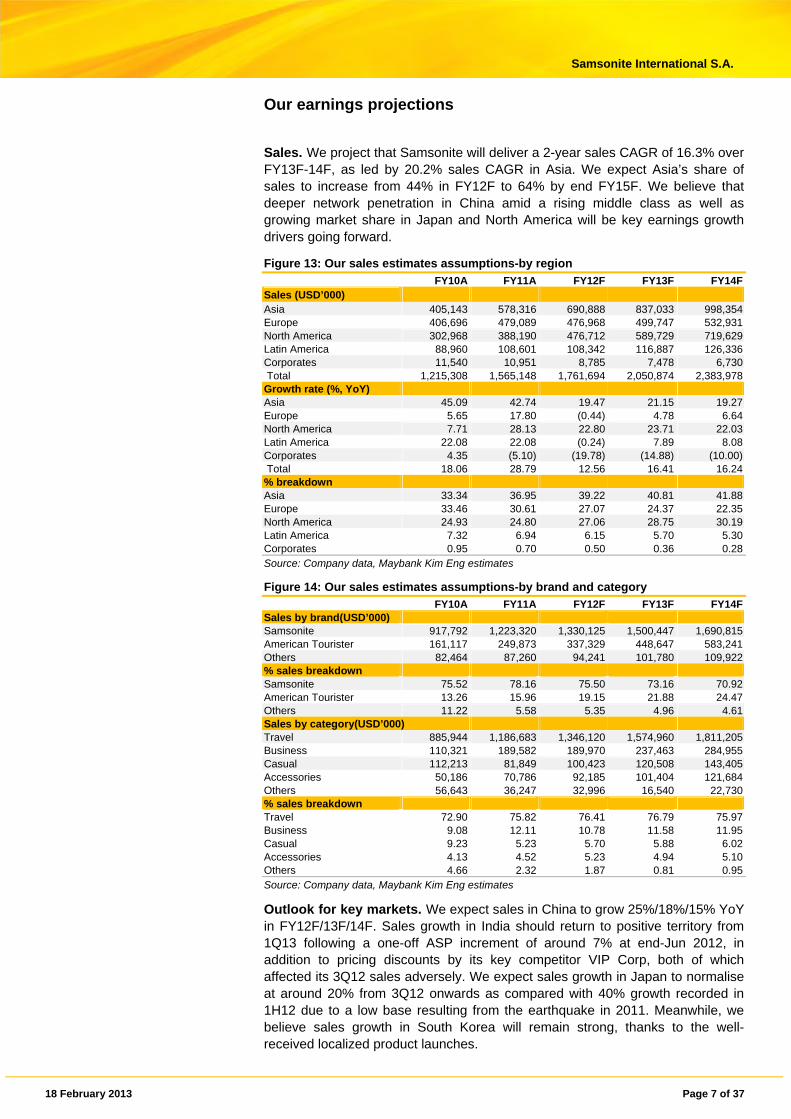
Sales. We project that Samsonite will deliver a 2-year sales CAGR of 16.3% over FY13F-14F, as led by 20.2% sales CAGR in Asia. We expect Asia’s share of sales to increase from 44% in FY12F to 64% by end FY15F. We believe that deeper network penetration in China amid a rising middle class as well as growing market share in Japan and North America will be key earnings growth drivers going forward.
Figure 13: Our sales estimates assumptions-by region
FY10A FY11A FY12F FY13F FY14FSales (USD’000) Asia 405,143 578,316 690,888 837,033 998,354 Europe 406,696 479,089 476,968 499,747 532,931 North America 302,968 388,190 476,712 589,729 719,629 Latin America 88,960 108,601 108,342 116,887 126,336 Corporates 11,540 10,951 8,785 7,478 6,730 Total 1,215,308 1,565,148 1,761,694 2,050,874 2,383,978 Growth rate (%, YoY) Asia 45.09 42.74 19.47 21.15 19.27Europe 5.65 17.80 (0.44) 4.78 6.64North America 7.71 28.13 22.80 23.71 22.03Latin America 22.08 22.08 (0.24) 7.89 8.08Corporates 4.35 (5.10) (19.78) (14.88) (10.00) Total 18.06 28.79 12.56 16.41 16.24% breakdown Asia 33.34 36.95 39.22 40.81 41.88Europe 33.46 30.61 27.07 24.37 22.35North America 24.93 24.80 27.06 28.75 30.19Latin America 7.32 6.94 6.15 5.70 5.30Corporates 0.95 0.70 0.50 0.36 0.28Source: Company data, Maybank Kim Eng estimates
Figure 14: Our sales estimates assumptions-by brand and category
FY10A FY11A FY12F FY13F FY14FSales by brand(USD’000) Samsonite 917,792 1,223,320 1,330,125 1,500,447 1,690,815 American Tourister 161,117 249,873 337,329 448,647 583,241 Others 82,464 87,260 94,241 101,780 109,922 % sales breakdown Samsonite 75.52 78.16 75.50 73.16 70.92American Tourister 13.26 15.96 19.15 21.88 24.47Others 11.22 5.58 5.35 4.96 4.61Sales by category(USD’000) Travel 885,944 1,186,683 1,346,120 1,574,960 1,811,205 Business 110,321 189,582 189,970 237,463 284,955 Casual 112,213 81,849 100,423 120,508 143,405 Accessories 50,186 70,786 92,185 101,404 121,684 Others 56,643 36,247 32,996 16,540 22,730 % sales breakdown Travel 72.90 75.82 76.41 76.79 75.97Business 9.08 12.11 10.78 11.58 11.95Casual 9.23 5.23 5.70 5.88 6.02Accessories 4.13 4.52 5.23 4.94 5.10Others 4.66 2.32 1.87 0.81 0.95Source: Company data, Maybank Kim Eng estimates
Outlook for key markets. We expect sales in China to grow 25%/18%/15% YoY in FY12F/13F/14F. Sales growth in India should return to positive territory from 1Q13 following a one-off ASP increment of around 7% at end-Jun 2012, in addition to pricing discounts by its key competitor VIP Corp, both of which affected its 3Q12 sales adversely. We expect sales growth in Japan to normalise at around 20% from 3Q12 onwards as compared with 40% growth recorded in 1H12 due to a low base resulting from the earthquake in 2011. Meanwhile, we believe sales growth in South Korea will remain strong, thanks to the well-received localized product launches.
18 February 2013 Page 8 of 37
Samsonite International S.A.
Figure 15: Our sales estimates assumptions FY10 FY11 FY12F FY13F FY14F
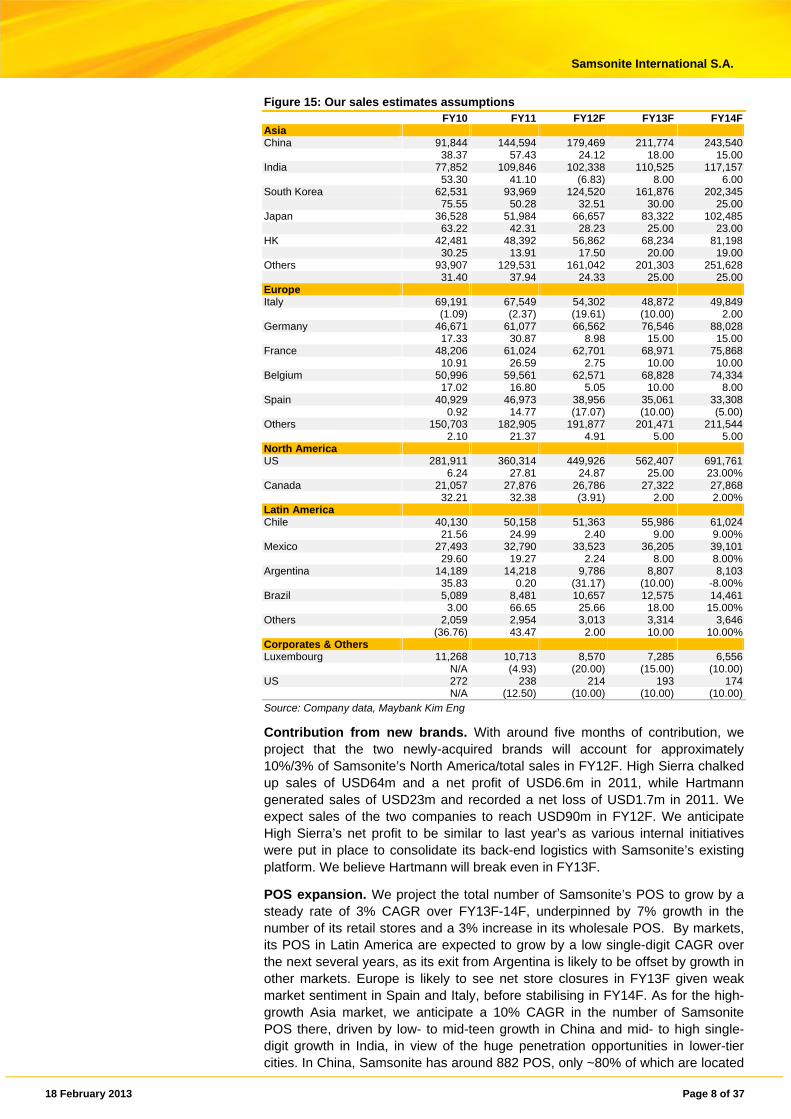
Asia China 91,844 144,594 179,469 211,774 243,540 38.37 57.43 24.12 18.00 15.00India 77,852 109,846 102,338 110,525 117,157 53.30 41.10 (6.83) 8.00 6.00South Korea 62,531 93,969 124,520 161,876 202,345 75.55 50.28 32.51 30.00 25.00Japan 36,528 51,984 66,657 83,322 102,485 63.22 42.31 28.23 25.00 23.00HK 42,481 48,392 56,862 68,234 81,198 30.25 13.91 17.50 20.00 19.00Others 93,907 129,531 161,042 201,303 251,628 31.40 37.94 24.33 25.00 25.00Europe Italy 69,191 67,549 54,302 48,872 49,849 (1.09) (2.37) (19.61) (10.00) 2.00Germany 46,671 61,077 66,562 76,546 88,028 17.33 30.87 8.98 15.00 15.00France 48,206 61,024 62,701 68,971 75,868 10.91 26.59 2.75 10.00 10.00Belgium 50,996 59,561 62,571 68,828 74,334 17.02 16.80 5.05 10.00 8.00Spain 40,929 46,973 38,956 35,061 33,308 0.92 14.77 (17.07) (10.00) (5.00)Others 150,703 182,905 191,877 201,471 211,544 2.10 21.37 4.91 5.00 5.00North America US 281,911 360,314 449,926 562,407 691,761 6.24 27.81 24.87 25.00 23.00%Canada 21,057 27,876 26,786 27,322 27,868 32.21 32.38 (3.91) 2.00 2.00%Latin America Chile 40,130 50,158 51,363 55,986 61,024 21.56 24.99 2.40 9.00 9.00%Mexico 27,493 32,790 33,523 36,205 39,101 29.60 19.27 2.24 8.00 8.00%Argentina 14,189 14,218 9,786 8,807 8,103 35.83 0.20 (31.17) (10.00) -8.00%Brazil 5,089 8,481 10,657 12,575 14,461 3.00 66.65 25.66 18.00 15.00%Others 2,059 2,954 3,013 3,314 3,646 (36.76) 43.47 2.00 10.00 10.00%Corporates & Others Luxembourg 11,268 10,713 8,570 7,285 6,556 N/A (4.93) (20.00) (15.00) (10.00)US 272 238 214 193 174 N/A (12.50) (10.00) (10.00) (10.00)Source: Company data, Maybank Kim Eng
Contribution from new brands. With around five months of contribution, we project that the two newly-acquired brands will account for approximately 10%/3% of Samsonite’s North America/total sales in FY12F. High Sierra chalked up sales of USD64m and a net profit of USD6.6m in 2011, while Hartmann generated sales of USD23m and recorded a net loss of USD1.7m in 2011. We expect sales of the two companies to reach USD90m in FY12F. We anticipate High Sierra’s net profit to be similar to last year’s as various internal initiatives were put in place to consolidate its back-end logistics with Samsonite’s existing platform. We believe Hartmann will break even in FY13F.
POS expansion. We project the total number of Samsonite’s POS to grow by a steady rate of 3% CAGR over FY13F-14F, underpinned by 7% growth in the number of its retail stores and a 3% increase in its wholesale POS. By markets, its POS in Latin America are expected to grow by a low single-digit CAGR over the next several years, as its exit from Argentina is likely to be offset by growth in other markets. Europe is likely to see net store closures in FY13F given weak market sentiment in Spain and Italy, before stabilising in FY14F. As for the high-growth Asia market, we anticipate a 10% CAGR in the number of Samsonite POS there, driven by low- to mid-teen growth in China and mid- to high single-digit growth in India, in view of the huge penetration opportunities in lower-tier cities. In China, Samsonite has around 882 POS, only ~80% of which are located
18 February 2013 Page 9 of 37
Samsonite International S.A.
in tier-1 and tier-2 cities. We view its under-representation in the higher-growth, lower-tier markets as a great potential growth opportunity.
Figure 16: Number of POS estimates assumptions FY10A FY11A FY12F FY13F FY14F
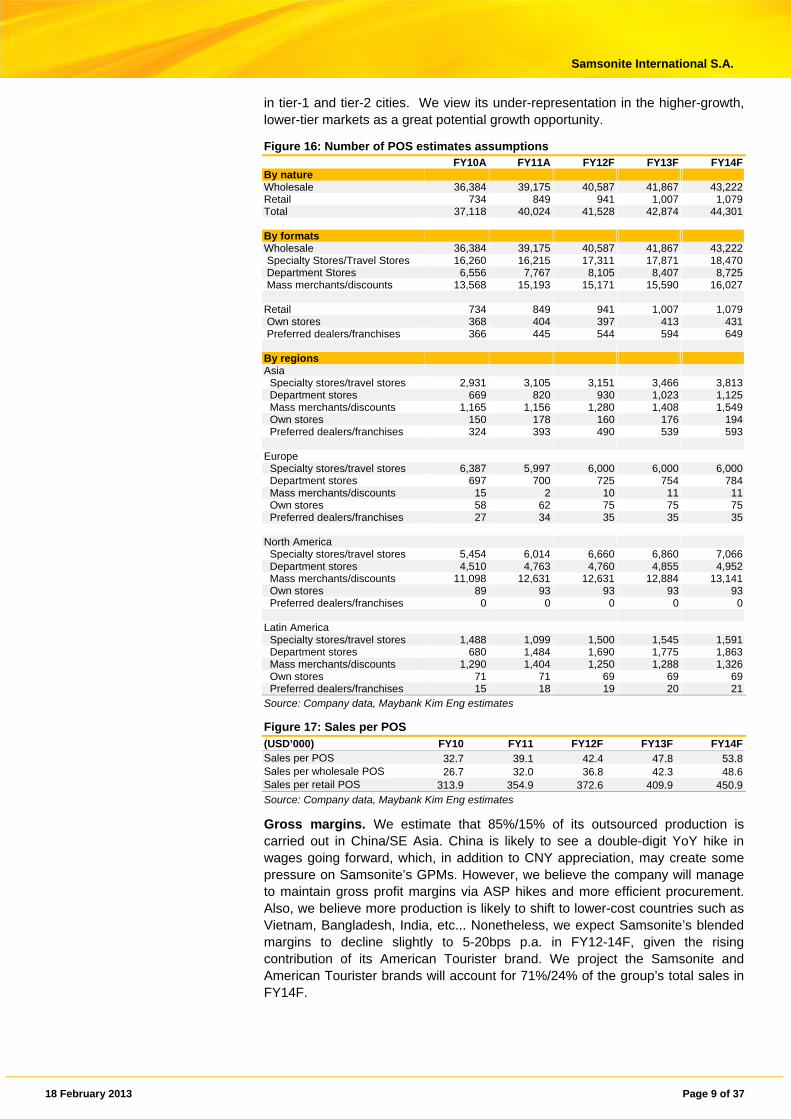
By nature Wholesale 36,384 39,175 40,587 41,867 43,222Retail 734 849 941 1,007 1,079Total 37,118 40,024 41,528 42,874 44,301 By formats Wholesale 36,384 39,175 40,587 41,867 43,222 Specialty Stores/Travel Stores 16,260 16,215 17,311 17,871 18,470 Department Stores 6,556 7,767 8,105 8,407 8,725 Mass merchants/discounts 13,568 15,193 15,171 15,590 16,027 Retail 734 849 941 1,007 1,079 Own stores 368 404 397 413 431 Preferred dealers/franchises 366 445 544 594 649 By regions Asia Specialty stores/travel stores 2,931 3,105 3,151 3,466 3,813 Department stores 669 820 930 1,023 1,125 Mass merchants/discounts 1,165 1,156 1,280 1,408 1,549 Own stores 150 178 160 176 194 Preferred dealers/franchises 324 393 490 539 593 Europe Specialty stores/travel stores 6,387 5,997 6,000 6,000 6,000 Department stores 697 700 725 754 784 Mass merchants/discounts 15 2 10 11 11 Own stores 58 62 75 75 75 Preferred dealers/franchises 27 34 35 35 35 North America Specialty stores/travel stores 5,454 6,014 6,660 6,860 7,066 Department stores 4,510 4,763 4,760 4,855 4,952 Mass merchants/discounts 11,098 12,631 12,631 12,884 13,141 Own stores 89 93 93 93 93 Preferred dealers/franchises 0 0 0 0 0 Latin America Specialty stores/travel stores 1,488 1,099 1,500 1,545 1,591 Department stores 680 1,484 1,690 1,775 1,863 Mass merchants/discounts 1,290 1,404 1,250 1,288 1,326 Own stores 71 71 69 69 69 Preferred dealers/franchises 15 18 19 20 21Source: Company data, Maybank Kim Eng estimates
Figure 17: Sales per POS (USD’000) FY10 FY11 FY12F FY13F FY14FSales per POS 32.7 39.1 42.4 47.8 53.8Sales per wholesale POS 26.7 32.0 36.8 42.3 48.6Sales per retail POS 313.9 354.9 372.6 409.9 450.9Source: Company data, Maybank Kim Eng estimates
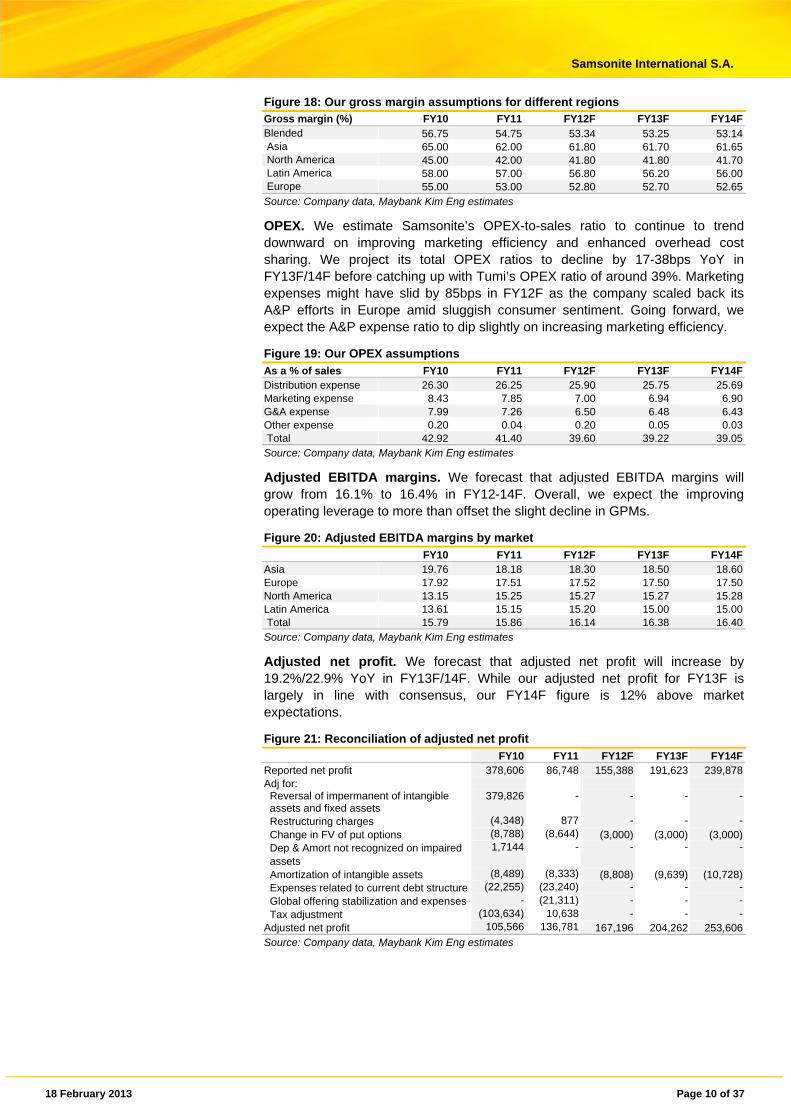
Gross margins. We estimate that 85%/15% of its outsourced production is carried out in China/SE Asia. China is likely to see a double-digit YoY hike in wages going forward, which, in addition to CNY appreciation, may create some pressure on Samsonite’s GPMs. However, we believe the company will manage to maintain gross profit margins via ASP hikes and more efficient procurement. Also, we believe more production is likely to shift to lower-cost countries such as Vietnam, Bangladesh, India, etc... Nonetheless, we expect Samsonite’s blended margins to decline slightly to 5-20bps p.a. in FY12-14F, given the rising contribution of its American Tourister brand. We project the Samsonite and American Tourister brands will account for 71%/24% of the group’s total sales in FY14F.
18 February 2013 Page 10 of 37
Samsonite International S.A.
Figure 18: Our gross margin assumptions for different regions Gross margin (%) FY10 FY11 FY12F FY13F FY14FBlended 56.75 54.75 53.34 53.25 53.14 Asia 65.00 62.00 61.80 61.70 61.65 North America 45.00 42.00 41.80 41.80 41.70 Latin America 58.00 57.00 56.80 56.20 56.00 Europe 55.00 53.00 52.80 52.70 52.65Source: Company data, Maybank Kim Eng estimates
OPEX. We estimate Samsonite’s OPEX-to-sales ratio to continue to trend downward on improving marketing efficiency and enhanced overhead cost sharing. We project its total OPEX ratios to decline by 17-38bps YoY in FY13F/14F before catching up with Tumi’s OPEX ratio of around 39%. Marketing expenses might have slid by 85bps in FY12F as the company scaled back its A&P efforts in Europe amid sluggish consumer sentiment. Going forward, we expect the A&P expense ratio to dip slightly on increasing marketing efficiency.
Figure 19: Our OPEX assumptions
As a % of sales FY10 FY11 FY12F FY13F FY14FDistribution expense 26.30 26.25 25.90 25.75 25.69Marketing expense 8.43 7.85 7.00 6.94 6.90G&A expense 7.99 7.26 6.50 6.48 6.43Other expense 0.20 0.04 0.20 0.05 0.03 Total 42.92 41.40 39.60 39.22 39.05Source: Company data, Maybank Kim Eng estimates
Adjusted EBITDA margins. We forecast that adjusted EBITDA margins will grow from 16.1% to 16.4% in FY12-14F. Overall, we expect the improving operating leverage to more than offset the slight decline in GPMs.
Figure 20: Adjusted EBITDA margins by market
FY10 FY11 FY12F FY13F FY14FAsia 19.76 18.18 18.30 18.50 18.60Europe 17.92 17.51 17.52 17.50 17.50North America 13.15 15.25 15.27 15.27 15.28Latin America 13.61 15.15 15.20 15.00 15.00 Total 15.79 15.86 16.14 16.38 16.40Source: Company data, Maybank Kim Eng estimates
Adjusted net profit. We forecast that adjusted net profit will increase by 19.2%/22.9% YoY in FY13F/14F. While our adjusted net profit for FY13F is largely in line with consensus, our FY14F figure is 12% above market expectations.
Figure 21: Reconciliation of adjusted net profit
FY10 FY11 FY12F FY13F FY14FReported net profit 378,606 86,748 155,388 191,623 239,878 Adj for: Reversal of impermanent of intangible assets and fixed assets
379,826 - - - -
Restructuring charges (4,348) 877 - - - Change in FV of put options (8,788) (8,644) (3,000) (3,000) (3,000) Dep & Amort not recognized on impaired assets
1,7144 - - - -
Amortization of intangible assets (8,489) (8,333) (8,808) (9,639) (10,728) Expenses related to current debt structure (22,255) (23,240) - - - Global offering stabilization and expenses - (21,311) - - - Tax adjustment (103,634) 10,638 - - -Adjusted net profit 105,566 136,781 167,196 204,262 253,606 Source: Company data, Maybank Kim Eng estimates
18 February 2013 Page 11 of 37
Samsonite International S.A.
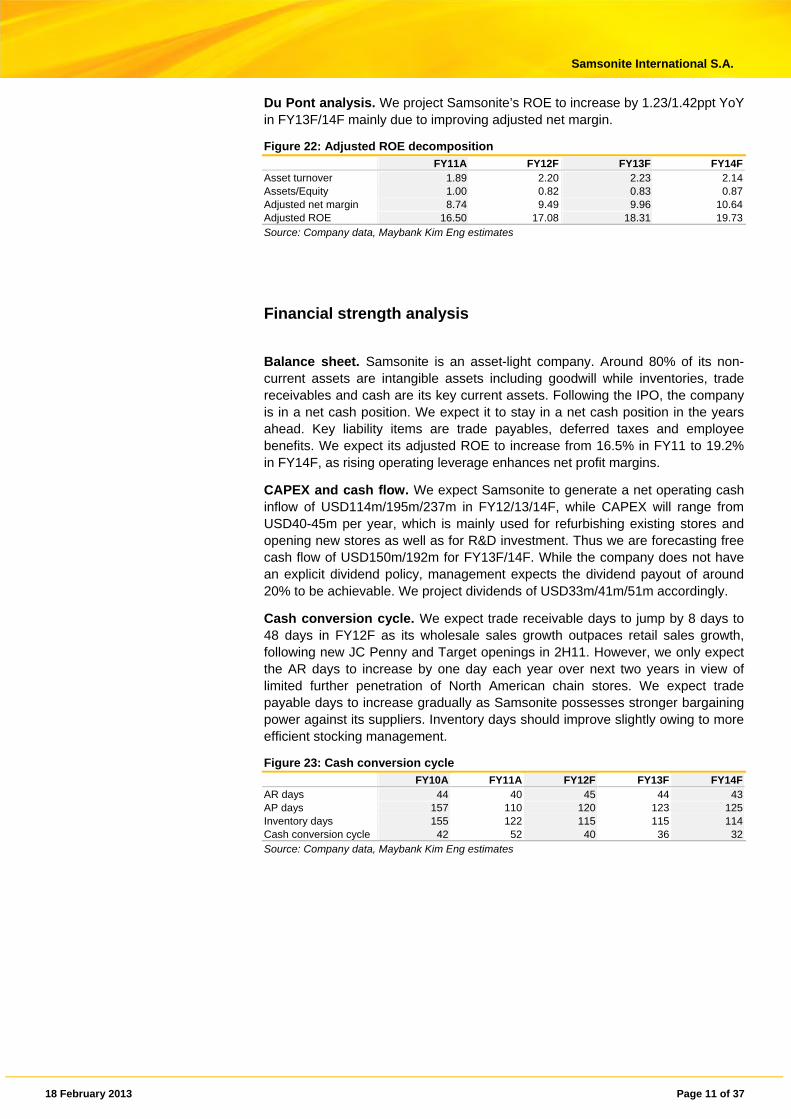
Du Pont analysis. We project Samsonite’s ROE to increase by 1.23/1.42ppt YoY in FY13F/14F mainly due to improving adjusted net margin.
Figure 22: Adjusted ROE decomposition
FY11A FY12F FY13F FY14FAsset turnover 1.89 2.20 2.23 2.14Assets/Equity 1.00 0.82 0.83 0.87Adjusted net margin 8.74 9.49 9.96 10.64Adjusted ROE 16.50 17.08 18.31 19.73Source: Company data, Maybank Kim Eng estimates
Financial strength analysis
Balance sheet. Samsonite is an asset-light company. Around 80% of its non-current assets are intangible assets including goodwill while inventories, trade receivables and cash are its key current assets. Following the IPO, the company is in a net cash position. We expect it to stay in a net cash position in the years ahead. Key liability items are trade payables, deferred taxes and employee benefits. We expect its adjusted ROE to increase from 16.5% in FY11 to 19.2% in FY14F, as rising operating leverage enhances net profit margins.
CAPEX and cash flow. We expect Samsonite to generate a net operating cash inflow of USD114m/195m/237m in FY12/13/14F, while CAPEX will range from USD40-45m per year, which is mainly used for refurbishing existing stores and opening new stores as well as for R&D investment. Thus we are forecasting free cash flow of USD150m/192m for FY13F/14F. While the company does not have an explicit dividend policy, management expects the dividend payout of around 20% to be achievable. We project dividends of USD33m/41m/51m accordingly.
Cash conversion cycle. We expect trade receivable days to jump by 8 days to 48 days in FY12F as its wholesale sales growth outpaces retail sales growth, following new JC Penny and Target openings in 2H11. However, we only expect the AR days to increase by one day each year over next two years in view of limited further penetration of North American chain stores. We expect trade payable days to increase gradually as Samsonite possesses stronger bargaining power against its suppliers. Inventory days should improve slightly owing to more efficient stocking management.
Figure 23: Cash conversion cycle
FY10A FY11A FY12F FY13F FY14FAR days 44 40 45 44 43AP days 157 110 120 123 125Inventory days 155 122 115 115 114Cash conversion cycle 42 52 40 36 32Source: Company data, Maybank Kim Eng estimates
18 February 2013 Page 12 of 37
Samsonite International S.A.
Sensitivity analysis
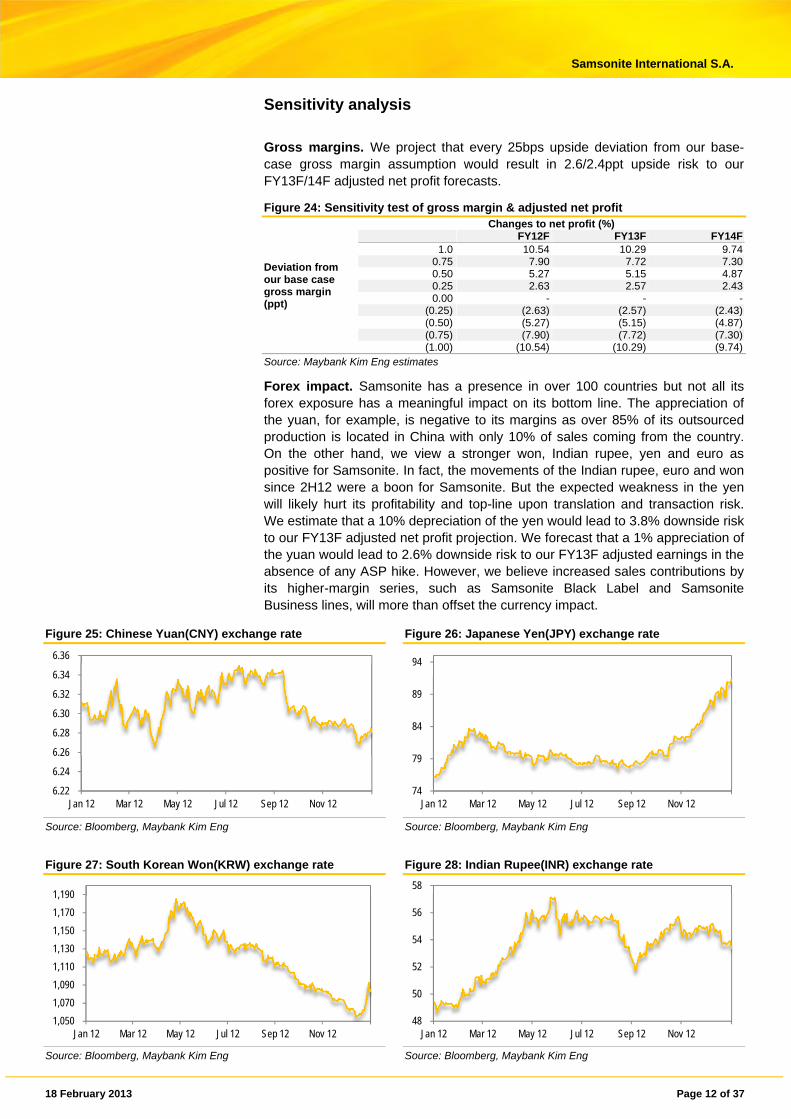
Gross margins. We project that every 25bps upside deviation from our base-case gross margin assumption would result in 2.6/2.4ppt upside risk to our FY13F/14F adjusted net profit forecasts.
Figure 24: Sensitivity test of gross margin & adjusted net profit
Deviation from our base case gross margin (ppt)
Changes to net profit (%) FY12F FY13F FY14F
1.0 10.54 10.29 9.740.75 7.90 7.72 7.300.50 5.27 5.15 4.870.25 2.63 2.57 2.430.00 - - -
(0.25) (2.63) (2.57) (2.43)(0.50) (5.27) (5.15) (4.87)(0.75) (7.90) (7.72) (7.30)(1.00) (10.54) (10.29) (9.74)
Source: Maybank Kim Eng estimates
Forex impact. Samsonite has a presence in over 100 countries but not all its forex exposure has a meaningful impact on its bottom line. The appreciation of the yuan, for example, is negative to its margins as over 85% of its outsourced production is located in China with only 10% of sales coming from the country. On the other hand, we view a stronger won, Indian rupee, yen and euro as positive for Samsonite. In fact, the movements of the Indian rupee, euro and won since 2H12 were a boon for Samsonite. But the expected weakness in the yen will likely hurt its profitability and top-line upon translation and transaction risk. We estimate that a 10% depreciation of the yen would lead to 3.8% downside risk to our FY13F adjusted net profit projection. We forecast that a 1% appreciation of the yuan would lead to 2.6% downside risk to our FY13F adjusted earnings in the absence of any ASP hike. However, we believe increased sales contributions by its higher-margin series, such as Samsonite Black Label and Samsonite Business lines, will more than offset the currency impact.
Figure 25: Chinese Yuan(CNY) exchange rate Figure 26: Japanese Yen(JPY) exchange rate
Source: Bloomberg, Maybank Kim Eng Source: Bloomberg, Maybank Kim Eng
Figure 27: South Korean Won(KRW) exchange rate Figure 28: Indian Rupee(INR) exchange rate
Source: Bloomberg, Maybank Kim Eng Source: Bloomberg, Maybank Kim Eng
6.22
6.24
6.26
6.28
6.30
6.32
6.34
6.36
Jan 12 Mar 12 May 12 Jul 12 Sep 12 Nov 1274
79
84
89
94
Jan 12 Mar 12 May 12 Jul 12 Sep 12 Nov 12
1,050
1,070
1,090
1,110
1,130
1,150
1,170
1,190
Jan 12 Mar 12 May 12 Jul 12 Sep 12 Nov 1248
50
52
54
56
58
Jan 12 Mar 12 May 12 Jul 12 Sep 12 Nov 12

18 February 2013 Page 13 of 37
Samsonite International S.A.
Figure 29: Euro(EUR) exchange rate Figure 30: German Marks(DEM) exchange rate
Source: Bloomberg, Maybank Kim Eng Source: Bloomberg, Maybank Kim Eng
Investment thesis
Three-tier growth. We believe the long-term secular growth of travel and tourism spending globally, particularly in developing markets, serves as key underlying growth driver for Samsonite. According to industry body World Travel & Tourism (WTTC), the global travel industry is expected to grow at a rate of 2.7% in 2012 and thereafter at a 10-year CAGR of 4% until 2022. Meanwhile, more stringent and light-weight luggage requirements set by airlines will drive market shares gains of well-established players, who are more responsive and flexible to changes in regulatory standards, in our view. On top of this, we believe governments’ initiatives to lift travel restrictions and allow more direct flights between different places could increase incentives to travel. Last but not least, improved railway infrastructure is also likely to spur domestic travel in many developing countries in the foreseeable future.
Figure 31: YTD performance of airline traffic, international tourist arrivals and hotels (annual % growth)
International air
passenger traffic (RPK)International
tourist arrivals Regional hotel performance
Latest month
(Sep-12) 2011
2012 (YTD-Sep) 2011
2012 (YTD-Aug)
Occupancy rate (2012 YTD-Oct)
ADR (2012
YTD- Oct)
RevPAR (2012
YTD-Oct)Europe 5.4 9.5 6.1 6.2 3.4 (0.2) (4.7) (4.9)America - - - 3.9 3.6 2.4 3.8 6.3 North America 2.1 4.0 1.3 2.6 2.5 2.5 3.9 6.5 Latin America 7.5 10.2 8.8 9.3 5.8 - - -Asia-Pacific 1.7 4.0 5.1 6.1 7.3 1.0 0.5 1.5Middle East 13.3 8.9 16.6 (7.1) (1.4) 4.3 4.7 9.1Africa 4.7 2.1 8.3 0.4 6.1 - - - North Africa - - - (9.1) 10.2 18.1 (6.7) 10.2 Sub-Saharan Africa - - - 6.1 3.8 4.7 (6.4) (2.0)World 4.9 6.9 6.4 4.6 4.1 - - -Source: IATA, PATA, Haver Analytics, Eurostat, UNWTO, STR, STR Global, Oxford Economics, Maybank Kim Eng
Growth in mature and emerging markets. Despite the relative maturity of the different developed markets, Samsonite has been able to deliver much faster than industry growth in countries such as Japan and Europe in the last two years, which, in our view, is attributable to its successful strategy revamp in various markets. We believe Samsonite’s localised product development and marketing enabled it to regain market share it had lost in the past. We expect its sales in both the US (including acquisitions) and Japan to grow in the mid- to high teens YoY in the next several years. On a separate note, we believe the favourable demographics and currently low per capita spending on travel in developing markets bode well for faster growth in travel spend in future. Also, we believe the
1.10
1.15
1.20
1.25
1.30
1.35
1.40
Jan 12 Mar 12 May 12 Jul 12 Sep 12 Nov 121.40
1.45
1.50
1.55
1.60
1.65
Jan 12 Mar 12 May 12 Jul 12 Sep 12 Nov 12

18 February 2013 Page 14 of 37
Samsonite International S.A.
rising middle class in emerging markets will spur upgrades, as consumers migrate from local to international brands.
Tapping into new product categories. Samsonite is well-known for the high quality of its luggage products. However, it is currently under-represented in the business and casual bags categories, which in aggregate account for 60% of global luggage sales; business and casual bags make up only 10%/6% of Samsonite’s sales in 1H12, respectively. Looking ahead, we project its non-travel luggage sales to grow by a 21.5% CAGR over FY12-14F and its sales contribution to increase to 18% in FY14F from the current 16%. What’s more, we believe a more complete product portfolio would further cement its market share across different markets, as the company would be able to leverage on its existing market presence and extensive sales network.
Figure 32: Breakdown of global luggage retail sales by segment, 2010
Source: Frost& Sullivan, Maybank Kim Eng
Figure 33: Expansion of product portfolio across all regions
Source: Company data, Maybank Kim Eng
Improving geographical sales mix. Higher-growth regions such as Asia command an adjusted EBITDA margin of 18%, as compared to developed countries’ 16% on average. As we expect a rising contribution of sales from emerging markets, we project that Samsonite’s blended EBITDA margin will trend up to 16.10%/16.38%/16.40% in FY12F/13F/14F, although growing sales of its American Tourister brand should dilute gross profit margins in different markets as its GPM is around 10ppts below Samsonite’s. It is worth noting that American Tourister’s EBITDA margin is actually comparable to Samsonite’s as its OPEX cost are lower because it is mainly sold via wholesale channels. We also expect profitability improvements to come mainly from enhanced operating leverage.
Business bag segment
19%
Casual bag segment
41%
Travel bag segment
40%
18 February 2013 Page 15 of 37
Samsonite International S.A.
Key catalysts
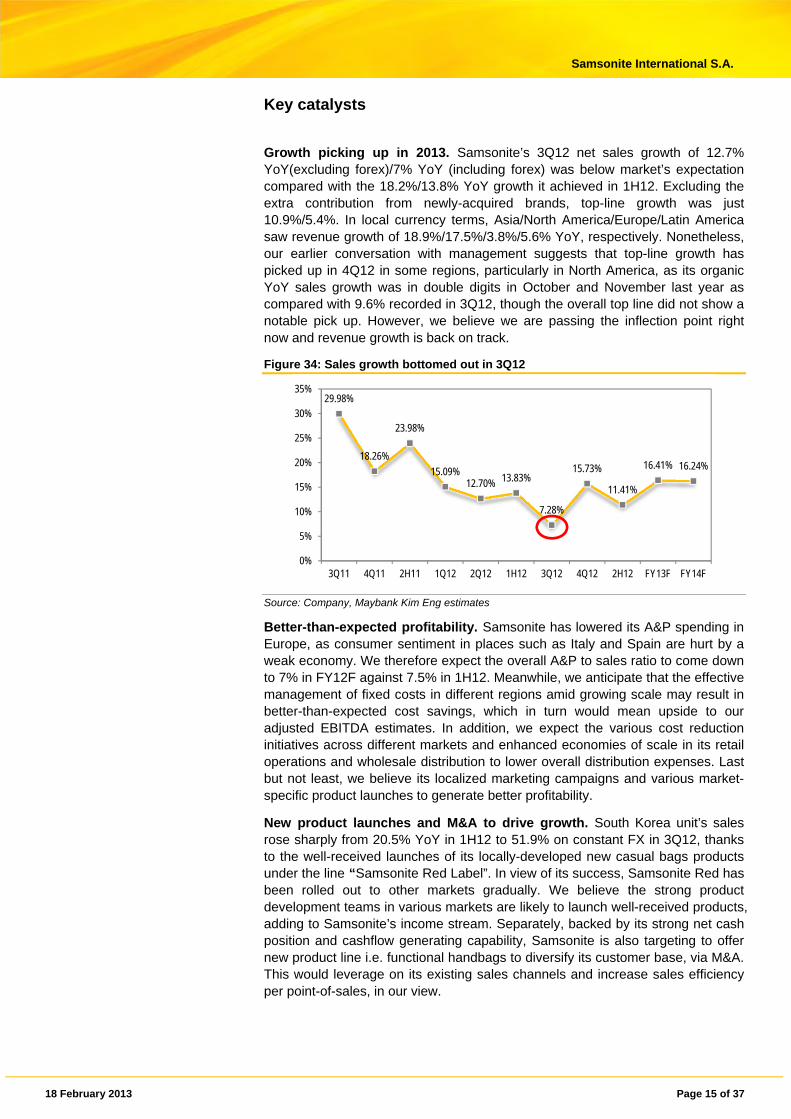
Growth picking up in 2013. Samsonite’s 3Q12 net sales growth of 12.7% YoY(excluding forex)/7% YoY (including forex) was below market’s expectation compared with the 18.2%/13.8% YoY growth it achieved in 1H12. Excluding the extra contribution from newly-acquired brands, top-line growth was just 10.9%/5.4%. In local currency terms, Asia/North America/Europe/Latin America saw revenue growth of 18.9%/17.5%/3.8%/5.6% YoY, respectively. Nonetheless, our earlier conversation with management suggests that top-line growth has picked up in 4Q12 in some regions, particularly in North America, as its organic YoY sales growth was in double digits in October and November last year as compared with 9.6% recorded in 3Q12, though the overall top line did not show a notable pick up. However, we believe we are passing the inflection point right now and revenue growth is back on track.
Figure 34: Sales growth bottomed out in 3Q12
Source: Company, Maybank Kim Eng estimates
Better-than-expected profitability. Samsonite has lowered its A&P spending in Europe, as consumer sentiment in places such as Italy and Spain are hurt by a weak economy. We therefore expect the overall A&P to sales ratio to come down to 7% in FY12F against 7.5% in 1H12. Meanwhile, we anticipate that the effective management of fixed costs in different regions amid growing scale may result in better-than-expected cost savings, which in turn would mean upside to our adjusted EBITDA estimates. In addition, we expect the various cost reduction initiatives across different markets and enhanced economies of scale in its retail operations and wholesale distribution to lower overall distribution expenses. Last but not least, we believe its localized marketing campaigns and various market-specific product launches to generate better profitability.
New product launches and M&A to drive growth. South Korea unit’s sales rose sharply from 20.5% YoY in 1H12 to 51.9% on constant FX in 3Q12, thanks to the well-received launches of its locally-developed new casual bags products under the line “Samsonite Red Label”. In view of its success, Samsonite Red has been rolled out to other markets gradually. We believe the strong product development teams in various markets are likely to launch well-received products, adding to Samsonite’s income stream. Separately, backed by its strong net cash position and cashflow generating capability, Samsonite is also targeting to offer new product line i.e. functional handbags to diversify its customer base, via M&A. This would leverage on its existing sales channels and increase sales efficiency per point-of-sales, in our view.
29.98%
18.26%
23.98%
15.09%12.70% 13.83%
7.28%
15.73%
11.41%
16.41% 16.24%
0%
5%
10%
15%
20%
25%
30%
35%
3Q11 4Q11 2H11 1Q12 2Q12 1H12 3Q12 4Q12 2H12 FY13F FY14F

18 February 2013 Page 16 of 37
Samsonite International S.A.
Figure 35: Samsonite Red Label products
Source: Company, Maybank Kim Eng
18 February 2013 Page 17 of 37
Samsonite International S.A.
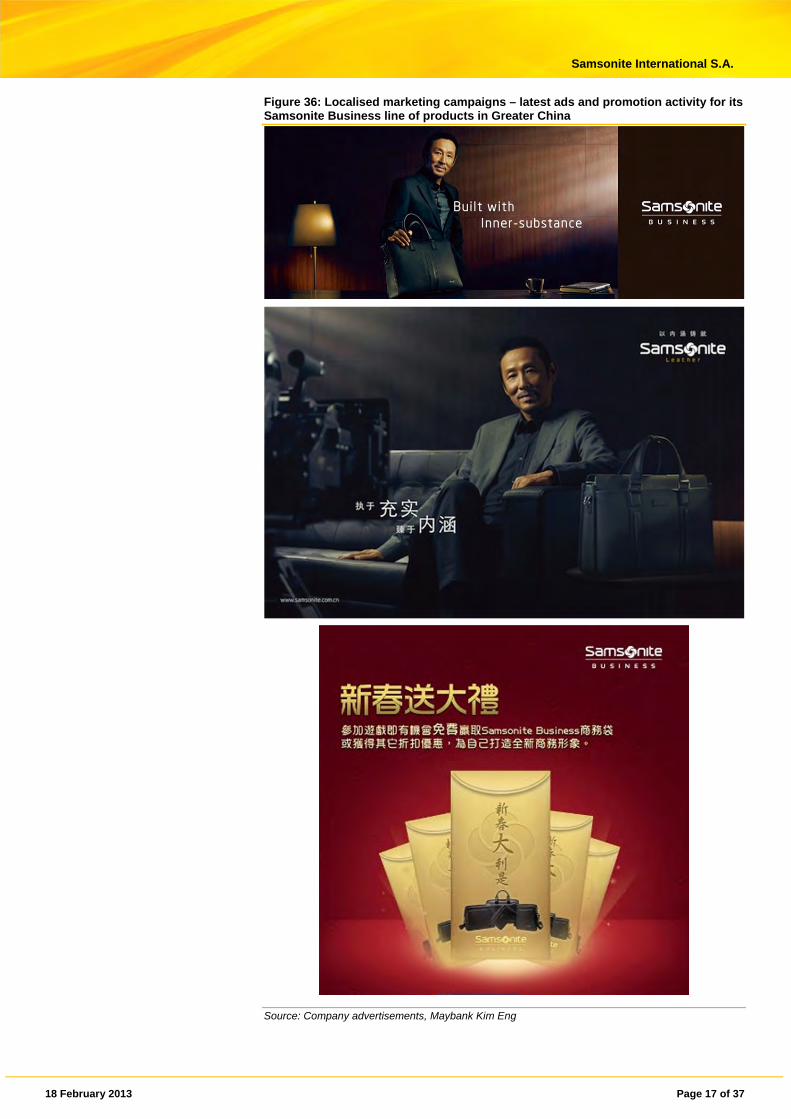
Figure 36: Localised marketing campaigns – latest ads and promotion activity for its Samsonite Business line of products in Greater China
Source: Company advertisements, Maybank Kim Eng

18 February 2013 Page 18 of 37
Samsonite International S.A.
Figure 37: Sammies by Samsonite
Source: Company, Maybank Kim Eng
Key risk factors
Forex risk. Samsonite has a sales presence in over 100 countries and hence is subject to foreign exchange rate risks, given that its reporting currency is USD. Also, it manufactures most of its products in China and South East Asia. So, any fluctuation in the respective local currencies will affect its profitability. For example, the big devaluation of Indian Rupee has caused significant pressure on its Asian GPM and EBITDA margins in 1H12.
Supply chain disruptions. 90% of Samsonite’s production is outsourced to third-party suppliers, so any delays in deliveries may cause disruptions to its sales. Also, it receives supply of some key raw materials on an exclusive basis; so any interruptions in the supply of these materials could halt production.
Regulatory risk. Samsonite’s sales are subject to various governments’ import policies. For example, its sales in Argentina fell 27% YoY in 9M12 as the local government imposed restrictions on imports. Any trade protection or trade disputes are likely to affect its sales performance.
Unexpected decline in global travel. Any unexpected deterioration in economic conditions and abnormal events such as terror attacks and natural disasters are likely to affect the global travel industry. As luggage sales account for 77% of Samsonite’s total sales, any slowdown in global travel is likely to affect its sales.
Further deterioration in the European economy. With Europe making up approximately one third of its overall sales, any contraction in its European sales may not be able to be offset by growth in sales from other countries.
CVC stake disposal. CVC currently owns 138.3m shares (or 9.83%) of Samsonite following its placement of 90m shares to investors at an average price of HKD16.2/share on 14 Jan 2013. We believe the potential further offloading of Samsonite’s shares by CVC will be a share price overhang.
18 February 2013 Page 19 of 37
Samsonite International S.A.
Industry overview
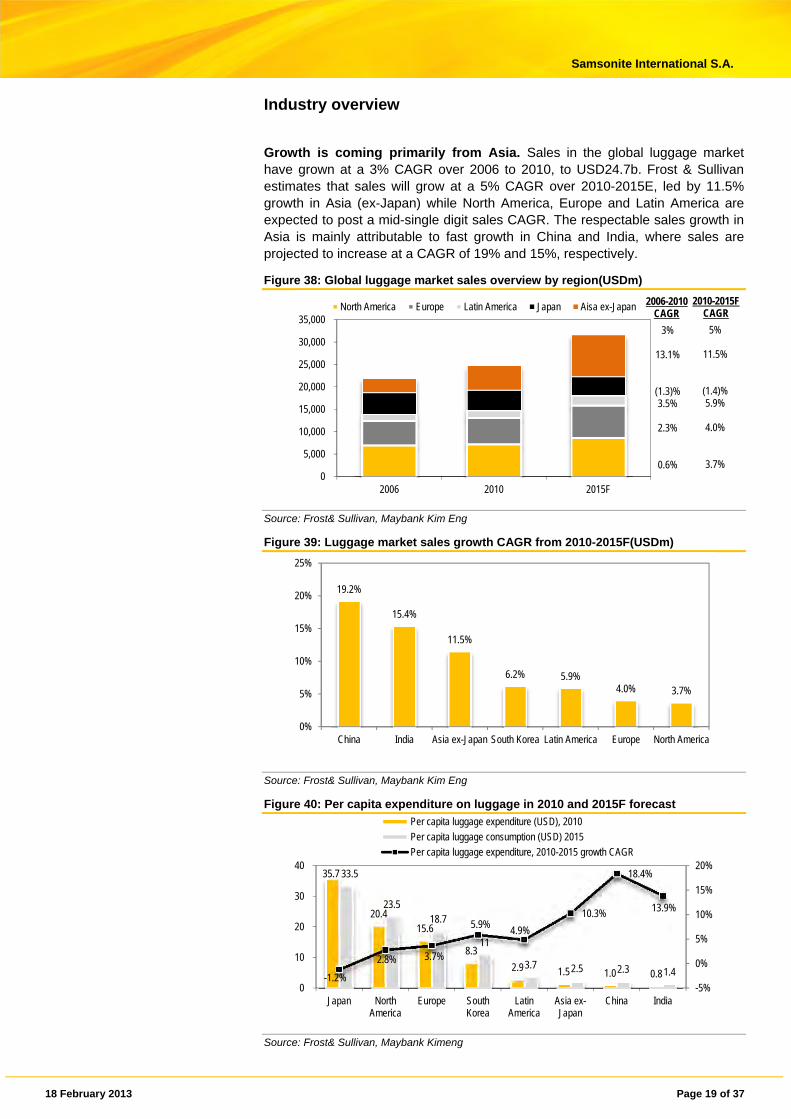
Growth is coming primarily from Asia. Sales in the global luggage market have grown at a 3% CAGR over 2006 to 2010, to USD24.7b. Frost & Sullivan estimates that sales will grow at a 5% CAGR over 2010-2015E, led by 11.5% growth in Asia (ex-Japan) while North America, Europe and Latin America are expected to post a mid-single digit sales CAGR. The respectable sales growth in Asia is mainly attributable to fast growth in China and India, where sales are projected to increase at a CAGR of 19% and 15%, respectively.
Figure 38: Global luggage market sales overview by region(USDm)
Source: Frost& Sullivan, Maybank Kim Eng
Figure 39: Luggage market sales growth CAGR from 2010-2015F(USDm)
Source: Frost& Sullivan, Maybank Kim Eng
Figure 40: Per capita expenditure on luggage in 2010 and 2015F forecast
Source: Frost& Sullivan, Maybank Kimeng
0
5,000
10,000
15,000
20,000
25,000
30,000
35,000
2006 2010 2015F
North America Europe Latin America Japan Aisa ex-Japan
19.2%
15.4%
11.5%
6.2% 5.9%4.0% 3.7%
0%
5%
10%
15%
20%
25%
China India Asia ex-Japan South Korea Latin America Europe North America
35.7
20.4 15.6
8.3
2.9 1.5 1.0 0.8
33.5
23.518.7
11
3.7 2.5 2.3 1.4-1.2%
2.8% 3.7%
5.9%4.9%
10.3%
18.4%
13.9%
-5%
0%
5%
10%
15%
20%
0
10
20
30
40
Japan NorthAmerica
Europe SouthKorea
LatinAmerica
Asia ex-Japan
China India
Per capita luggage expenditure (USD), 2010
Per capita luggage consumption (USD) 2015
Per capita luggage expenditure, 2010-2015 growth CAGR
2006-2010 CAGR
3%
13.1%
(1.3)%3.5%
2.3%
0.6%
2010-2015F CAGR
5%
11.5%
(1.4)%5.9%
4.0%
3.7%
18 February 2013 Page 20 of 37
Samsonite International S.A.
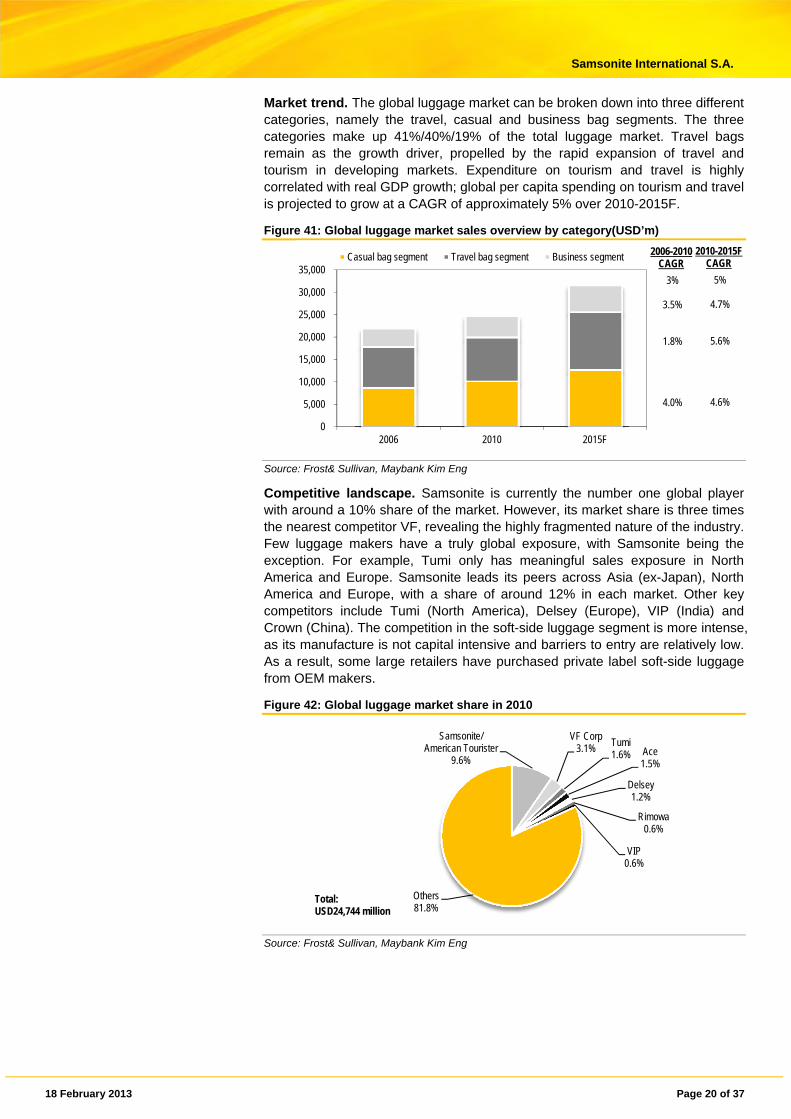
Market trend. The global luggage market can be broken down into three different categories, namely the travel, casual and business bag segments. The three categories make up 41%/40%/19% of the total luggage market. Travel bags remain as the growth driver, propelled by the rapid expansion of travel and tourism in developing markets. Expenditure on tourism and travel is highly correlated with real GDP growth; global per capita spending on tourism and travel is projected to grow at a CAGR of approximately 5% over 2010-2015F.
Figure 41: Global luggage market sales overview by category(USD’m)
Source: Frost& Sullivan, Maybank Kim Eng
Competitive landscape. Samsonite is currently the number one global player with around a 10% share of the market. However, its market share is three times the nearest competitor VF, revealing the highly fragmented nature of the industry. Few luggage makers have a truly global exposure, with Samsonite being the exception. For example, Tumi only has meaningful sales exposure in North America and Europe. Samsonite leads its peers across Asia (ex-Japan), North America and Europe, with a share of around 12% in each market. Other key competitors include Tumi (North America), Delsey (Europe), VIP (India) and Crown (China). The competition in the soft-side luggage segment is more intense, as its manufacture is not capital intensive and barriers to entry are relatively low. As a result, some large retailers have purchased private label soft-side luggage from OEM makers.
Figure 42: Global luggage market share in 2010
Source: Frost& Sullivan, Maybank Kim Eng
0
5,000
10,000
15,000
20,000
25,000
30,000
35,000
2006 2010 2015F
Casual bag segment Travel bag segment Business segment
Samsonite/American Tourister
9.6%
VF Corp3.1% Tumi
1.6% Ace1.5%
Delsey1.2%
Rimowa0.6%
VIP0.6%
Others81.8%
Total:USD24,744 million
2006-2010 CAGR
3%
3.5%
1.8%
4.0%
2010-2015F CAGR
5%
4.7%
5.6%
4.6%
18 February 2013 Page 21 of 37
Samsonite International S.A.
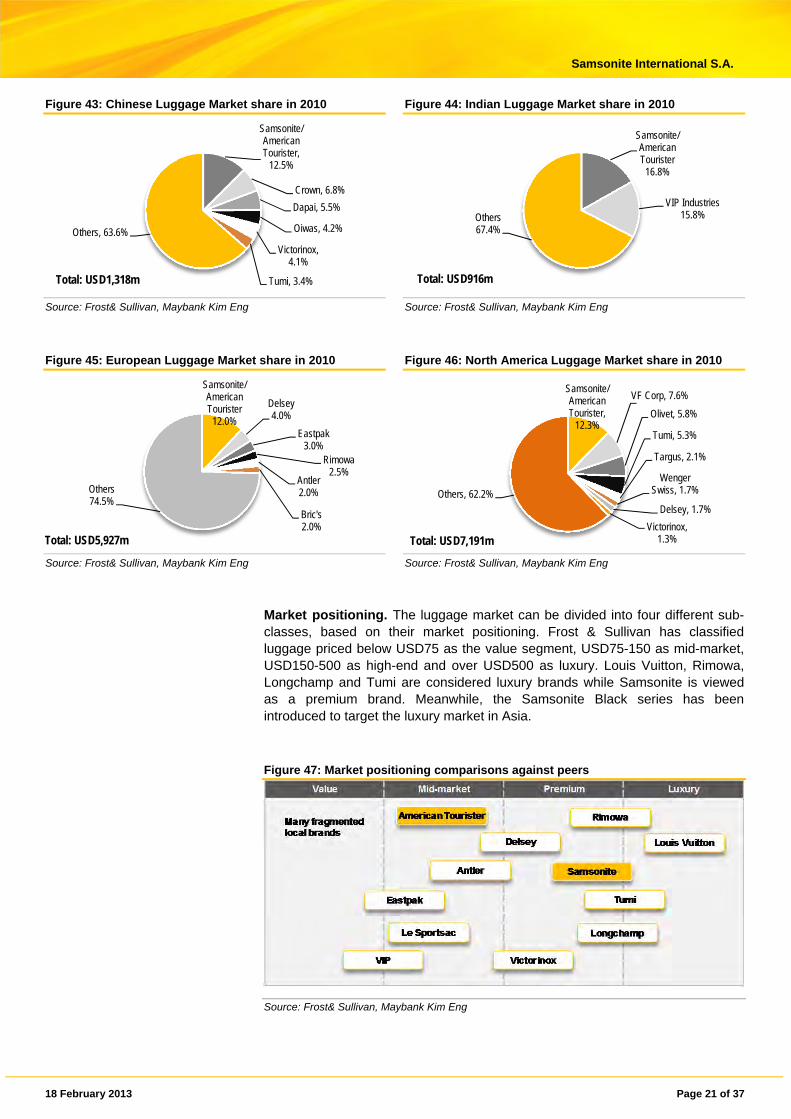
Figure 43: Chinese Luggage Market share in 2010 Figure 44: Indian Luggage Market share in 2010
Source: Frost& Sullivan, Maybank Kim Eng Source: Frost& Sullivan, Maybank Kim Eng
Figure 45: European Luggage Market share in 2010 Figure 46: North America Luggage Market share in 2010
Source: Frost& Sullivan, Maybank Kim Eng Source: Frost& Sullivan, Maybank Kim Eng
Market positioning. The luggage market can be divided into four different sub-classes, based on their market positioning. Frost & Sullivan has classified luggage priced below USD75 as the value segment, USD75-150 as mid-market, USD150-500 as high-end and over USD500 as luxury. Louis Vuitton, Rimowa, Longchamp and Tumi are considered luxury brands while Samsonite is viewed as a premium brand. Meanwhile, the Samsonite Black series has been introduced to target the luxury market in Asia.
Figure 47: Market positioning comparisons against peers
Source: Frost& Sullivan, Maybank Kim Eng
Samsonite/American Tourister,
12.5%
Crown, 6.8%
Dapai, 5.5%
Oiwas, 4.2%
Victorinox, 4.1%
Tumi, 3.4%
Others, 63.6%
Total: USD1,318m
Samsonite/American Tourister
16.8%
VIP Industries15.8%Others
67.4%
Total: USD916m
Samsonite/American Tourister
12.0%
Delsey4.0%
Eastpak3.0%
Rimowa2.5%
Antler2.0%
Bric's2.0%
Others74.5%
Samsonite/American Tourister,
12.3%
VF Corp, 7.6%
Olivet, 5.8%
Tumi, 5.3%
Targus, 2.1%
Wenger Swiss, 1.7%
Delsey, 1.7%
Victorinox, 1.3%
Others, 62.2%
Total: USD5,927m Total: USD7,191m
18 February 2013 Page 22 of 37
Samsonite International S.A.
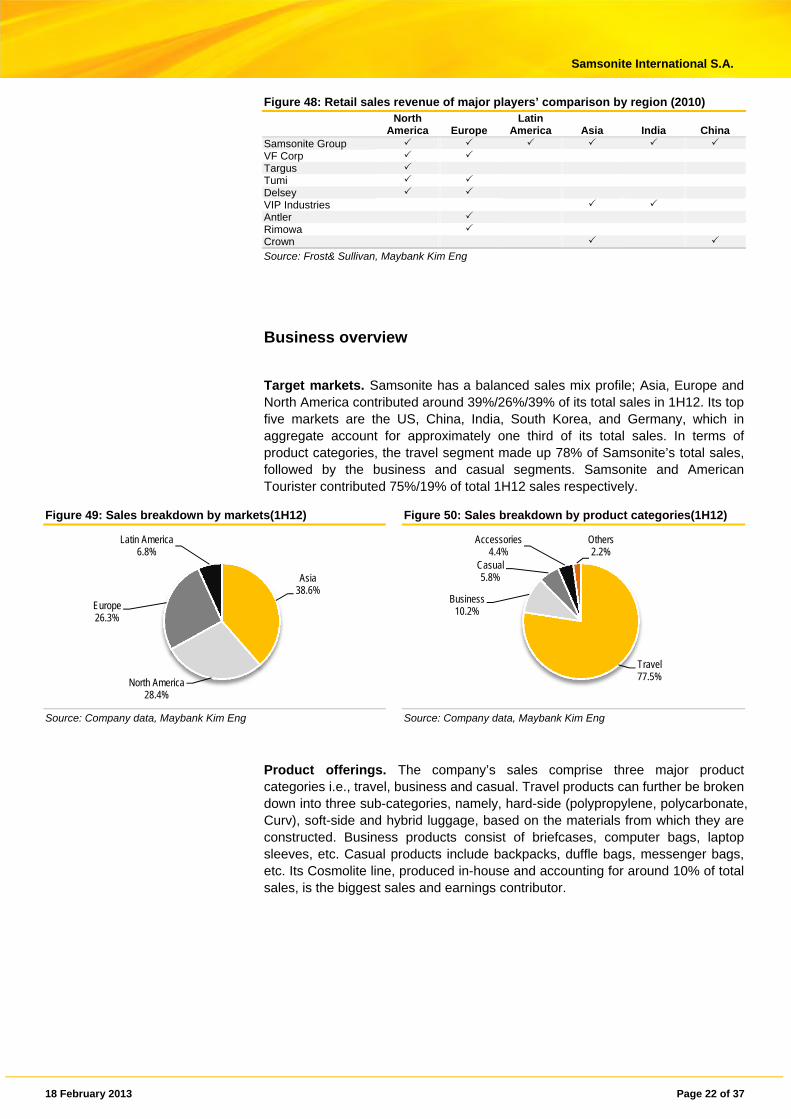
Figure 48: Retail sales revenue of major players’ comparison by region (2010)
North
America Europe Latin
America Asia India China Samsonite Group VF Corp Targus Tumi Delsey VIP Industries Antler Rimowa Crown
Source: Frost& Sullivan, Maybank Kim Eng
Business overview
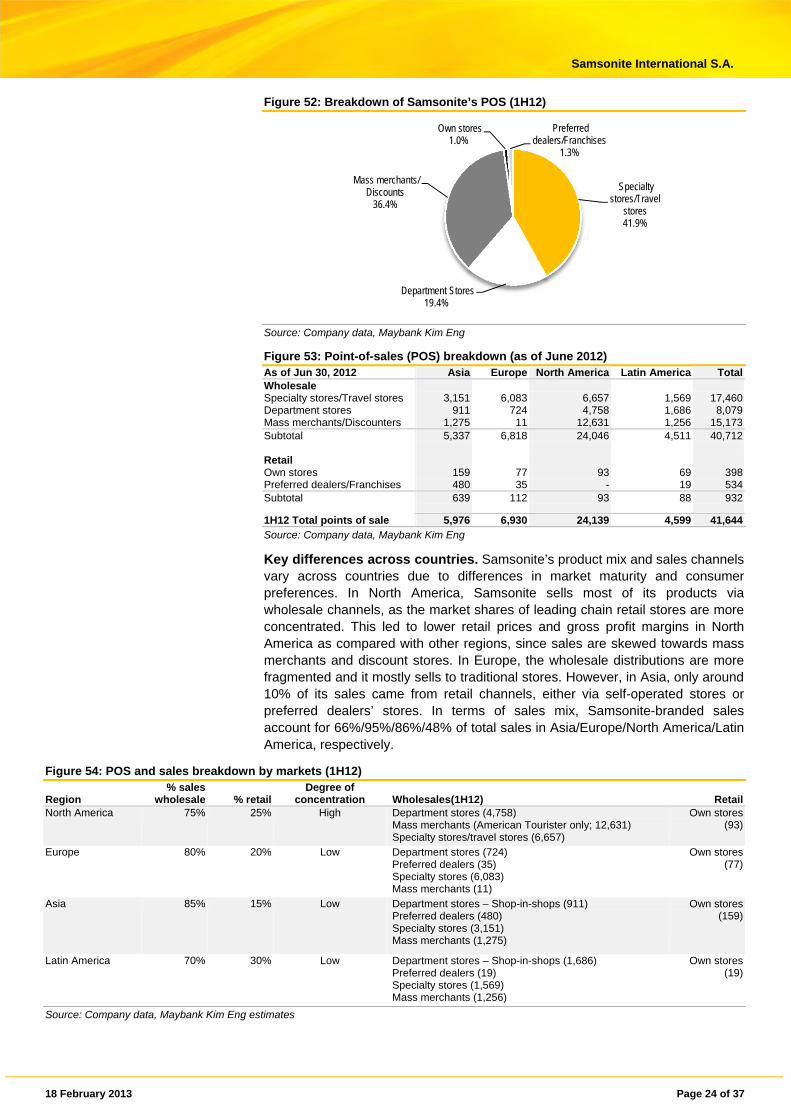
Target markets. Samsonite has a balanced sales mix profile; Asia, Europe and North America contributed around 39%/26%/39% of its total sales in 1H12. Its top five markets are the US, China, India, South Korea, and Germany, which in aggregate account for approximately one third of its total sales. In terms of product categories, the travel segment made up 78% of Samsonite’s total sales, followed by the business and casual segments. Samsonite and American Tourister contributed 75%/19% of total 1H12 sales respectively.
Figure 49: Sales breakdown by markets(1H12) Figure 50: Sales breakdown by product categories(1H12)
Source: Company data, Maybank Kim Eng Source: Company data, Maybank Kim Eng
Product offerings. The company’s sales comprise three major product categories i.e., travel, business and casual. Travel products can further be broken down into three sub-categories, namely, hard-side (polypropylene, polycarbonate, Curv), soft-side and hybrid luggage, based on the materials from which they are constructed. Business products consist of briefcases, computer bags, laptop sleeves, etc. Casual products include backpacks, duffle bags, messenger bags, etc. Its Cosmolite line, produced in-house and accounting for around 10% of total sales, is the biggest sales and earnings contributor.
Asia38.6%
North America28.4%
Europe26.3%
Latin America6.8%
Travel77.5%
Business10.2%
Casual5.8%
Accessories4.4%
Others2.2%

18 February 2013 Page 23 of 37
Samsonite International S.A.
Figure 51: Examples of Best Sellers
Source: Company data, Maybank Kim Eng
Sourcing. Samsonite sources both finished goods and raw materials from over 100 third-party suppliers globally, predominantly in China, Vietnam and India. The sourcing process is handled at a regional level, coordinated by its chief supply officer, who is located in Mansfield, Massachusetts.
Production. Samsonite’s in-house production consists almost entirely of hard-side production, including its Cosmolite and Cubelite product lines. The three production plants consist of factories located in Oudenaarde (Belgium), Szekszard (Hungary), and Nashik (India).
Quality control. New products are required to undergo a series of simulated use and stress tests to assure durability and strength. The company has put its own quality control inspectors, engineers and lab technicians at its manufacturing facilities, and installed quality assurance officers at vendors’ production facilities. It also assigns both quality inspectors and quality test laboratories to monitor the production of its third party suppliers in Asia. There are several quality test laboratories, such as in Shenzhen (China), Ningbo (China) and Vietnam.
Distribution. Samsonite has one distribution center in Europe, in Oudenaarde, Belgium, one distribution center in North America located in Jacksonville, Florida, and a number of distribution centers in Asia and Latin America.
Sales channels. Samsonite predominately sells its products wholesale. As of 1H12, it operates 41,644 points of sales (POS), consisting of 40,712 wholesale and 932 retail POS. That said, around 80% of its net sales are derived from the wholesale channel. Its products are mainly available in four different types of market namely department stores and shop-in-shops, luggage specialty stores, mass merchants/hypermarkets and discounters, and internet retailers and other smaller channels. As of 1H12, 42%/19%/36% of its outlets is in specialty stores/department stores/discount outlets.
18 February 2013 Page 24 of 37
Samsonite International S.A.
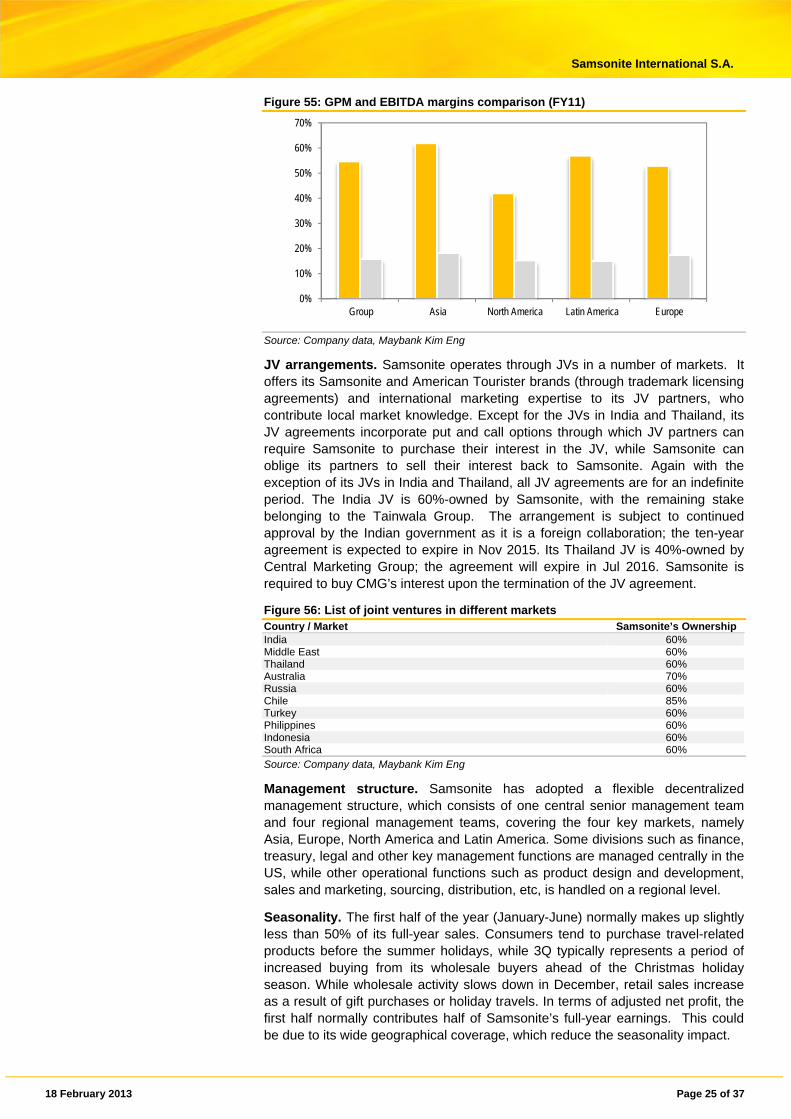
Figure 52: Breakdown of Samsonite’s POS (1H12)
Source: Company data, Maybank Kim Eng
Figure 53: Point-of-sales (POS) breakdown (as of June 2012) As of Jun 30, 2012 Asia Europe North America Latin America TotalWholesale Specialty stores/Travel stores 3,151 6,083 6,657 1,569 17,460Department stores 911 724 4,758 1,686 8,079Mass merchants/Discounters 1,275 11 12,631 1,256 15,173Subtotal 5,337 6,818 24,046 4,511 40,712 Retail Own stores 159 77 93 69 398Preferred dealers/Franchises 480 35 - 19 534Subtotal 639 112 93 88 932
1H12 Total points of sale 5,976 6,930 24,139 4,599 41,644Source: Company data, Maybank Kim Eng
Key differences across countries. Samsonite’s product mix and sales channels vary across countries due to differences in market maturity and consumer preferences. In North America, Samsonite sells most of its products via wholesale channels, as the market shares of leading chain retail stores are more concentrated. This led to lower retail prices and gross profit margins in North America as compared with other regions, since sales are skewed towards mass merchants and discount stores. In Europe, the wholesale distributions are more fragmented and it mostly sells to traditional stores. However, in Asia, only around 10% of its sales came from retail channels, either via self-operated stores or preferred dealers’ stores. In terms of sales mix, Samsonite-branded sales account for 66%/95%/86%/48% of total sales in Asia/Europe/North America/Latin America, respectively.
Figure 54: POS and sales breakdown by markets (1H12)
Region % sales
wholesale % retail Degree of
concentration Wholesales(1H12) RetailNorth America 75% 25% High Department stores (4,758)
Mass merchants (American Tourister only; 12,631) Specialty stores/travel stores (6,657)
Own stores(93)
Europe 80% 20% Low Department stores (724) Preferred dealers (35) Specialty stores (6,083) Mass merchants (11)
Own stores (77)
Asia 85% 15% Low Department stores – Shop-in-shops (911) Preferred dealers (480) Specialty stores (3,151) Mass merchants (1,275)
Own stores (159)
Latin America 70% 30% Low Department stores – Shop-in-shops (1,686) Preferred dealers (19) Specialty stores (1,569) Mass merchants (1,256)
Own stores (19)
Source: Company data, Maybank Kim Eng estimates
Specialty stores/Travel
stores41.9%
Department Stores19.4%
Mass merchants/Discounts
36.4%
Own stores1.0%
Preferred dealers/Franchises
1.3%
18 February 2013 Page 25 of 37
Samsonite International S.A.
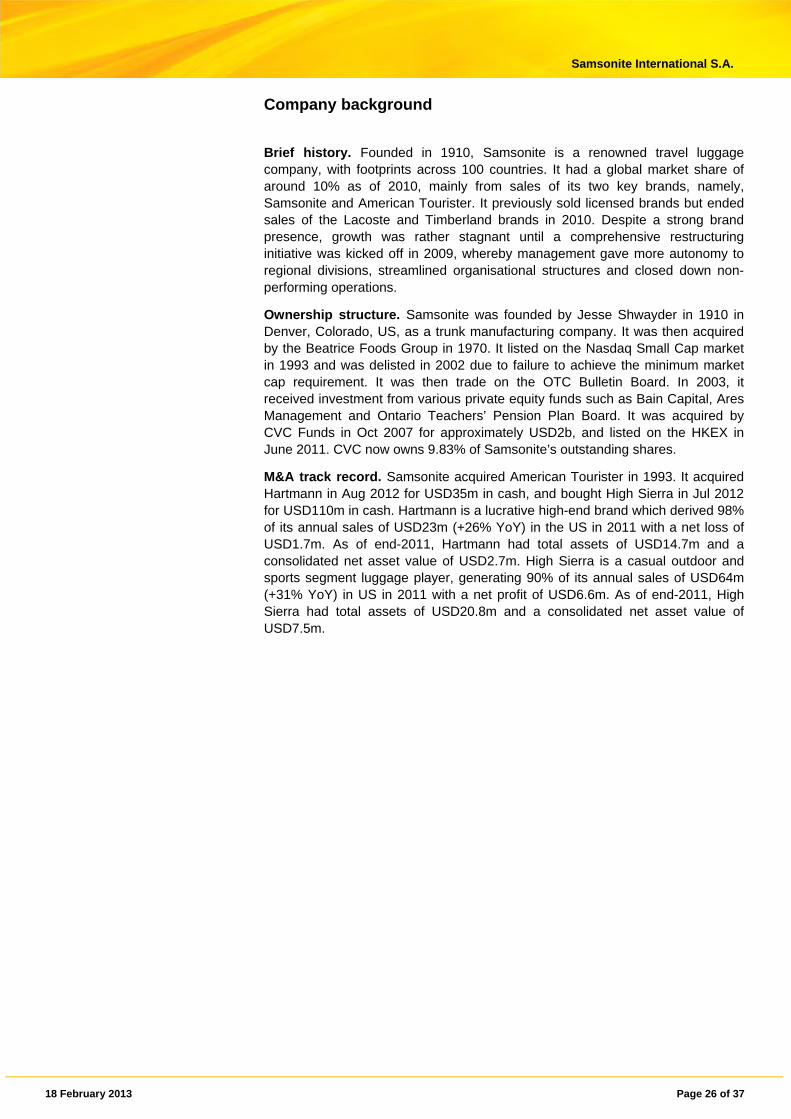
Figure 55: GPM and EBITDA margins comparison (FY11)
Source: Company data, Maybank Kim Eng
JV arrangements. Samsonite operates through JVs in a number of markets. It offers its Samsonite and American Tourister brands (through trademark licensing agreements) and international marketing expertise to its JV partners, who contribute local market knowledge. Except for the JVs in India and Thailand, its JV agreements incorporate put and call options through which JV partners can require Samsonite to purchase their interest in the JV, while Samsonite can oblige its partners to sell their interest back to Samsonite. Again with the exception of its JVs in India and Thailand, all JV agreements are for an indefinite period. The India JV is 60%-owned by Samsonite, with the remaining stake belonging to the Tainwala Group. The arrangement is subject to continued approval by the Indian government as it is a foreign collaboration; the ten-year agreement is expected to expire in Nov 2015. Its Thailand JV is 40%-owned by Central Marketing Group; the agreement will expire in Jul 2016. Samsonite is required to buy CMG’s interest upon the termination of the JV agreement.
Figure 56: List of joint ventures in different markets Country / Market Samsonite’s Ownership India 60% Middle East 60% Thailand 60% Australia 70% Russia 60% Chile 85% Turkey 60% Philippines 60% Indonesia 60% South Africa 60% Source: Company data, Maybank Kim Eng
Management structure. Samsonite has adopted a flexible decentralized management structure, which consists of one central senior management team and four regional management teams, covering the four key markets, namely Asia, Europe, North America and Latin America. Some divisions such as finance, treasury, legal and other key management functions are managed centrally in the US, while other operational functions such as product design and development, sales and marketing, sourcing, distribution, etc, is handled on a regional level.
Seasonality. The first half of the year (January-June) normally makes up slightly less than 50% of its full-year sales. Consumers tend to purchase travel-related products before the summer holidays, while 3Q typically represents a period of increased buying from its wholesale buyers ahead of the Christmas holiday season. While wholesale activity slows down in December, retail sales increase as a result of gift purchases or holiday travels. In terms of adjusted net profit, the first half normally contributes half of Samsonite’s full-year earnings. This could be due to its wide geographical coverage, which reduce the seasonality impact.
0%
10%
20%
30%
40%
50%
60%
70%
Group Asia North America Latin America Europe
18 February 2013 Page 26 of 37
Samsonite International S.A.
Company background
Brief history. Founded in 1910, Samsonite is a renowned travel luggage company, with footprints across 100 countries. It had a global market share of around 10% as of 2010, mainly from sales of its two key brands, namely, Samsonite and American Tourister. It previously sold licensed brands but ended sales of the Lacoste and Timberland brands in 2010. Despite a strong brand presence, growth was rather stagnant until a comprehensive restructuring initiative was kicked off in 2009, whereby management gave more autonomy to regional divisions, streamlined organisational structures and closed down non-performing operations.
Ownership structure. Samsonite was founded by Jesse Shwayder in 1910 in Denver, Colorado, US, as a trunk manufacturing company. It was then acquired by the Beatrice Foods Group in 1970. It listed on the Nasdaq Small Cap market in 1993 and was delisted in 2002 due to failure to achieve the minimum market cap requirement. It was then trade on the OTC Bulletin Board. In 2003, it received investment from various private equity funds such as Bain Capital, Ares Management and Ontario Teachers’ Pension Plan Board. It was acquired by CVC Funds in Oct 2007 for approximately USD2b, and listed on the HKEX in June 2011. CVC now owns 9.83% of Samsonite’s outstanding shares.
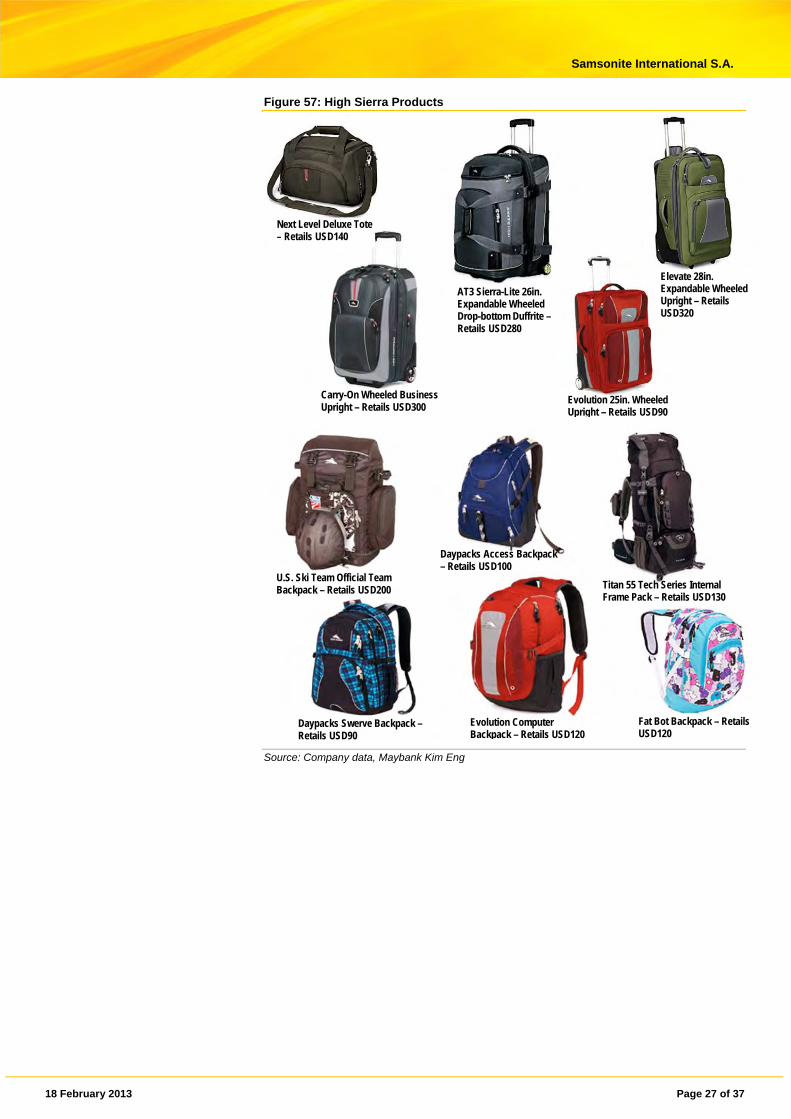
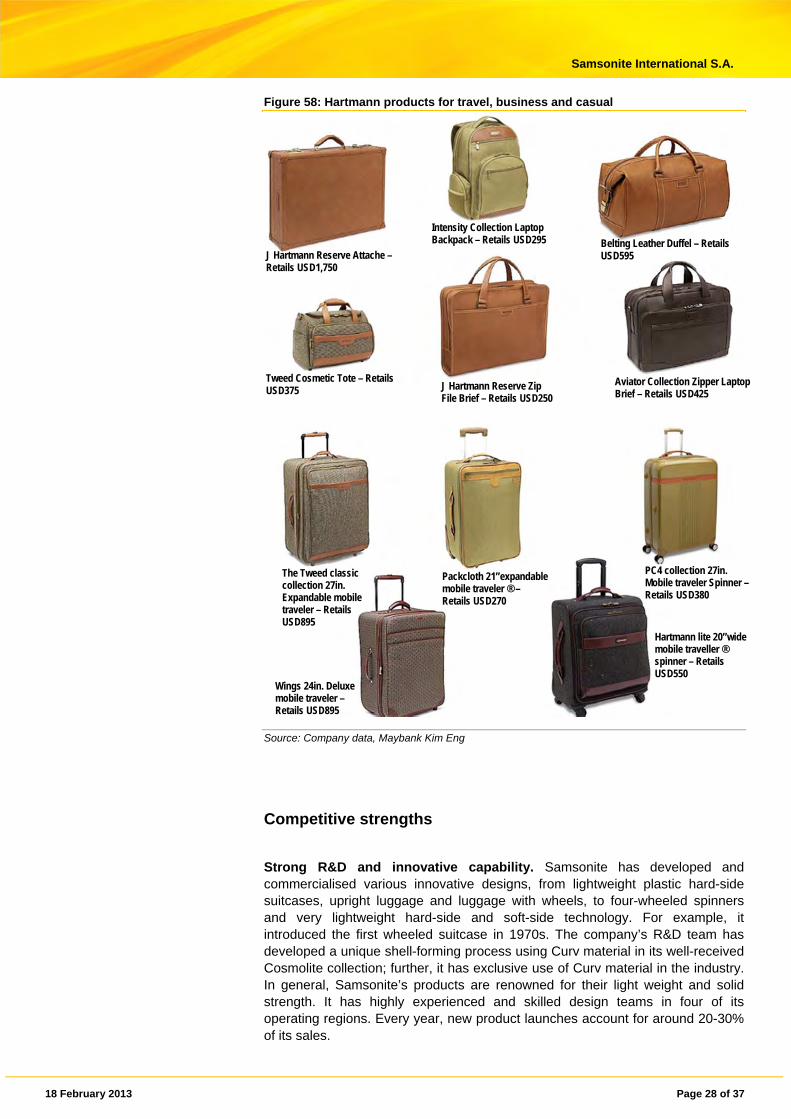
M&A track record. Samsonite acquired American Tourister in 1993. It acquired Hartmann in Aug 2012 for USD35m in cash, and bought High Sierra in Jul 2012 for USD110m in cash. Hartmann is a lucrative high-end brand which derived 98% of its annual sales of USD23m (+26% YoY) in the US in 2011 with a net loss of USD1.7m. As of end-2011, Hartmann had total assets of USD14.7m and a consolidated net asset value of USD2.7m. High Sierra is a casual outdoor and sports segment luggage player, generating 90% of its annual sales of USD64m (+31% YoY) in US in 2011 with a net profit of USD6.6m. As of end-2011, High Sierra had total assets of USD20.8m and a consolidated net asset value of USD7.5m.
18 February 2013 Page 27 of 37
Samsonite International S.A.
Figure 57: High Sierra Products
Source: Company data, Maybank Kim Eng
Next Level Deluxe Tote – Retails USD140
AT3 Sierra-Lite 26in. Expandable Wheeled Drop-bottom Duffrite – Retails USD280
Evolution 25in. Wheeled Upright – Retails USD90
Carry-On Wheeled Business Upright – Retails USD300
Elevate 28in. Expandable Wheeled Upright – Retails USD320
U.S. Ski Team Official Team Backpack – Retails USD200
Daypacks Access Backpack – Retails USD100
Evolution Computer Backpack – Retails USD120
Daypacks Swerve Backpack – Retails USD90
Titan 55 Tech Series Internal Frame Pack – Retails USD130
Fat Bot Backpack – Retails USD120
18 February 2013 Page 28 of 37
Samsonite International S.A.
Figure 58: Hartmann products for travel, business and casual
Source: Company data, Maybank Kim Eng
Competitive strengths
Strong R&D and innovative capability. Samsonite has developed and commercialised various innovative designs, from lightweight plastic hard-side suitcases, upright luggage and luggage with wheels, to four-wheeled spinners and very lightweight hard-side and soft-side technology. For example, it introduced the first wheeled suitcase in 1970s. The company’s R&D team has developed a unique shell-forming process using Curv material in its well-received Cosmolite collection; further, it has exclusive use of Curv material in the industry. In general, Samsonite’s products are renowned for their light weight and solid strength. It has highly experienced and skilled design teams in four of its operating regions. Every year, new product launches account for around 20-30% of its sales.
J Hartmann Reserve Attache – Retails USD1,750
Intensity Collection Laptop Backpack – Retails USD295
J Hartmann Reserve Zip File Brief – Retails USD250
Tweed Cosmetic Tote – Retails USD375
Belting Leather Duffel – Retails USD595
Aviator Collection Zipper Laptop Brief – Retails USD425
The Tweed classic collection 27in. Expandable mobile traveler – Retails USD895
Packcloth 21”expandable mobile traveler ® – Retails USD270
Wings 24in. Deluxe mobile traveler – Retails USD895
PC4 collection 27in. Mobile traveler Spinner – Retails USD380
Hartmann lite 20”wide mobile traveller ® spinner – Retails USD550

18 February 2013 Page 29 of 37
Samsonite International S.A.
Figure 59: Killer product line – Cosmolite Series
Source: Company data, Maybank Kim Eng
Figure 60: New product launches in 2012-Samsonite Black Label (SBL CUBELITE), INOVA, ESSENSIS
Source: Company data, Maybank Kim Eng
Asset-light model. Following its restructuring in 2009, Samsonite has outsourced over 90% of its production to independent third-party suppliers in China and Southeast Asia, and only produces its hard-side luggage which uses Curv material. We believe outsourcing has improved its overall cost efficiency by allowing it to focus on core R&D, marketing and network expansion. Because of its scale, we believe Samsonite is in a good position to enjoy favourable pricing and terms from its suppliers. Overall, we believe its asset-light model frees up more resources, allowing Samsonite to better focus on its core competencies of R&D and marketing.
Extensive global sales network. As of Jun 2012, Samsonite has established 41,644 POS globally with 932 of its retail stores. 80% of its sales are derived from the wholesale channel. An ERP system offering updated sales and inventory information has been installed at its POS, with good coverage in North America, Europe and some Asian markets such as Greater China, South Korea and Japan. Around 43%/20%/37% of wholesale POS are located in specialty travel stores/department stores/mass merchants and discount outlets. Looking ahead, Samsonite plans to increase its POS by 10% p.a. in the fast growing Asia markets over the next several years.
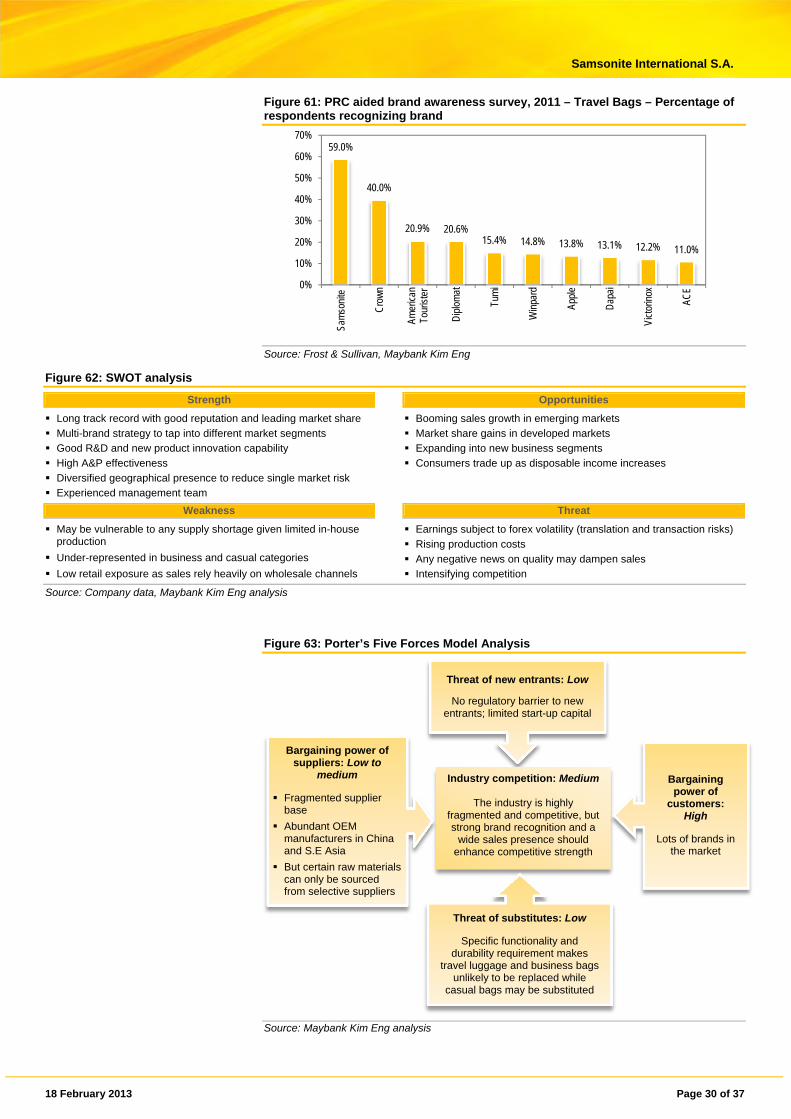
Brand awareness. According to Frost & Sullivan, Samsonite ranks no.1 in terms of market share in all of its top five markets. For example, it has a market share of 13%/17%/12%/12% in China/India/Europe/North America. In a survey of the travel bag industry conducted by Frost & Sullivan, Samsonite ranked first in its top four markets including China, as 59% of the respondents recognized its brand in the travel bags category. We believe its localised and multi-channel marketing such as in-store promotions, advertisements at airports as well as on TV, the internet and printed media etc., would further strengthen its brand recognition.
18 February 2013 Page 30 of 37
Samsonite International S.A.
Figure 61: PRC aided brand awareness survey, 2011 – Travel Bags – Percentage of respondents recognizing brand
Source: Frost & Sullivan, Maybank Kim Eng
Figure 62: SWOT analysis
Strength Opportunities
Long track record with good reputation and leading market share
Multi-brand strategy to tap into different market segments
Good R&D and new product innovation capability
High A&P effectiveness
Diversified geographical presence to reduce single market risk
Experienced management team
Booming sales growth in emerging markets
Market share gains in developed markets
Expanding into new business segments
Consumers trade up as disposable income increases
Weakness Threat
May be vulnerable to any supply shortage given limited in-house production
Under-represented in business and casual categories
Low retail exposure as sales rely heavily on wholesale channels
Earnings subject to forex volatility (translation and transaction risks)
Rising production costs
Any negative news on quality may dampen sales
Intensifying competition
Source: Company data, Maybank Kim Eng analysis
Figure 63: Porter’s Five Forces Model Analysis
Source: Maybank Kim Eng analysis
59.0%
40.0%
20.9% 20.6%15.4% 14.8% 13.8% 13.1% 12.2% 11.0%
0%
10%
20%
30%
40%
50%
60%
70%
Sam
soni
te
Cro
wn
Amer
ican
Tour
iste
r
Dip
lom
at
Tum
i
Win
pard
Appl
e
Dap
ai
Vict
orin
ox
ACE
Threat of new entrants: Low
No regulatory barrier to new entrants; limited start-up capital
Bargaining power of suppliers: Low to
medium
Fragmented supplier base
Abundant OEM manufacturers in China and S.E Asia
But certain raw materials can only be sourced from selective suppliers
Industry competition: Medium
The industry is highly fragmented and competitive, but strong brand recognition and a
wide sales presence should enhance competitive strength
Bargaining power of
customers: High
Lots of brands in
the market
Threat of substitutes: Low
Specific functionality and durability requirement makes
travel luggage and business bags unlikely to be replaced while
casual bags may be substituted
18 February 2013 Page 31 of 37
Samsonite International S.A.
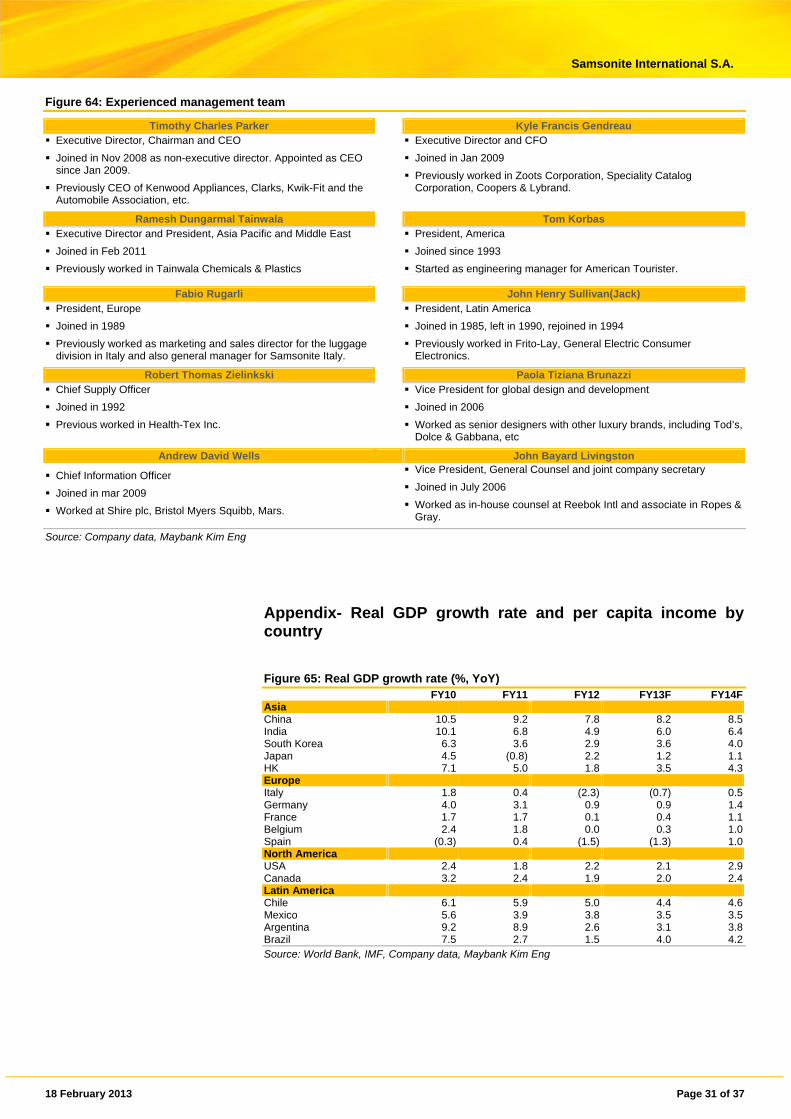
Figure 64: Experienced management team
Timothy Charles Parker Kyle Francis Gendreau Executive Director, Chairman and CEO
Joined in Nov 2008 as non-executive director. Appointed as CEO since Jan 2009.
Previously CEO of Kenwood Appliances, Clarks, Kwik-Fit and the Automobile Association, etc.
Executive Director and CFO
Joined in Jan 2009
Previously worked in Zoots Corporation, Speciality Catalog Corporation, Coopers & Lybrand.
Ramesh Dungarmal Tainwala Tom Korbas Executive Director and President, Asia Pacific and Middle East
Joined in Feb 2011
Previously worked in Tainwala Chemicals & Plastics
President, America
Joined since 1993
Started as engineering manager for American Tourister.
Fabio Rugarli John Henry Sullivan(Jack) President, Europe
Joined in 1989
Previously worked as marketing and sales director for the luggage division in Italy and also general manager for Samsonite Italy.
President, Latin America
Joined in 1985, left in 1990, rejoined in 1994
Previously worked in Frito-Lay, General Electric Consumer Electronics.
Robert Thomas Zielinkski Paola Tiziana Brunazzi Chief Supply Officer
Joined in 1992
Previous worked in Health-Tex Inc.
Vice President for global design and development
Joined in 2006
Worked as senior designers with other luxury brands, including Tod’s, Dolce & Gabbana, etc
Andrew David Wells John Bayard Livingston
Chief Information Officer
Joined in mar 2009
Worked at Shire plc, Bristol Myers Squibb, Mars.
Vice President, General Counsel and joint company secretary
Joined in July 2006
Worked as in-house counsel at Reebok Intl and associate in Ropes & Gray.
Source: Company data, Maybank Kim Eng
Appendix- Real GDP growth rate and per capita income by country
Figure 65: Real GDP growth rate (%, YoY) FY10 FY11 FY12 FY13F FY14F
Asia China 10.5 9.2 7.8 8.2 8.5India 10.1 6.8 4.9 6.0 6.4South Korea 6.3 3.6 2.9 3.6 4.0Japan 4.5 (0.8) 2.2 1.2 1.1HK 7.1 5.0 1.8 3.5 4.3Europe Italy 1.8 0.4 (2.3) (0.7) 0.5Germany 4.0 3.1 0.9 0.9 1.4France 1.7 1.7 0.1 0.4 1.1Belgium 2.4 1.8 0.0 0.3 1.0Spain (0.3) 0.4 (1.5) (1.3) 1.0North America USA 2.4 1.8 2.2 2.1 2.9Canada 3.2 2.4 1.9 2.0 2.4Latin America Chile 6.1 5.9 5.0 4.4 4.6Mexico 5.6 3.9 3.8 3.5 3.5Argentina 9.2 8.9 2.6 3.1 3.8Brazil 7.5 2.7 1.5 4.0 4.2Source: World Bank, IMF, Company data, Maybank Kim Eng

18 February 2013 Page 32 of 37
Samsonite International S.A.
Figure 66: Per Capita Income (Current International Dollars) FY10 FY11 FY12 FY13F FY14F
Asia China 7,550.5 8,382.0 9,142.7 10,046.5 11,030.1 India 3,418.6 3,693.5 3,944.3 4,240.1 4,567.3 South Korea 30,041.6 31,713.7 33,171.5 34,910.5 36,746.2 Japan 34,330.2 34,739.7 36,040.1 37,388.3 38,689.6 HK 46,128.0 49,137.5 50,716.1 53,317.3 56,070.5 Europe Italy 29,840.6 30,464.4 30,132.6 30,373.9 30,858.4 Germany 36,013.3 37,897.0 38,695.9 39,939.1 41,121.0 France 33,996.5 35,156.5 35,613.5 36,349.6 37,399.0 Belgium 36,635.8 37,736.9 37,995.2 38,617.9 39,423.6 Spain 29,880.6 30,625.8 30,315.5 30,688.3 31,374.9 North America USA 46,900.4 48,386.7 49,601.4 51,057.6 52,817.0 Canada 39,154.3 40,541.1 41,335.1 42,270.4 43,329.1 Latin America Chile 16,111.8 17,221.7 17,974.2 18,843.9 19,804.5 Mexico 13,932.3 14,609.8 15,177.5 15,811.3 16,491.3 Argentina 15,901.2 17,516.2 18,318.7 19,160.4 20,083.1 Brazil 11,314.5 11,769.4 12,181.3 12,779.9 13,389.5 Source: World Bank, IMF, Company data, Maybank Kim Eng
18 February 2013 Page 33 of 37
Samsonite International S.A.
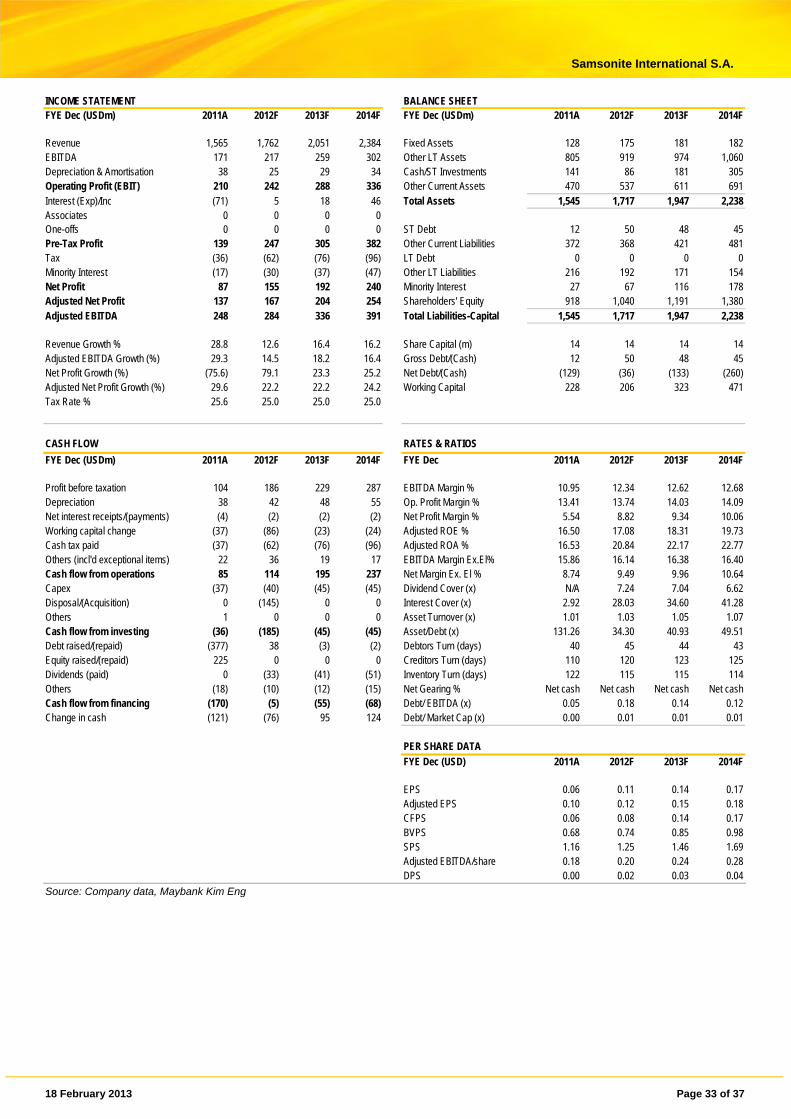
INCOME STATEMENT BALANCE SHEET FYE Dec (USDm) 2011A 2012F 2013F 2014F
FYE Dec (USDm) 2011A 2012F 2013F 2014F Revenue 1,565 1,762 2,051 2,384 Fixed Assets 128 175 181 182 EBITDA 171 217 259 302 Other LT Assets 805 919 974 1,060 Depreciation & Amortisation 38 25 29 34 Cash/ST Investments 141 86 181 305 Operating Profit (EBIT) 210 242 288 336 Other Current Assets 470 537 611 691 Interest (Exp)/Inc (71) 5 18 46 Total Assets 1,545 1,717 1,947 2,238 Associates 0 0 0 0 One-offs 0 0 0 0 ST Debt 12 50 48 45 Pre-Tax Profit 139 247 305 382 Other Current Liabilities 372 368 421 481 Tax (36) (62) (76) (96) LT Debt 0 0 0 0 Minority Interest (17) (30) (37) (47) Other LT Liabilities 216 192 171 154 Net Profit 87 155 192 240 Minority Interest 27 67 116 178 Adjusted Net Profit 137 167 204 254 Shareholders' Equity 918 1,040 1,191 1,380 Adjusted EBITDA 248 284 336 391 Total Liabilities-Capital 1,545 1,717 1,947 2,238 Revenue Growth % 28.8 12.6 16.4 16.2 Share Capital (m) 14 14 14 14 Adjusted EBITDA Growth (%) 29.3 14.5 18.2 16.4 Gross Debt/(Cash) 12 50 48 45 Net Profit Growth (%) (75.6) 79.1 23.3 25.2 Net Debt/(Cash) (129) (36) (133) (260) Adjusted Net Profit Growth (%) 29.6 22.2 22.2 24.2 Working Capital 228 206 323 471 Tax Rate % 25.6 25.0 25.0 25.0
CASH FLOW RATES & RATIOS
FYE Dec (USDm) 2011A 2012F 2013F 2014F FYE Dec 2011A 2012F 2013F 2014F Profit before taxation 104 186 229 287
EBITDA Margin % 10.95 12.34 12.62 12.68 Depreciation 38 42 48 55 Op. Profit Margin % 13.41 13.74 14.03 14.09 Net interest receipts/(payments) (4) (2) (2) (2) Net Profit Margin % 5.54 8.82 9.34 10.06 Working capital change (37) (86) (23) (24) Adjusted ROE % 16.50 17.08 18.31 19.73 Cash tax paid (37) (62) (76) (96) Adjusted ROA % 16.53 20.84 22.17 22.77 Others (incl'd exceptional items) 22 36 19 17 EBITDA Margin Ex.El% 15.86 16.14 16.38 16.40 Cash flow from operations 85 114 195 237 Net Margin Ex. El % 8.74 9.49 9.96 10.64 Capex (37) (40) (45) (45) Dividend Cover (x) N/A 7.24 7.04 6.62 Disposal/(Acquisition) 0 (145) 0 0 Interest Cover (x) 2.92 28.03 34.60 41.28 Others 1 0 0 0 Asset Turnover (x) 1.01 1.03 1.05 1.07 Cash flow from investing (36) (185) (45) (45) Asset/Debt (x) 131.26 34.30 40.93 49.51 Debt raised/(repaid) (377) 38 (3) (2) Debtors Turn (days) 40 45 44 43 Equity raised/(repaid) 225 0 0 0 Creditors Turn (days) 110 120 123 125 Dividends (paid) 0 (33) (41) (51) Inventory Turn (days) 122 115 115 114 Others (18) (10) (12) (15) Net Gearing % Net cash Net cash Net cash Net cash Cash flow from financing (170) (5) (55) (68) Debt/ EBITDA (x) 0.05 0.18 0.14 0.12 Change in cash (121) (76) 95 124 Debt/ Market Cap (x) 0.00 0.01 0.01 0.01 PER SHARE DATA
FYE Dec (USD) 2011A 2012F 2013F 2014F
EPS 0.06 0.11 0.14 0.17 Adjusted EPS 0.10 0.12 0.15 0.18 CFPS 0.06 0.08 0.14 0.17 BVPS 0.68 0.74 0.85 0.98 SPS 1.16 1.25 1.46 1.69 Adjusted EBITDA/share 0.18 0.20 0.24 0.28 DPS 0.00 0.02 0.03 0.04
Source: Company data, Maybank Kim Eng
18 February 2013 Page 34 of 37
Samsonite International S.A.
RESEARCH OFFICES REGIONAL
P K BASU Regional Head, Research & Economics (65) 6432 1821 [email protected]
WONG Chew Hann, CA Acting Regional Head of Institutional Research (603) 2297 8686 [email protected]
ONG Seng Yeow Regional Products & Planning (65) 6432 1453 [email protected]
ECONOMICS Suhaimi ILIAS Chief Economist Singapore | Malaysia (603) 2297 8682 [email protected]
Luz LORENZO Philippines | Indonesia (63) 2 849 8836 [email protected]
Tim LEELAHAPHAN Thailand (662) 658 1420 [email protected]
MALAYSIA WONG Chew Hann, CA Head of Research (603) 2297 8686 [email protected] Strategy Construction & Infrastructure Desmond CH’NG, ACA (603) 2297 8680 [email protected] Banking - Regional LIAW Thong Jung (603) 2297 8688 [email protected] Oil & Gas Automotive Shipping ONG Chee Ting, CA (603) 2297 8678 [email protected] Plantations- Regional Mohshin AZIZ (603) 2297 8692 [email protected] Aviation Petrochem YIN Shao Yang, CPA (603) 2297 8916 [email protected] Gaming – Regional Media TAN CHI WEI, CFA (603) 2297 8690 [email protected] Power Telcos WONG Wei Sum, CFA (603) 2297 8679 [email protected] Property & REITs LEE Yen Ling (603) 2297 8691 [email protected] Building Materials Manufacturing Technology
LEE Cheng Hooi Head of Retail [email protected] Technicals
HONG KONG / CHINA Ivan CHEUNG, CFA (852) 2268 0634 [email protected] HK Property Industrial Jacqueline KO, CFA (852) 2268 0633 [email protected] Consumer Andy POON (852) 2268 0645 [email protected] Telecom & equipment Alex YEUNG (852) 2268 0636 [email protected] Industrial Warren LAU (852) 2268 0644 [email protected] Technology - Regional Karen KWAN (852) 2268 0640 [email protected] China Property Jeremy TAN (852) 2268 0635 [email protected] Gaming
INDIA Jigar SHAH Head of Research (91) 22 6623 2601 [email protected] Oil & Gas Automobile Cement Anubhav GUPTA (91) 22 6623 2605 [email protected] Metal & Mining Capital goods Property Urmil SHAH (91) 22 6623 2606 [email protected] Technology Media Varun VARMA (91) 226623 2611 [email protected] Banking
SINGAPORE Gregory YAP Head of Research (65) 6432 1450 [email protected] Technology & Manufacturing Telcos - Regional Wilson LIEW (65) 6432 1454 [email protected] Hotel & Resort Property & Construction James KOH (65) 6432 1431 [email protected] Logistics Resources Consumer Small & Mid Caps YEAK Chee Keong, CFA (65) 6432 1460 [email protected] Offshore & Marine Alison FOK (65) 6432 1447 [email protected] Services S-chips Bernard CHIN (65) 6432 1146 [email protected] Transport (Land, Shipping & Aviation) ONG Kian Lin (65) 6432 1470 [email protected] REITs / Property Wei Bin (65) 6432 1455 [email protected] S-chips Small & Mid Caps
INDONESIA Katarina SETIAWAN Head of Research (62) 21 2557 1125 [email protected] Consumer Strategy Telcos Lucky ARIESANDI, CFA (62) 21 2557 1127 [email protected] Base metals Mining Oil & Gas Wholesale Rahmi MARINA (62) 21 2557 1128 [email protected] Banking Multifinance Pandu ANUGRAH (62) 21 2557 1137 [email protected] Automotive Heavy equipment Plantation Toll road Adi N. WICAKSONO (62) 21 2557 1128 [email protected] Generalist Anthony YUNUS (62) 21 2557 1139 [email protected] Cement Infrastructure Property Arwani PRANADJAYA (62) 21 2557 1129 [email protected] Technicals
PHILIPPINES Luz LORENZO Head of Research (63) 2 849 8836 [email protected] Strategy Laura DY-LIACCO (63) 2 849 8840 [email protected] Utilities Conglomerates Telcos Lovell SARREAL (63) 2 849 8841 [email protected] Consumer Media Cement Kenneth NERECINA (63) 2 849 8839 [email protected] Conglomerates Property Ports/ Logistics Katherine TAN (63) 2 849 8843 [email protected] Banks Construction Ramon ADVIENTO (63) 2 849 8845 [email protected] Mining
THAILAND Sukit UDOMSIRIKUL Head of Research (66) 2658 6300 ext 5090 [email protected]
Maria LAPIZ Head of Institutional Research Dir (66) 2257 0250 | (66) 2658 6300 ext 1399 [email protected] Consumer/ Big Caps
Andrew STOTZ Strategist (66) 2658 6300 ext 5091 [email protected]
Mayuree CHOWVIKRAN (66) 2658 6300 ext 1440 [email protected] Strategy
Suttatip PEERASUB (66) 2658 6300 ext 1430 [email protected] Media Commerce Sutthichai KUMWORACHAI (66) 2658 6300 ext 1400 [email protected] Energy Petrochem Termporn TANTIVIVAT (66) 2658 6300 ext 1520 [email protected] Property Woraphon WIROONSRI (66) 2658 6300 ext 1560 [email protected] Banking & Finance Jaroonpan WATTANAWONG (66) 2658 6300 ext 1404 [email protected] Transportation Small cap. Chatchai JINDARAT (66) 2658 6300 ext 1401 [email protected] Electronics Pongrat RATANATAVANANANDA (66) 2658 6300 ext 1398 [email protected] Services/ Small Caps
VIETNAM Michael KOKALARI, CFA Head of Research (84) 838 38 66 47 [email protected] Strategy Nguyen Thi Ngan Tuyen (84) 844 55 58 88 x 8081 [email protected] Food and Beverage Oil and Gas Ngo Bich Van (84) 844 55 58 88 x 8084 [email protected] Banking Trinh Thi Ngoc Diep (84) 844 55 58 88 x 8242 [email protected] Technology Utilities Construction Dang Thi Kim Thoa (84) 844 55 58 88 x 8083 [email protected] Consumer Nguyen Trung Hoa +84 844 55 58 88 x 8088 [email protected] Steel Sugar Resources
18 February 2013 Page 35 of 37
Samsonite International S.A.
APPENDIX I: TERMS FOR PROVISION OF REPORT, DISCLAIMERS AND DISCLOSURES
DISCLAIMERS
This research report is prepared for general circulation and for information purposes only and under no circumstances should it be considered or intended as an offer to sell or a solicitation of an offer to buy the securities referred to herein. Investors should note that values of such securities, if any, may fluctuate and that each security’s price or value may rise or fall. Opinions or recommendations contained herein are in form of technical ratings and fundamental ratings. Technical ratings may differ from fundamental ratings as technical valuations apply different methodologies and are purely based on price and volume-related information extracted from the relevant jurisdiction’s stock exchange in the equity analysis. Accordingly, investors’ returns may be less than the original sum invested. Past performance is not necessarily a guide to future performance. This report is not intended to provide personal investment advice and does not take into account the specific investment objectives, the financial situation and the particular needs of persons who may receive or read this report. Investors should therefore seek financial, legal and other advice regarding the appropriateness of investing in any securities or the investment strategies discussed or recommended in this report.
The information contained herein has been obtained from sources believed to be reliable but such sources have not been independently verified by Maybank Investment Bank Berhad, its subsidiary and affiliates (collectively, “MKE”) and consequently no representation is made as to the accuracy or completeness of this report by MKE and it should not be relied upon as such. Accordingly, MKE and its officers, directors, associates, connected parties and/or employees (collectively, “Representatives”) shall not be liable for any direct, indirect or consequential losses or damages that may arise from the use or reliance of this report. Any information, opinions or recommendations contained herein are subject to change at any time, without prior notice.
This report may contain forward looking statements which are often but not always identified by the use of words such as “anticipate”, “believe”, “estimate”, “intend”, “plan”, “expect”, “forecast”, “predict” and “project” and statements that an event or result “may”, “will”, “can”, “should”, “could” or “might” occur or be achieved and other similar expressions. Such forward looking statements are based on assumptions made and information currently available to us and are subject to certain risks and uncertainties that could cause the actual results to differ materially from those expressed in any forward looking statements. Readers are cautioned not to place undue relevance on these forward-looking statements. MKE expressly disclaims any obligation to update or revise any such forward looking statements to reflect new information, events or circumstances after the date of this publication or to reflect the occurrence of unanticipated events.
MKE and its officers, directors and employees, including persons involved in the preparation or issuance of this report, may, to the extent permitted by law, from time to time participate or invest in financing transactions with the issuer(s) of the securities mentioned in this report, perform services for or solicit business from such issuers, and/or have a position or holding, or other material interest, or effect transactions, in such securities or options thereon, or other investments related thereto. In addition, it may make markets in the securities mentioned in the material presented in this report. MKE may, to the extent permitted by law, act upon or use the information presented herein, or the research or analysis on which they are based, before the material is published. One or more directors, officers and/or employees of MKE may be a director of the issuers of the securities mentioned in this report.
This report is prepared for the use of MKE’s clients and may not be reproduced, altered in any way, transmitted to, copied or distributed to any other party in whole or in part in any form or manner without the prior express written consent of MKE and MKE and its Representatives accepts no liability whatsoever for the actions of third parties in this respect.
This report is not directed to or intended for distribution to or use by any person or entity who is a citizen or resident of or located in any locality, state, country or other jurisdiction where such distribution, publication, availability or use would be contrary to law or regulation. This report is for distribution only under such circumstances as may be permitted by applicable law. The securities described herein may not be eligible for sale in all jurisdictions or to certain categories of investors. Without prejudice to the foregoing, the reader is to note that additional disclaimers, warnings or qualifications may apply based on geographical location of the person or entity receiving this report.
Malaysia
Opinions or recommendations contained herein are in the form of technical ratings and fundamental ratings. Technical ratings may differ from fundamental ratings as technical valuations apply different methodologies and are purely based on price and volume-related information extracted from Bursa Malaysia Securities Berhad in the equity analysis.
Singapore
This report has been produced as of the date hereof and the information herein may be subject to change. Maybank Kim Eng Research Pte. Ltd. (“Maybank KERPL”) in Singapore has no obligation to update such information for any recipient. For distribution in Singapore, recipients of this report are to contact Maybank KERPL in Singapore in respect of any matters arising from, or in connection with, this report. If the recipient of this report is not an accredited investor, expert investor or institutional investor (as defined under Section 4A of the Singapore Securities and Futures Act), Maybank KERPL shall be legally liable for the contents of this report, with such liability being limited to the extent (if any) as permitted by law.
Thailand
The disclosure of the survey result of the Thai Institute of Directors Association (“IOD”) regarding corporate governance is made pursuant to the policy of the Office of the Securities and Exchange Commission. The survey of the IOD is based on the information of a company listed on the Stock Exchange of Thailand and the market for Alternative Investment disclosed to the public and able to be accessed by a general public investor. The result, therefore, is from the perspective of a third party. It is not an evaluation of operation and is not based on inside information. The survey result is as of the date appearing in the Corporate Governance Report of Thai Listed Companies. As a result, the survey may be changed after that date. Maybank Kim Eng Securities (Thailand) Public Company Limited (“MBKET”) does not confirm nor certify the accuracy of such survey result.
Except as specifically permitted, no part of this presentation may be reproduced or distributed in any manner without the prior written permission of MBKET. MBKET accepts no liability whatsoever for the actions of third parties in this respect.
US
This research report prepared by MKE is distributed in the United States (“US”) to Major US Institutional Investors (as defined in Rule 15a-6 under the Securities Exchange Act of 1934, as amended) only by Maybank Kim Eng Securities USA Inc (“Maybank KESUSA”), a broker-dealer registered in the US (registered under Section 15 of the Securities Exchange Act of 1934, as amended). All responsibility for the distribution of this report by Maybank KESUSA in the US shall be borne by Maybank KESUSA. All resulting transactions by a US person or entity should be effected through a registered broker-dealer in the US. This report is not directed at you if MKE is prohibited or restricted by any legislation or regulation in any jurisdiction from making it available to you. You should satisfy yourself before reading it that Maybank KESUSA is permitted to provide research material concerning investments to you under relevant legislation and regulations.
UK
This document is being distributed by Maybank Kim Eng Securities (London) Ltd (“Maybank KESL”) which is authorized and regulated, by the Financial Services Authority and is for Informational Purposes only. This document is not intended for distribution to anyone defined as a Retail Client under the Financial Services and Markets Act 2000 within the UK. Any inclusion of a third party link is for the recipients convenience only, and that the firm does not take any responsibility for its comments or accuracy, and that access to such links is at the individuals own risk. Nothing in this report should be considered as constituting legal, accounting or tax advice, and that for accurate guidance recipients should consult with their own independent tax advisers.
18 February 2013 Page 36 of 37
Samsonite International S.A.
DISCLOSURES Legal Entities Disclosures
Malaysia: This report is issued and distributed in Malaysia by Maybank Investment Bank Berhad (15938-H) which is a Participating Organization of Bursa Malaysia Berhad and a holder of Capital Markets and Services License issued by the Securities Commission in Malaysia. Singapore: This material is issued and distributed in Singapore by Maybank KERPL (Co. Reg No 197201256N) which is regulated by the Monetary Authority of Singapore. Indonesia: PT Kim Eng Securities (“PTKES”) (Reg. No. KEP-251/PM/1992) is a member of the Indonesia Stock Exchange and is regulated by the BAPEPAM LK. Thailand: MBKET (Reg. No.0107545000314) is a member of the Stock Exchange of Thailand and is regulated by the Ministry of Finance and the Securities and Exchange Commission. Philippines: Maybank ATRKES (Reg. No.01-2004-00019) is a member of the Philippines Stock Exchange and is regulated by the Securities and Exchange Commission. Vietnam: Maybank Kim Eng Securities JSC (License Number: 71/UBCK-GP) is licensed under the State Securities Commission of Vietnam. Hong Kong: KESHK (Central Entity No AAD284) is regulated by the Securities and Futures Commission. India: Kim Eng Securities India Private Limited (“KESI”) is a participant of the National Stock Exchange of India Limited (Reg No: INF/INB 231452435) and the Bombay Stock Exchange (Reg. No. INF/INB 011452431) and is regulated by Securities and Exchange Board of India. KESI is also registered with SEBI as Category 1 Merchant Banker (Reg. No. INM 000011708) US: Maybank KESUSA is a member of/ and is authorized and regulated by the FINRA – Broker ID 27861. UK: Maybank KESL (Reg No 2377538) is authorized and regulated by the Financial Services Authority.
Disclosure of Interest Malaysia: MKE and its Representatives may from time to time have positions or be materially interested in the securities referred to herein and may further act as market maker or may have assumed an underwriting commitment or deal with such securities and may also perform or seek to perform investment banking services, advisory and other services for or relating to those companies.
Singapore: As of 18 February 2013, Maybank KERPL and the covering analyst do not have any interest in any companies recommended in this research report.
Thailand: MBKET may have a business relationship with or may possibly be an issuer of derivative warrants on the securities /companies mentioned in the research report. Therefore, Investors should exercise their own judgment before making any investment decisions. MBKET, its associates, directors, connected parties and/or employees may from time to time have interests and/or underwriting commitments in the securities mentioned in this report.
Hong Kong: KESHK may have financial interests in relation to an issuer or a new listing applicant referred to as defined by the requirements under Paragraph 16.5(a) of the Hong Kong Code of Conduct for Persons Licensed by or Registered with the Securities and Futures Commission.
As of 18 February 2013, KESHK and the authoring analyst do not have any interest in any companies recommended in this research report.
MKE may have, within the last three years, served as manager or co-manager of a public offering of securities for, or currently may make a primary market in issues of, any or all of the entities mentioned in this report or may be providing, or have provided within the previous 12 months, significant advice or investment services in relation to the investment concerned or a related investment and may receive compensation for the services provided from the companies covered in this report.
OTHERS Analyst Certification of Independence
The views expressed in this research report accurately reflect the analyst’s personal views about any and all of the subject securities or issuers; and no part of the research analyst’s compensation was, is or will be, directly or indirectly, related to the specific recommendations or views expressed in the report.
Reminder
Structured securities are complex instruments, typically involve a high degree of risk and are intended for sale only to sophisticated investors who are capable of understanding and assuming the risks involved. The market value of any structured security may be affected by changes in economic, financial and political factors (including, but not limited to, spot and forward interest and exchange rates), time to maturity, market conditions and volatility and the credit quality of any issuer or reference issuer. Any investor interested in purchasing a structured product should conduct its own analysis of the product and consult with its own professional advisers as to the risks involved in making such a purchase.
No part of this material may be copied, photocopied or duplicated in any form by any means or redistributed without the prior consent of MKE.
Definition of Ratings
Maybank Kim Eng Research uses the following rating system:
BUY Return is expected to be above 10% in the next 12 months (excluding dividends)
HOLD Return is expected to be between - 10% to +10% in the next 12 months (excluding dividends)
SELL Return is expected to be below -10% in the next 12 months (excluding dividends)
Applicability of Ratings
The respective analyst maintains a coverage universe of stocks, the list of which may be adjusted according to needs. Investment ratings are only applicable to the stocks which form part of the coverage universe. Reports on companies which are not part of the coverage do not carry investment ratings as we do not actively follow developments in these companies.
Some common terms abbreviated in this report (where they appear):
Adex = Advertising Expenditure FCF = Free Cashflow PE = Price Earnings BV = Book Value FV = Fair Value PEG = PE Ratio To Growth CAGR = Compounded Annual Growth Rate FY = Financial Year PER = PE Ratio Capex = Capital Expenditure FYE = Financial Year End QoQ = Quarter-On-Quarter CY = Calendar Year MoM = Month-On-Month ROA = Return On Asset DCF = Discounted Cashflow NAV = Net Asset Value ROE = Return On Equity DPS = Dividend Per Share NTA = Net Tangible Asset ROSF = Return On Shareholders’ Funds EBIT = Earnings Before Interest And Tax P = Price WACC = Weighted Average Cost Of Capital EBITDA = EBIT, Depreciation And Amortisation P.A. = Per Annum YoY = Year-On-Year EPS = Earnings Per Share PAT = Profit After Tax YTD = Year-To-Date EV = Enterprise Value PBT = Profit Before Tax
18 February 2013 Page 37 of 37
Samsonite International S.A.
Malaysia Maybank Investment Bank Berhad (A Participating Organisation of Bursa Malaysia Securities Berhad) 33rd Floor, Menara Maybank, 100 Jalan Tun Perak, 50050 Kuala Lumpur Tel: (603) 2059 1888; Fax: (603) 2078 4194
Singapore Maybank Kim Eng Securities Pte Ltd Maybank Kim Eng Research Pte Ltd 9 Temasek Boulevard #39-00 Suntec Tower 2 Singapore 038989 Tel: (65) 6336 9090 Fax: (65) 6339 6003
London Maybank Kim Eng Securities (London) Ltd 6/F, 20 St. Dunstan’s Hill London EC3R 8HY, UK Tel: (44) 20 7621 9298 Dealers’ Tel: (44) 20 7626 2828 Fax: (44) 20 7283 6674
New York Maybank Kim Eng Securities USA Inc 777 Third Avenue, 21st Floor New York, NY 10017, U.S.A. Tel: (212) 688 8886 Fax: (212) 688 3500
Stockbroking Business: Level 8, Tower C, Dataran Maybank, No.1, Jalan Maarof 59000 Kuala Lumpur Tel: (603) 2297 8888 Fax: (603) 2282 5136
Hong Kong Kim Eng Securities (HK) Ltd Level 30, Three Pacific Place, 1 Queen’s Road East, Hong Kong Tel: (852) 2268 0800 Fax: (852) 2877 0104
Indonesia PT Kim Eng Securities Plaza Bapindo Citibank Tower 17th Floor Jl Jend. Sudirman Kav. 54-55 Jakarta 12190, Indonesia
Tel: (62) 21 2557 1188 Fax: (62) 21 2557 1189
India Kim Eng Securities India Pvt Ltd 2nd Floor, The International 16, Maharishi Karve Road, Churchgate Station, Mumbai City - 400 020, India Tel: (91).22.6623.2600 Fax: (91).22.6623.2604
Philippines Maybank ATR Kim Eng Securities Inc. 17/F, Tower One & Exchange Plaza Ayala Triangle, Ayala Avenue Makati City, Philippines 1200 Tel: (63) 2 849 8888 Fax: (63) 2 848 5738
Thailand Maybank Kim Eng Securities (Thailand) Public Company Limited 999/9 The Offices at Central World, 20th - 21st Floor, Rama 1 Road Pathumwan, Bangkok 10330, Thailand Tel: (66) 2 658 6817 (sales) Tel: (66) 2 658 6801 (research)
Vietnam In association with
Maybank Kim Eng Securities JSC 1st Floor, 255 Tran Hung Dao St. District 1 Ho Chi Minh City, Vietnam Tel : (84) 844 555 888 Fax : (84) 838 38 66 39
Saudi Arabia In association with
Anfaal Capital Villa 47, Tujjar Jeddah Prince Mohammed bin Abdulaziz Street P.O. Box 126575 Jeddah 21352 Tel: (966) 2 6068686 Fax: (966) 26068787
South Asia Sales Trading Kevin FOY [email protected] Tel: (65) 6336-5157 US Toll Free: 1-866-406-7447
North Asia Sales Trading Eddie LAU [email protected] Tel: (852) 2268 0800 US Toll Free: 1 866 598 2267
www.maybank-ke.com | www.maybank-keresearch.com | www.kimeng.com.hk