home sweet home - banking and financial services company
TRANSCRIPT

Investment Solutions & Products Swiss Economics
Home Sweet Home Swiss Real Estate Market 2021 | March 2021
Owner-occupied housing Home working boosts demand on urban periphery
Page 9
Digital real estate Internet of Things changes office use
Page 36
Sustainable real estate No sustainability without transparency
Page 53

2 Swiss Real Estate Market 2021 | March 2021
Imprint
Publisher: Credit Suisse AG, Investment Solutions & Products Nannette Hechler-Fayd’herbe Head of Global Economics & Research +41 44 333 17 06 nannette.hechler-fayd’[email protected] Fredy Hasenmaile Head Real Estate Economics +41 44 333 89 17 [email protected] Cover picture Building: Im Guss, Bülach. Living should feel good. Attractive residential property and commercial premises on Zurich’s doorstep. Building owner: A real estate fund of Credit Suisse Asset Management Printing FO-Fotorotar, Gewerbestrasse 18, 8132 Egg bei Zürich Copy deadline February 4, 2021 Publication series Swiss Issues Immobilien Orders Directly from your relationship manager, from any branch of Credit Suisse. Electronic copies via www.credit-suisse.com/realestatestudy. Internal orders via MyShop quoting Mat. No. 1511454. Subscriptions quoting publicode ISE (HOST: WR10). Visit our website at www.credit-suisse.com/realestatestudy Copyright The publication may be quoted providing the source is indicated. Copyright © 2021 Credit Suisse Group AG and/or affiliated companies. All rights reserved. References Unless otherwise specified, the source of all quoted information is Credit Suisse.
Authors
Fredy Hasenmaile, +41 44 333 89 17, [email protected] Alexander Lohse, +41 44 333 73 14, [email protected] Thomas Rieder, +41 44 332 09 72, [email protected] Dr. Fabian Waltert, +41 44 333 25 57, [email protected] Andreas Wiencke
Contribution
Fabian Diergardt Thomas Mendelin Andy Egger (Realmatch360) Alexis Leibbrandt (Akenza) Patrick Schirmer (UrbanDataLab)

Swiss Real Estate Market 2021 | March 2021 3
Content
Management Summary 4
Owner-occupied housing 7 Demand: The elusive ownership dream 7
Demand: Home working boosts demand on urban periphery 9
Supply: Existing stock dominates supply due to low newbuild activity 11
Market outcome: Prices keep rising 13
Outlook 2021: Scarcity of property for sale 15
Digital real estate: Digitalization as decoder of demand 16
Rental apartments 19 Demand: Demand extremely robust 19
Supply: Construction peak passed 21
Market outcome: Calming in the centers 22
Outlook 2021: Consequences of COVID manageable 25
Digital real estate: Rethinking micro-location 26
Office property 30 Demand: Demand being recalibrated 30
Demand: Central premises in demand 31
Supply: Supply of space remains high 32
Supply: Too much space in the pipeline 33
Market outcome: Center-periphery divide widens 34
Outlook 2021: Demand applies the brakes 35
Digital Real Estate: IoT changes office use 36
Retail property: A bad start to the year for retail 39
Logistics real estate: Real estate segment of the hour 44
Real estate investments 48 Direct investments: Limited COVID losses 48
Indirect investments: Residential property: false sense of security? 50
Outlook 2021: Low interest rates make real estate a coveted asset 52
Sustainable real estate : No sustainability without transparency 53
Factsheets: Regional real estate markets at a glance 57
4 Swiss Real Estate Market 2021 | March 2021
Management Summary
Home sweet home COVID-19 may have triggered a great deal of uncertainty, but it has also brought certainty in one respect: Increases in interest rates are still a long way off. This consideration, combined with rapid and targeted government support measures, has ensured that real estate values have held up well in the crisis. Residential property in particular has proven to be a crisis-resistant investment, further cementing its status as a rock-solid investment. But beyond this, the coronavirus pandemic has provided clarity with respect to something else too: Digitalization is a strategic necessity for those who do not want to be left behind. We illustrate the added value that digital technologies can bring to the real estate industry using three examples. The elusive dream of home ownership Lockdowns and enforced home working have increased the significance of an attractive and com-fortable home, as well as stimulating the ownership drive. This desire has been further strength-ened by the extension of the low-interest phase. But the longing for residential property does not fit with the picture on the supply side, which is characterized by a decline in the construction of owner-occupied housing dating back years. The indications of scarcity are now clear for all to see. Within the last 12 months, prices have surged again – from what were already very high levels. As a result, an increasingly small number of households can now fulfill the high financing require-ments imposed by the regulator. This in turn means that a greater amount of equity is essential, which is why households seek recourse to their pension assets. But as is evident simply from the declining number of advance withdrawals to finance property acquisition, the dream of owning one’s own four walls is becoming increasingly elusive for many households. Many prospective homebuyers are focusing their search on peripheral regions where residential property is more af-fordable – particularly as the greater opportunity for working at home in the future makes longer commuting times bearable. However, the strong price growth is also likely to increase market risks further. Property owners can counteract this risk effectively if they consistently use the savings they are making as a result of low interest rates to repay the loan capital. Data analytics – digitalization as decoder of demand Lots of information has long been available on housing supply, but demand has remained largely in the shadows. For decades, demand preferences were mostly only measurable indirectly, such as via vacancy data. However, the digitalization of all walks of life is opening up opportunities, and allowing key information to be more easily compiled and evaluated. The best example of this are the search registrations on property websites, where prospective buyers have to enter their prefer-ences. Realmatch360 was the first company to identify the value of this information for the real estate market. However, smart algorithms are required if missing, duplicate, and misleading infor-mation is to be stripped out of this data. The COVID-19 pandemic has shown how important it is to access data as rapidly as possible when evaluating a situation. Thanks to the valuable assess-ment of search profiles, data-based statements can be promptly made as to whether (and how) the coronavirus crisis has changed demand for housing. For example, there has been an increase in searches for condominiums and houses to buy, and fewer for rental apartments. Moreover, de-mand is increasingly focused on medium-sized and large homes, as well as on homes with outside space. Demand remarkably robust thanks to “safe haven” effect The much-feared slump in immigration as a result of the coronavirus crisis never came to pass. Indeed, net immigration in 2020 was actually much higher than the previous year, as the rate of emigration slumped more strongly than immigration. Faced with less attractive labor market situa-tions in their native countries, many foreigners elected to remain in the safe haven of Switzerland. We are expecting net immigration to prove robust this year too, albeit not at the level of last year. In addition to this effect, the ever-higher hurdles that have to be overcome to purchase residential property should support demand for rental accommodation, which is why we are expecting only a modest decline in demand, despite the pandemic. Any weakening can be expected to make itself felt in the large urban centers as well, particularly as the pandemic is weakening not only immigra-tion but also the pull of city centers. The flexibilization of working time and location brings less
Owner-occupied housing Page 7
Digital real estate Page 16
Rental apartments Page 19

Swiss Real Estate Market 2021 | March 2021 5
central, cheaper locations into consideration as residential alternatives. Although this will not re-verse the urbanization trend, it should weaken it somewhat. On the supply side, rental apartment construction has now clearly passed its peak, and construction activity is losing momentum. That said, the rate of construction is still too high, which means vacancies are likely to continue to rise, with the corresponding downward pressure on rents. Data analytics – rethinking micro-location Location is a criterion of the utmost importance in the real estate industry. Accordingly, the im-portance of evaluating this aspect objectively can hardly be overstated, as it has a key impact on real estate valuations, portfolio strategies, and the success of real estate projects. However, as-sessing the quality of a location is anything but child’s play. Although user-specific locational rat-ings are theoretically useful, they often fall down in practice due to the lack of available data or analysis instruments. New technologies, which among other things focus on information on the morphology of buildings, are trying to plug this gap. Morphological criteria such as building form, exposure, size, and interconnectedness, as well as new analysis techniques such as machine learning and artificial intelligence, make it possible to capture the multifaceted nature of user pref-erences, thereby significantly improving the evaluation of locational quality for a variety of uses. Demand being recalibrated Demand for office space remains very weak, as companies are holding back from renting new premises and reviewing the extent to which they can make long-term savings on office space through home working. In the medium term, the importance of the office as a place of work is likely to rise again, however, as the high levels of productivity initially observed in home working are likely to fall back in time due to a lack of social control and insufficient communication. In addi-tion, productivity is also likely to be impaired by lower innovation output on the part of a home-based workforce, which should focus attention once again on the value of centralized working. Even before the second wave of infection, there was evidence of a slow but steady stream of workers returning to the office. The remaining demand is focused heavily on central locations, which fare better not just from the perspective of accessibility, but also as a complement to home working. Since supply rates have remained at high levels in recent years despite a strong econ-omy, we are anticipating a continuation of the latent oversupply, particularly at more peripheral lo-cations. As a result, vacancies should rise and rents should fall outside of inner-city locations. As such, the already striking divide in respect of supply, vacancies, and rental prices between the centers and the peripheries of Switzerland’s office property markets is likely to widen further over the next few years. Internet of Things changes office use Changed forms of working as well as more flexible workplaces and working times pose new chal-lenges to the world of office property. New technologies based on the Internet of Things (IoT) are facilitating innovative solutions for the management of office buildings. The IoT essentially enables almost any physical or virtual object to be connected to, and communicate with, another object via a network. The IoT therefore goes a long way to meeting the new requirements made of office property in the form of a more efficient usage of space, better air quality, and superior services. In a similar way, IoT technologies facilitate the development of so-called “smart cities”. Building an IoT solution is a complex undertaking, however. A whole array of different sensors, e.g. for meas-uring occupancy, need to be connected with one another using various linking technologies so that all sensor data can be managed at a central location – such as a public or private cloud – on an ongoing basis, before then being enriched with additional information and ultimately analyzed. In this way, meeting rooms and collaborative working areas can be used efficiently and conven-iently thanks to real-time information on occupancy and quality, for example. A bad start to the year for retail The stationary retail trade has endured a very bad start to the year. The renewed closure of non-essential stores is likely to entail a serious slump in sales for the non-food trade. In what was a topsy-turvy year, bricks-and-mortar retailers emerged from 2020 fairly well with a modest sales increase, but this overall result conceals a number of significant differences. Rarely, if ever, can the results of different retailers have diverged as dramatically as they did last year. COVID-19 is driving this disparity, creating clear winners and losers in this sector too. The biggest beneficiary has been food retailing, which had no competition from restaurants or canteens for a significant period due to lockdown. The winners also include omni-channel providers, whose losses in the stationary trade can be at least partly offset by disproportionate growth in the online business. The retail trade benefited from shifts in consumer spending last year due to restrictions on leisure ac-tivities and cross-border shopping. But this is a deceptive advantage: Any benefit gained is likely
Digital real estate Page 26
Office property Page 30
Digital real estate Page 36
Retail property Page 39
6 Swiss Real Estate Market 2021 | March 2021
to evaporate again once the pandemic has been mastered. What’s more, a significant proportion of the sales that migrated to the online channel is likely to be lost to the stationary trade forever. Last but not least, our model calculations flag up a lasting decline in pedestrian frequencies (15% to 20%) as a result of the greater proportion of employees working from home in the future – which will affect stores that benefit from spontaneous purchases in particular. Real estate segment of the hour In a world where everything can be ordered at the click of a mouse, logistics services have be-come a key factor for manufacturers and retailers. COVID-19 has accelerated this development, and the need for logistics space has grown as a result. Switzerland has a shortage of modern warehousing as well as distribution and transportation centers, as many existing buildings have be-come outdated. In addition, new development projects are encountering resistance almost every-where, and proceeding only slowly. With suitable sites being in short supply, prices have risen ac-cordingly. Only rental prices – unlike in other countries – have yet to rise in Switzerland. The com-bination of scarcity of supply and a healthy long-term demand picture nonetheless makes logistics real estate an interesting diversification option for investors looking to benefit from low correlations with other real estate segments, as well as high yield premiums. Low interest rates make real estate a coveted asset Bearing in mind the dislocations triggered by the coronavirus pandemic, the rental income losses in the portfolios of Swiss real estate funds and real estate investment companies have been toler-able, and limited to low single-digit percentages. But the consequences of COVID-19 will prove challenging for the real estate market for quite some time, as they are triggering structural changes in demand. The pandemic has accelerated developments that were previously only patchy. Specifically, the office and retail property markets are experiencing a trend of increasing oversupply as companies look to reduce their space requirements. The general pessimism over the traditional real estate segments of office and retail is something we share, at least where the latter is concerned. In the world of office property, however, we see reason for a more optimistic assessment once an end to the pandemic is within reach. Here investors are likely to attach all the more importance to locational quality. Furthermore, some niche strategies are likely to be suc-cessful, as smaller sectors such as logistics real estate and student accommodation are supported by powerful trends. Residential investment property: false sense of security? The long-term demand for residential property has been comparatively little affected by the coro-navirus crisis. The rental market, by contrast, has been on a downward trajectory for years, as evi-denced by rising oversupply tendencies and downward pressure on rents. Vacancy-related rental income losses are therefore on the rise generally. Striking discrepancies in premiums and rental income losses point to major differences between the various market funds in respect of portfolio quality, diversification, and vacancy management. We see virtually no potential for further in-creases in value in residential real estate funds at the moment. As economic recovery gains mo-mentum as the year progresses, demand is likely to increasingly shift to cyclical sectors, which means real estate shares and commercial real estate funds could benefit. No sustainability without transparency For wide swathes of the population, the COVID-19 pandemic has pushed climate concerns into the background only temporarily. The need for a more proactive response to climate crisis is now firmly lodged in the minds of broad swathes of the population, and this shift in attitude is increas-ingly reflected in the behavior of investors. Where sustainable real estate investments are con-cerned, investors expect greater transparency, as only this can engender trust. One of the great-est problems for sustainability is that sustainable goods or services are typically not identifiable as such from the outside. In the world of real estate, the initial focus therefore lay on building labels, which resulted in a rising transparency to at least a certain degree. Benchmarking comparisons at an international level have strengthened this trend. Ultimately however, there can be no alternative to systematic measurements at individual property level, particularly where the consumption of en-ergy and emission of greenhouse gases is concerned. This is the only way of obtaining the infor-mation needed to continue bringing down consumption figures in a lasting way. Nor is it just regu-latory pressure that can be expected to remain high over the coming years – competitive pressure will also remain intense, particularly as an increasing number of market participants are becoming aware of the advantages of a sustainable approach.
Logistics real estate Page 44
Direct real estate investments Page 48
Indirect real estate investments Page 50
Sustainable real estate Page 53

Swiss Real Estate Market 2021 | March 2021 7
Owner-occupied housing – demand
The elusive ownership dream Those wanting to purchase their own home in Switzerland are finding “imputed affordability” an increasingly formidable hurdle. However, higher equity – such as through advance withdrawals of pension assets – can reduce the affordability problem. The strong price rises of the last two decades are putting property ownership out of reach for an increasing number of Swiss households. The big challenge is “imputed affordability” as dictated by regulatory requirements, under which the financing of residential property must be calculated with a conservative long-term interest rate rather than the very low mortgage interest rates currently available. By contrast, actual affordability continues to pose no problem at all (Fig. 6, page 9). For an average-income household, only 34% of the properties advertised across Switzerland with four or more rooms are affordable based on an imputed interest rate of 5% and 80% debt financ-ing (Fig. 1). At 42%, condominiums (CDM) fare better than single-family homes (SFH) at 26%. By way of comparison, at the end of 2008, 65% of advertised condominiums and 43% of single-family homes were affordable for an average-income household. The development illustrated in Figure 1 shows the recent intensification of the problem only partly, however. The sideways movement in the proportion of affordable properties in recent years cannot be attributed to an unchanging price level. It is more likely to be a case of increasingly older and thus cheaper (as well as less well-located) properties being advertised. It should be borne in mind that newbuilds are not included in the calculation. Newbuilds, which are typically more expensive, are usually not advertised or only in summary form (development cluster advertisements), which is why no evaluation is possible here. In other words, the magnitude of the affordability problem is even being underestimated. In the cantons of Zurich and Zug, in the Lake Geneva region, and in the areas around Basel and Lucerne, almost no properties are affordable for average-income households requiring an 80% mortgage. The proportion of affordable properties in the Glattal region close to Zurich stands at 7.8%, for example. The situation is similarly bleak for prospective buyers in the Nyon region on Lake Geneva (3.7%), and in the lower Basel region (13.7%). By contrast, more options open up in the Mittelland region: For example, 40.3% of all advertised properties are affordable for an av-erage-income household in the Aarau region, a figure that rises to as high as 62.2% in the Olten region.
Imputed affordability as major hurdle
Two out of every three properties no longer affordable
Newbuilds now particularly unaffordable
Central locations too pricey
Fig. 1: Only a third of residential property still affordable Fig. 2: Residential property close to urban centers barely affordable
Proportion of affordable advertised properties with four or more rooms for an aver-age-income household
Proportion of affordable advertised properties (CDM and SFH) with four or more rooms for an average-income household
Source: Credit Suisse, Meta-Sys Last data point: Q4/2020 Source: Credit Suisse, Meta-Sys, Geostat Last data point: Q4/2020
0%
10%
20%
30%
40%
50%
60%
70%
2006 2008 2010 2012 2014 2016 2018 2020
All owner-occupied housingCDMSFH
Proportion of affordable properties> 70%60 – 70%50 – 60%40 – 50%30 – 40%20 – 30%10 – 20%< 10%
8 Swiss Real Estate Market 2021 | March 2021
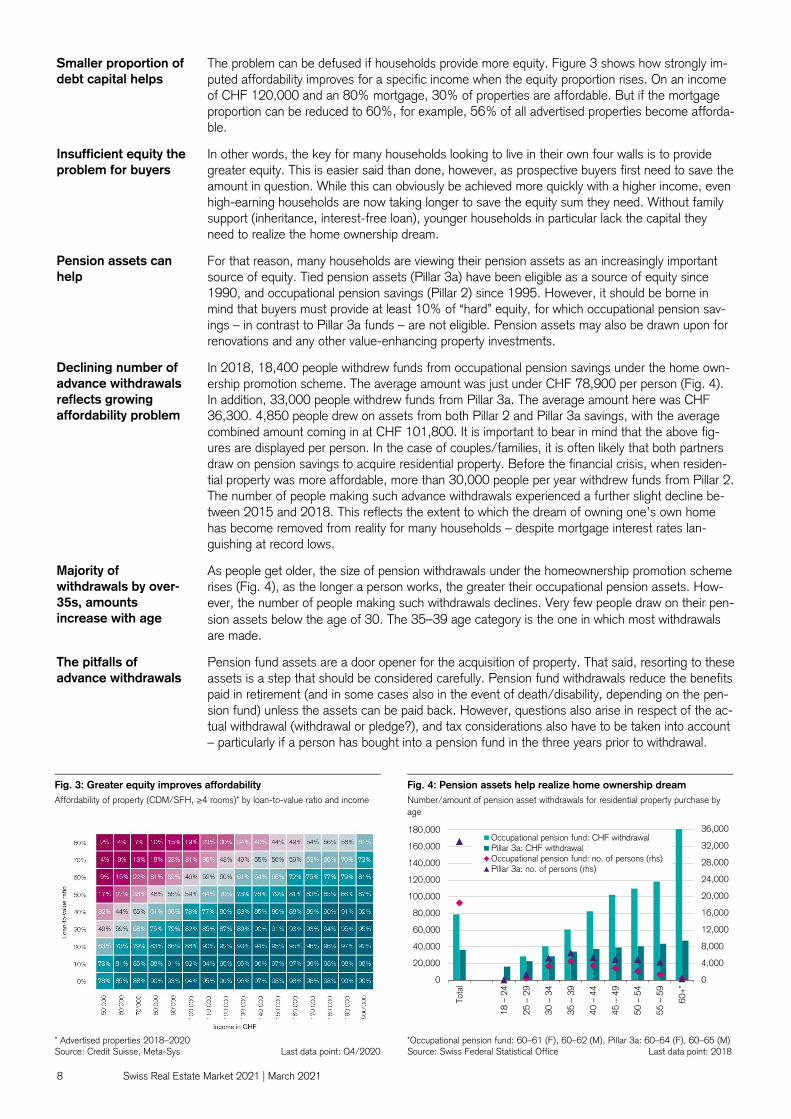
The problem can be defused if households provide more equity. Figure 3 shows how strongly im-puted affordability improves for a specific income when the equity proportion rises. On an income of CHF 120,000 and an 80% mortgage, 30% of properties are affordable. But if the mortgage proportion can be reduced to 60%, for example, 56% of all advertised properties become afforda-ble. In other words, the key for many households looking to live in their own four walls is to provide greater equity. This is easier said than done, however, as prospective buyers first need to save the amount in question. While this can obviously be achieved more quickly with a higher income, even high-earning households are now taking longer to save the equity sum they need. Without family support (inheritance, interest-free loan), younger households in particular lack the capital they need to realize the home ownership dream. For that reason, many households are viewing their pension assets as an increasingly important source of equity. Tied pension assets (Pillar 3a) have been eligible as a source of equity since 1990, and occupational pension savings (Pillar 2) since 1995. However, it should be borne in mind that buyers must provide at least 10% of “hard” equity, for which occupational pension sav-ings – in contrast to Pillar 3a funds – are not eligible. Pension assets may also be drawn upon for renovations and any other value-enhancing property investments. In 2018, 18,400 people withdrew funds from occupational pension savings under the home own-ership promotion scheme. The average amount was just under CHF 78,900 per person (Fig. 4). In addition, 33,000 people withdrew funds from Pillar 3a. The average amount here was CHF 36,300. 4,850 people drew on assets from both Pillar 2 and Pillar 3a savings, with the average combined amount coming in at CHF 101,800. It is important to bear in mind that the above fig-ures are displayed per person. In the case of couples/families, it is often likely that both partners draw on pension savings to acquire residential property. Before the financial crisis, when residen-tial property was more affordable, more than 30,000 people per year withdrew funds from Pillar 2. The number of people making such advance withdrawals experienced a further slight decline be-tween 2015 and 2018. This reflects the extent to which the dream of owning one’s own home has become removed from reality for many households – despite mortgage interest rates lan-guishing at record lows. As people get older, the size of pension withdrawals under the homeownership promotion scheme rises (Fig. 4), as the longer a person works, the greater their occupational pension assets. How-ever, the number of people making such withdrawals declines. Very few people draw on their pen-sion assets below the age of 30. The 35–39 age category is the one in which most withdrawals are made. Pension fund assets are a door opener for the acquisition of property. That said, resorting to these assets is a step that should be considered carefully. Pension fund withdrawals reduce the benefits paid in retirement (and in some cases also in the event of death/disability, depending on the pen-sion fund) unless the assets can be paid back. However, questions also arise in respect of the ac-tual withdrawal (withdrawal or pledge?), and tax considerations also have to be taken into account – particularly if a person has bought into a pension fund in the three years prior to withdrawal.
Smaller proportion of debt capital helps
Insufficient equity the problem for buyers
Pension assets can help
Declining number of advance withdrawals reflects growing affordability problem
Majority of withdrawals by over-35s, amounts increase with age
The pitfalls of advance withdrawals
Fig. 3: Greater equity improves affordability Fig. 4: Pension assets help realize home ownership dream Affordability of property (CDM/SFH, ≥4 rooms)* by loan-to-value ratio and income Number/amount of pension asset withdrawals for residential property purchase by
age
* Advertised properties 2018–2020 Source: Credit Suisse, Meta-Sys Last data point: Q4/2020
*Occupational pension fund: 60–61 (F), 60–62 (M), Pillar 3a: 60–64 (F), 60–65 (M) Source: Swiss Federal Statistical Office Last data point: 2018
0
4,000
8,000
12,000
16,000
20,000
24,000
28,000
32,000
36,000
0
20,000
40,000
60,000
80,000
100,000
120,000
140,000
160,000
180,000
Tota
l
18 –
24
25 –
29
30 –
34
35 –
39
40 –
44
45 –
49
50 –
54
55 –
59
60+
*
Occupational pension fund: CHF withdrawalPillar 3a: CHF withdrawalOccupational pension fund: no. of persons (rhs)Pillar 3a: no. of persons (rhs)

Swiss Real Estate Market 2021 | March 2021 9
Owner-occupied housing – demand
Home working boosts demand on urban periphery
Demand for residential property ownership has remained strong, despite COVID-19. One reason is likely to be the rise in status of the home in the wake of the pandemic. In addition, a greater acceptance of flexible working is increasing the relative appeal of property on the urban periphery. COVID-19 has not slowed demand for residential property. Quite the reverse – over the course of the last year, the desire of the Swiss to own their own four walls has risen to new levels. The de-mand indices produced by Realmatch360, which evaluate online search registrations for residen-tial property, rose sharply in the aftermath of the first lockdown, suggesting record-high interest in condominiums and single-family homes in the second half of 2020 (Fig. 5). COVID-19 had only a very brief negative impact on the search activity of would-be homeowners in the spring of last year (Fig. 5). Once the initial shock had been overcome, interest returned with a vengeance. Such a spike was hardly to be expected, as deep recessions and rising unemployment typically throttle demand for residential property. This time, however, a different reaction was triggered by the rapid measures taken by the political establishment and knowledge of the finite nature of the pandemic. In addition, the crisis greatly increased the significance of the home and its qualities. Housing is therefore being accorded as high a priority as ever. This has prompted many people to continue to pursue – or even accelerate – their goal of home ownership. However, the home ownership drive would be nothing like as strong as it is right now without mortgage interest rates still languishing at ultra-low levels. Mortgage interest costs for existing homeowners declined once again this year by CHF 238, and now stand at a new low of CHF 4,684 (Fig. 6). Annual mortgage interest costs are now some CHF 5,279 lower than in 2008, a fall of 53%. Low mortgage interest rates translate into very low actual affordability costs for new homebuyers. These currently stand at 15.1% of average household income for a new condominium and 21.8% for a new single-family home (Fig. 6; assuming an 80% mortgage). These figures also include maintenance and mortgage amortization costs. Accordingly, the acquisition of residential property remains attractive from a financial perspective.
Demand un-impressed by pandemic
COVID-19 slowed demand only briefly
Pandemic increases standing of the home
Low interest rates remain key driver of demand
Actual affordability remains very much intact
Fig. 5: Surge in demand since the first lockdown Fig. 6: Actual affordability remains no problem Residential property demand indices, February 2014 = 100 Affordability for average household as % of income (assumptions: newbuild, 1%
maintenance, 80% loan-to-value, amortization on 2/3 within 15 years)
Source: Realmatch360 Last data point: 12/2020 Source: Credit Suisse, BWO, SNB Last data point: 2020
80
90
100
110
120
130
140
150
160
2014 2015 2016 2017 2018 2019 2020
SFH CDM
SFH average 2014 – 2020 CDM average 2014 – 2020
0
2,500
5,000
7,500
10,000
12,500
0%
10%
20%
30%
40%
50%
2008 2010 2012 2014 2016 2018 2020
Mortgage costs per residential property CDM: actualSFH: actual CDM: imputed (5% interest)SFH: imputed (5% interest)

10 Swiss Real Estate Market 2021 | March 2021
The COVID-19 crisis has further prolonged the negative interest phase. We are not expecting the Swiss National Bank to raise key interest rates until the end of 2022 at the earliest. The actual costs of financing property ownership will therefore remain low. As an additional factor, the eco-nomic situation can be expected to improve this year. Demand for residential property will there-fore remain strong in 2021. However, it will be held back by rising capital requirements and the high regulatory affordability hurdles. Home working increases appeal of residential property on urban periphery Due to the high levels of real estate prices in or close to urban centers, home buyers on average have to accept longer commutes than tenants. But the trend toward home working is having the effect of extending the commuting times buyers are prepared to accept, because the less fre-quently a worker has to commute, the greater the distance they see as tolerable. This in turn wid-ens the search radius of households thinking of acquiring residential property. We have illustrated this for Zurich, assuming that a property owner employed in Zurich has a com-mute of 48 minutes at each end of the working day. If he or she spends one day a week working from home, the commute could therefore increase to 60 minutes without changing the total weekly commuting time (Fig. 7). And if the employee in question manages to work from home two days a week, the total weekly travel time could be kept unchanged with an 80-minute daily com-mute. Of course, many workers do not want to “invest” the total time savings gained from home working in a longer commute. But even if they are prepared to forgo half of the time saved, the commute described above could be extended to 54 or 64 minutes respectively (Fig. 7). Figure 8 shows the extent to which the geographical scope of possible residential areas increases as a result. Here we assume that 15 minutes of the commute is within the city of Zurich itself. With a greater search radius, the number of residential properties advertised on a quarterly basis likewise in-creases – by as much as 43% in the case of a 6-minute extension to the commute. Thanks to the rising trend of home working, more peripheral locations with lower real estate prices are increasingly falling within the search radius of possible residential locations. As long as cen-trally-located residential property remains expensive and in short supply, this will have the effect of shifting some demand for residential property away from the centers to these peripheral, still com-paratively affordable regions. Indeed, it is only through this expansion of the potential residential perimeter that the dream of home ownership can become achievable again for some renting households. It is not only on the urban periphery that the demand for home ownership has increased. Many tourist regions in the mountains have also been attracting greater interest. This phenomenon is the result of a resurgence in demand for vacation homes. Flexible working increases the amount of time a vacation home can be used. And cross-border travel restrictions of the kind that were re-peatedly imposed in 2020 have strengthened the preference for vacation homes in Switzerland.
Demand to remain robust in 2021
Home working trend changes structure of demand
Longer but less frequent commuting
Search radius expanding around urban centers
Greater demand for property on urban periphery
Interest in vacation homes rises too
Fig. 7: Home working should mean less frequent but longer com-mutes
Fig. 8: Expansion of residential location scope in “50% saving” sce-nario
Commuting time per journey based on number of days working at home
Residential location scope for Zurich commuters by proportion of home working if 50% of commuting time saved is invested (in brackets: driving time at 07:00)
Source: Credit Suisse Last data point: 2020 Source: Credit Suisse, HERE, Geostat Last data point: 2020
0
50
100
150
200
250
0 days 1 day 2 days 3 days 4 days
Com
mut
ing
time
per j
ourn
ey (i
n m
in)
No. of days working at home
Scenario "Weekly commuting time remains the same overall"Scenario "50% of the time gained is saved"Current average commuting time of homeowners working in Zurich

Swiss Real Estate Market 2021 | March 2021 11
Owner-occupied housing – supply
Existing stock dominates supply due to low newbuild activity
Newbuild activity in the owner-occupied housing segment continues to decline, and there is no end to this trend in sight. Supply is therefore increasingly dominated by existing stock. A contributory factor here is demographics – a growing number of older buildings are coming back onto the market, particularly as a growing number of baby boomers are selling up. Newbuild activity in the owner-occupied housing segment declined once again in 2020. According to our estimates, the net addition over the last year amounted to just 12,500 condominiums and 6,200 single-family homes. This represents a year-on-year decline of 10.8% and 10.6% respec-tively. When measured against existing stock, the increase in the number of condominiums amounts to a still healthy 1.1%. By contrast, the increase in single-family homes stood at just 0.6%. There is no indication that this trend is set to change in the coming year. The volume of building permits and planning applications would appear to confirm this: The former have recorded a fur-ther decline of 2.9% over the last year for condominiums, and a decline of 0.8% for single-family homes (Fig. 9). Where planning applications are concerned, the declines come in at 10.0% for condominiums and 3.2% for single-family homes. The reason for the persistent decline in production remains unchanged: The negative interest envi-ronment continues to favor the construction of rental apartments. Although projected activity in the rental apartment segment is currently in decline, this has not sparked any rise in owner-occupied housing production. The only striking aspect is that – for reasons of diversification – investors are increasingly planning hybrid projects involving both owner-occupied and rental accommodation. These account for around a quarter of all approved apartments in multi-family dwelling projects, which are for the most part large-scale undertakings. Construction activity remains concentrated in peripheral locations. In 2020, 54.9% of all condo-minium approvals involved projects outside the large and mid-sized centers and their wider urban agglomerations. However, this is also the lowest figure since 2010 and well below the prior-year level, when 63.8% of all planning related to peripheral sites. This shift in condominium production toward urban centers is likely to be the result of hybrid projects. At 73.9%, by contrast, building permit issuance for single-family homes remains clearly focused on peripheral locations.
Production of residential property declines once more
No trend reversal in sight
More hybrid projects involving both owner-occupied and rental accommodation
Condominiums being built near urban centers once again
Fig. 9: Fewer owner-occupied newbuilds in 2021 too Fig. 10: 31 regions exhibit rise in construction activity Planning applications and building permits in number of residential units, moving 12-month total
Planned expansion of residential property 2021, as % of housing stock
Source: Baublatt, Credit Suisse Last data point: 11/2020 Source: Baublatt, Credit Suisse, Geostat Last data point: 11/2020
0
5,000
10,000
15,000
20,000
25,000
2002 2004 2006 2008 2010 2012 2014 2016 2018 2020
Applications SFH Applications CDMPermits SFH Permits CDMAverage value approvals SFH Average value approvals CDM
-10.0%
-2.9%
-3.2%-0.8%
Gro
wth
20
19 –
2020
Expected expansion> 1.75%1.50 – 1.75%1.25 – 1.50%1.00 – 1.25%0.75 – 1.00%0.50 – 0.75%0.25 – 0.50%< 0.25%
Year-on-year changeStrong riseSlight riseSideways movementSlight declineStrong decline
12 Swiss Real Estate Market 2021 | March 2021
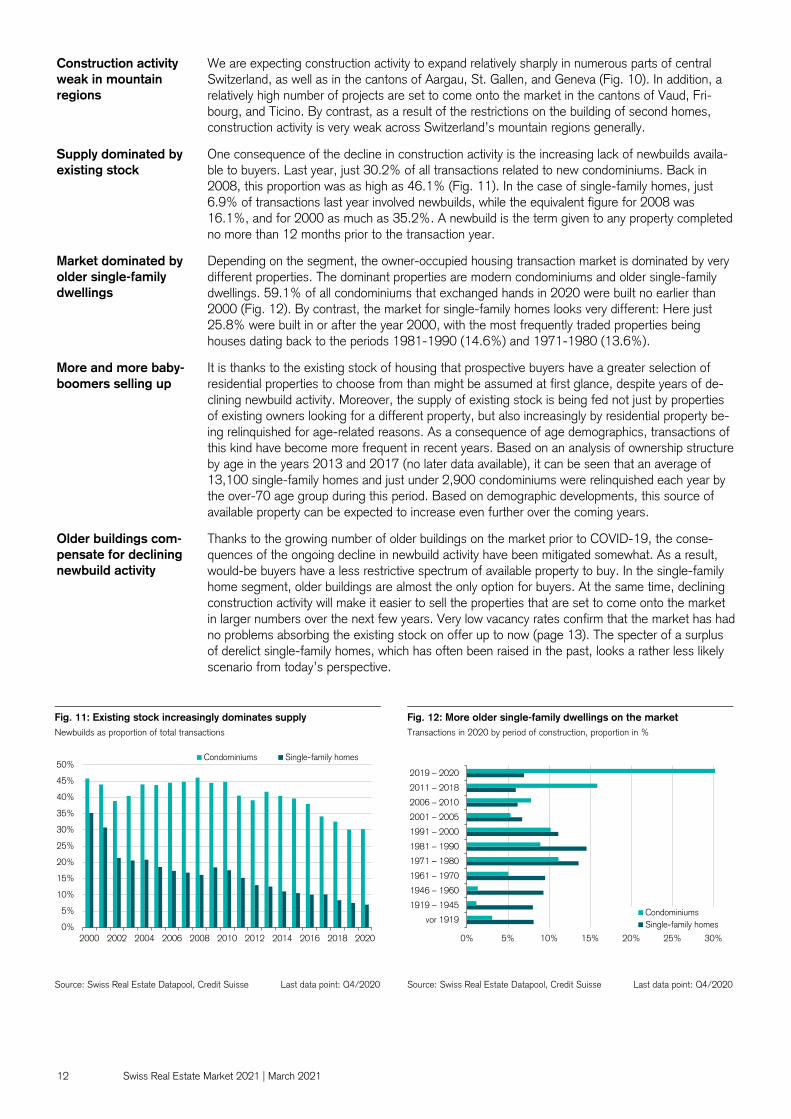
We are expecting construction activity to expand relatively sharply in numerous parts of central Switzerland, as well as in the cantons of Aargau, St. Gallen, and Geneva (Fig. 10). In addition, a relatively high number of projects are set to come onto the market in the cantons of Vaud, Fri-bourg, and Ticino. By contrast, as a result of the restrictions on the building of second homes, construction activity is very weak across Switzerland’s mountain regions generally. One consequence of the decline in construction activity is the increasing lack of newbuilds availa-ble to buyers. Last year, just 30.2% of all transactions related to new condominiums. Back in 2008, this proportion was as high as 46.1% (Fig. 11). In the case of single-family homes, just 6.9% of transactions last year involved newbuilds, while the equivalent figure for 2008 was 16.1%, and for 2000 as much as 35.2%. A newbuild is the term given to any property completed no more than 12 months prior to the transaction year. Depending on the segment, the owner-occupied housing transaction market is dominated by very different properties. The dominant properties are modern condominiums and older single-family dwellings. 59.1% of all condominiums that exchanged hands in 2020 were built no earlier than 2000 (Fig. 12). By contrast, the market for single-family homes looks very different: Here just 25.8% were built in or after the year 2000, with the most frequently traded properties being houses dating back to the periods 1981-1990 (14.6%) and 1971-1980 (13.6%). It is thanks to the existing stock of housing that prospective buyers have a greater selection of residential properties to choose from than might be assumed at first glance, despite years of de-clining newbuild activity. Moreover, the supply of existing stock is being fed not just by properties of existing owners looking for a different property, but also increasingly by residential property be-ing relinquished for age-related reasons. As a consequence of age demographics, transactions of this kind have become more frequent in recent years. Based on an analysis of ownership structure by age in the years 2013 and 2017 (no later data available), it can be seen that an average of 13,100 single-family homes and just under 2,900 condominiums were relinquished each year by the over-70 age group during this period. Based on demographic developments, this source of available property can be expected to increase even further over the coming years. Thanks to the growing number of older buildings on the market prior to COVID-19, the conse-quences of the ongoing decline in newbuild activity have been mitigated somewhat. As a result, would-be buyers have a less restrictive spectrum of available property to buy. In the single-family home segment, older buildings are almost the only option for buyers. At the same time, declining construction activity will make it easier to sell the properties that are set to come onto the market in larger numbers over the next few years. Very low vacancy rates confirm that the market has had no problems absorbing the existing stock on offer up to now (page 13). The specter of a surplus of derelict single-family homes, which has often been raised in the past, looks a rather less likely scenario from today’s perspective.
Construction activity weak in mountain regions
Supply dominated by existing stock
Market dominated by older single-family dwellings
More and more baby-boomers selling up
Older buildings com-pensate for declining newbuild activity
Fig. 11: Existing stock increasingly dominates supply Fig. 12: More older single-family dwellings on the market Newbuilds as proportion of total transactions Transactions in 2020 by period of construction, proportion in %
Source: Swiss Real Estate Datapool, Credit Suisse Last data point: Q4/2020 Source: Swiss Real Estate Datapool, Credit Suisse Last data point: Q4/2020
0%
5%
10%
15%
20%
25%
30%
35%
40%
45%
50%
2000 2002 2004 2006 2008 2010 2012 2014 2016 2018 2020
Condominiums Single-family homes
0% 5% 10% 15% 20% 25% 30%
vor 1919
1919 – 1945
1946 – 1960
1961 – 1970
1971 – 1980
1981 – 1990
1991 – 2000
2001 – 2005
2006 – 2010
2011 – 2018
2019 – 2020
CondominiumsSingle-family homes

Swiss Real Estate Market 2021 | March 2021 13
Owner-occupied housing – market outcome
Prices keep rising The supply of owner-occupied housing has not kept up with demand. As a result, vacancies are likely to decline further in 2021, despite already being at low levels, while prices keep rising. As a result of the COVID-19 pandemic and mortgage interest rates remaining at very low levels, the desire of the Swiss to own their own home has increased further recently. The crisis has made many households even more aware of the desirability of having a home in which they feel comfort-able and which meets their own (changed) requirements, which has in turn prompted many house-holds to rethink their living situation – frequently including the issue of ownership. This is in stark contrast to the supply side, which is characterized by declining newbuild activity. The consequence has been the emergence of a substantial demand overhang for owner-occupied housing. A comparison of property search engine registrations online with the supply situation clearly high-lights this demand overhang. For each property advertised in Switzerland there are 2.1 search en-gine registrations by people looking to acquire property. The imbalance is greater for single-family homes than condominiums. In order to facilitate a better regional comparison and ensure that cer-tain nuances in the use of online platforms and advertisements do not distort the results, we have looked at the relationship of search engine registrations to advertisements separately and in a standardized way for the three different main language areas of Switzerland. The highest number of property-seekers relative to supply is to be found in the wider Zurich area, the Lake Geneva re-gion, and central regions such as Basel, Zug, Bern, and Fribourg (Fig. 13). By contrast, the num-ber of interested parties relative to supply is lower in the Valais, Ticino, and rural and Alpine re-gions. The persistent demand overhang is also reflected in the change in advertised residential property supply. Over the last 12 months, the supply of available condominiums and single-family homes has fallen by 4.3% and 8.3% respectively. The same picture also emerges when we look at the required marketing costs: Over the last 12 months, the time-on-market of the median condomin-ium has declined from 110 to 74 days, and in the case of single-family homes from 98 to 77. The smooth sale of residential property is keeping vacancies in this segment at very low levels, quite at odds with the situation in the rental apartment market. In June 2020, the respective seg-ment vacancy rates stood at 0.55% for condominiums and 0.61% for single-family homes. Va-cancies are low in the great majority of Swiss regions (Fig. 14). Only nine of the 110 regions ex-hibit a vacancy rate of more than 1%, and just one region more than 1.4%.
Demand overhang has become more substantial
More than twice as many home-seekers as available properties
More rapid marketing
Low vacancies an almost ubiquitous phenomenon
Fig. 13: Pronounced demand overhangs close to urban centers Fig. 14: Very low vacancies in the majority of regions Ratio of property search engine registrations to advertisements, standardized by lan-guage region
Regional vacancy rates for owner-occupied housing (condominiums and single-family homes), as % of housing stock
Source: Realmatch360, Meta-Sys, Credit Suisse Last data point: Q3/2020 Source: Swiss Federal Statistical Office, Credit Suisse Last data point: 06/2020
Ratio of property search registrations to advertisementsHigh Low
> 1.4%1.2 – 1.4%1.0 – 1.2%0.8 – 1.0%0.6 – 0.8%0.4 – 0.6%0.2 – 0.4%< 0.2%
Year-on-year changeStrong riseSlight riseSideways movementSlight declineStrong decline

14 Swiss Real Estate Market 2021 | March 2021
If the Swiss economy recovers from the pandemic as expected, vacancies should even decline this year. However, the downside potential is limited by virtue of the fact that vacancy rates are al-ready so low. Regional differences are likely to become apparent. In particular, the surge in inter-est in second homes could have the effect of bringing down vacancies in mountain regions, which are relatively high compared to the Mittelland region north of the Alps. The combination of strong demand and declining supply drove up the prices of residential property last year to an unexpectedly high degree. In just one year, prices in the mid-range segment rose by 5.1% for condominiums and 5.5% for single-family homes (Fig. 15). Surprisingly, rises were strongest in the upmarket segment. Given the decline in household incomes, a stronger rise in the lower and mid-range segments might have been expected. Where condominiums are concerned, by contrast, growth has accelerated most strongly in the lower price segment over the last few quarters. Given the ongoing demand overhang, it is only reasonable to expect prices to continue to rise this year. Upside price potential is limited by Switzerland’s strict regulatory financing requirements, however. We are therefore expecting price momentum to flatten off. Just like last year, price growth can be expected to be less strong for condominiums (3%) than for single-family homes (4%). Because the prices of residential property are being fueled not just by low mortgage interest rates, but now also by a scarcity of supply, regional imbalances between price and income development have increased further. But this also gives rise to the possibility of greater price corrections. At the same time, stringent regulatory measures are limiting the ability to purchase a home to relatively affluent, high-income swathes of the population, which generally speaking ought to be in a better position to handle price fluctuations. The imposed regulatory measures are helping to reduce the risks faced by individual homeowners. Thanks to the shortened repayment requirement for two-thirds of the loan-to-value ratio intro-duced a few years ago, households with high ratios are reducing these more quickly. In addition, the wide gap between the actual mortgage interest paid by a household and the imputed interest rate is significantly increasing homeowners’ financial freedom of maneuver. Figure 16 shows how rapidly a first-time buyer could reduce their risk. Here we are looking at a household that only just passes the imputed affordability test. If this household then saves the difference between the ac-tual and the imputed rate of interest, it could reduce its overall debt level substantially by the end of the term. In the case of a 10-year fixed mortgage, for example, the loan-to-value ratio can be reduced from 80% to 43.3% and the income burden of imputed affordability from 33.3% to 17.9%. In practice, of course, only very few owners will save the entire interest difference. The above example nonetheless shows how important it is to set aside at least a proportion of the saved interest costs. This way, the individual financial risks associated with home ownership can be reduced significantly.
Lower vacancies expected for 2021
Unexpectedly strong price dynamism in 2020
Price growth likely to flatten in 2021
Growing imbalances
Savings on interest costs allow house-holds to reduce risks tangibly
Fig. 15: Higher price growth in all segments Fig. 16: Striking reduction in risk after just a few years Annual growth rates by price segment Assumptions: Difference between imputed and actual interest rate is wholly used for
the partial repayment of the mortgage at end of term
Source: Wüest Partner Last data point: Q4/2020 Source: Credit Suisse Last data point: 12/2020
-12%
-9%
-6%
-3%
0%
3%
6%
9%
12%
2012 2014 2016 2018 2020 2012 2014 2016 2018 2020
Basic property Average property Upmarket property
Condominium Single-family home
0%
10%
20%
30%
40%
50%
60%
70%
80%
90%
0
100,000
200,000
300,000
400,000
500,000
600,000
700,000
800,000
900,000
Purchase(in year 1)
Fixed mortgage5 years
(in year 6)
Fixed mortgage10 years
(in year 11)
Fixed mortgage15 years
(in year 16)
Purchase price MortgageCumulative saving Imputed affordability (rhs)Loan-to-value ratio (rhs)

Swiss Real Estate Market 2021 | March 2021 15
Heading 1 – chapter title
Outlook Wohneigentum Heading 3 – lead text Text text text
Swiss Real Estate Market 2021 | March 2021 15
Owner-occupied housing – outlook 2021
Mortgage interest rates (market average)
Price growth Growth in transaction prices in %
• Stable demand despite COVID-19• Low mortgage interest rates the key driver of demand• � ising�prices�and�rigorous�financing�re uirements�slo �
momentum
2021: Demand for owner-occupied housing to remain robust
2021: Newbuild activity continues to slow
2021: Price growth expected to remain strong
5-year Fix mortgage 10-year Fix mortgage SARON mortgage (1-month)
• Declining newbuild activity leads to major demand overhang
2021: Vacancies decline slightly
0.87% 1.10% 1.04% 1.30%0.86% 0.86%
0.61%Single-family homes
2020
0.55%Condominiums
2020
Scarcity of property for sale
Single-family homes Condominiums
+2.3%2019
+2.1%2019
+4.0% 2021
+5.5%2020
+5.1% 2020 +3.0%
2021
Demand Supply Building permits in number of housing units
Vacancies
2019 2020
Single-family homes
– 0.8%
Condominiums
– 2.9%12,250
5950
11,900
5900
12 / 2020 12 / 2020 12 / 202012 / 2021 12 / 2021 12 / 2021
CRED_Ausblick2021_Fazitseiten_EN_210202.indd 15 04.02.21 15:33

16 Swiss Real Estate Market 2021 | March 2021
Digital real estate – data analytics
Digitalization as decoder of demand
The digitalization of all walks of life opens up opportunities, allowing key information to be more easily compiled and evaluated. For example, the consequences of COVID-19 for the housing market can be better evaluated. Lots of information has long been available on housing supply, but demand has remained largely in the shadows. For decades, demand preferences were mostly only indirectly measurable (e.g. via vacancy data). While statistics such as the structural survey of the Swiss Federal Statistical Of-fice provide indications on household living space, they suffer from the problem that households do not necessarily have the amount of living space that they would like. In addition, the time lag between survey and publication of the corresponding data is often significant. Surveys on demand behavior – such as the NZZ's Real Estate Barometer – are helpful up to a point, but are based on small sample sizes and thus make regional conclusions difficult to draw. The precursors of digitalization in the real estate market were property websites. As these made huge inroads into the residential property advertising market around the turn of the millennium, new data analysis opportunities started opening up, particularly as home seekers left a trail in these digital channels. Analysis initially focused on what online searchers were clicking on. This allowed conclusions to be drawn as to what was eliciting interest. The information remained in-complete, however, as in the absence of the desired offer, there was nothing to click on. Moreo-ver, this approach did not yield information on a searcher’s price ceiling. The growing number of residential property advertisements then gave rise to registrations for online property searches, as these give users rapid and customized information on properties of interest. Users have to enter their true preferences to obtain meaningful information. The Swiss proptech company Realmatch360 was the first company to perceive the value of this information: Since February 2014, it has been (anonymously) analyzing the search registrations of the largest Swiss property websites and promptly making this data available to clients. More than a million ac-tive search profiles are now investigated every day, facilitating detailed regional analyses. The spe-cific focus here is the data available on the rental and owner-occupied housing markets. But in order for meaningful results to be arrived at, a number of challenges needed to be cracked. To identify and “cleanse” (i.e. correct) missing, duplicate, and misleading information, smart algo-rithms are required. The dreamer searching for a large, modern, single-family home in the city of Zurich for less than CHF 700,000 tells us nothing about actual demand or real price ceilings. In addition, real estate marketers and brokers who themselves maintain property search registrations in order to observe the market need to be removed from the dataset. Ultimately, only around 200,000 search profiles are really used every day. Modern data processing methods allow property demand data to be made available promptly. For example, Realmatch360 updates its products on a weekly basis, and for good reason: Around 10,000 adjustments to property search registrations are made across Switzerland every day (new registrations or adjustment/deletion of existing registrations). On average, these run for between two and three months for rental property and at least twice that long for property to buy. The COVID-19 pandemic showed how important it is to access data as rapidly as possible when evaluating a situation. Thanks to the valuable assessment of search profiles, statements backed by real data can now be made on whether and how COVID-19 has changed demand for housing. For example, there has been an increase in searches for apartments and houses to buy, and fewer for rentals (Fig. 17).
Demand data has been a long time coming
From the analysis of clicks ...
… to the evaluation of online property search registrations
Data cleansing a challenge
Data extremely up to date
Case study 1: Demand shifts due to COVID-19

Swiss Real Estate Market 2021 | March 2021 17
Moreover, a shift in preferences is also evident within individual segments. Demand is increasingly focused on medium-sized and large homes (rental/condominium: ≥ 3 rooms, single-family home: ≥ 5 rooms) (Fig. 17). In other words, aspirations have risen, meaning less frequent searches for cheaper properties compared to those in the middle and upper price segments. Furthermore, the desire for rental apartments to have outside space (balcony/terrace) spiked briefly following the lockdown. Explicit demand for parking spaces with property to buy or rent has also become more common. All of this suggests that as people have spent more time at home since the onset of COVID-19, there has been a marked increase in the desirability of properties that meet specific user needs, are compatible with changed user behavior (more time spent at home, home work-ing), and deliver that feel-good factor. Since the outbreak of the pandemic, residential property hunters have shown greater interest in municipalities outside of the large centers and surrounding urban areas (Fig. 18). However, as 50.4% of all searches remain focused on rental apartments in a large center or surrounding area, with the decline in demand amounting to just 1.9 percentage points here, it can hardly be said that people are looking to move out of the city. Where buyers are concerned, by contrast, the move toward the periphery is more pronounced. As we explain in the “Owner-occupied housing” section (page 9 f.), this trend could even become more accentuated due to high real estate prices in cen-tral locations and the paradigm shift toward home working. The COVID-19 pandemic has changed demand preferences, at least temporarily. The sustainabil-ity of such trends will not become clear for several quarters or even years, however. It will there-fore remain crucial to observe demand continuously, rather than drawing false conclusions based on snapshot pictures. Detailed analysis of search profiles can also throw up fascinating results regarding local demand. However, developers and brokers frequently do not have the time to conduct their own analyses. Simple (web) apps such as the one we describe below can provide these market participants with the information they desire with just a few clicks of the mouse. As mentioned earlier, search registrations provide local information on what residential property hunters can afford to pay. As just a few francs more or less per square meter can make the differ-ence between how easy or difficult it is to rent out a property, precise information is gold dust for owners, property developers, marketers, and brokers. And thanks to modern web apps, this need can be met. We demonstrate this below using the example of Realmatch360’s “Pricesetter”, an application that gives information on searcher’s willingness to pay. Figure 19 shows local affordability (as per Pricesetter) of a rental apartment with four rooms in Zurich Oerlikon, Uster, und Wetzikon. This shows that a targeted gross rent of CHF 2,500 will reach 68.7% of all online searchers in Zurich Oerlikon. The proportion sinks to 37.7% in Uster, and to just 17.6% in Wetzikon. What matters here are so-called “price cliffs”, where the propor-tion of searchers suddenly drops dramatically with just a slight rise in price. In Zurich Oerlikon, price cliffs of this kind can be observed above CHF 3,000 and CHF 3,500 (Fig. 19). In other words, significantly fewer home-seekers will get to see a property advertisement that is only slightly more expensive.
“Home sweet home” reigns supreme
COVID-19 has also produced spatial shifts
Demand tracking essential
Rapid delivery of findings – thanks to simple tools
Case study 2: Identifying price ceilings
Identifying “price cliffs”
Fig. 17: Large apartments in greater demand since COVID-19 Fig. 18: Large centers (incl. wider urban areas) less in demand since COVID-19
Change in demand indices: 02/2020 – 12/2020 Distribution of rental property search registrations by municipality type
Source: Realmatch360 Last data point: 12/2020 Source: Realmatch360 Last data point: 11/2020
-10%
-5%
0%
5%
10%
15%
20%
25%
30%
All
Size
: sm
all
Size
: med
ium
Size
: lar
ge
Ren
t: lo
w
Ren
t: m
ediu
m
Ren
t: hi
gh All
Size
: sm
all
Size
: med
ium
Size
: lar
ge
Pric
e: lo
w
Pric
e: m
ediu
m
Pric
e: h
igh All
Size
: sm
all
Size
: med
ium
Size
: lar
ge
Pric
e: lo
w
Pric
e: m
ediu
m
Pric
e: h
igh
Rental apartments Condominiums Single-family homes
0%
5%
10%
15%
20%
25%
30%
35%
Largecenters (LC)
Mid-sizedcenters (MC)
Urbanarea LC
Urbanarea MC
Periphery
2019 June – Aug. 2020 Sept. – Nov. 2020

18 Swiss Real Estate Market 2021 | March 2021
If additional information on the marketed property is provided – such as age, condition, area, loca-tion, and fitout/features – the optimum rent can be ascertained. This involves use of a hedonic price model that takes into account a property’s qualitative features. Figure 20 illustrates this us-ing an example of a four-room rental apartment in the town of Bienne. For a newbuild offering 110 m² of living space in an average micro-location with standard features, a gross monthly rent of CHF 1,850 is recommended. By contrast, the optimum newbuild rent in a very good micro-lo-cation with upscale features is CHF 2,090. Statistical models such as those used in Pricesetter have their limits, however. For example, they are ill-suited to evaluating luxury or “must-have” properties. When it comes to what searchers’ will-ingness to pay, it should also always be borne in mind that people typically enter a ceiling that is somewhat above what they can or want to afford. On average, the maximum price entered in property searches is 6.7% above what is feasible. Why? Because people do not want to miss out on their dream home just because it was slightly beyond their budget. While an app can provide valuable services for individual inquiries, using such tools manually is time-intensive for high data volumes, and often inexpedient. What’s more, with the inexorable rise of digitalization, an ever-increasing number of tools may offer companies interesting services, but they frequently remain stand-alone applications. In other words, such tools cannot communicate with one another, and the results can often only be integrated into proprietary data holdings manu-ally. For this reason, large companies in particular expect such products to be made available via a so-called application programming interface – API. This facilitates the automated execution of inquir-ies and the transfer of results to proprietary systems, thereby avoiding system discontinuities. Realmatch360 already offers precisely such APIs. For example, a bank can use the Pricesetter application automatically for the risk monitoring of mortgage loans. If the price ceiling in a particu-lar municipality falls below a defined threshold, this automatically triggers an alarm for properties in this location, and the bank can then seek out the underlying reasons. Digital analysis of demand behavior can act as a “third eye” – alongside supply and market data – to eliminate knowledge gaps in project planning and marketing. However, local property market expertise remains irreplaceable and other indicators should also be taken into account. Thanks to the increasing spread of APIs, the linking of different data sources is becoming easier, thus in-creasing the value of data analyses significantly and opening up new linking possibilities. Specifi-cally, there is plenty of research left to be done in the area of demand behavior. For example, inte-gration of the “Sinus-Milieus” (social/target group typology developed by the Sinus Institute) will help to deliver more precise analysis of the target audience. Furthermore, thanks to modern tech-niques such as machine learning and the incorporation of additional sources of data, it should be possible to generate new findings from search behavior – including for other segments. This is very much to be welcomed, particularly as – given the growing challenges facing the office and retail property markets – it is becoming increasingly important to learn more about demand behav-ior in these areas too.
Ascertaining the optimum rent
Property-seekers typically enter a higher price ceiling than they can afford
Only integration untaps full potential
API solutions increase value of data
Conclusion: Digitalization closes knowledge gaps
Fig. 19: Identification of price cliffs Fig. 20: Determining the optimum rent Price ceiling (gross rent in CHF/month) for four-room apartments Price ceiling (gross rent in CHF/month) for four-room apartments in Bienne
Source: Realmatch360, Credit Suisse Last data point: 12/2020 Source: Realmatch360 Last data point: 12/2020
0%
10%
20%
30%
40%
50%
60%
70%
80%
90%
100%
1000 1500 2000 2500 3000 3500 4000 4500 5000
Pro
porti
on o
f pro
perty
see
kers
Price ceiling
Zurich Oerlikon
Uster
Wetzikon
Price cliffs
0%
10%
20%
30%
40%
50%
60%
70%
80%
90%
100%
1000 1200 1400 1600 1800 2000 2200 2400 2600 2800 3000
Pro
porti
on o
f pro
perty
see
kers
Price ceiling
Location: mediumFeatures: standard
Location: very goodFeatures: upscale
Location: poorFeatures: standard
Red lines:Newbuilds with 110 square meters of living space

Swiss Real Estate Market 2021 | March 2021 19
Rental apartments – demand
Demand extremely robust Demand for rental apartments has remained remarkably stable throughout the COVID-19 pandemic. The feared slump in immigration never materialized. That said, a slight weakening of demand – if only temporary – is becoming apparent in the large centers. For a number of years now, demand for rental accommodation in Switzerland has failed to keep up with supply. Accordingly, many observers feared that the coronavirus crisis would exacerbate the oversupply problem in the rental apartment market – via weak consumer sentiment and a de-cline in immigration. Over the last year, however, immigration has proved astonishingly robust. Overall, we estimate the net migration of the permanent residential population (including the Swiss themselves) to amount to 62,000 people. In other words, the net migration of the previous year 2019 (53,200) is likely to have been exceeded by some margin (Fig. 21). However, this rise is not attributable to the number of foreigners moving to Switzerland (2020: -2.6%), but to the significant decline in the number of people leaving the country (-12.1%). Not least thanks to short-time working, bridging loans, and fiscal stimulus, the Swiss labor market has proved itself to be more resilient in the face of the crisis than other potential destination countries for Swiss and foreign emigrants, such as Portugal (2020: employment growth of -2.8%) and Italy (-1.7%). In the current situation, many potential emigrants are likely to have opted to stay in the safe haven that is Switzerland rather than risk the “return to the unknown”. On the other hand, a sharp decline is evident in the net migration of short-term residents (those residing for up to 12 months; non-permanent residential population). These immigrants often work in seasonal industries (e.g. hotels & catering), or are recruited to plug temporary gaps. The net mi-gration of the non-permanent residential population declined by 11,800 persons in 2020. What’s more, the accommodation needs of these short-term residents are often likely to be met by staff accommodation or temporary arrangements with people they know. However, many (on average around a quarter) ultimately settle in Switzerland in the longer term. If the non-permanent foreign residential population is taken into account, it emerges that a majority of 75 out of 110 regions have recorded a decline in net immigration since the start of the pandemic (Fig. 22). This decline has been relatively pronounced in and around the large centers, with only the Lausanne region bucking the trend. Moreover, net immigration increased in Ticino because many Italian citizens re-turned to their native country in the previous year. Emigration flows of this kind to a country heavily afflicted by the pandemic were much rarer in 2020.
High net immigration ...
... thanks to “safe haven” effect
Fewer short-term residents
Fig. 21: Due to the pandemic, many fewer people leaving Switzer-land
Fig. 22: Net migration lowering in most regions since start of pan-demic
Net migration of permanent resident population (excluding registry corrections); 2020: extrapolation; 2021: forecast
Net migration (including short-term residents) Mar. – Oct. 2020, year-on-year change
Source: State Secretariat for Migration, Swiss Federal Statistical Office, OECD, Credit Suisse Last data point: 12/2020
Source: State Secretariat for Migration , Credit Suisse, Geostat Last data point: 10/2020
-2.4%-1.8%-1.2%-0.6%0.0%0.6%1.2%1.8%2.4%3.0%3.6%
-120,000-90,000-60,000-30,000
030,00060,00090,000
120,000150,000180,000
2002 2004 2006 2008 2010 2012 2014 2016 2018 2020
Swiss citizen emigrationSwiss citizen immigrationForeigner emigrationForeigner immigrationNet immigrationEmployment growth: CH-Eurozone difference (rhs)
+ + + (Increase)+ ++Sideways movement–– – – – – (Decrease)

20 Swiss Real Estate Market 2021 | March 2021
The development of immigration going forward is likely depend on how quickly the economies of Switzerland and the main native countries of the foreign residential population recover from the slump triggered by the pandemic. Immigration should remain constrained as a result of modest employment growth (2021 forecast: 0.2%). However, the labor markets of a number of countries in Europe are suffering from the consequences of the pandemic even more than Switzerland. For 2021, the OECD is expecting a strong rise in unemployment in France (2021 forecast: 10.5%), Italy (11.0%), and Portugal (9.5%). As a consequence, the number of Swiss and foreigners leav-ing Switzerland should remain low in 2021 too. At the same time, due to the decline in the num-ber of short-term residents, there should be fewer changes of status from the non-permanent to the permanent residential population. All in all, we are expecting net migration to decline this year to some 55,000 persons (Fig. 21). Domestic demand has also recovered following a temporary slump at the start of the pandemic. However, the extent of the economic impact of the current crisis differs significantly from house-hold to household. Employees and company owners in sectors hard-hit by the coronavirus measures can be expected to suffer declines in income, despite the rapid support provided by the state, or are at least exposed to heightened uncertainty. This stands in contrast to the great ma-jority of households, which have actually saved more due to their inability/reluctance to holiday abroad, lower commuting costs, and restrictions on leisure activities. In addition, the significant ob-stacles to the acquisition of residential property ownership remain a source of support for rental apartment demand (Fig. 23). We are therefore anticipating a moderate decline in rental apartment demand of around 1,000 to 1,500 residential units for both 2020 and 2021. Although the decline in demand is likely to be temporary, the question nonetheless arises as to how the coronavirus crisis is influencing the structure of demand. Due to lower net immigration from abroad (see above) among other things, Switzerland’s large centers – with the exception of Basel – saw population growth slow in 2020 (Fig. 24). Furthermore, the growth of the Swiss resi-dential population has exhibited a strongly declining trend in Zurich and Geneva. Analyses of prop-erty search registrations for rental apartments on real estate platforms also appear to show a slight shift in rental apartment demand from smaller apartments in the large centers and their surround-ing urban areas to larger apartments in the mid-sized centers and rural regions (p. 16 f.). Many of the attractions that characterize the large urban centers, such as the wide spectrum of cultural, leisure, and gastronomic options, have been unavailable over the last few months. During lockdown, the focus has switched to other characteristics of accommodation – such as a balcony or terrace, the suitability of an apartment for home working, and proximity to greenery and local recreation areas. However, the coronavirus restrictions will be of a temporary nature. The question therefore arises as to whether the pandemic will also have longer-term repercussions for the structure of demand. This could above all be the case in the event of the shift toward home work-ing proving an enduring phenomenon. The potential repercussions of such a scenario are dis-cussed on page 23.
2021: Immigration to weaken slightly
Moderate decline in demand for rental accommodation
Slight weakening of demand in large centers
Permanent shift in structure of demand?
Fig. 23: Decline in demand likely to prove moderate Fig. 24: Declining population growth in large centers Absorption of rental apartments and employment growth (full-time equivalents), 2019 – 2021: estimate/forecast
Growth in residential population of large centers, annualized
Source: Swiss Federal Statistical Office, Credit Suisse Last data point: 2019
Source: Official statistical sources, Credit Suisse Last data point: Q4/2020
-1.0%-0.5%0.0%0.5%1.0%1.5%2.0%2.5%3.0%3.5%4.0%4.5%
-8,000-4,000
04,0008,000
12,00016,00020,00024,00028,00032,00036,000
2003 2005 2007 2009 2011 2013 2015 2017 2019 2021
Employment growth (rhs)Observed absorptionModeled absorptionForecastObserved absorption, owner-occupied housing
-1.0%
-0.5%
0.0%
0.5%
1.0%
1.5%
2000
–20
1020
10 –
2018
2019
2020
(Q3)
2000
–20
1020
10 –
2018
2019
2020
(Q3)
2000
–20
1020
10 –
2018
2019
2020
2000
–20
1020
10 –
2018
2019
2020
2000
–20
1020
10 –
2018
2019
2020
Swiss Foreigners Total
Zurich Geneva Basel-City (Canton) Lausanne Bern

Swiss Real Estate Market 2021 | March 2021 21
Rental apartments – supply
Construction peak passed The boom in rental apartment construction of the last few years has passed its peak. From a geographical perspective too, a convergence of supply and demand can be tentatively discerned. Much like in 2019, building permits were issued for 26,000 rental apartments in Switzerland over the course of 2020 (Fig. 25). This is significantly less than in the years 2016 to 2018, but it is probably still too many to bring down vacancy levels any time soon. On the other hand, a sharp decline in the volume of newly submitted planning applications suggests that the gradual slow-down in construction activity is actually a trend that could persist for at least two to three years. In 2020, newbuild applications were submitted for 27,000 rental apartments – the lowest figure since 2014. The oversupply situation that has become established over the years in the rental apartment mar-ket has been caused not just by high construction volumes, but above all by the geographical dis-tribution of this activity, which has been out of kilter with demand. With this in mind, the recent building permit issuance figures raise hopes of an improvement, as the number of approved apart-ments in the large centers (+41.8%) and their surrounding urban municipalities (+14.3%) has in-creased significantly in 2020 (Fig. 25). However, this should be qualified by the observation that there is virtually no more building land available in the major centers, and many of the most attrac-tive brownfield sites have already been converted into residential developments. In other words, an increasing number of projects are replacement newbuilds, which means that the net addition of residential units will be lower than construction figures would suggest. It is not just in the major urban areas that numerous construction cranes can be seen. In central Switzerland too, a significant amount of new living space is being created (Fig. 26). By contrast, fewer apartments are set to be built in a majority of 63 of the 110 economic regions than the av-erage construction figure for the last five years. Based on expected expansion, past absorption rates, and active search registrations, we have tried to identify the 15 regions with the highest cur-rent absorption risk. In these regions, which are geographically widespread, we are anticipating rising vacancy rates. They largely comprise regions that already exhibit high vacancy rates (Mendrisio, Bellinzona, Surselva, Laufental, Solothurn, and La Vallée), but also those in which there is little or only modest oversupply at the moment (Furttal, Mittelbünden, Uri). By contrast, a number of regions characterized by strong rises in vacancies in recent years now appear to be un-dergoing a degree of normalization (e.g. Lower Valais, western areas of Aargau).
Strong decline in planning applications
Stronger focus on major urban areas ...
… and central Switzerland
Fig. 25: Construction activity more focused on major centers Fig.26: Rental apartment construction slows in majority of regions Building permits for rental apartments (newbuild) by municipality type Expected expansion of rental apartments stock in 2021 compared to 5-year average;
triangles: regions with highest absorption risk (horizon of 1–2 years)
Source: Baublatt, Credit Suisse Last data point: 12/2020 Source: Baublatt, Realmatch360, Federal Statistical Office, Credit Suisse, Geostat Last data point: 11/2020
14.4
%
13.3
%
22.3
%
22.6
%
20.7
%
18.5
%
11.0
%
13.5
%
17.7
%
17.9
%
14.0
%
14.2
%
0%
20%
40%
60%
80%
100%
0
7,000
14,000
21,000
28,000
35,000
2003 2006 2009 2012 2015 2018
Rural/tourist municipalities Periurban municipalitiesSmall/mid-sized centers, urban area Small/mid-sized centersLarge centers, urban area Large centers
Proportions 2002 – 2020 (rhs)Proportions 2018 – 2020 (rhs)
Planning applications
UriSurselva
Wil
Mittelbünden
Lugano
Sarganserland
Freiamt
La Vallée
Laufental
Solothurn
Glâne/Veveyse
Schaffhausen
Bellinzona
Mendrisio
Furttal
> 40%20 – 40%5 – 20%-5 – 5%-20 – -5%-40 – -20%< -40%

22 Swiss Real Estate Market 2021 | March 2021
Rental apartments – market outcome
Calming in the centers So far, the coronavirus crisis has hardly exacerbated the oversupply problem in the Swiss rental apartment market. It is nonetheless likely to leave a lasting mark, as well as cooling the market to a certain extent in the major centers. Vacancy rates in the rental apartment market have been rising steadily for the last decade. Nega-tive interest rates since 2015 have accelerated this development, as well as putting rents under increasing pressure (Fig. 32). Since 2019, the downturn in this market – primarily as a result of the robust economy along with stabilization of immigration and construction activity – has finally slowed somewhat. In other words, COVID-19 has encountered a rental apartment market in a fragile situation. That said, demand for rental apartments has proved remarkably stable in the evo-lution of the pandemic thus far. Up until now, the coronavirus crisis has had a greater impact on the structure of demand than on demand volumes. The former has shifted slightly in the direction of larger apartments (when measured by number of rooms) and locations outside of the large cen-ters (p. 16 f.). Below we analyze these structural changes and their repercussions for the market. Alongside vacancy rates, another proven indicator of the market situation and the relationship be-tween supply and demand is the duration of advertising (“time on market”) of a vacant apartment. In 2020 the relative scarcity of rental accommodation in the large centers was reflected in a short average time on market of just 26 days (Fig. 27). The lowest figure of all – 21 days – was rec-orded by the city of Zurich. In other words, the market has hardly cooled in the major centers. Compared to the long-term average of 24 days, the 2020 figure is just two days higher. Proper-ties in the outer and periurban municipalities of the major urban centers likewise exhibit a relatively short time on market, namely 32 days and 39 days respectively. Outside of the major urban areas, marketing periods work out at an average of between 45 and 50 days. A rule of thumb that ap-plies in all municipality types is that the more rooms an apartment has, the longer the time on mar-ket. During the first lockdown in March/April 2020, the number of apartments advertised for rental de-clined (Fig. 28). As apartment viewings and moves were at times almost impossible, the marketing of apartments was in many cases deferred or interrupted. Following a recovery in the summer, supply remained relatively stable in the larger centers in the fourth quarter too, whereas there was a significant decline in the number of apartments being offered outside of the main centers. This would suggest that fewer apartments are being vacated and coming back onto the market outside of the main centers. In other words, less central areas appear to have gained in appeal.
COVID-19 changes structure of demand more strongly than volume of demand
Marketing still easiest in the large centers, ...
... but supply has recently shrunk elsewhere
Fig. 27: Advertising takes longer outside of main urban areas Fig. 28: Supply declines outside of the large centers Average time on market by number of rooms and municipality type, 2020 Weekly development of the number of advertised rental apartments from January
2020, index: week of January 6 – 12, 2020 = 100
Source: Meta-Sys, Credit Suisse Last data point: Q4/2020 Source: Meta-Sys, Credit Suisse Last data point: 13.12.2020
0
10
20
30
40
50
60
Larg
e ce
nter
s
Larg
e ce
nter
s,ur
ban
area
Mid
-size
d ce
nter
s
Mid
-size
d ce
nter
s,ur
ban
area
Tour
ist m
un.
Sm
all c
ente
rs
Per
iurb
an m
un.
of la
rge
aggl
omer
atio
ns
Oth
er p
eriu
rban
mun
.
Rur
al m
un.
Total Total average since 2004 2 rooms 3 rooms 4 rooms
80
85
90
95
100
105
110
115
120
01/2020 03/2020 05/2020 07/2020 09/2020 11/2020
Large centers Mid-sized centers Suburban municipalitiesPeriurban municipalities Other municipalities

Swiss Real Estate Market 2021 | March 2021 23
The reasons for the slight market shift toward larger apartments outside of the main centers can-not be directly derived from the data itself. However, it may be assumed that the restrictions im-posed on economic and private life in connection with COVID-19 have played a role. During lock-down, the appeal of a spacious apartment with dedicated office area, large balcony, and proximity to greenery over a small older apartment in the inner city became evident for all to see. True, the coronavirus restrictions will only be temporary in nature, but there is broad consensus in both the private sector and the world of academic research that home working will be a more commonplace phenomenon once the pandemic is behind us. The more a person works from home, the more likely they are to accept longer commutes, and the more a separate office room in the apartment becomes a necessity. Employees who now en-joy greater freedom of choice when it comes to their place of work must re-evaluate their current living situation. Put simply, they have two options: To live centrally and work in the office, or to live further away and do a proportion of their workload remotely – in a larger apartment more suited to this scenario. Which option they choose will depend on their personal preferences – with the at-tractions offered by the city being rather different to those that come with rural living. Against these respective benefits must be set the costs of the two options. Primarily these come down to living costs, travel costs, taxes, and other levies. The greater the time spent working from home, the lower the travel costs (including time costs) for commuting the same distance between work and home. We have tried to illustrate the optimum choice of place of residence based on a simple model cal-culation for the Zurich area. Our starting scenario is a double-earning couple who live and work in the city of Zurich. Let us assume that both spouses now have the option of spending a significant part of their week working from home, which in turn influences their ideal apartment setup. In the initial scenario, this household has an income of CHF 125,000 a year, which is broadly equivalent to a Swiss median income for a total working week of 180% for a couple. Our couple currently live in a 2.5-room rental apartment of the medium price segment, and are looking at moving to a larger rental apartment (one extra room) outside of the city.
Fig. 29 illustrates the consequences of such a move for living costs and taxes. Despite a larger apartment, this household would actually make savings in the majority of municipalities in the catchment area due to the high rents and (in a regional comparison) high tax rates that apply in the city of Zurich. The only exceptions are a number of lakeside municipalities where the lower taxes do not make up for the higher rental costs. However, the financial upside in most of the nearby catchment area of the city of Zurich (travel time of no more than 20 minutes) amounts to less than CHF 5,000 annually. And if this saving is then set against the higher travel costs that apply, the move is unlikely to be worthwhile financially in the majority of cases. In certain commu-nities such as Kloten, Urdorf, and Volketswil, however, the savings would be more than CHF 5,000, meaning that a move could be worthwhile, particularly given a higher proportion of time
Pandemic prompts re-evaluation of living situation
“Home office” widens catchment area
Model calculation: moving out of the city to a larger apartment
Fig. 29: Larger apartment an option with move out of town Fig. 30: Move out of Zurich becomes more attractive for high in-comes
Model calculation: Cost difference in CHF/year (income tax and net rent) for a move out of the city of Zurich to a rental apartment with an extra room; assumption: dou-ble-earning couple without children, income CHF 125,000/year (gross), move from medium 2.5-room apartment to medium 3.5-room apartment
Model calculation: cost difference in CHF/year (income tax and net rent) for a move out of the city of Zurich to a rental apartment with an extra room; assumption: dou-ble-earning couple without children, income CHF 250,000/year (gross), move from upmarket 3.5-room apartment to upmarket 4.5-room apartment
Source: Meta-Sys, Federal Tax Administration, Credit Suisse, Geostat Last data point: Q4/2020
Source: Meta-Sys, Federal Tax Administration, Credit Suisse, Geostat Last data point: Q4/2020
Moving makes most sense with wider search radius
Zug
Chur
Stans
Aarau
Basel
Glarus
Sarnen
SchwyzLuzern
Zürich
Altdorf
Herisau
Liestal
Appenzell
St.Gallen
Solothurn
Frauenfeld
Schaffhausen
> 10'0005000 – 10'0000 – 5000-5000 – 0-10'000 – -5000-20'000 – -10'000< -20'000No data
Travel time = 60 min
Travel time = 20 minTravel time = 40 min
Zug
Chur
Stans
Aarau
Basel
Glarus
Sarnen
SchwyzLuzern
Zürich
Altdorf
Herisau
Liestal
Appenzell
St.Gallen
Solothurn
Frauenfeld
Schaffhausen
> 10'0005000 – 10'0000 – 5000-5000 – 0-10'000 – -5000-20'000 – -10'000< -20'000No data
Travel time = 60 min
Travel time = 20 minTravel time = 40 min

24 Swiss Real Estate Market 2021 | March 2021
spent working from home, depending on opportunity costs and the couple’s preferences. In order to achieve savings of at least CHF 10,000, the search radius needs to be expanded to around 40 minutes’ commuting time. This then brings municipalities such as Birr (Aargau), Menzingen (Zug), and Schlatt (Thurgau) into play. In a second scenario (Fig. 30) we consider the situation of a household with a higher income of CHF 250,000 occupying a 3.5-room apartment with upmarket features in Zurich, in this case wanting to move to a similar-quality 4.5-room apartment in another municipality. In this scenario, a saving of more than CHF 10,000 is achieved simply by moving to a majority of municipalities within a 20-minute radius. Due to its higher income, however, this household is also likely to incur greater opportunity costs for its commute. The lower-tax municipalities of central Switzerland be-come much more appealing in this scenario. Municipalities such as Wangen (Schwyz) and Hünen-berg (Zug) lie within a commuting radius of less than 40 minutes, and the household in question would save CHF 20,000 or more a year through a move. Based on the above calculations, we conclude that savings can be made in living costs and taxes for even average incomes with a move out of Zurich to a rental apartment with an extra room. The main reason for this is a steep and continuously increasing difference in rents between city and countryside (Fig. 31). Nonetheless, a switch of residential location within the inner urban ring is seldom likely to prove worthwhile due to commuting costs. Moreover, due to the advantages en-joyed by long-term renters under Swiss rental law, the rents paid are below the level of the adver-tised rates used in our analysis. It is actually possible that significant savings would be made for a move to a municipality within a 40-minute perimeter and a high proportion of the working week spent at home. In that case, however, many households would be likely to consider buying their own home. In addition, as incomes rise a move to a low-tax municipality makes increasing sense. In a world where many people spend a greater proportion of their time working from home, expen-sive city centers could lose some of their appeal. That said, we are in no way anticipating an exo-dus from the city or a reversal of the urbanization trend. A number of important factors that were not taken into consideration in the (cost-side) model calculations set out above favor urban living in the future. Cities have been the drivers of economic growth since time immemorial. Trends such as digitalization and sustainability can be expected to provide further support to urbanization. The large centers have gained hugely in appeal in recent years, and many households will be prepared to pay a premium for the attractions and infrastructures that a city offers in the future too. While first signs of the structural effects unleashed by the pandemic can now be observed in the rental apartment market, the economic impact has been modest so far. The downturn in this mar-ket will continue for now, without being significantly accelerated by the pandemic. Factors that support this argument include the remarkable stability of demand and construction activity levels having passed their peak. For 2021, we are anticipating a further increase in the rental apartment vacancy rate to around 2.85%. However, some of this increase will take place in the main urban centers, where it will provide a welcome (albeit only slight) cooling of the market – mainly in the medium to high price segments. Across Switzerland as a whole, the pressure on advertised rents is expected to continue. Here we are anticipating an average decline of 1.5% (Fig. 32).
The higher the income, the more attractive the move
Strong rent divide opens up as distance to urban center increases
Conclusion: No reversal of urbanization trend
2021: Downturn in rental apartment market to continue
Fig. 31: Gulf between rents in centers and elsewhere Fig. 32: Steady pressure on advertised rents Advertised median net rent for a four-room apartment, in CHF per m² and year, 2019/2020; arrow: trend since 2009/2010
Year-on-year change in rental apartment vacancy rate (VR) and rents, 2021: fore-casts
Source: Meta-Sys, Credit Suisse, Geostat Last data point: Q4/2020 Source: BFS, Wüest Partner, Credit Suisse Last data point: Q4/2020
> 330300 – 330270 – 300240 – 270210 – 240180 – 210150 – 180< 150No data
Strong riseRiseSideways movementDeclineSharp decline
-3%
-2%
-1%
0%
1%
2%
3%
4%
5%
2003 2005 2007 2009 2011 2013 2015 2017 2019 2021*
VR Advertised rents (Wüest Partner) Consumer price index (SFSO)
• Net immigration expected to decline by around 10%• Larger apartments outside of centers more in demand
2021: Demand declines by 1,000 to 1,500 residential units
• Number of approved apartments remains stable• Strong decline in newbuild planning applications
2021: Expansion slows by around 1,000 apartments, decline to accelerate from 2022
Planning applications Building permitsNet immigration
• Vacancies rise by a further 3,000 to 4,000 apartments• Slight increase in large centers too
Vacancies grow at reduced tempo
• Price growth declines in major centers• Further price declines in regions with high vacancies
Pressure on rents persists
• Supply rate rises to more than 6%• Tenant turnover rises
More smaller apartments and urban apartments in supply
• Capital growth weakens• verage�net�cash�flo �yield�of� .1%
Investment pressure remains high, but risk awareness on the rise
hese�forecasts�are�not�relia le�indicators�of�future�performance.
4 – 4.5%2021
Consequences of COVID manageable
Vacancies As % of rental apartment inventory
Rental prices Increase in rents offered in %
Performance Total return on residential investment properties
Supply rate As % of rental apartment inventory
5.5%2019
5.9%2020
6 – 6.5%2021
2.75% 2.85%
53,2002019
122020
– 1%2020
62,0002020
55,0002021
Rental apartments – outlook 2021
Demand Supply
2020 2021
–1.5%–1.5%
2020 2021
Swiss Real Estate Market 2021 | March 2021 25
CRED_Ausblick2021_Fazitseiten_EN_210202.indd 25 04.02.21 15:33

Swiss Real Estate Market 2021 | March 2021 25
Heading 1 – chapter title
Outlook Mietwohnungen Heading 3 – lead text Text text text
• Net immigration expected to decline by around 10%• Larger apartments outside of centers more in demand
2021: Demand declines by 1,000 to 1,500 residential units
• Number of approved apartments remains stable• Strong decline in newbuild planning applications
2021: Expansion slows by around 1,000 apartments, decline to accelerate from 2022
Planning applications Building permitsNet immigration
• Vacancies rise by a further 3,000 to 4,000 apartments• Slight increase in large centers too
Vacancies grow at reduced tempo
• Price growth declines in major centers• Further price declines in regions with high vacancies
Pressure on rents persists
• Supply rate rises to more than 6%• Tenant turnover rises
More smaller apartments and urban apartments in supply
• Capital growth weakens• verage�net�cash�flo �yield�of� .1%
Investment pressure remains high, but risk awareness on the rise
hese�forecasts�are�not�relia le�indicators�of�future�performance.
4 – 4.5%2021
Consequences of COVID manageable
Vacancies As % of rental apartment inventory
Rental prices Increase in rents offered in %
Performance Total return on residential investment properties
Supply rate As % of rental apartment inventory
5.5%2019
5.9%2020
6 – 6.5%2021
2.75% 2.85%
53,2002019
122020
– 1%2020
62,0002020
55,0002021
Rental apartments – outlook 2021
Demand Supply
2020 2021
–1.5%–1.5%
2020 2021
Swiss Real Estate Market 2021 | March 2021 25
CRED_Ausblick2021_Fazitseiten_EN_210202.indd 25 04.02.21 15:33

26 Swiss Real Estate Market 2021 | March 2021
Digital real estate – data analytics
Rethinking micro-location “Today’s way of evaluating micro-location is a historic relic”, reckons the CEO of Ur-banDataLab, a spin-off of ETH Zurich. Specifically, new approaches make it possible to develop locational criteria in a much more data-supported and user-specific way. This facilitates the creation of more individual portfolio strategies that are also scalable inter-nationally. In the world of real estate, location is viewed as absolutely critical, defining the value, risk, and even the potential of a property site. Accordingly, the importance of evaluating locational quality objectively can hardly be overstated. It has a key impact on real estate valuations, portfolio strate-gies, and the market success of real estate projects. However, measuring locational quality is any-thing but child’s play, and the evaluation process typically comprises numerous dimensions. Con-ventional locational ratings are based on a selection of locational attributes that are weighted and aggregated to create an index. However, if the methodology is not transparent, key influential fac-tors are missing, or there is a lack of consistency in their measurement, standardization can lead to misunderstandings. For example, if user preferences are explained solely by price differences or are insufficiently fac-tored into the locational rating, this can prove problematic. Locational potential differs not just by principal use (e.g. residential, office, retail), but also by individual user segment (e.g. students, seniors, or families on the residential side, and fast food restaurants and luxury restaurants on the catering front). Segmentation of user preferences therefore makes sense, but often fails in prac-tice due to the lack of available data or analytical instruments. Studies carried out at ETH Zurich have shown that a distinction can be made between five dimen-sions of descriptive micro-data when modeling the reasons for property switching:1 social econ-omy (e.g. household structure, tax burden), points of interest (e.g. schools, public transport con-nections), accessibility, topography (e.g. sunlight, views), and urban morphology. The latter de-scribes the spatial composition of buildings and transport networks, e.g. building form, building depth, street width, and street interconnectivity. The use of urban morphology requires special geo-processing, and has yet to become very widespread due to its great complexity. The starting point is geographical data – i.e. maps of buildings and street networks. Morphological information is then extracted and processed through various process steps. A start-up that is mastering this technology is UrbanDataLab. This proptech company has proved in scientific studies and publica-tions that its technology is well-suited to explaining differences in price levels, as well as mobility and relocation behavior, and can therefore also quantify the underutilized potential of development premises – rather than just their actual use.
Figure 33 shows how the morphology of buildings is used to automatically identify building typolo-gies along Zurich’s Langstrasse. Buildings that are similar in respect of their morphological criteria – such as building form, exposure, size, and interconnectedness – are displayed here in the same color. The various different building types identified in this way are designed to appeal to different user types, and among other things also have different development potential. A simple locational index can be calculated purely through the exploitation and processing of morphological infor-mation, for example in respect of a location’s suitability for retail premises. Here, centrality meas-urements are used in combination with building information and then calibrated in UrbanDataLab’s proprietary Machine Learning Framework, using reference data such as actual locations of nearby retail premises. The result is a locational index that makes few demands of data availability and can be automatically calculated in any location where the corresponding map data is available – which to all intents and purposes means anywhere in the world. This locational index can be used for the pre-selection of potentially suitable locational areas. In further steps, additional data – where available – such as spatial economic and demographic information as well as points of in-terest can be included to refine the results of the automated evaluation of locational suitability.
1 Schirmer, Patrick M., Michael AB van Eggermond, and Kay W. Axhausen. “The role of location in residential location choice models: a review of literature”. Journal of Transport and Land Use 7.2 (2014): 3–21.
Measurement of locational quality deserves greater attention
Segmentation of location by users makes sense
Urban morphology as new explanatory dimension
From morphology to locational quality

Swiss Real Estate Market 2021 | March 2021 27
In the past, evaluation of locational qualities has come up against its limits, primarily due to the re-stricted availability of data and the difficulty of processing whatever data does exist. By contrast, in view of the steadily growing number of datasets, the question that increasingly arises nowadays is how these datasets can be utilized and integrated into a company’s own processes. However, new technology such as machine learning and artificial intelligence make it possible to capture the multifaceted nature of user preferences, and thereby significantly improve the evaluation of loca-tional quality for a variety of uses. Crucial to this is access to basic data for the description of loca-tions and behavioral analysis. The ongoing rise in the number of available datasets at micro-level is boosting data-based decision-making and risk appraisal. However, the processing of geo-data – i.e. its use in machine learning models – requires specific knowledge and a level of IT infrastruc-ture that many companies simply do not have. For this reason, all sorts of potential often goes un-exploited, such as the possibility of deriving strategic recommendations from proprietary data, e.g.through the evaluation of vacancies and rental prices.
The proptech provider UrbanDataLab assists companies with precisely such applications. Interac-tive tools make it easier to access data and use research-based analysis methods. Clients are thus empowered to undertake in-depth assessment of their own datasets. The overriding priority is to facilitate individual assessment and strategy, and then integrate these into tools for day-to-day work. If needed, the user can also obtain specialist support in the modeling of their data, in keep-ing with the motto: “book your data scientist”. Figure 34 shows one of the application modules created by UrbanDataLab. The Scout module assists with locational search and acquisition by in-teractively defining micro-location profiles and calling up locational information. To this end, the user filters locations by a variety of characteristics (accessibility, noise levels, proximity to public transport, points of interest, etc.). This then allows them to evaluate how well a selected strategy fits the company’s own portfolio, and how that portfolio could ideally be expanded. Another mod-ule is the Manager, which allows a portfolio to be digitally captured and enriched with information. The applications are modular and the content dynamic, i.e. they adapt to the user’s purpose.
In the real estate industry, there are basically three areas of application in which micro-location plays a key role: (1) When looking for a location, developers and investors try to identify ideally sit-uated sites or sites that exhibit a high probability of conversion of use or acquisition. (2) In the due diligence phase, a specific property and its location are analyzed in respect of target group defini-tion and expected return. (3) Successful portfolio management seeks to optimize investments, on the one hand through diversification and the minimization of risks, and on the other through the maximization of return.
These areas of application are frequently tackled by separate departments of a company, with the effect that valuable potential can be left unexploited. Integrated approaches such as the modular applications of UrbanDataLab focus on merging these data silos and generating value through in-ternal feedback loops. The observations of day-to-day management can thus also support the strategic positioning of portfolios or the acquisition process.
Use-specific location evaluation – thanks to big data
Tools for an individual real estate strategy
Application areas of micro-location
Integration of appli-cations creates added value
Fig. 33: Morphological segmentation Fig. 34: Interactive definition of micro-location ratings
Among other things, the form of buildings makes it possible to differentiate between building types
Drawing up micro-location profiles independently and using these for acquisition
Source: UrbanDataLab, Swisstopo Last data point: 2013 Source: UrbanDataLab Last data point: 2021

28 Swiss Real Estate Market 2021 | March 2021
Case study 1: The best locations for business apartments
Newly emerging niche markets permit portfolio diversification not just by geographical location, but also by usage. However, special properties require their own separate appraisal of micro-location, as can be illustrated in the case of business apartments, for example. Apartments of this kind in Switzerland are managed by a range of providers such as Vision Apartments, Swiss Star, and Glandon Apartments, and promise the property owner a guaranteed return over a fixed timeframe. Apartments can also be marketed via platforms such as Airbnb. However, locational requirements, demand, and the target return have to be evaluated differently for business apartments than for rental apartments.
A distinction can be made between three types of locational evaluation: (1) location-based, (2) de-mand-based, and (3) model-based. A location-based appraisal (1) allows the user to define a lo-cational rating interactively. In the case of business apartments, the decisive factors include a cen-tral location, local amenities in the leisure, gastronomy and retail spheres, proximity to public transport and the freeway, and in some cases also the development of the number of jobs in the vicinity. By filtering according to specific characteristics and defining ranges of values, locations can be classified interactively and particularly suitable geographical scopes identified. A demand-based evaluation (2) investigates the catchment areas of a location and determines demand arith-metically. In the case of business apartments, the anticipated need for apartments is defined in advance, taking into account the corresponding sector and company size. It is then investigated in detail how many companies are potential clients in the catchment area, and how many employees such an offering can be expected to appeal to. Finally, the model-based location rating (3) uses reference objects to arrive at values such as the price level through use of a statistical model.
In one UrbanDataLab project commissioned by Immobilien Basel-Stadt, publicly placed advertise-ments were used to model the maximum potential rental price of business apartments across Switzerland. This map extract shows the Oerlikon – Glattbrugg – Wallisellen region. The darker red the location, the more suitable it is from the perspective of the expert-determined criteria (Fig. 35). In the Zurich-North area, for example, locations in close proximity to Oerlikon and Wallisellen stations were identified as being particularly suitable, but so too were locations close to the airport. The grey markers designate the locations of various providers of business apartments, and were used as reference objects for the calibration of the model.
Case study 2: International comparability
A well-diversified institutional real estate portfolio not only encompasses properties from various usage segments, but also takes into account the need for geographical spread. International diver-sification is now the norm for equity and bond portfolios. Even securities from emerging markets offering higher potential returns but with the corresponding risk typically have a fixed place in the asset allocation of major investors. Where real estate portfolios are concerned, by contrast, a strong “home bias” continues to be evident. To give an example: The foreign holdings of the real
Special properties require use-specific location evaluations
Determining a locational rating for business apartments ...
... facilitates forecasting of rental income
Fig. 35: Locational ratings for business apartments in Zurich Fig. 36: Price forecasts for the city of Medan Interactively produced, user-based locational qualities for business apartments Modeled level of purchase prices for a 3-room apartment in Medan (Indonesia)
Source: UrbanDataLab, Credit Suisse Last data point: 2021 Source: UrbanDataLab Last data point: 2020
“Home bias” leaves return opportunities unexplored ...

Swiss Real Estate Market 2021 | March 2021 29
estate portfolios of Swiss pension funds – which also takes into account indirect investments – amount to just 12% according to the Credit Suisse Pension Funds Index (equities: 58%). Moreo-ver, the investments of large international real estate companies and real estate investment trusts (REITs) typically focus on a few global metropolises, which are accordingly well covered on the data side. Due to this strong home bias, investors fail to limit exposure to their own domestic market, partic-ularly in late phases of the economic cycle. And due to the systematic neglect of less established but nonetheless strongly growing locations, additional return opportunities are missed. This home bias and the failure to consider less established locations are ultimately a consequence of the dearth of reliable locational information across national borders. In a pilot project with an Asian developer, UrbanDataLab demonstrated for the Medan metropolis (Indonesia) that a price model for apartments can be set up and integrated into applications in just three weeks. As part of implementation, 100 attributes of urban morphology were used and inte-grated into a price model, which facilitated efficient analysis within a very short space of time thanks to machine learning. In this specific case, the model was calibrated using around 12,000 property sale advertisements and then made available as an interface and a map in the application (Fig. 36). In the future, approaches of this kind could significantly improve international portfolio management and location evaluation, thereby giving portfolio managers and companies an edge in the hunt for locations and properties. Conclusion and outlook Urban spaces as well as social norms and behavioral patterns are changing ever more rapidly, eluding standard administrative regulations. It therefore follows that planning regulations can no longer fully define the use of urban space, while new reference planes are increasingly gaining in influence. The reasons for this are multifaceted, and extend from digital interconnectivity (the home as new place of work), to new modes of transport (the final miles by e-scooter or autono-mous vehicle), and to the demographic and economic transformation of society itself. As objects tied by definition to a specific location, real estate will have to lend itself to ever more flexible use as a result, which in turn necessitates a change in mindset on the part of portfolio and property managers: Only active management – such as through repositioning or interim use con-cepts – can respond to changes in demand, and even long-term return forecasts can change rap-idly. This much was becoming clear even in the years prior to COVID-19: Platforms such as Airbnb are now exerting a direct influence on property prices, and sharing economy concepts – think co-working or co-living – are likewise impacting on demand for space. A further catalyst of urban space usage has now manifested itself in the form of the coronavirus pandemic, which is changing the structure of demand. A number of the resulting changes can be expected to endure even after the pandemic has been mastered. Even now, it is becoming apparent that micro-loca-tion will become an even more important factor going forward. The navigation of all these trends requires dynamic tools that can continuously adapt, as well as efficient usage of the available data – in short, integrated real-estate management.
... and is frequently a consequence of a lack of locational information
Locational ratings can be compared across borders with the morphological approach
Technological and social trends are molding the use of space ...
... and call for active data-based real estate management

30 Swiss Real Estate Market 2021 | March 2021
Office property – demand
Demand being recalibrated Demand for office space remains very weak, as companies hold back from renting premises and review the extent to which they can make long-term savings on office costs through home working. Following the difficult economic situation last year caused by COVID-19, hopes are heavily pinned on the success of coronavirus vaccines as 2021 gets under way. However, we do not expect the recovery to prove strong enough to restore Swiss gross domestic product (GDP) to its pre-crisis levels before the end of the year. Thanks to a combination of COVID-19 bridging loans and com-pensation for short-time working, the economic slump has not yet fed through into the labor mar-ket to the same extent. Employment was down just 0.06% year-on-year at the end of the third quarter of 2020. That said, the impact of the pandemic on individual sectors of the economy has differed considerably (Fig. 37). Due to coronavirus restrictions, the most significant decline in em-ployment has been suffered by the hotels and catering industry (-9.3%). By contrast, the IT sector (+4.3%) has benefited greatly from the boost to digitalization. The COVID-19 pandemic is nonetheless greatly suppressing demand for office space. For 2020 and 2021, we are expecting demand to decline by around 700,000 m² (Fig. 38). To a lesser ex-tent, this decline is attributable to the fact that the number of (office) employees has come down as a result of the crisis, and hence less office space is required. But the principal cause of the de-cline is that companies have been focusing on cost savings rather than growth since the crisis broke. Large service providers in particular are looking to see how higher levels of home working will change their requirement for office space. In the medium term, the importance of the office as a place of work is likely to rise again, as the high levels of productivity initially observed in home working are likely to fall back in time due to a lack of “social control” and restricted communication. In addition, productivity is likely to be im-paired by lower innovation output with a home-based workforce, which should refocus attention on the importance of a centralized office. Even before the second wave of infection, there was evi-dence of a slight but steady return to office working – albeit not at the explicit behest of employ-ers. As centralized office working and home working both have their own undisputed advantages, we believe hybrid forms of working will increasingly emerge. As a result, we estimate demand for of-fice space will decline by 15% over the next ten years. However, this fall in demand will be offset by other developments such as economic growth, digitalization, and the tertiarization of industry; hence we believe overall demand for office space will only stagnate in the long term.
Short-time working cushions labor market slump
Demand for office space currently very low
Return to office working in medium term
Demand for space to stagnate in long term
Fig. 37: Sectors affected by COVID-19 to differing degrees Fig. 38: Lower demand for office space Employment growth (annual growth as per end Q3) of selected service providers on a full-time basis
Estimated additional demand compared to prior-year quarter in 1,000 m²; forecasts for Q4 2020 and for 2021
Source: Swiss Federal Statistical Office, Credit Suisse Last data point: Q3/2020 Source: Credit Suisse, Swiss Federal Statistical Office Last data point: Q3/2020
IT
Educ
atio
n
Hea
lthca
re
Soc
ial s
ervi
ces
Pub
lic a
dmin
istra
tion
Ret
ailin
g
Arc
hite
cts/
engi
neer
s
Ban
ks
Terti
ary
sect
or (t
otal
)
Insu
ranc
e
Aut
omot
ive tr
ade
Tota
l
Who
lesa
ling
Bus
ines
s se
rvic
es
Tran
spor
tatio
n/lo
gist
ics
Sec
onda
ry s
ecto
r (to
tal)
Tele
com
mun
icat
ions
Hot
els
and
cate
ring
-10%-9%-8%-7%-6%-5%-4%-3%-2%-1%0%1%2%3%4%5%
Annual growth 2019 – 2020Average annual growth 2015 – 2020
-1,000
-500
0
500
1,000
1,500
2,000
2005
2006
2007
2008
2009
2010
2011
2012
2013
2014
2015
2016
2017
2018
2019
2020
2021
Industry Construction Trading
Transportation Hotels and catering IT/communication
Financial services Business services Health/public services
Rest TotalForecast
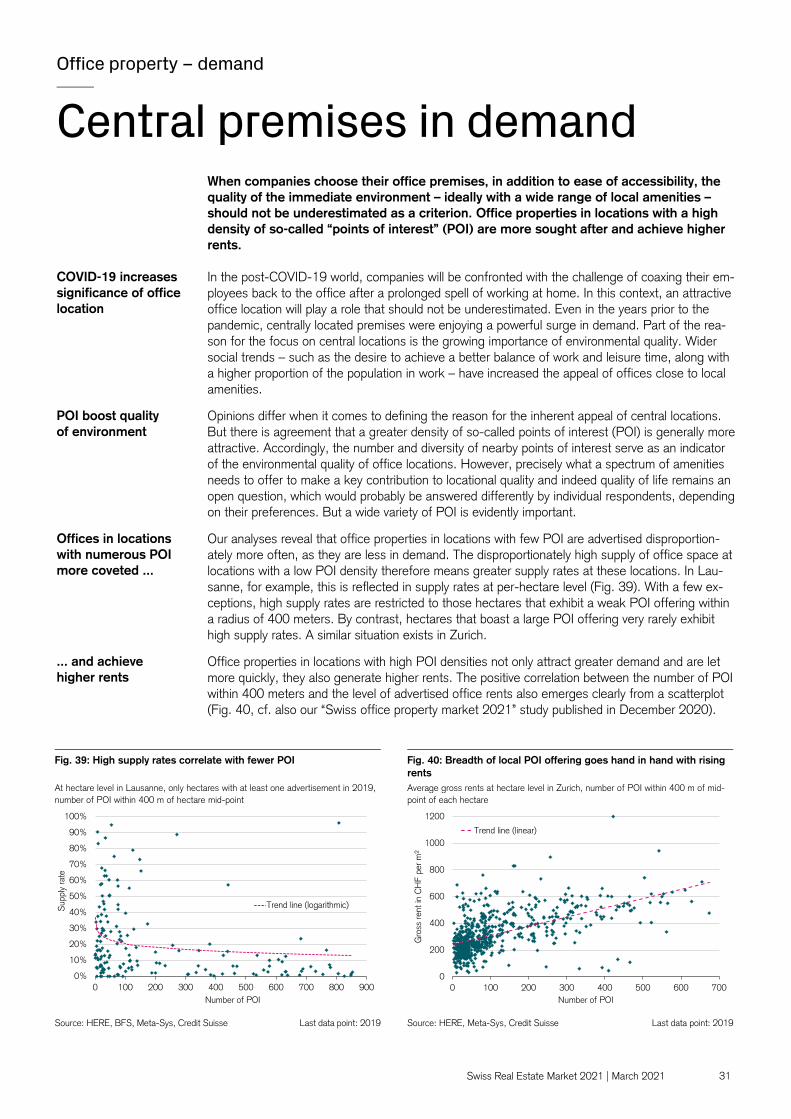
Swiss Real Estate Market 2021 | March 2021 31
Office property – demand
Central premises in demand When companies choose their office premises, in addition to ease of accessibility, the quality of the immediate environment – ideally with a wide range of local amenities – should not be underestimated as a criterion. Office properties in locations with a high density of so-called “points of interest” (POI) are more sought after and achieve higher rents. In the post-COVID-19 world, companies will be confronted with the challenge of coaxing their em-ployees back to the office after a prolonged spell of working at home. In this context, an attractive office location will play a role that should not be underestimated. Even in the years prior to the pandemic, centrally located premises were enjoying a powerful surge in demand. Part of the rea-son for the focus on central locations is the growing importance of environmental quality. Wider social trends – such as the desire to achieve a better balance of work and leisure time, along with a higher proportion of the population in work – have increased the appeal of offices close to local amenities. Opinions differ when it comes to defining the reason for the inherent appeal of central locations. But there is agreement that a greater density of so-called points of interest (POI) is generally more attractive. Accordingly, the number and diversity of nearby points of interest serve as an indicator of the environmental quality of office locations. However, precisely what a spectrum of amenities needs to offer to make a key contribution to locational quality and indeed quality of life remains an open question, which would probably be answered differently by individual respondents, depending on their preferences. But a wide variety of POI is evidently important. Our analyses reveal that office properties in locations with few POI are advertised disproportion-ately more often, as they are less in demand. The disproportionately high supply of office space at locations with a low POI density therefore means greater supply rates at these locations. In Lau-sanne, for example, this is reflected in supply rates at per-hectare level (Fig. 39). With a few ex-ceptions, high supply rates are restricted to those hectares that exhibit a weak POI offering within a radius of 400 meters. By contrast, hectares that boast a large POI offering very rarely exhibit high supply rates. A similar situation exists in Zurich. Office properties in locations with high POI densities not only attract greater demand and are let more quickly, they also generate higher rents. The positive correlation between the number of POI within 400 meters and the level of advertised office rents also emerges clearly from a scatterplot (Fig. 40, cf. also our “Swiss office property market 2021” study published in December 2020).
COVID-19 increases significance of office location
POI boost quality of environment
Offices in locations with numerous POI more coveted ...
... and achieve higher rents
Fig. 39: High supply rates correlate with fewer POI Fig. 40: Breadth of local POI offering goes hand in hand with rising rents
At hectare level in Lausanne, only hectares with at least one advertisement in 2019, number of POI within 400 m of hectare mid-point
Average gross rents at hectare level in Zurich, number of POI within 400 m of mid-point of each hectare
Source: HERE, BFS, Meta-Sys, Credit Suisse Last data point: 2019 Source: HERE, Meta-Sys, Credit Suisse Last data point: 2019
0%
10%
20%
30%
40%
50%
60%
70%
80%
90%
100%
0 100 200 300 400 500 600 700 800 900
Sup
ply
rate
Number of POI
Trend line (logarithmic)
0
200
400
600
800
1000
1200
0 100 200 300 400 500 600 700
Gro
ss re
nt in
CH
F pe
r m²
Number of POI
Trend line (linear)

32 Swiss Real Estate Market 2021 | March 2021
Office property – supply
Supply of space remains high Despite good absorption of space in recent years, the office property supply rate re-mained close to the prior-year level in 2020. Whereas supply has fallen in the (inner) cit-ies, the outer business districts have plenty of surplus space as they confront the con-sequences of the coronavirus crisis. Weak demand for office space will lead to a rise in supply over the coming quarters, dashing hopes of a substantial reduction of available space following the higher demand of the last three years. When the space primarily marketed by brokers or individual websites is also taken into ac-count (some of which has sat on the market for quite some time), the total office space advertised across Switzerland in the summer of 2020 was 3,043,000 m² – a similar level to that of 2019 (Fig. 41). The supply rate, which reflects the availability of space as a proportion of the total office property market, therefore amounted to 5.5%. Thanks to good absorption of office premises in urban centers, supply differences have widened. In the five major centers in particular, there is a striking gap between inner city and peripheral office markets. The stronger demand for centrally situated premises in attractive locations is reflected in the lower supply rates of central and some middle business districts (particularly Zurich, Geneva, and Lausanne), whereas the outer business districts of all large centers are struggling with oversupply (Fig. 42). This divide is likely to widen further going forward. There are also significant differences between individual large and mid-sized centers. Geneva stands out in particular with its very high supply rate of 11.5% (Fig. 44). Demand here is simply not dynamic enough to rectify the oversupply problem. That said, the situation has improved slightly since 2019, when the supply rate stood at 11.9%. The second-highest supply rate of the major centers is to be found in Lausanne (7.9%) – primarily due to the scale of new office prop-erty development in the locality. A substantial amount of office space is currently being freed up in Basel (7.7%), which is driving up the supply rate here. By contrast, space is in short supply in Zurich (7.0%) and Bern (5.7%), especially in the city centers, whereas there is plenty of space awaiting tenants on the periphery of these cities. In Switzerland’s mid-sized centers, supply rates are typically lower than in the large centers (Fig. 44). Office property construction projects are rarely launched in the former without high pre-letting rates or an anchor tenant in place, as the demand for space in these markets is less dy-namic. The only mid-sized centers with a supply rate higher than the Swiss average of 5.5% are Schaffhausen (5.6%), Lugano (5.9%), and Zug (7.8%). The consequences of the ready availabil-ity of capital are thus reflected even in Zug. Despite a reasonable level of demand, the market equilibrium is skewed toward the supply side and dominated by various large-scale projects such as the Quadrolith in Baar.
Center-periphery divide
Geneva exhibits by far the highest supply rate
Supply rates predominantly low in mid-sized centers
Fig. 41: Supply of office space similarly high to 2019 Fig. 42: Oversupply in outer business districts Total of quarterly (online) advertised space (existing stock and newbuilds), in m² Total of quarterly (online) advertised space (existing stock and newbuilds), in m²
Source: Credit Suisse, Meta-Sys Last data point: Q2/2020 Source: Credit Suisse, Meta-Sys Last data point: Q2/2020
0
500,000
1,000,000
1,500,000
2,000,000
2,500,000
3,000,000
3,500,000
2006 2008 2010 2012 2014 2016 2018 2020
Zurich GenevaBern BaselLausanne Outside major centersTotal
0
200,000
400,000
600,000
800,000
1,000,000
1,200,000
1,400,000
1,600,000
1,800,000
2,000,000
2006 2008 2010 2012 2014 2016 2018 2020
Major centers central business district (CBD)Major centers middle business districtMajor centers outer business districtTotal supply

Swiss Real Estate Market 2021 | March 2021 33
Office property – supply
Too much space in the pipeline Starting from relatively low levels building permit issuance rose again in 2020, and given the gloomier prospects for demand this makes an end to high supply rates unlikely. Construction approvals for office property paused for breath in 2019 and declined to their lowest level since 2000, but then increased in 2020 despite COVID-19. In December 2020, the 12-month total stood at CHF 2,145 mn, which is above the long-term average (Fig. 43). The reason for this relatively high level of projected activity, in spite of a comparatively high supply rate, is pri-marily the ongoing low-interest environment, which means low financing costs and limited invest-ment alternatives, thereby providing a strong incentive for investors to buy into newbuild projects. For that reason, building permit issuance only rarely dipped much below its long-term average in the years prior to 2019 too. Ever since the onset of the coronavirus crisis and the resulting boost to home working, investors and developers have increasingly been fretting over the future commercial viability of new office properties. Office property planning activity is thus set to slacken in the future. Moreover, it is pos-sible that a number of planned office developments will not go ahead. That said, the current 12-month total of building permit issuance includes a number of major projects for large companies (e.g. Swiss Re and Helvetia) and for the federal administration in Bern, with a view to amalgamat-ing currently dispersed workforces in single building complexes. These projects will be completed, as owner occupancy eliminates vacancy risk. The individual office markets of Switzerland’s mid-sized and large urban centers are illustrated in Figure 44. The vertical axis illustrates the anticipated future expansion of space, whereby the val-ues indicate the percentage by which construction approvals over the last two years lie either above or below the long-term average. It is apparent that the expected expansion of space in all five major centers is below average, which is above all explained by the low volume of building per-mits issued in 2019. Further information on the situation in the office markets of the individual large centers can be found in our study “Swiss office property market 2021” published in Decem-ber 2020. In most mid-sized centers, planning activity has also long been languishing at low levels. The ex-ceptions are Neuchâtel and Olten, where the anticipated expansion is comparatively high, just like last year. Furthermore, planning activity compared to 2019 has risen above all in the office mar-kets of Winterthur and Zug. In Zug, for example, the two office buildings Suurstoffi 43 and 45 in Rotkreuz and the office building on Grabenstrasse (in Baar) were approved. In Winterthur, the Ri-eter campus (future headquarters of the eponymous textile machine manufacturer) received the go-ahead.
Building permit issuance currently in line with long-term average
Planning activity likely to decline further due to COVID-19
No excessive expansion of space expected in major centers
Construction activity subdued in majority of mid-sized centers too
Fig. 43: Office construction activity set to fall back once again Fig. 44: Anticipated expansion for the most part below average Building permits and planning applications, moving 12-month total, in CHF mn Circle circumference: total office space; expansion (y-axis): building permits
2019/2020 compared to long-term average; supply rate as % of total space 2020
Source: Baublatt, Credit Suisse Last data point: 12/2020 Source: Credit Suisse, Meta-Sys, Baublatt Last data point: 11/2020
0
500
1,000
1,500
2,000
2,500
3,000
3,500
4,000
1995 1998 2001 2004 2007 2010 2013 2016 2019
New construction permits New construction applications Conversion permits Conversion applications New construction permits, average Conversion permits, average

34 Swiss Real Estate Market 2021 | March 2021
Office property – market outcome
Center-periphery divide widens The negative effects of the COVID-19 pandemic have yet to really feed through into the official office vacancy statistics. Overall, vacancies are at the same level as 2019, but should rise over the next few quarters. The repercussions of the COVID-19 pandemic for Switzerland’s office property markets are for the most part not yet visible in vacancy rates. Although the reference date (June 1, 2020) came after the first lockdown, the effects of such crises typically only feed through into the office prop-erty market with a certain time lag. Office vacancy rates are therefore at similar levels to those of 2019 (Fig. 45). However, major differences are apparent in the regions and cities included in the statistics, with Canton Geneva having published no vacancy data at all last year due to the difficult COVID-19 situation. There was a decline in vacancies in 2020 above all in the city of Zurich (-23%) and in Canton Vaud (-19%), where the market recovery in place prior to the onset of COVID-19 is quite evident. Indeed, Zurich reported its sixth decline in succession since 2014 (total decline of 61%). In cen-tral locations, vacancies typically declined even more sharply last year. In Zurich’s central business district (CBD) they declined by 40%, and in the district of Lausanne by 27%. At the moment, Canton Basel-Landschaft (-19%) is faring better than Basel-Stadt (+24%). Significant rises in of-fice vacancies are also apparent in Canton Neuchâtel (+74%) and the city of Bern (+78%). How-ever, while vacancies have surged in these cities they have done so from relatively low levels, with both areas having benefited from an impressive decline in vacancies between 2018 and 2019. In the office markets under review, rents have developed broadly in step in recent years. Following a period of sideways movement, rents rose strongly in the second half of 2019 in particular (Fig. 46), following the recovery in office property demand in previous years. Between the second and fourth quarters of 2019, the city of Geneva recorded the strongest rise in rents (+6.3%) and the city of Lausanne the weakest (+4.1%). In 2020, however, these upward movements were ab-ruptly halted by the COVID-19 outbreak. This year, the decline in demand for office property is increasingly likely to feed through into rising vacancy rates and declining rents, as construction activity broadly in line with the long-term aver-age when demand is weak leads to overcapacity. At less central locations, the difficult current sit-uation is only likely to deteriorate, particularly in the outer business districts of the urban centers. In central locations we expect the repercussions to be much less severe. As such, the already striking divide in respect of supply, vacancies, and rental prices between the centers and the pe-ripheries of Switzerland’s office property markets is likely to widen further over the next few years.
Vacancies overall at 2019 level
Significant decline in vacancies in Zurich, Lausanne, and Basel-Landschaft
An end to rent rises
COVID-19 likely to lead to higher vacancies and lower rents
Fig. 45: Office vacancy levels unchanged from 2019 Fig. 46: An end to the rise in office rents Vacant office space as per June 1, in thousand m² Hedonic rental price index on the basis of signed contracts, index: 2005 = 100
* Canton Geneva published no vacancy data in 2020 due to COVID-19. Source: Various statistical sources, Credit Suisse Last data point: 06/2020
Source: Wüest Partner, Credit Suisse Last data point: Q4/2020
0
100
200
300
400
500
600
700
1996 1998 2000 2002 2004 2006 2008 2010 2012 2014 2016 2018 2020
City of Zurich Canton of Basel-StadtCanton of Basel-Landschaft City of BernCanton of Neuchâtel Canton of VaudCanton of Geneva*
90
100
110
120
130
140
150
160
2005 2007 2009 2011 2013 2015 2017 2019
City of ZurichCity of GenevaCity of LausanneBasel regionBern regionRest of Switzerland

Swiss Real Estate Market 2021 | March 2021 35
Heading 1 – chapter title
Outlook Büroflächen Heading 3 – lead text Text text text
1,000,000
600,000
200,000
1,200,000
800,000
400,000
35Swiss Real Estate Market 2021 | March 2021
• Demand collapses due to wait-and-see approach of many companies
• Demand brake not likely to be released until H2 2021
2021: Demand for premises weak
• Temporary reduction in space increase, as building permit issuance has been below long-term average until recently
• Planning activity at current level too high for sluggish demand
2021: Below-average construction activity
Additional demand for office space (in 1,000 m²) Building permits for office space (in CHF mn, 12 months)
Demand applies the brakesOffice property – outlook 2021
• COVID�-19�crisis�not�yet�reflected�in�2020�vacancy levels
• Decline in Zurich, Lausanne, and Basel-Landschaft in 2020, above all in central locations
2021: Increase in vacancies
• Rises in rents come to an end in 2020 in all�five�large�centers
• Rents expected to decline in 2021, above all�on�the�periphery�of�office�markets� (inner cities: sideways movement)
2021: Growing pressure on rents
Vacancies Rental prices (contractual rents)
Demand Supply
• Supply�rate�rises�slightly�to�5.5%• �Stronger�development�in�inner�cities�compared�to�office�markets�
based on the periphery of large centers
Price and vacancy gap between center and periphery grows
• Inner cities exhibit low supply rates• The large centers of French-speaking Switzerland, particularly Geneva, are struggling with higher supply rates than those of German-speaking Switzerland
Gap between inner and outer office markets to widen further
Advertised office space In m2
Supply rates 2020 By degree of centrality
2009 2011 2013 2015 2017 20190
1500
1000
500
–500
–1000
0
2005 2007 2009 2011 2013 2015 2017 2019 2021
Long-term average
3500
3000
2500
2000
1500
1000
500
02005 2007 2009 2011 2013 2015 2017
2020 und 2021 – 700,000 m2
2019
2020 CHF 2,145 mn
Long-term average
Large centers: central business districts middle business districts outer business districts
French-speaking Switzerland(Geneva, Lausanne)
German-speaking Switzerland
(Zurich, Bern, Basel)
6%central business districts
3%central business districts
7%middle business districts
5%middle business districts
15%outer business districts
11%outer business districts
CRED_Ausblick2021_Fazitseiten_EN_210202.indd 35 04.02.21 15:33

36 Swiss Real Estate Market 2021 | March 2021
Digital real estate – Internet of Things (IoT)
IoT changes office use New technologies based on the Internet of Things (IoT) are facilitating innovative solutions for the management of office buildings. The benefits include the more efficient use of premises, improved air quality, and better services. In a similar way, IoT technologies are also being used in the development of “smart cities”. Over the last few years, the digitalization trend has established itself in almost all walks of life. The outbreak of the coronavirus pandemic and the subsequent surge in demand for digital solutions have accelerated this trend dramatically. Office buildings have also been affected, particularly as changing work habits are allowing greater flexibility in terms of work location and working hours. Start-ups such as the Zurich-based proptech company Akenza are developing innovative platforms based on the Internet of Things (IoT) for the management of office premises, thereby helping of-fice property owners and managers meet the new requirements being made of office space. The IoT essentially enables almost any physical or virtual object to be connected to and communi-cate with another object via a network. IoT users have already proved that the use of connected devices opens up new horizons for business processes and models, as well as for smart products and services. The interconnectedness and integration of things facilitate the development of inno-vative solutions for any number of key challenges of the modern world. Building an IoT solution is a complex undertaking, however. Akenza has therefore built an IoT plat-form that allows companies and indeed entire cities to easily develop their own smart solutions. The platform acts as a bridge between the physical world and the cloud. It makes it possible to connect very different types of sensors (e.g. for monitoring air quality, human presence, and tem-perature) via different technologies (e.g. LoRaWAN, NB-IoT, LTE-M, 5G) and manage the result-ing data in a single location such as a public or private cloud (Fig. 47). The corresponding data can then be visualized directly on the platform itself or in an app. This in turn enables users from all kinds of different areas (such as transportation, retail, healthcare) to develop their own intelli-gent solutions with minimal IT knowledge. An area where IoT can deliver numerous efficiency gains is facility management. The management of office premises is becoming increasingly complex for facility managers, particularly as tenants have been seeking greater working flexibility since the outbreak of COVID-19. The installation of occupancy sensors, for example, can help with the management of office premises and provide employees with a better working environment. For example, infrared sensors can be fitted to desks or in meeting rooms. The sophisticated business intelligence module designed by Akenza can read the data from thousands of sensors, and then display this in user-defined office maps to provide a real-time snapshot of both desk and room occupancy, as well as the corresponding KPIs on their usage (Fig. 48). Employees and departmental heads can therefore see where desks are
Requirements of office properties are changing
Internet of Things (IoT) offers innovative solutions
IoT platform as key to integration of “things”
Optimization of office buildings
Fig. 47: Akenza’s IoT technology Fig. 48: “Desk occupancy” digital signage
Principal components Red markings indicate occupied desks
Source: Akenza Source: Akenza

Swiss Real Estate Market 2021 | March 2021 37
free on the corresponding electronic screens. Tools of this kind are popular with companies as they help employees with the changeover to flexible desk-sharing models. Such models could be-come more widely accepted and promoted as a result. The monitoring of office premises facilitates the identification of unexploited space potential, which can in turn reduce the total amount of space required. Through the tracking of desk and meeting room occupancy, statistics can be produced that can help evaluate optimization potential (Fig. 49). Based on these evaluations, empty or underused meeting rooms or collaborative working areas can be eliminated, and new space usage concepts validated. For example, one client of Akenza had an ongoing problem of insufficient meeting rooms. With the help of occupancy monitoring, it was identified that the company’s meeting rooms were not actually being used in 20% of book-ings. This gave the client a crucial insight into the need to optimize internal processes. Another ex-ample of the use of Akenza’s IoT technology was the new global headquarters of Zurich Insurance Group. As part of an overall renovation, building monitoring and other facility management func-tionalities were implemented to increase the convenience and wellbeing of employees and visitors alike. The importance of a healthier office environment for the wellbeing of a workforce has become particularly apparent since the outbreak of COVID-19. Recent studies2 have shown that the level of carbon dioxide (CO2) indoors can impair a person’s wellbeing and ability to perform. Poor air quality due to high concentrations of CO2 has been linked to detrimental cognitive effects such as poor decision-making, a lack of focus, and drowsiness. Humans typically start exhibiting physical effects at concentrations of 900 parts per million (ppm) – by way of comparison, outdoor air typi-cally has a CO2 concentration of around 400 ppm. Indeed, there have been frequent recordings of indoor office concentrations in excess of 1,000 ppm, with peaks of over 2,000 ppm. In order to tackle this problem, companies need to be able to measure air quality on their own premises. Dedicated climate monitoring sensors can be used to track CO2 levels, temperature, and humidity in indoor areas (Fig. 50). An IoT platform monitors air quality continuously and reacts automatically when a set of predefined rules has been met. The corresponding alert can be transmitted via text, email, or visual notification (e.g. change in the color of a connected source of light). In an ideal scenario, the IoT system will be connected to the facility management system that operates the window blinds and ventilation system. As home working and flexible working hours have become more widespread, facility managers also need to adapt to greater fluctuation in the usage of washrooms and common areas. IoT solu-tions can help here. For example, magnetic sensors can count the number of times a door opens and therefore track toilet usage. This makes it easier to manage cleaning cycles and optimize per-sonnel deployment. In addition, “service-on-demand” solutions are an efficient tool for increasing service quality and efficiency. Service-on-demand is based on a very simple piece of hardware: a connected button (Fig. 51): By touching the button, clients and employees can notify personnel and trigger a predefined process. The potential areas of application are almost limitless, extending from cleaning to reporting a faulty printer or triggering an alarm. By integrating buttons of this kind into workflow reporting, processes can be automated, reactions to a delicate situation accelerated, and satisfaction levels of employees improved. To bring this technology speedily to a wide variety of clients, Akenza has teamed up on a long-term basis with ISS, one of the world’s largest facility management companies, to make plug&play IoT applications available to ISS clients.
2 Kristopher B. Karnauskas, 2019: Fossil fuel combustion is driving indoor CO2 toward levels harmful to human cognition, GeoHealth, Research Article (https://doi.org/10.1029/2019GH000237)
Saving on office space
Air quality important to employee wellbeing
IoT delivers services more rapidly, expediently, and efficiently
Fig. 49: “Desk occupancy” dashboard Fig. 50: “Indoor climate” dashboard
Data on the use of desks Data on the climate situation in rooms
Source: Akenza Source: Akenza
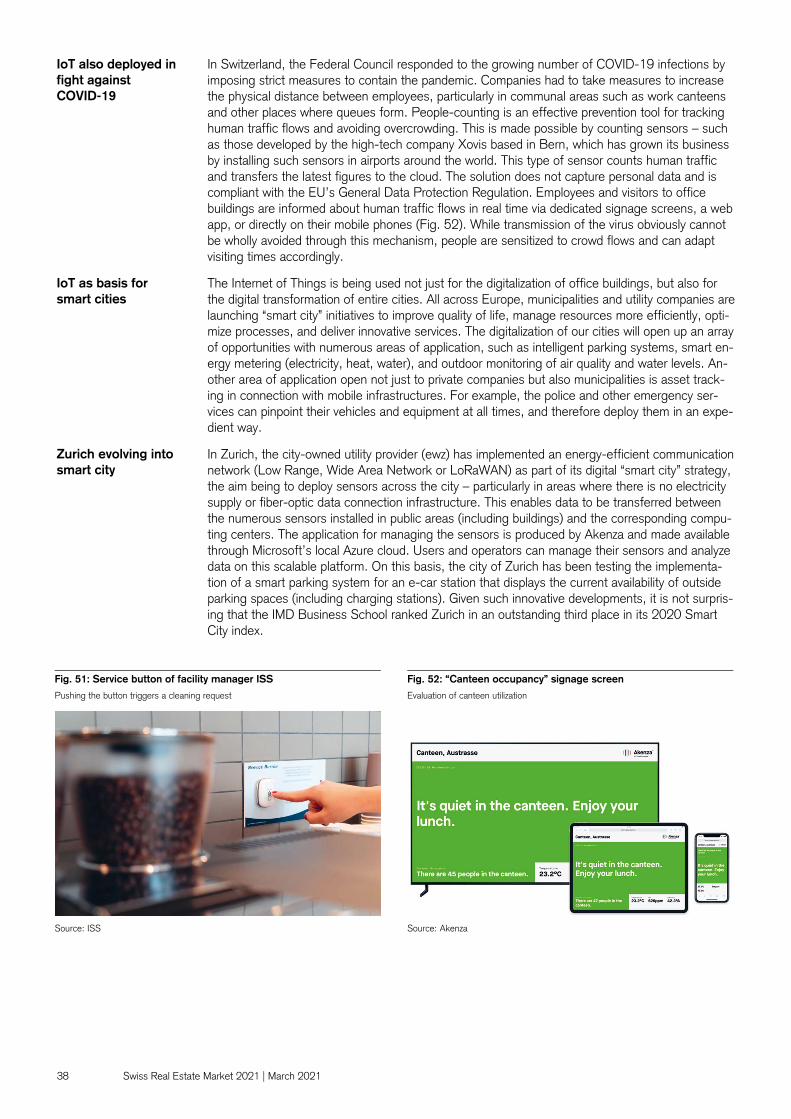
38 Swiss Real Estate Market 2021 | March 2021
In Switzerland, the Federal Council responded to the growing number of COVID-19 infections by imposing strict measures to contain the pandemic. Companies had to take measures to increase the physical distance between employees, particularly in communal areas such as work canteens and other places where queues form. People-counting is an effective prevention tool for tracking human traffic flows and avoiding overcrowding. This is made possible by counting sensors – such as those developed by the high-tech company Xovis based in Bern, which has grown its business by installing such sensors in airports around the world. This type of sensor counts human traffic and transfers the latest figures to the cloud. The solution does not capture personal data and is compliant with the EU’s General Data Protection Regulation. Employees and visitors to office buildings are informed about human traffic flows in real time via dedicated signage screens, a web app, or directly on their mobile phones (Fig. 52). While transmission of the virus obviously cannot be wholly avoided through this mechanism, people are sensitized to crowd flows and can adapt visiting times accordingly. The Internet of Things is being used not just for the digitalization of office buildings, but also for the digital transformation of entire cities. All across Europe, municipalities and utility companies are launching “smart city” initiatives to improve quality of life, manage resources more efficiently, opti-mize processes, and deliver innovative services. The digitalization of our cities will open up an array of opportunities with numerous areas of application, such as intelligent parking systems, smart en-ergy metering (electricity, heat, water), and outdoor monitoring of air quality and water levels. An-other area of application open not just to private companies but also municipalities is asset track-ing in connection with mobile infrastructures. For example, the police and other emergency ser-vices can pinpoint their vehicles and equipment at all times, and therefore deploy them in an expe-dient way. In Zurich, the city-owned utility provider (ewz) has implemented an energy-efficient communication network (Low Range, Wide Area Network or LoRaWAN) as part of its digital “smart city” strategy, the aim being to deploy sensors across the city – particularly in areas where there is no electricity supply or fiber-optic data connection infrastructure. This enables data to be transferred between the numerous sensors installed in public areas (including buildings) and the corresponding compu-ting centers. The application for managing the sensors is produced by Akenza and made available through Microsoft’s local Azure cloud. Users and operators can manage their sensors and analyze data on this scalable platform. On this basis, the city of Zurich has been testing the implementa-tion of a smart parking system for an e-car station that displays the current availability of outside parking spaces (including charging stations). Given such innovative developments, it is not surpris-ing that the IMD Business School ranked Zurich in an outstanding third place in its 2020 Smart City index.
IoT also deployed in fight against COVID-19
IoT as basis for smart cities
Zurich evolving into smart city
Fig. 51: Service button of facility manager ISS Fig. 52: “Canteen occupancy” signage screen
Pushing the button triggers a cleaning request Evaluation of canteen utilization
Source: ISS Source: Akenza

Swiss Real Estate Market 2021 | March 2021 39
Retail property
A bad start to the year for retail Changes in mobility behavior that will translate into less footfall even after COVID-19 are likely to accelerate the structural change in bricks-and-mortar retailing. This phenomenon is also being driven by the pandemic-instigated shift in sales to the online channel.
The stationary retail trade has endured a very bad start to the year. High infection rates and fears of mutant versions of coronavirus have led to a second lockdown for non-essential goods retailers. Mobility in Switzerland has not slumped as dramatically as it did during the first lockdown (Fig. 56), since schools are to be kept open as long as possible, certain service businesses have remained open (e.g. hair salons), and people have learned how to cope with the virus in their day-to-day lives (masks, physical distancing). But although the months of January and February are typically low in revenues, the potentially prolonged lockdown phase could have a serious impact on the non-food sector, whereas the food segment is benefiting from the closure of restaurants and empty canteens.
In other words, 2021 has kicked off in the topsy-turvy manner that characterized the whole of 2020. A look back at last year helps to give a better idea of the consequences of the latest lock-down. After the first lockdown, in which shops remain closed for almost two months and suffered appalling slumps in sales, the retail trade recorded a surprisingly strong recovery (Fig. 53). Overall, nominal sales last year rose by 7.2% in the year-on-year comparison – a growth rate not seen for decades.
Following a relatively stable start to 2020 (Phase 1, Fig. 54), sales in the food segment then picked up strongly toward the end of February. A dramatic spike in COVID-19 infections and the first cases in Switzerland then prompted consumers to start hoarding products. The closure of borders, all bars and restaurants, and large parts of the non-food retail trade by the Federal Coun-cil from March 17, 2020 ushered in a second phase that could hardly have affected the various segments more differently. For food retailers, the competition from bars, restaurants, and cross-border shopping was suddenly removed from the equation. Between March and May, the sales of the food and near-food segment recorded a rise of some 20%. Although food sales then drifted down slightly once restaurants and bars were able to open from May 11 and country borders were reopened on June 15, they remained above pre-crisis levels (Phase 3). And as a second wave of infection began to build in the fall, food sales then resumed their upward trajectory (Phase 4). The closure of restaurants as well as cultural, sporting and leisure facilities from December 22 is likely to have boosted food sales to a similar extent as during the first wave.
Second lockdown hits non-food retailers
Abnormal sales growth in the topsy-turvy year of 2020
Lockdown eliminates competition of food retailers
Fig. 53: Surprising sales growth in retailing in 2020 Fig. 54: Yo-yo trajectory of retail sales by area Nominal retail sales growth (seasonally and number-of-sales-days adjusted) Nominal retail sales, indexed (Jan. 2012 = 100), seasonally adjusted
Source: GfK, Credit Suisse Last data point: 12/2020 Source: GfK, Credit Suisse Last data point: 12/2020
-20%
-15%
-10%
-5%
0%
5%
10%
15%
Tota
l
Food
/nea
r-fo
od
Non
-foo
d
Clo
thin
g/sh
oes
Per
sona
l car
e an
d he
alth
Hou
seho
ld a
nd li
ving
Hom
e el
ectro
nics
DIY
/gar
deni
ng/a
uto
acce
ssor
ies
Leis
ure
2016 2017 2018 2019 2020
Non-Food
40
60
80
100
120
140
160
09/2019 11/2019 01/2020 03/2020 05/2020 07/2020 09/2020 11/2020
Total Food/near-food Non-food
Phase 1 Phase 3Phase 2 Phase 4

40 Swiss Real Estate Market 2021 | March 2021
In the non-food area, by contrast, the shutdown of the stationary sales channel from mid-March to mid-May led to a historic year-on-year collapse in sales in March (-21%) and April (-40%, Fig. 54). In May, the fine weather and a catch-up effect following the reopening of stores trig-gered a sales boom, above all in the DIY/garden/auto accessories (full-year: +10.3%) and leisure (+8.3%) segments, which manifested itself in record-high sales increases of almost 58% and 45% respectively. For the year as a whole, there were also strong rises in the personal care and health (+7.7%) and home electronics (+10.2%) segments. Overall, this helped the non-food seg-ment to record a sales rise of 23% in May. During the third and fourth phases too, the above-mentioned areas developed well, with the result that the non-food segment ultimately recorded an annual sales rise of 2.7%.
But this aggregated picture of retail segments conceals a number of very different developments. According to a survey of retailers and manufacturers carried out by Fuhrer & Hotz, more than a third performed above their budgeted level, whereas 46% fell short. Polarization of this kind has not been seen at any other point in the last decade. The contrast is particularly apparent in the clothing/shoes area, which suffered a full-year slump in sales of 15.4%. Also among the losers were jewelry, watch, and cosmetics stores, which missed out not only on the steady stream of of-fice workers, but most crucially on foreign tourists. The difference in profitability figures is less pronounced, which can be explained by government support measures (e.g. compensation for short-time working), among other things.
The rapid recovery of the retail trade is not a purely Swiss phenomenon – neighboring countries recorded similar developments. In Germany, the retail trade recorded a nominal sales increase of 5.3% over the same period. Unlike in its neighboring countries, however, retail trade sentiment had risen well above pre-crisis levels by the end of 2020, buoyed by the higher sales figures.
Over the last year, consumers have concentrated their spending above all in Switzerland. A combi-nation of the slump in foreign holidays and the effective ban on cross-border shopping in the wake of border closures had the effect of rerouting a huge proportion of purchases that would normally be made abroad back to Switzerland. In the case of cross-border shopping (“retail tourism”), the value of Swiss purchases abroad slumped by 25%. But there was also evidence of a rerouting of consumer spending within Switzerland itself: As households spent much less on concerts, sporting events, restaurant meals, etc., they had more income at their disposal to spend on traditional re-tail. Shopping – be it in-store or online – was one of the few leisure activities that was possible and relatively safe for the great majority of the year.
The pandemic nonetheless changed consumer purchasing behavior. Consumers are now purchas-ing less often, but in greater volumes when they do. Particularly in demand are products for living and working at home, whereas there is barely any demand for office clothing or clothes to go out in. Fewer spontaneous/opportunistic purchases are being made – above all because mobility pat-terns have changed. As mobility behavior plays a key role in the world of shopping, we have sub-jected the pandemic’s influence on mobility to special analysis.
Lockdowns have drastic consequences for non-food
Strong polarization
Rapid recovery not just a Swiss phenomenon
Drivers of the strong sales growth in 2020
Changed purchasing behavior
Fig. 55: Slump in worker/student commuting activity Fig. 56: Disproportionate decline in use of public transport Proportion of persons commuting to a fixed place of work/education in % 7-day average relative to the starting value (0%) for the period 10.01. – 29.02.2020
Source: intervista Last data point: 31.01.2021 Source: intervista Last data point: 31.01.2021
0%
10%
20%
30%
40%
50%
60%
01/2020 03/2020 05/2020 07/2020 09/2020 11/2020 01/2021-100%
-80%
-60%
-40%
-20%
0%
20%
40%
01/2020 03/2020 05/2020 07/2020 09/2020 11/2020 01/2021
Motor vehicle Public transport On foot Other

Swiss Real Estate Market 2021 | March 2021 41
Repercussions of lockdown for mobility behavior During the first lockdown, a significant proportion of the population either did not work, or worked from home. As a result, the proportion of commuters almost halved (Fig. 55). In the second, par-tial lockdown from January 18, 2021, non-essential stores have remained closed. Restaurants as well as cultural, sporting, and leisure facilities were forced to close just before Christmas. By con-trast, educational institutions (with the exception of universities) have remained open, as have cer-tain providers of personal services such as hair salons (true as of start of February 2020). In order to model the repercussions of the various scenarios for frequencies, we have been given access to the simulation technology of Senozon AG, an engineering company with offices in Zur-ich and Berlin that specializes in the model-based calculation of frequencies. For the illustration of frequencies during the initial lockdown, when non-food businesses as well as educational estab-lishments were closed, we have assumed for the purposes of the model calculations that only 50% of workers and no pupils/students at all were commuting. Based on these assumptions, per-hectare pedestrian frequencies work out some 30–70% lower than usual (Fig. 57). In a few areas, a decline as high as 80% can be discerned. The decline is more pronounced in urban areas than in rural regions, where the decline per hectare works out at 35–50%. This makes sense insofar as universities, universities of applied science, and secondary schools are typically located in towns or cities. Switzerland’s inner cities, home to numerous office buildings and providers of personal services, were also much less visited during the first lockdown. By contrast, the decline in per-hectare pedestrian frequencies in residential districts and in rural regions was much less stark, as these are primarily the areas in which people live. The difference between town and country is no longer so clearly visible once the return of stu-dents to their educational establishments and a 50% decline in the number of workers based at home is fed into the model. The slump in per-hectare pedestrian frequencies in this scenario of a partial lockdown – which broadly corresponds to the situation of the second lockdown from Janu-ary 18, 2021 onward – in most cases still amounts to between 20% and 50%. The partial lock-down leads to a more even reduction in mobility in towns and cities, which means the differences between inner-city and residential districts are no longer so clearly apparent (Fig. 57). Only at purely commercial sites is a slump of more than 50% still evident. In addition to pedestrian frequencies, car passenger frequencies also decline. According to the model, the partial lockdown leads to a decline of between 25% and 45% in per-hectare car pas-senger frequencies. Furthermore, vehicle traffic appears to be clustered along the main axes, i.e. the decline is more tangible on the roads of residential districts than on major roads. While a direct town-country comparison once again works out in favor of the former, there are still differences evident within urban centers themselves. Inner-city areas record a greater slump in per-hectare car passenger frequencies than areas on the periphery. In the former, the modeled lockdown leads to a decline in per-hectare car passenger frequencies of up to 70%. Once again, the model implies that residential districts are less severely affected. By contrast, given the epidemiological situation, the use of public transport (PT) was significantly down during the second lockdown (Fig. 56). In a post-coronavirus scenario, in which the proportion of home working is determined individually by the sector in question and the income level of employees, the decline in per-hectare pedestrian frequencies amounts to between 5% and 30%. Here we see how urban areas such as St. Gallen, for example, are more greatly affected than rural regions. Within the cities themselves, the decline in footfall is less pronounced in residential areas than it is in districts with a particularly high pro-portion of office buildings, or in mixed areas. In St. Gallen, the inner city experiences a slump in per-hectare pedestrian frequencies of between 20% and 30%. The same is true for the area around the university. In other words, it is likely that – even when the pandemic is over – pedes-trian footfall and spontaneous purchases will tend to increase in residential districts but decline slightly in city centers, above all in districts that are home to numerous office complexes. The de-cline in rural communities is likely to be some 5% to 10% lower across the board.
Mobility behavior changes
Applying Senozon’s simulation technology
Hard lockdown saw pedestrian frequencies more than halve
Partial lockdown cut frequencies by around a third
Lockdown also reduces car passenger frequencies
Post-coronavirus: Frequencies will not recover fully

42 Swiss Real Estate Market 2021 | March 2021
In the case of per-hectare car passenger frequencies, the post-coronavirus scenario envisages a decline of between 5% and 25%. Here too, there is a significant difference between town and country. Whereas the decline on rural roads amounts to around 5% to 10%, it is much more ap-parent on key urban transport axes, namely 15% to 25%. Inner-city areas are particularly hard-hit. The analysis of per-hectare car passenger frequencies provides important findings for retailers with businesses on key transport axes or major streets, and whose consumers travel by car. Ac-cording to the model, sites on major or connecting roads are likely to suffer the least from reduced mobility. In urban areas, the negative repercussions are likely to be less keenly felt on the periph-ery and in outer suburbs than in the city center.
From this modeling process it can be inferred that frequencies in the post-COVID-19 era will not return to pre-crisis levels. Higher levels of home working will reduce pedestrian frequencies by be-tween 5% and 30%, and the frequencies of drivers by between 5% and 25%. The reduced num-ber of employees in the office will above all weigh on spontaneous and opportunistic purchases, which are likely to be less numerous in the inner cities in particular. But as people spend less money in the inner city, the outer urban areas and rural regions are set to benefit. By contrast, regular purchases at the local supermarket or shopping mall are unlikely to be threatened. Shop-ping malls, whose catchment areas rely much more heavily on local residents than on local work-ers, can be expected to benefit most of all. The greater their relative appeal compared to other shopping centers, the greater this benefit will be. In other words, the reduction in mobility will favor shopping locations that can function as a one-stop shop. Due to their strong pulling power, the key high streets are likewise likely to suffer less than other inner-city shopping areas. Local shops will also be among the winners of the reduction in mobility entailed by greater home working, whereas stationary retailers typically frequented by consumers on their way home from work will be at a disadvantage. A similar effect will arise due to the efforts of consumers to increasingly do their shopping on foot or by bike, with a view to doing their bit for climate protection.
If COVID-19 had occurred just a few years ago, consumers would simply have had to do without many of their desired goods, whereas during the 2020 lockdown they were able to switch seam-lessly to the online channel. The consequence was an unprecedented flood of parcels, with logis-tics operators working close to the point of system collapse. Over 2020 as a whole, online traders are likely to have booked a year-on-year sales increase of 35% across all ranges (Fig. 58). Of this figure, around 10% is likely to have been structural growth (as in previous years), with 25% at-tributable to COVID-19. As a result of the online boom, Swiss Post delivered 23% more parcels last year. The repeated lockdown of bricks-and-mortar retailers therefore drove a large number of new customers into the arms of online traders. This is likely to have lasting consequences. Some brick-and-mortar retailers have kept their stores open during the partial lockdown in early 2021 despite losses, in order to remind clients of their presence. But the risk of customers who have headed elsewhere due to COVID-19 never coming back is very real. Even in the summer of 2020, following the reopening after the first lockdown, online purchases continued to record a year-on-year rise of 30%.
Post-coronavirus: Average frequency declines of 15% to 20% expected
Consequences for stationary retail
Online retailing surges ahead
Fig. 57: Mobility to be reduced even in a post-COVID-19 world Fig. 58: Diverging sales development of online and offline trade Frequencies in % of pre-coronavirus level by scenario Nominal sales growth in retailing (*estimate)
Source: Senozon, Credit Suisse Source: GfK, Association of Swiss Commerce, Credit Suisse Last data point: 2020
0%
10%
20%
30%
40%
50%
60%
70%
80%
90%
100%Lockdown Partial lockdown Post-coronavirus
Ped
estri
ans
urba
n
Ped
estri
ans
rura
l
Car
pas
seng
ers
Car
pas
seng
ers
urba
n
Car
pas
seng
ers
rura
l
Ped
estri
ans
urba
n
Ped
estri
ans
urba
n
Ped
estri
ans
rura
l
Ped
estri
ans
rura
l
-5%
0%
5%
10%
15%
20%
25%
30%
35%
Retail trade total Online trade Stationary trade
2020*
2015 – 2019
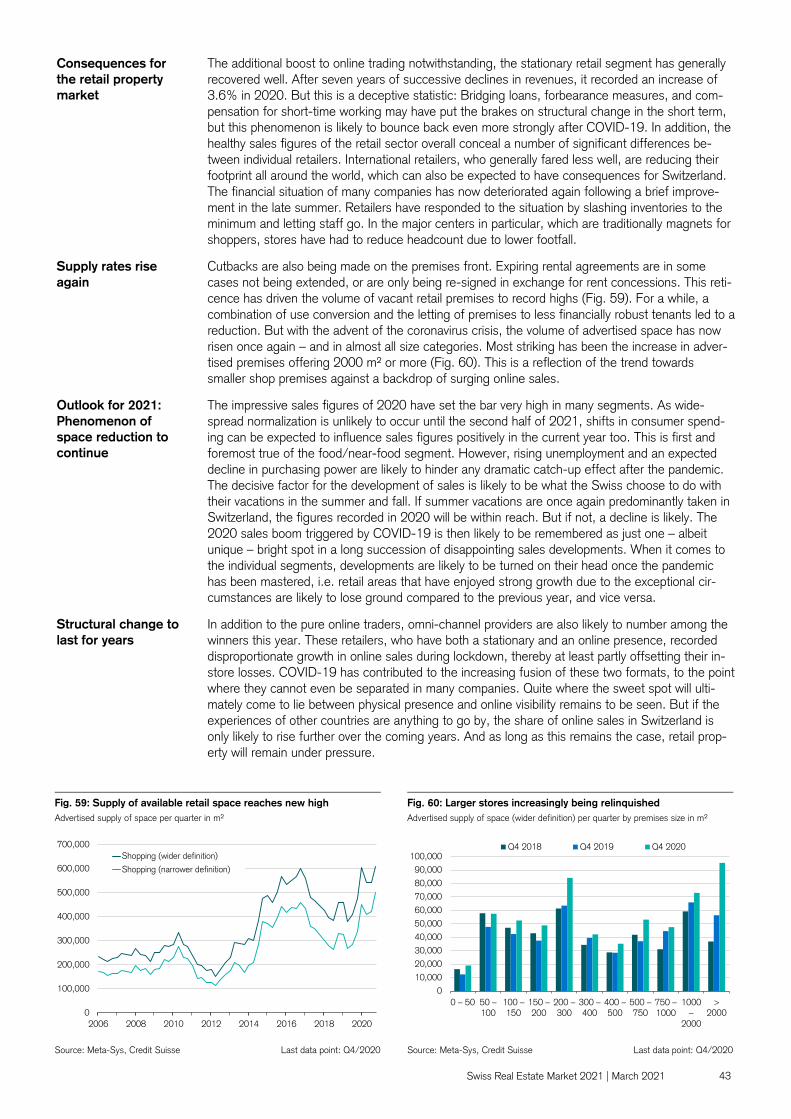
Swiss Real Estate Market 2021 | March 2021 43
The additional boost to online trading notwithstanding, the stationary retail segment has generally recovered well. After seven years of successive declines in revenues, it recorded an increase of 3.6% in 2020. But this is a deceptive statistic: Bridging loans, forbearance measures, and com-pensation for short-time working may have put the brakes on structural change in the short term, but this phenomenon is likely to bounce back even more strongly after COVID-19. In addition, the healthy sales figures of the retail sector overall conceal a number of significant differences be-tween individual retailers. International retailers, who generally fared less well, are reducing their footprint all around the world, which can also be expected to have consequences for Switzerland. The financial situation of many companies has now deteriorated again following a brief improve-ment in the late summer. Retailers have responded to the situation by slashing inventories to the minimum and letting staff go. In the major centers in particular, which are traditionally magnets for shoppers, stores have had to reduce headcount due to lower footfall. Cutbacks are also being made on the premises front. Expiring rental agreements are in some cases not being extended, or are only being re-signed in exchange for rent concessions. This reti-cence has driven the volume of vacant retail premises to record highs (Fig. 59). For a while, a combination of use conversion and the letting of premises to less financially robust tenants led to a reduction. But with the advent of the coronavirus crisis, the volume of advertised space has now risen once again – and in almost all size categories. Most striking has been the increase in adver-tised premises offering 2000 m² or more (Fig. 60). This is a reflection of the trend towards smaller shop premises against a backdrop of surging online sales. The impressive sales figures of 2020 have set the bar very high in many segments. As wide-spread normalization is unlikely to occur until the second half of 2021, shifts in consumer spend-ing can be expected to influence sales figures positively in the current year too. This is first and foremost true of the food/near-food segment. However, rising unemployment and an expected decline in purchasing power are likely to hinder any dramatic catch-up effect after the pandemic. The decisive factor for the development of sales is likely to be what the Swiss choose to do with their vacations in the summer and fall. If summer vacations are once again predominantly taken in Switzerland, the figures recorded in 2020 will be within reach. But if not, a decline is likely. The 2020 sales boom triggered by COVID-19 is then likely to be remembered as just one – albeit unique – bright spot in a long succession of disappointing sales developments. When it comes to the individual segments, developments are likely to be turned on their head once the pandemic has been mastered, i.e. retail areas that have enjoyed strong growth due to the exceptional cir-cumstances are likely to lose ground compared to the previous year, and vice versa. In addition to the pure online traders, omni-channel providers are also likely to number among the winners this year. These retailers, who have both a stationary and an online presence, recorded disproportionate growth in online sales during lockdown, thereby at least partly offsetting their in-store losses. COVID-19 has contributed to the increasing fusion of these two formats, to the point where they cannot even be separated in many companies. Quite where the sweet spot will ulti-mately come to lie between physical presence and online visibility remains to be seen. But if the experiences of other countries are anything to go by, the share of online sales in Switzerland is only likely to rise further over the coming years. And as long as this remains the case, retail prop-erty will remain under pressure.
Consequences for the retail property market
Supply rates rise again
Outlook for 2021: Phenomenon of space reduction to continue
Structural change to last for years
Fig. 59: Supply of available retail space reaches new high Fig. 60: Larger stores increasingly being relinquished Advertised supply of space per quarter in m² Advertised supply of space (wider definition) per quarter by premises size in m²
Source: Meta-Sys, Credit Suisse Last data point: Q4/2020 Source: Meta-Sys, Credit Suisse Last data point: Q4/2020
0
100,000
200,000
300,000
400,000
500,000
600,000
700,000
2006 2008 2010 2012 2014 2016 2018 2020
Shopping (wider definition)
Shopping (narrower definition)
0
10,000
20,000
30,000
40,000
50,000
60,000
70,000
80,000
90,000
100,000
0 – 50 50 –100
100 –150
150 –200
200 –300
300 –400
400 –500
500 –750
750 –1000
1000 –
2000
>2000
Q4 2018 Q4 2019 Q4 2020
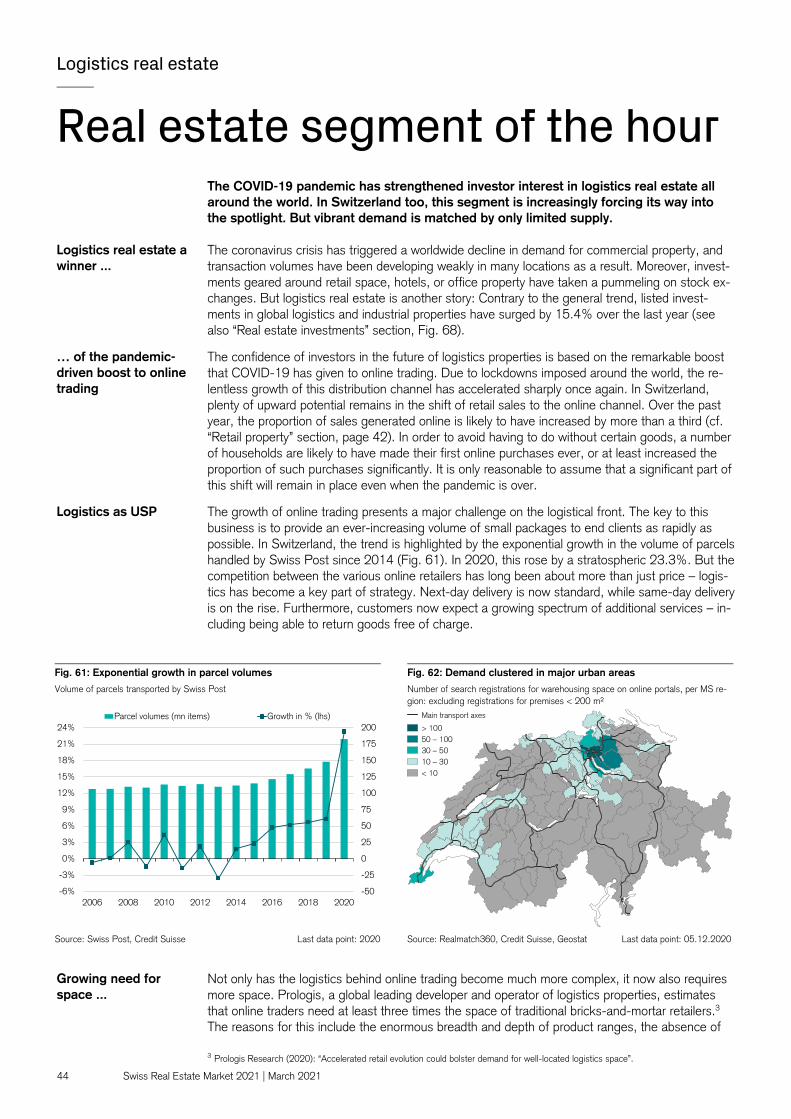
44 Swiss Real Estate Market 2021 | March 2021
Logistics real estate
Real estate segment of the hour The COVID-19 pandemic has strengthened investor interest in logistics real estate all around the world. In Switzerland too, this segment is increasingly forcing its way into the spotlight. But vibrant demand is matched by only limited supply. The coronavirus crisis has triggered a worldwide decline in demand for commercial property, and transaction volumes have been developing weakly in many locations as a result. Moreover, invest-ments geared around retail space, hotels, or office property have taken a pummeling on stock ex-changes. But logistics real estate is another story: Contrary to the general trend, listed invest-ments in global logistics and industrial properties have surged by 15.4% over the last year (see also “Real estate investments” section, Fig. 68). The confidence of investors in the future of logistics properties is based on the remarkable boost that COVID-19 has given to online trading. Due to lockdowns imposed around the world, the re-lentless growth of this distribution channel has accelerated sharply once again. In Switzerland, plenty of upward potential remains in the shift of retail sales to the online channel. Over the past year, the proportion of sales generated online is likely to have increased by more than a third (cf. “Retail property” section, page 42). In order to avoid having to do without certain goods, a number of households are likely to have made their first online purchases ever, or at least increased the proportion of such purchases significantly. It is only reasonable to assume that a significant part of this shift will remain in place even when the pandemic is over. The growth of online trading presents a major challenge on the logistical front. The key to this business is to provide an ever-increasing volume of small packages to end clients as rapidly as possible. In Switzerland, the trend is highlighted by the exponential growth in the volume of parcels handled by Swiss Post since 2014 (Fig. 61). In 2020, this rose by a stratospheric 23.3%. But the competition between the various online retailers has long been about more than just price – logis-tics has become a key part of strategy. Next-day delivery is now standard, while same-day delivery is on the rise. Furthermore, customers now expect a growing spectrum of additional services – in-cluding being able to return goods free of charge.
Not only has the logistics behind online trading become much more complex, it now also requires more space. Prologis, a global leading developer and operator of logistics properties, estimates that online traders need at least three times the space of traditional bricks-and-mortar retailers.3 The reasons for this include the enormous breadth and depth of product ranges, the absence of 3 Prologis Research (2020): “Accelerated retail evolution could bolster demand for well-located logistics space”.
Logistics real estate a winner ...
… of the pandemic-driven boost to online trading
Logistics as USP
Fig. 61: Exponential growth in parcel volumes Fig. 62: Demand clustered in major urban areas
Volume of parcels transported by Swiss Post Number of search registrations for warehousing space on online portals, per MS re-gion: excluding registrations for premises < 200 m²
Source: Swiss Post, Credit Suisse Last data point: 2020 Source: Realmatch360, Credit Suisse, Geostat Last data point: 05.12.2020
Growing need for space ...
-50
-25
0
25
50
75
100
125
150
175
200
-6%
-3%
0%
3%
6%
9%
12%
15%
18%
21%
24%
2006 2008 2010 2012 2014 2016 2018 2020
Parcel volumes (mn items) Growth in % (lhs) Main transport axes
> 10050 – 10030 – 5010 – 30< 10

Swiss Real Estate Market 2021 | March 2021 45
store shelving, as well as the space required for order picking, returns processing, and other sup-plementary services. But it is not just online traders who are likely to be expanding their logistics space over the coming years – many manufacturing companies were caught on the wrong foot by the coronavirus crisis, as the pandemic led to bottlenecks and disruption of supply chains. An indication of the geographical distribution of demand for warehousing space in Switzerland can be obtained from analysis of online property search registrations (Fig. 62). These show that space is most in demand in the major conurbations – particularly the wider Zurich region. In the urban centers themselves, it is above all smaller premises that are likely to be in demand, such as for the fine distribution of goods (“the final mile”) and to cover short-term storage needs. As well as the centers, demand is strong along the main transportation axes. These are typically home to distri-bution and transport centers, which require significant space. Swiss logistics real estate market has significant investment need In view of the increasing significance of business-to-client (B2C) supply chains, the automation of intralogistics, and the growing sustainability trend, the demands made of logistics properties are on the rise. Much of the existing building stock in Switzerland can no longer meet these needs. Analysis of a portfolio of properties valued by Wüest Partner reveals that 47% of existing proper-ties are more than 40 years old (Fig. 63). As a consequence, logistics companies, traders, and producers all began to ramp up their investment in logistics space around 15 years ago. A peak was reached in 2015 with a construction investment volume of around CHF 1 billion. Construction investment then declined again up until 2018 (Fig. 64). But the development of major distribution and cross-docking facilities in Switzerland is becoming challenging. The ideal scenario of a large site with expansion potential together with freeway and rail connections is rarely achievable any longer. Available sites with these characteristics are often jealously guarded by municipalities – in the hope of major residential developments springing up in the future in connection with the creation of a high number of jobs. Accordingly, companies are increasingly settling on a compromise for their logistics projects, and resorting to multi-story prop-erties or decentralized warehousing, for example.
Given the high demand for space, construction activity can be expected to pick up again over the next few years. Analysis of planning applications reveals that some CHF 2.2 billion of major ware-housing and logistics projects were initiated across Switzerland between 2016 and 2020. The fo-cus of this planning lies on the major conurbations and the main transportation axes along the A1 and A2 freeways (Fig. 65). A striking aspect of Swiss logistics development is that companies themselves are the developers in the majority of projects. Only a minority of properties are being built by construction and real estate companies (10.9%), or by banks, insurers and pension funds (2.6%), with a view to later rental.
… above all in proximity to urban centers
Much of existing building stock outdated
Significant hurdles for larger newbuilds
Fig. 63: Almost a half of logistics space is more than 40 years old Fig. 64: Construction investment has declined again in recent years Logistics properties by building period (sample size: 193) Construction investment in warehousing and depots, in CHF mn
Source: Wüest Partner Last data point: 2020 Source: Swiss Federal Statistical Office, Credit Suisse Last data point: 2018
Swiss rental market remains relatively small
9.3%
9.3%
15.5%
13.0%15.5%
16.6%
14.5%
6.2%
< 19401940 – 19591960 – 19691970 – 19791980 – 19891990 – 19992000 – 2009> 2009
0
200
400
600
800
1,000
1,200
1,400
1,600
1,800
2,000
0
100
200
300
400
500
600
700
800
900
1,000
1994 1997 2000 2003 2006 2009 2012 2015 2018
Newbuild Conversion Retail space (rhs)

46 Swiss Real Estate Market 2021 | March 2021
Almost a half of the investment planned over the period 2016–2020 was driven by trading or by logistics/transport companies. Some of the largest developers are the major Swiss retailers. For example, Migros is currently investing several hundred million francs in capacity expansion at its distribution centers in Mosseedorf (Canton Bern) and Neuendorf (Canton Solothurn). Moreover, the fast-growing Swiss online retailers have announced a slew of logistics projects for which plan-ning applications have not even been submitted yet in some cases. The largest Swiss online re-tailer, Migros subsidiary Digitec Galaxus, is planning a new distribution service center in Utzen-storf, Canton Bern, with a Swiss Post parcel sorting center to be built right next door. This project is scheduled to complete in 2023. The company Competec, which operates the second-largest Swiss online shop (brack.ch), is also currently expanding its logistics capacities in Willisau (Canton Lucerne): Last summer, it announced that its dramatically growing need for space was forcing it to abandon the planned phasing of the project in favor of rapid completion.
Fig. 65: Focus on urban agglomerations and freeway interchanges Planned construction investment (planning applications) with warehousing/logistics as principal form of use, by developer category, 2016 – 2020 (projects with investment volume of CHF 10 mn or more)
Source: Baublatt, Credit Suisse, Geostat Last data point: 12/2020
Logistics real estate delivers yield and increases diversification The combination of high demand and limited supply has led to rising prices and downward pres-sure on yields in the market for logistics rental properties too. According to an evaluation of 200 logistics investment properties valued by Wüest Partner, the median gross yield declined from 8.0% to 5.9% between 2011 and 2020 (Fig. 66). Furthermore, market observers believe the transaction market has pretty much dried up. For the few attractive properties that are still chang-ing hands – such as parcel distribution centers at top locations – gross initial yields of 3.5% or less are no longer a rarity. Accordingly, buyers are showing a preference for industrial properties that can subsequently be repurposed as logistics properties. The general trend of declining yields is not just the result of rising prices. Although there is a scar-city of available supply at attractive locations, particularly when it comes to large-scale premises, market rents for warehouse facilities in Switzerland – running counter to international develop-ments – exhibited a downward trend until 2018. In recent years, the median target rent for ware-housing premises has settled at around CHF 75/m² (Fig. 66); if properties with integrated office premises are included, the cost lies at around CHF 90–100/m². However, the rents of modern, spacious premises in good locations or close to urban centers are far higher. One of the reasons why rental income has not managed to keep up with price growth – in addition to the widespread problem of outdated properties – was because many logistics and transport companies operate with low margins. However, advertised rents for warehouse space have risen recently. Particularly in the case of modern and larger warehouse space in good locations, effective rental income can also be expected to increase again in the future and thus put a brake on the yield compression somewhat.
Sion
ChurThun
Bern
Basel
Olten
Genève
Lugano
Luzern
Zürich
Chiasso
Lausanne
Fribourg
Neuchâtel
St. Gallen
Winterthur
Biel/Bienne
Schaffhausen
Main transport axes
Planned construction invest.
CHF 10 – 20 mnCHF 20 – 30 mnCHF 30 – 50 mn
> CHF 50 mn
Developer category
ProductionPharmaLogistics/transportTrading/RetailConstruction/real estate
Financial industryOther
Traders facing logistical bottlenecks
Yields under pressure
High demand creates rental income potential
10.9%
27.1%
21.0%
4.7%
24.0%
2.6%9.7%

Swiss Real Estate Market 2021 | March 2021 47
While logistics real estate has long been on the radar of real estate investors in the Anglo-Saxon world, as well as in Germany, it has only been discovered gradually by Swiss investors in the last few years. The first Swiss investment products have now been created that target this asset class segment. Thanks to these products, investors who do not possess profound knowledge of the lo-gistics market – which is essential for successful investing in this niche – can gain exposure to the market nonetheless. In order to be suitable as an investment property, a logistics property must fulfill specific criteria. The key factor here is third-party usage. Large premises are typically rented by just a few companies, making dependency on individual tenants high in many cases, which makes the question of re-letting when a contract term approaches its end a serious concern. In order to minimize the long-term risk of rent income losses and improve the chances of a property retaining its value, investment properties should offer space that appeals to the greatest possible number of potential tenants. This presupposes a macro-location and micro-location that are ad-vantageous from a logistics perspective, and a design that facilitates the flexible use of space. Ac-cordingly, the more specific the requirements of the tenant, the longer the agreed contract term should be. There are a number of reasons why investors with large real estate portfolios in particular should think of adding logistics property to their portfolios. For one thing, logistics properties can continue to make a positive contribution to the overall return of a portfolio, even if the yield premium com-pared to other commercial property types is disappearing. According to the MSCI Swiss Real Es-tate Index, the yield premium (based on net cash flow yield) of logistics/industrial properties over office and retail properties amounted to more than 150 basis points in 2019. Second, logistics properties make a significant contribution to the diversification of a real estate portfolio, as the yields here are driven by different factors to those of residential or office properties. Total returns on logistic premises exhibit a negative correlation with the former, and have virtually no correlation at all with the latter. Once upon a time, logistics yields had a positive correlation with retail property yields. But with the rise of online trading, which favors logistics property at the expense of retail property, this has simply disappeared (Fig. 67). Third, a combination of scarcity of supply and the healthy long-term demand outlook makes logistics real estate attractive. Unlike in the case of of-fice property and multi-family dwellings, no oversupply has built up here in recent years, and there are no structural reasons pointing to any decline in demand in the future.
Direct market access requires expertise
Conclusion: Appeal from both a yield and a diversification standpoint
Fig. 66: Persistent pressure on rental income and gross yield Fig. 67: Decoupling of logistics and retail property yields Target rent and gross return of logistics properties by year of valuation (median); sample size: 200
Total return as per Swiss Real Estate Index (MSCI)
Historical performance data and financial market scenarios are no reliable indicator of future results Source: Wüest Partner Last data point: 2020
Historical performance data and financial market scenarios are no reliable indicator of future results Source: MSCI Last data point: 2019
0%
1%
2%
3%
4%
5%
6%
7%
8%
9%
0
10
20
30
40
50
60
70
80
90
2011 2012 2013 2014 2015 2016 2017 2018 2019 2020
Gross yield entire property (rhs) Warehousing space target rent (CHF/m²)
0%
2%
4%
6%
8%
10%
12%
14%
16%
2002 2004 2006 2008 2010 2012 2014 2016 2018
Multi-family dwellings Office space Retail space Industrial/logistics

48 Swiss Real Estate Market 2021 | March 2021
Real estate investments – direct investments
Limited COVID losses The COVID-19 pandemic has led to dislocations in real estate investments all around the world – particularly for commercial property. For the time being, Swiss investors are likely to remain faithful to this asset class given the lack of more appealing alternatives. At the start of 2020, the first reports started circulating in the media about a “mysterious lung dis-ease” in the Chinese city of Wuhan. Within just a few weeks, what looked like a local issue had evolved into the certainty that an unstoppable pandemic was spreading around the world. The dis-locations in financial markets triggered by this development were accordingly extreme. Uncertainty quickly spread to the world of real estate, and the prices of listed real estate investments suffered a dramatic slump. On the one hand investors feared a long deep recession that would drag down the real estate market too; on the other, global lockdowns were imposed that temporarily made it impossible for tenants to generate sufficient sales on their rented premises. Thanks to comprehensive fiscal support measures, however, the concerns of investors soon switched to the long-term repercussions of the pandemic. Thanks to the rapid production of vac-cines, the direct effects of the pandemic should subside in a few months, thereby lifting re-strictions on the use of real estate and triggering an increase in income from rental premises. What now remains is the uncertainty over the longer-term consequences of the pandemic, which are likely to affect the various segments of the market to differing degrees. The expectations of market participants in this respect can be most directly gleaned from the global performance of listed real estate investments (Fig. 68). In the second half of March 2020, these had already started to recover from their initial reverses. That said, a number of sector indices were still well below their prior-year levels at the start of 2021. Most notable here was the performance of retail and office premises (-23.7%). By contrast, investors consider the “winners” of this crisis to be the segment of logistics real estate (+15.4%). In Switzerland too, investors turned their backs on commercial property at the start of the pan-demic, as can be seen from the negative performance of real estate shares (-13.1%) and com-mercial real estate funds (-8.0%) over the last twelve months. By contrast, direct investments in residential and mixed investment properties recorded a positive performance (+3.2%), as did resi-dential property funds (+6.0%). Moreover, the owners of commercial premises affected by the lockdown, primarily from the areas of retailing, hotels & catering, and leisure/sport, found them-selves confronted with demands for rent waivers. The wrangling over state-decreed concessions
Massive upheaval in global markets for real estate investments
Uncertainty over long-term repercussions
Ongoing skepticism over commercial property
Fig. 68: COVID-related exodus from commercial property Fig. 69: Damage due to rent waivers is kept within limits 12 month total returns of global REIT indices (MSCI) by sector compared to Swiss real estate investment, *residential and mixed investment properties
COVID-19-related rent waivers at Swiss real estate funds and investment compa-nies, as % of rental income, according to semi-annual/annual reports.
Historical performance data and financial market scenarios are no reliable indicator of future results Source: Datastream, IAZI, Credit Suisse Last data point: 01.02.2021
Source: Annual reports of real estate funds and investment companies, Credit Suisse Last data point: Q3/2020
6.0%
3.4%
3.2%
-8.0%
-13.1%
-30% -20% -10% 0% 10% 20%
Industrial REITs
MSCI World
Swiss real estate funds: residential
SPI
All Swiss real estate funds
Direct investments CH*
Swiss real estate funds: commercial
Residential REITs
Swiss real estate shares
Healthcare REITs
Hotel REITs
Office REITs
Retail REITs
0%
1%
2%
3%
4%
5%
6%
7%
Fund
s:re
side
ntia
l
Fund
s:co
mm
erci
al
Fund
s: o
ther
Fund
s: to
tal
Rea
l est
ate
co.:
reta
il/ho
spita
lity
> 2
0%
Rea
l est
ate
co.:
othe
r
Rea
l est
ate
co.:
tota
l
Tota
l lis
ted
real
est
ate
secu
ritie
s
Median
80% percentile
20% percentile

Swiss Real Estate Market 2021 | March 2021 49
from landlords gave rise to heightened legal uncertainty until the corresponding bill was rejected by the Council of States at the start of December 2020. But even before this point, numerous land-lords had come to amicable agreements for rental relief with affected tenants. The total extent of these waivers is not known. An indication can be gleaned from the business reports of real estate companies, however. According to the annual (and semi-annual) reports of listed real estate funds and real estate investment companies published up to mid-January 2021, these companies have forgone rental income amounting to some CHF 36 mn, which equates to 1.7% of rental income (or 2.8% if only the rental income from commercial premises is taken into account). In the case of commercial real estate funds, the median rent waiver amounted to 3%, but in the case of some funds it was substantially more (Fig. 69). The actual lost income is likely to be even higher, as in many cases only figures for the first half of 2020 were available, and a number of planned (but not yet granted) waivers have not yet been taken into consideration. Quite a few landlords are likely to have been waiting for parliament’s decision on the commercial rents bill before negotiating individual solutions with hard-hit tenants. Accordingly, rent waivers are likely to reduce income of certain commercial property landlords in the current year too. However, these temporary disruptions to rental streams are unlikely to feed through into the market values of the properties themselves. What matters are the long-term prospects and thus in particular the ques-tion of how the accelerated rise of online shopping, a persistent boom in home working, and a slump in business tourism will impact on rental income streams in the long term. The first repercussions of this changed income outlook are also evident in the transaction market. In 2020, for example, the gross initial yields on office property rose for the first time since 2015 (from 2.9% to 3.0%, Fig. 70). By contrast, the initial yields on multi-family dwellings in the major centers (2.7%) as well as outside of the centers (3.7%) fell to new lows. Also falling to a new low in 2020 were the net cash flow returns on investment properties, which according to IAZI declined to 3.2%. Here the ongoing negative interest rate environment continues to offer scope for higher market values, which allows for positive valuation returns going forward. Away from the major ur-ban areas, however, these value increases lose momentum – this being particularly true to date in eastern Switzerland and Ticino, where a number of regions actually recorded a decline in values in 2019 (Fig. 71). The pandemic has led to uncertainty regarding the future demand for commercial property. Out-side of the top locations, longer-term declines in demand remain a threat whose magnitude can hardly be predicted from today’s standpoint. Given this backdrop, residential investment properties are being even more strongly targeted by investors, despite vacancies rising further. However, in view of the resurgence in oversupply risks in the rental apartment market and the difficult eco-nomic situation, future value increases are likely to work out lower than in recent years, for which 3% or more has been the norm. We are therefore anticipating a total return of 4.0% to 4.5% in 2021.
Rent waivers tolerable
Impact on the trans-action market limited so far
Multi-family dwellings remain the focus of investors
Fig. 70: Initial yields of multi-family dwellings fall again Fig. 71: Residential segment: waning price growth to the east and south
Transaction-based gross initial yields (median) of institutional investors; urban: large centers including Lucerne, Lugano, St. Gallen, Bellinzona, and Chiasso
Growth in market values of multi-family dwellings by MS region, 2019; arrows: trend compared to long-term average since 2010
Historical performance data and financial market scenarios are no reliable indicator of future results Source: REIDA, Meta-Sys, Credit Suisse Last data point: 12/2020
Historical performance data and financial market scenarios are no reliable indicator of future results Source: REIDA, Meta-Sys, Credit Suisse, Geostat Last data point: 12/2019
0%
1%
2%
3%
4%
5%
6%
2011 2012 2013 2014 2015 2016 2017 2018 2019 2020
Residential rural Residential urban Office
> 4%3 – 4%2 – 3%1 – 2%0 – 1%< 0%No data
Strong increaseIncreaseSideways movementDeclineStrong decline

50 Swiss Real Estate Market 2021 | March 2021
Real estate investments – indirect investments
Residential property: false sense of security?
Listed Swiss real estate securities have once again proved to be a safe haven during the coronavirus crisis. In particular, residential real estate funds are more popular than ever and correspondingly expensive. Viewed at a global level, listed real estate investments are among the losers of the COVID-19 pandemic, particularly as they have recovered more slowly than other asset classes from the mar-ket crash at the start of the crisis. For example, the MSCI World Real Estate Index closed 5.9% down at the end of 2020 (Fig. 72). Similar falls were recorded by Swiss real estate shares (-6.7%), although these were very highly valued just before the correction and contain a high pro-portion of commercial property, unlike real estate funds. But the picture for listed Swiss real estate funds is very different: After an impressive year-end rally these ended up 10.8% in positive terri-tory at the close of 2020, having already recorded a rise of 20.7% the year before. With this per-formance, they have left other “COVID-resistant” markets such as Germany (+3.9%) and the US (+4.6%) well behind. The darlings of investors in 2020 were Swiss residential real estate funds (+12.5%), although the shares of real estate companies with a high residential component in their portfolios also proved very popular. By contrast, securities with a high proportion of office or retail property, as well as properties from the hotel & catering sector, were relatively scorned – a pattern that was repeated globally due to the gloomy long-term income outlook for these segments (Fig. 68). The latest upward trajectory of Swiss real estate funds cannot be explained by any improvement in their income outlook. Although COVID-19 is not likely to have any detrimental long-term impact on overall demand for residential property – unlike demand for retail or office property – the rental market has been on a downward trajectory for years, as evidenced by rising oversupply tendencies and downward pressure on rental income. In actual fact, the risk of lost income has increased even further over the last year (Fig. 73). At 6.2%, the rent default rate of listed Swiss real estate funds reached a new high. The rise was particularly strong in the case of commercial real estate funds, where a total of 9.5% of target income fell victim to vacancies or rent waivers. But in the case of residential real estate funds too, the rent default rate has risen noticeably to 5.5%.
Swiss real estate funds the star pupils ...
… and residential real estate funds were the best of the best …
… and this despite a difficult letting situation
Fig. 72: Real estate funds outperform despite COVID-19 Fig. 73: Acceleration in real estate fund vacancy growth
Total performance of indirect real estate investments, index: 1.1.2016 = 100 Rent default rates (as % of target rental income) of listed Swiss real estate funds
Historical performance data and financial market scenarios are no reliable indicator of future results Source: Datastream, Credit Suisse Last data point: 01.02.2021
Source: Annual and semi-annual reports of real estate funds, Datastream, Credit Suisse Last data point: 30.09.2020
40
60
80
100
120
140
160
180
200
01/2016 01/2017 01/2018 01/2019 01/2020 01/2021
SXI Real Estate Funds SXI Real Estate SharesSwiss Performance Index MSCI World Real EstateMSCI World: Office REIT MSCI World: Retail REIT
Total return 2020
-6.7%
+10.8%+3.8%
-5.9%
-19.1%
-27.4%
0%
1%
2%
3%
4%
5%
6%
7%
8%
9%
10%
2007 2009 2011 2013 2015 2017 2019
Median Total residential Total commercial Total all funds
80% percentile
20% percentile

Swiss Real Estate Market 2021 | March 2021 51
Where the increasing vacancy rate of the Swiss rental apartment market is concerned, many ob-servers like to point out that vacancy levels are still modest in an international comparison. Unfor-tunately, this assertion can only be reviewed to a limited degree due to the lack of comparable in-ternational surveys of rental apartment vacancies. But it can be clearly dismissed as incorrect in the case of listed real estate investments. This much is apparent from a comparison of the rent default rates of Swiss residential real estate funds with the vacancy figures in the portfolios of in-ternational real estate investment trusts (REITs) and real estate companies (Fig. 74). The compa-nies used for the purposes of this comparison are contained in the global real estate indices of MSCI and EPRA, and focus mainly on residential property. From this comparison it emerges that the average rent default rate of Swiss funds amounts to 5.4%, which is far higher than the va-cancy levels apparent in the portfolios of German and US companies, or those in other countries. That said, the difference is likely to be somewhat exaggerated as the rent default rates published by funds typically include rent waivers and payment default, as well as vacancies. But even the few Swiss real estate investment companies with a residential focus are recording vacancy rates of 3% to 4%, which is rather high in a European comparison. This is – at least in part – likely to be attributable to structural factors, however. Particularly in countries such as the UK or the US, owner-occupied housing is traditionally dominant, and rental apartment blocks are often clustered in major cities where demand for housing is high. Moreover, a greater role is played in these mar-kets by special types of rental apartments, such as student and serviced apartments. The year-end rally of Swiss real estate funds has pushed the corresponding premiums to net as-set values to heady levels. In the case of residential real estate funds, this premium stood at 43.4% at the end of 2020, its highest level for twelve years. At the end of January 2021, it was still at 37.8% (Fig. 75). But even commercial funds are relatively highly valued with a premium of 23.8%, particularly given the clouds on the future income horizon due to COVID-19. However, there are huge differences between the individual funds themselves, with the spectrum of premi-ums ranging from almost -5% to +70%. These significant valuation differences reflect not just the quality of individual portfolios but above all their composition (e.g. Zurich region versus Ticino; fo-cus on logistics or sustainability versus retail property and hotels & catering). Another aspect was the year-end rally of real estate funds, played out against a backdrop of con-siderable activity in the capital market. Overall, capital increases and launches in the fourth quarter of 2020 encompassed a volume of CHF 1,235 billion, of which CHF 768 million related to listed funds. Capital increases of this kind typically dilute returns. Furthermore, the rally took place with-out any noteworthy increase in trading volumes – an indicator of a buyer surplus. Given the dearth of investment alternatives in the entrenched low-interest environment, many market players have clearly refrained from taking profits, with some even increasing their positions. As such, this looks to us like an overly expensive market entry point for Swiss residential real estate funds. On the other hand, we see opportunities in real estate investment companies and commercial property funds, which are more modestly valued, particularly if the focus of the portfolio is on office prop-erty in central locations, sustainable real estate, or logistics properties.
Vacancies even high in an international comparison
High premiums indicate high valuations
Conclusion: not much upside for funds
Fig. 74: Vacancies high in an international comparison Rent default rate of Swiss residential real estate funds compared to the vacancy rates of leading international residential real estate operating companies and REITs.
Fig. 75: Swiss residential real estate funds look expensive Premiums of real estate funds and real estate shares, as % of net asset value; com-mercial real estate funds including special properties, excluding mixed funds
Source: Annual reports of real estate companies, Credit Suisse Last data point: 30.09.2020
Historical performance data and financial market scenarios are no reliable indicator of future results Source: Datastream, Credit Suisse Last data point: 31.01.2021
0%
1%
2%
3%
4%
5%
6%
7%
8%
9%
Res
iden
tial
fund
sS
witz
erla
nd(n
= 2
3)
Rea
l est
ate
com
pani
esG
erm
any
(n =
8)
Rea
l est
ate
com
pani
esot
her E
urop
e(n
= 8
)
Rea
l est
ate
com
pani
esU
SA
(n =
11)
Rea
l est
ate
com
pani
esgl
obal
(n =
37)
75% percentile
25% percentile
Median
-30%
-20%
-10%
0%
10%
20%
30%
40%
50%
60%
2009 2011 2013 2015 2017 2019 2021
Residential–commercial difference Commercial real estate fundsResidential real estate funds Real estate shares

52 Swiss Real Estate Market 2021 | March 2021
Real estate investments – outlook 2021
Low interest rates make real estate a coveted asset
Real estate is directly affected by the COVID-19 pandemic, as containment measures and lock-downs have led to temporary closures of restaurants, hotels, leisure facilities, and other busi-nesses all around the world. This has led to income losses for the corresponding owners – in the form of forfeited revenue shares and lost rental income, including through rental waivers. If vac-cine programs proceed at the planned tempo, things should gradually return to normal over the course of the second semester of 2021. In the meantime, the longer-term repercussions of the pandemic – which are increasingly preoccupying investors – will be much weightier. It is only reasonable to assume that the structural shifts apparent in the market may well persist long after the coronavirus crisis has been mastered. Home working will continue to be supported by a much greater number of companies, and demand for office property can be expected to fo-cus on the most attractive premises in easily accessible locations boasting plentiful local amenities. A substantial proportion of the retail sales that have shifted to the online channel will probably have been lost to bricks-and-mortar retailers for good. This will mean a lasting decline in demand for retail premises, particularly away from the key “high streets”, whereas demand for logistics prem-ises will receive a further boost. It will probably be several years before business tourism volumes get back to pre-crisis levels, as the pandemic has made it starkly clear that remote collaboration using digital tools functions well. That said, the magnitude of these effects remains shrouded in uncertainty. Meanwhile, overall demand for residential property has barely been impacted by the pandemic, and will fully recover. But here too, structural shifts in demand could emerge, for exam-ple if employees continue to spend a significant proportion of their working week at home, and re-spond to the new parameters by optimizing their living situation. Net cash flow yields are likely to record another slight fall, and in the case of residential invest-ment properties approach the 3% threshold in the course of this year. Nonetheless, in the event of negative interest rates remaining in place – as is currently expected by the great majority of in-vestors – real estate investments still offer very attractive returns compared to the available alter-natives. In the longer term, the combination of ultra-expansionary fiscal policy and the ongoing flood of liquidity from central banks is likely to increase inflationary risks. Interest rate rises there-fore remain the greatest risk from the investor’s perspective, as at current price levels these could trigger sharp corrections. For now, however, we see slight increases in value as the most likely scenario, such as for commercial properties in top locations and logistics real estate, as well as residential property. For the latter, we are anticipating a total return in 2021 of 4.0% to 4.5%. Over the next few years, careful monitoring of demand trends and the corresponding adjustment of individual investment strategies will be crucial to the success of real estate investors. At a global level, indirect real estate investments could not escape the downward trend that set in at the start of the COVID-19 pandemic. Quite the opposite: In a comparison of asset classes, they remain among the overall losers, as although the massive correction in the first quarter of 2020 was followed by a recovery, it was nothing like as strong as that of equity markets. In Swit-zerland too, real estate shares geared around cyclical sectors suffered reverses. The prices of real estate funds however, particularly those with a residential focus, reached giddy heights despite a further rise in vacancy risks. Having said this, the enormous discrepancies in premiums and rental income losses point to major differences between the various funds in respect of portfolio quality, diversification, and vacancy management. We see only limited potential for further increases in value in Swiss real estate funds at the moment. As the economic recovery gains momentum as the year progresses, demand is increasingly likely to shift to cyclical sectors. As such, real estate shares, commercial real estate funds and international real estate investments could benefit at the cost of residential real estate funds.
COVID-19 consequences to weigh on real estate market for some time
Focus switches to structural effects
Direct investments: time for a review of investment strategy
Indirect investments: low interest rates to outweigh con-sequences of pandemic

Swiss Real Estate Market 2021 | March 2021 53
Sustainable real estate
No sustainability without transparency
Investors expect greater transparency in the area of sustainable real estate investments, as this is crucial to trust. Recognized building labels and international benchmarking re-sults were just the start in this respect. Investors are increasingly looking for specific energy ratios at portfolio level and a commitment to ambitious targets for the reduction of environmentally-damaging emissions. For wide swathes of the population, the COVID-19 pandemic has pushed climate concerns into the background. But while coronavirus has slowed the momentum of the environmental move-ment, the latter issue can be expected to be back on the front pages very soon. The trend toward sustainability is becoming increasingly established among the Swiss population. This has been demonstrated not just by the 2019 elections to the National Council, but also by the Credit Suisse Worry Barometer, which has been identifying the most pressing concerns of the Swiss electorate for many years now. On average, the topic of the environment has been cited as one of the most important concerns by 17.3% of survey respondents annually since 2001 (Fig. 76). In most years, this has not been enough for it to make the top ten worry rankings. The issue enjoyed a public spike of awareness briefly in 2007 due to the publication of a gloomy UN Climate Report. But in 2018 the environment then rocketed back into the top five biggest worries of the Swiss with a score of 23%. The hot and very dry summer of that year sparked off discussions over climate change, and is therefore likely to have sensitized the population to this issue all the more. In 2019, 29% of voters viewed climate change and environmental protection as one of the five most pressing problems. This was a rise of six percentage points, the second-largest of any Swiss worry. While the coronavirus threat far outstripped all other problems in 2020, the issue of the en-vironment nonetheless remained in fourth place with 29% of citations once again. But if voters had been asked to identify only the most urgent problem, rather than the five most urgent prob-lems, environmental protection/climate change would have ranked second behind the coronavirus, the same position as in 2019. The accumulation of natural catastrophes and extreme weather phenomena, together with global climate demonstrations, have led to an appreciation of this issue by wider swathes of society. Under the slogan “climate strike”, young people and children have started to take their anger over climate change to the streets all around the world, forcing society to sit up and take notice. The environmental issue has therefore been prominent in the media, po-litical debate, and discussion forums.
COVID-19 may be the most pressing problem, …
… but the climate is the most important
Fig. 76: Growing relevance of the environment as a theme Fig. 77: Global increase in regulatory requirements
Credit Suisse Worry Barometer: Proportion of Swiss voters who cite the environment as one of the five most pressing concerns
Cumulative number of political interventions in favor of sustainable investments in the 50 largest global economies
Source: Credit Suisse Last data point: 2020 Source: UN Principles for Responsible Investment (PRI) Last data point: 2019
0%
5%
10%
15%
20%
25%
30%
35%
2001 2004 2007 2010 2013 2016 2019
Environmental protection/climate change
0
50
100
150
200
250
300
350
400
450
500
550
1972 1976 1980 1984 1988 1992 1996 2000 2004 2008 2012 2016 2020
Number of political interventions (cumulative)

54 Swiss Real Estate Market 2021 | March 2021
The Worry Barometer makes it clear that the issue of sustainability has finally come to the atten-tion of the wider masses. Many Swiss have already started to adapt their behavior. This can be seen in the surge in the number of people traveling by bike – and not just since the onset of the COVID-19 pandemic – and in the high growth rates being recorded by organic products, even though these are more expensive. This wider social development is increasingly being reflected in the behavior of investors too. The popularity of sustainable investments is rising strongly, and the corresponding market is recording very high double-digit growth rates. One of the greatest problems for sustainability is that sustainable goods or services are typically not identifiable as such from the outside. As a result, consumers do not know if they are acting sustainably by purchasing this or that product. This prompted a number of providers to start desig-nating their products with quality labels some years ago. They recognized the competitive ad-vantage that greater transparency would give their products. Things have been no different in the world of real estate: Building “labels” now document compliance with certain sustainable parame-ters. These labels have subsequently risen to prominence, particularly as they have improved transparency – at least to a certain extent. But their success also gave rise to an extreme prolifer-ation of labels and ratings, which has delivered more confusion than enlightenment in recent years. In the real estate area, such labels are often based on twenty or more factors, greatly com-plicating the process of comparing different labels. For that reason, calls for more far-reaching transparency soon became widespread. Because ultimately, transparency must be comprehensi-ble if it is to engender trust. The change in consumer and user behavior is ultimately also reflected in changed investor behav-ior. The move towards sustainability has grown above all in connection with property investments, particularly as real estate and the corresponding investments are responsible for a large proportion of global energy, CO2, and resource consumption, making them an inevitable focus of attention. The key drivers of greater sustainability are first and foremost institutional and private investors, who have been calling for greater transparency in connection with real estate investments. Another driver is the more engaged stance of regulators, other public institutions, governments, and supervisory authorities, who are promoting sustainable investment in the financial sector in a targeted way in the wake of the global climate movement, while insisting on greater transparency in the form of sustainability criteria, along with disclosure of the corresponding integration. At the same time, governments and supervisory authorities are actively involving the financial sector in the financing of measures to combat climate change. Figure 77 shows how dramatically the num-ber of political interventions relating to sustainable investment is rising worldwide. Switzerland is no exception here. In many cases, this is to introduce additional transparency and disclosure obliga-tions, which on the one hand lead to a better and uniform understanding of sustainable real estate investments, while on the other actively promoting and improving investor protection. A further ob-jective is to attract greater institutional and private capital to sustainable financial investments gen-erally, and to sustainable real estate in particular The third driver is the change in portfolio managers themselves, who are recognizing the growing demand and need for innovative, sustainable real estate. Providers of real estate investments in-creasingly apply environmental, social, and governance (ESG) criteria and integrate comprehensive sustainability aspects into their investment options. In other words, not only are they reacting to increasing competition in the supply of convincing investment solutions, they are also pushing for the holistic integration of ESG criteria along the entire real estate value creation chain. In this way, sustainability targets can be effectively displayed in addition to return ratios and used to establish a competitive advantage.
Greater transparency in all sustainability matters is going hand in hand with a clear professionaliza-tion of the real estate industry when it comes to ESG and sustainability. A look at developments over the last few years shows how far the industry has come. To start with, sustainability aspects were only sporadically mentioned in conventional annual reports, and often restricted to purely qualitative statements and declarations of intent with respect to sustainable use of resources. But investors now expect a great deal more – namely the transparency, measurability, and compatibil-ity of key indicators. Sustainability reporting is a good indicator of the professionalization of the real estate industry, which is increasingly applying uniform sustainability standards such as the Global Reporting Initiative (GRI) or Sustainability Best Practice (cf. INREV, EPRA). This increasing trans-parency is evident from the fact that a growing number of market participants do not just report on qualitative criteria, but systematically track measurable and therefore comparable indicators such as energy efficiency, CO2 emissions, water and waste consumption, and the proportion of renew-able energies, before then setting this information out in detail in separate sustainability reports
Sustainability as megatrend
Transparency emerges as competitive factor
Investors demand sustainable real estate investments
Growing regulatory pressure
Portfolio managers discover competitive advantage of ESG
From qualitative features to measurable indicators

Swiss Real Estate Market 2021 | March 2021 55
(Fig. 78). Comprehensive disclosure of this kind in turn puts pressure on competitors who are not so far advanced to publish the same information. All this has dealt a severe blow to so-called “greenwashing”, as pure marketing exercises are now easily identifiable as such.
The real estate investments of Credit Suisse are market leaders in terms of sustainability. Real Es-tate Management adopted a comprehensive sustainability approach at an early stage, initially fo-cusing on sustainability labels not just for existing property portfolios, but also real estate projects. Credit Suisse has also developed a proprietary sustainability standard – “greenproperty”, in which properties are subject to an independent and certified sustainability quality audit process involving more than 50 ESG criteria. Investors and tenants can therefore immediately recognize the quality differences compared to traditional real estate. In addition to the greenproperty seal of quality, la-bels that feature commonly in the market such as SNBS, Minergie, LEED, and BREEAM are also used. This required the build-up of a comprehensive measuring system for recording consumption figures. Thanks to this process, valuable findings have been accumulated over many years that highlight what really matters for sustainable real estate investments.
Sustainability indicators were consistently measured and recorded in the context of all building op-timization measures with a view to further increasing the measurability and compatibility of sustain-ability criteria. After all, something that cannot be measured also cannot be managed. For exam-ple, it was only thanks to the transparency gained with regard to the real estate portfolio that the basis was laid for optimizing energy efficiency and systematically reducing environmentally-damag-ing CO2 emissions. Many of these indicators are now available to investors in annual business re-ports. In addition, sustainability indicators are increasingly being presented in standardized form in integrated or independent sustainability reports. In the future, there is likely to be a link established between these measurable sustainability indicators and balance sheet reporting. As a conse-quence, a company’s assets and liabilities will have a stronger connection with sustainability fac-tors in the future, as well as being incorporated into company profitability evaluations.
A successful sustainability strategy is characterized by the integration of ESG criteria across the entire real estate value creation chain, as well as the entire real estate life cycle. ESG benchmarks have been established in the real estate sector in order to ensure standardization of track records. The aim here is to provide investors and portfolio managers with a transparent picture of sustaina-bility performance through structured and comparable evaluations, and to provide a comparative rating through use of a benchmark. At an international level, the Global Real Estate Sustainability Benchmark (GRESB) has emerged as by far the largest – and in our view therefore the most pro-fessional – benchmark initiative in the industry. The GRESB has recorded strong growth in recent years in connection with the benchmarking of investment real estate portfolios.
Credit Suisse an early mover in sustainability
No managing without measuring
Sustainability bench-marks facilitate competitive comparisons
Fig. 78: Transparency with regard to environmental data Fig. 79: Comparison of a portfolio with GRESB peer group CO2 emissions and energy efficiency in a property comparison GRESB rating of a hypothetical portfolio by categories
Source: Credit Suisse Last data point: 2019 Source: GRESB, Credit Suisse Last data point: 2020
-10
0
10
20
30
40
50
0 50 100 150 200 250 300
Gre
enho
use
gas
emis
sion
s in
kg
CO
2eq/
m²,
a
Final energy in kWh/m²
Average
Ave
rage Sample portfolio
LeadershipPolicies
Reporting
Risk Management
Stakeholder Engagement
Risk Assessment
TargetsTenants & Community
Energy
Greenhouse Gas
Water
Waste
Data Monitoring& Review
Building Certifications
25
50
75
100100
100
100
100
98.7
100100
78
73.8
57.3
90.1
10081
This Entity Peer Group Average

56 Swiss Real Estate Market 2021 | March 2021
More than 1,200 real estate portfolios with a combined value of USD 4.8 trillion from more than 64 countries currently participate in the annual GRESB survey in order to have their sustainability performance measured. For investors, obtaining detailed insights into the sustainability perfor-mance of real estate investments and comparing investment products with the relevant peer groups provides important decision-making criteria when it comes to selecting sustainable real es-tate funds (Fig. 79). GRESB offers portfolio managers a transparent basis for deciding which ar-eas of a portfolio still have a need for development in terms of sustainability, and which areas are already competitive. This transparency and the disclosed competitive comparisons are increasingly becoming a success factor for active portfolio management in the Swiss real estate market. Further comparison options are emerging in Switzerland thanks to the energy and CO2 bench-marking initiative being set up by the industry association REIDA (Real Estate Investment Data As-sociation). The first key figures were unveiled in August 2020. In the future, the energy consump-tion and CO2 emissions of real estate portfolios will be directly comparable with the REIDA uni-verse. This will show portfolio managers how well their properties match up against others, whether their own annual improvements are similar to those of other portfolios, and which proper-ties exhibit the greatest deviations from target values. Portfolio managers will therefore receive an informative analysis of the status quo, as well as specific information that can be used to make the measures they take as effective as possible. The much-discussed conflict of objectives between return metrics and sustainability indicators has never been proven. Quite the opposite: Those who take into account sustainability criteria and re-port transparently achieve certain advantages. Here too, measurability – and the corresponding track record in the area of sustainability – is a prerequisite for achieving higher letting and transac-tion prices. The rapid growth in the popularity of sustainable investments among private and insti-tutional investors can also be explained by the fact that capital invested according to environmental and social principles is often exposed to fewer risks and can frequently generate a higher return. Numerous studies have provided evidence of just that.4 If real estate and property portfolios are to be managed in accordance with sustainability criteria, the integration of CSG factors into risk management will ultimately be essential. Here too, trans-parency is key. Two perspectives in particular have evolved in the area of ESG risk management for real estate investments: The first is the “inside-out” perspective, where all relevant sustainability criteria that result from the operation or use of a property and have an impact on its environment are measured and evaluated. This includes the usual key figures such as energy efficiency, CO2 emissions, water and waste consumption, and the proportion of renewable energies. The second is the “outside-in” view, in which all sustainability criteria that impact on the property from outside – and can therefore influence valuation and value stability – are determined. For example, this would include all the physical risks that result from the effects of climate change, such as the risk of flooding and frequently recurring extreme weather events. Last but not least, regulatory risks play an increasingly important role in the holistic view of ESG risks. Although the transparent tracking and quantification of ESG risk factors remains a huge challenge for the real estate industry, ongo-ing professionalization of the sector through greater transparency and disclosure can be expected in the area of ESG risk management too. If the goal of sustainable real estate is to be attained, there is no alternative to greater transpar-ency – properties must be systematically measured and compared, and the right conclusions drawn. This will also help to absorb the growing pressure coming not just from investors and regu-lators, but also increasingly from competitors who have grasped the benefits of a sustainable ap-proach. In the medium term, there is likely to be particular pressure to reduce CO2 emissions fur-ther. At an international level, portfolio managers of numerous real estate investments are already trying to outdo one another with their plans to reduce real estate portfolio emissions. Binding com-munication of “downward trajectories” of this kind can soon be expected to become the norm in Switzerland too.
4 See for example G. Clark, A. Feiner, M. Viehs (2015): “From the Stockholder to the Stakeholder: How Sustainability Can Drive Financial Outperformance”; University of Oxford and Arabesque Partners
International GRESB benchmark
Swiss REIDA benchmark
No conflict of objectives between return and sustainability
Sustainability making inroads into risk management
Conclusion: Transparency the only way forward

Swiss Real Estate Market 2021 | March 2021 57
Factsheets : Regional real estate markets at a glance
Periodically updated key indicators for the 110 economic regions What are the locational qualities of the Oberengadin economic region? What sectors are particularly important for the region? How high are house prices in the region's municipalities? The Credit Suisse Factsheets answer these and many other questions concerning the regional economy, demographic developments and housing markets. Regularly updated statistics are presented in the form of meaningful diagrams, tables and maps.
Regional economy and demographic developments Are you planning to tap into new locations with your com-pany or would you like to gain a picture of an economic region? The Credit Suisse Factsheets offer you up-to-date statistics on topics such as locational quality, acces-sibility and population developments.
Regional housing markets Are you planning to relocate or would you like to buy a home or investment property? The Credit Suisse Factsheets provide you with key facts about the regional housing market including indi-cators such as the age of existing housing, va-cancy rates, planning activity and much more be-sides.
House prices and rents Would you like to gain an overview of regional house prices and their development or compare the prices of different municipalities of the region? This information can also be obtained from the Credit Suisse Factsheets.
Please contact your Credit Suisse client advisor to order factsheets on the individual economic regions in your pre-ferred language (English, German, French or Italian). You will find a list of Switzerland's 110 economic regions on the next page.
Swiss Economics
Oberengadin GR CH
Population 2016Employment 2015Net number of commuters 2014GDP (bn CHF) 2014GDP per employee (CHF)Net income p.c. 2016Employment rate 2014Net migration 2016Unemployment rate 2016Home ownership rate 2016Total housing stock 2016Total area (ha)Share of developed landNumber of municipalities 2015
Source: Swiss Federal Statistical Office, Credit Suisse
Synthetic indicator, CH = 0, 2017 Synthetic indicator, CH = 0, 2017
OberengadinLQI:Rank: 85 / 110
Engiadina bassaLQI:Rank: 97 / 110
GRLQI:Rank: 24 / 26
Source: Credit Suisse
Per developed square kilometer, individual and public transportation combined Relative traffic-related extension of journey time at 7.15 a.m.
121'096 710'540 4'129'0751.7% 2.0% 7.5%
47.5% 45.7% 39.2%26'239 170'177 4'420'829
Accessibility of population Traffic congestion
Factsheet | Dezember 2017
14 125 2'324
Economy
Locational quality Components of locational quality
-1.4
-1.5
- 1.8% 3.2%
42'404 46'204 52'98867.7% 66.3% 66.4%
71'030
Page 1
23'206 197'550 8'419'550
2.2 13.9 643.8
16'500 98'648 3'999'207160 -1'055 -
-1.1
INVESTMENT SOLUTIONS & PRODUCTS
Factsheet | Region Oberengadin
129'806 138'855 161'857
28 998
Population accessibility
Employee accessibility
Access to airports
Availability of well-qualified personnel
Avalability of specialist labor
Fiscal attractiveness for legal entities
Fiscal attractiveness for private individuals
Swiss average
Elm
Chur
IlanzArosa
Davos
Glarus
ZernezThusis
Biasca
Lugano
Sargans
Locarno
Klosters
Roveredo
Mendrisio
St. Moritz
Bellinzona
Tiefencastel
Source: Geostat, Credit Suisse
Source: Credit Suisse
Relative traffic-related extens
Traffic congestionRelative traffic-related extension of journey time
Traffic congestion
Swiss Economics
Share of jobs of 10 largest sectors in percent, 2015 Overall evaluation Oberengadin: -1.2 GR: -0.5 CH: 0.0
Source: Swiss Federal Statistical Office Source: Swiss Federal Statistical Office, Credit Suisse
Secondary and tertiary sectors, in percent, specialization categories, 2011-2015 Share of newly established companies as percentage of existing companies
Source: Swiss Federal Statistical Office Source: Swiss Federal Statistical Office
RDI indicator, including commuting and childcare costs, 2016 Indexed, 2005 = 100; boxplot: average annual growth rate 2005–2016
Source: Swiss Federal Statistical Office, Forecast Credit Suisse
Financial residential attractiveness Population growth
Factsheet | December 2017
Page 2
Sectoral structure Opportunity-risk-profile
Employment development Start-up rate
Housing | Structure and demand
Factsheet | Region Oberengadin
INVESTMENT SOLUTIONS & PRODUCTS
-10% 0% 10% 20% 30%Employment: Deviation from CH average
Accomodation Retail tradeFinishing trades Construction of buildingsHealth care EducationGastronomy Land transportWholesale trade Architects, engineers
high
low
0% 5% 10% 15% 20% 25% 30%
Accomodation
Retail trade
Finishing trades
Construction of buildings
Health care
Education
Gastronomy
Land transport
Wholesale trade
Architects, engineers
Oberengadin GR CH
-20%-10% 0% 10% 20% 30% 40% 50%
Traditional industryHigh-tech industry
ConstructionEnergy supply
Trading and salesTransportation, postal services
ICTFinancial servicesCorporate services
Entertainment, hotels, cateringAdmin. and social services
Oberengadin GR CH
0%
1%
2%
3%
4%
5%
6%
7%
8%
2013 2014 2015Oberengadin GR CH
0%
1%
2%
3%
4%
5%
6%
7%
8%
9%
2013–2015
80
90
100
110
120
130
2005 2008 2011 2014 2017 2020
Oberengadin GR CH0%
1%
2%
2005–2016
Source: Swiss Federal Statistical Office
Indexed, 2005 = 100; boxplot: average annual growth rate 2005–2016
Population growth
2013Oberengadin
Source: Swiss Federal Statistical Office, Forecast Credit Suisse
2005 2008 2011 2014 2017 2020
Oberengadin
7%
Source: Swiss Federal Statistical Office
Indexed, 2005 = 100; boxplot: average annual growth rate 2005–2016
Population growth
Oberengadin
6%
Source: Swiss Federal Statistical Office, Forecast Credit Suisse
2005 2008 2011 2014 2017 2020
Oberengadin
Swiss Economics
Total number of people Total number of people, 2016
Source: Swiss Federal Statistical Office Source: Swiss Federal Statistical Office
Inward commuters, commuters within region, outward commuters, 2014 Net income 2014, median and mean, in CHF/year
#REF!
Source: Swiss Federal Statistical Office Source: Swiss Federal Tax Administration, Credit Suisse
Share of construction period in total housing stock, 2015 Ø Age in years As percentage of total for construction zones with residential usage, 2012
Source: Swiss Federal Statistical Office, Credit Suisse
INVESTMENT SOLUTIONS & PRODUCTS
Age of housing stock Construction zone reserves for housing
Factsheet | December 2017
Page 3
Net migration Migration by age group
Commuters Net household income
Housing | Inventory and supply
Factsheet | Region Oberengadin
Inwardcommuters
Outward commuters
0%
5%
10%
15%
20%
25%
30%
35%
before1919
1919–1945
1946–1960
1961–1980
1981–2000
2001–2010
2011–2015
Oberengadin GR CH30
35
40
45
50
55
60
65
2015
4'143
0
10'000
20'000
30'000
40'000
50'000
60'000
70'000
80'000
Median Mean
Oberengadin Engiadina bassa GR CH
-600
-400
-200
0
200
400
600
2000 2002 2004 2006 2008 2010 2012 2014 2016
National International Total
-100
-80
-60
-40
-20
0
20
40
60
0–4
5–9
10–1
415
–19
20–2
425
–29
30–3
435
–39
40–4
445
–49
50–5
455
–59
60–6
465
–69
70–7
475
–79
80–8
485
–89
90–9
495
+
National International Total
636 475
Source: Swiss Federal Tax Administration, Credit Suisse
Age in years As percentage of total for construction zones with residential usage, 2012
Construction zone reserves for housing
Median
Oberengadin
Source: Swiss Federal Tax Administration, Credit Suisse
Age in years As percentage of total for construction zones with residential usage, 2012
Construction zone reserves for housing
Factsheet | December 2017
Mean
Engiadina bassa GR CH
Swiss Economics
New construction, number of residential units, total over 12 months By type of housing, as percentage of stock
Source: Baublatt, Credit Suisse SFD: Single-fam. dwellings, MFD: Multi-fam. dwell. Source: Baublatt, Swiss Federal Statistical Office, Credit Suisse
Right scale: Index, Q1 2000 = 100. Left scale: growth rate in percent (YoY) Relationship of property price development to household income development
Source: Wüest Partner, Credit Suisse. Spatial dimension: MS regions
In CHF, SFD and condominiums: Q3 2017; rents: Q2 2017 Vacancies in residential units (left scale), VR: vacancy rates
Most populous municipalitiesof region
St. MoritzPoschiavoSamedanPontresinaBregaglia
Scuol
Thusis
CH (Median)
Source: Wüest Partner. Condos: condominium; SFD: single-family dwelling Source: Swiss Federal Statistical Office, Credit Suisse
Factsheet | December 2017
7'850
8'140
7'080
12'510
8'740
6'440
6'000
11'7006'850
11'32011'020
13'2905'890
12'35012'650
6'580
Property prices and rents Vacancies and vacancy rates
Net rent Condos price SFD price
per m2 / year per m2 per m2
Page 4
Planning activity Expansion and average absorption
Housing | Market outcome
Property prices (SFD and condominiums) Property prices: Price-income gap
Factsheet | Region Oberengadin
INVESTMENT SOLUTIONS & PRODUCTS
193
305148255280225
209
209
0.0% 0.5% 1.0% 1.5% 2.0%
CH
Davos
Bündner Rheintal
Domleschg/Hinterrhein
Engiadina bassa
Oberengadin
Rental apartments CondominiumsSingle-family dwellings Average previous absorption
8090100110120130140150160170180190200
-10%-8%-6%-4%-2%0%2%4%6%8%
10%12%14%
2000 2002 2004 2006 2008 2010 2012 2014 2016
Growth rate Oberengadin Price index CH
Price index Oberengadin
0.0%
0.5%
1.0%
1.5%
2.0%
2.5%
3.0%
0
100
200
300
400
500
600
2003 2005 2007 2009 2011 2013 2015 2017
Condos Oberengadin SFD OberengadinRent Oberengadin VR OberengadinVR GR VR CH
0
100
200
300
400
500
600
1995 1998 2001 2004 2007 2010 2013 2016
Building permits SFD Building permits MFDPlanning applications SFD Planning applications MFDMean bldg. permits MFD Mean bldg. permits SFD

58 Swiss Real Estate Market 2021 | March 2021
Appendix : Switzerland’s economic regions
Credit Suisse Swiss Economics has defined these economic regions on the basis of the Mobilité Spatiale regions used by the Swiss Federal Statistical Office. Political borders play less of a role in the definitions than economic phenomena, geographical and demographic features, and mobility patterns. Consequently, some of these economic regions straddle cantonal borders.
Switzerland’s economic regions
1 Zürich-Stadt 23 Thun 45 Sense 67 Schanfigg 89 Morges/Rolle 2 Glattal 24 Saanen/Obersimmental 46 Murten 68 Mittelbünden 90 Nyon 3 Furttal 25 Kandertal 47 Glâne/Veveyse 69 Domleschg/Hinterrhein 91 Vevey/Lavaux4 Limmattal 26 Berner Oberland-Ost 48 Olten/Gösgen/Gäu 70 Surselva 92 Aigle 5 Knonaueramt 27 Grenchen 49 Thal 71 Engiadina bassa 93 Pays d'Enhaut 6 Zimmerberg 28 Laufental 50 Solothurn 72 Oberengadin 94 Gros-de-Vaud 7 Pfannenstiel 29 Luzern 51 Basel-Stadt 73 Mesolcina 95 Yverdon 8 Oberland-Ost 30 Sursee/Seetal 52 Unteres Baselbiet 74 Aarau 96 La Vallée9 Oberland-West 31 Willisau 53 Oberes Baselbiet 75 Brugg/Zurzach 97 La Broye
10 Winterthur-Stadt 32 Entlebuch 54 Schaffhausen 76 Baden 98 Goms 11 Winterthur-Land 33 Uri 55 Appenzell A.Rh. 77 Mutschellen 99 Brig 12 Weinland 34 Innerschwyz 56 Appenzell I.Rh. 78 Freiamt 100 Visp 13 Unterland 35 Einsiedeln 57 St. Gallen/Rorschach 79 Fricktal 101 Leuk 14 Bern 36 March/Höfe 58 St. Galler Rheintal 80 Thurtal 102 Sierre 15 Erlach/Seeland 37 Sarneraatal 59 Werdenberg 81 Untersee/Rhein 103 Sion16 Biel/Seeland 38 Nidwalden/Engelberg 60 Sarganserland 82 Oberthurgau 104 Martigny 17 Jura bernois 39 Glarner Mittel- und Unterland 61 Linthgebiet 83 Tre Valli 105 Monthey/St-Maurice 18 Oberaargau 40 Glarner Hinterland 62 Toggenburg 84 Locarno 106 Neuchâtel 19 Burgdorf 41 Lorzenebene/Ennetsee 63 Wil 85 Bellinzona 107 La Chaux-de-Fonds 20 Oberes Emmental 42 Zuger Berggemeinden 64 Bündner Rheintal 86 Lugano 108 Val-de-Travers 21 Aaretal 43 La Sarine 65 Prättigau 87 Mendrisio 109 Genève22 Schwarzwasser 44 La Gruyère 66 Davos 88 Lausanne 110 Jura
Source: Credit Suisse
7026
72
71
84
33
83
100
68
104
98
69
23
24
65
110
103
60
7399
44
74
97
94
25
34
92
62
40
3732
3119
17
80
95
18
14
53
9
6420
63
30
8
47
3846
86
66
79
89
75
2915
45 22
54
21
90
2
39
61
35
1357
43
105
5
101
36
48
106
59
28
50
93
12
67
1
109 85
56
88
102
107
55
11
81
6
96
78 7
82
91
52
49584
4127
77
108
16
87
42
76 310
51
Swiss Real Estate Market 2021 | March 2021 59
Important Information This report represents the views of the Investment Strategy Department of CS and has not been prepared in accordance with the legal requirements de-signed to promote the independence of investment research. It is not a prod-uct of the Credit Suisse Research Department even if it references published research recommendations. CS has policies in place to manage conflicts of interest including policies relating to dealing ahead of the dissemination of investment research. These policies do not apply to the views of Investment Strategists contained in this report.
Risk Warning Every investment involves risk, especially with regard to fluctuations in value and return. If an investment is denominated in a currency other than your base currency, changes in the rate of exchange may have an adverse effect on value, price or income.
This document may include information on investments that involve special risks. You should seek the advice of your independent financial advisor prior to taking any investment decisions based on this document or for any neces-sary explanation of its contents. Further information is also available in the information brochure “Risks Involved in Trading Financial Instruments” availa-ble from the Swiss Bankers Association.
Past performance is not an indicator of future performance. Perfor-mance can be affected by commissions, fees or other charges as well as exchange rate fluctuations.
Financial market risks Historical returns and financial market scenarios are no reliable indicators of future performance. The price and value of investments mentioned and any income that might accrue could fall or rise or fluctuate. You should consult with such advisor(s) as you consider necessary to assist you in making these determinations.
Investments may have no public market or only a restricted secondary market. Where a secondary market exists, it is not possible to predict the price at which investments will trade in the market or whether such market will be liquid or illiquid.
Emerging markets Where this document relates to emerging markets, you should be aware that there are uncertainties and risks associated with investments and transactions in various types of investments of, or related or linked to, issuers and obligors incorporated, based or principally engaged in business in emerging markets countries. Investments related to emerging markets countries may be consid-ered speculative, and their prices will be much more volatile than those in the more developed countries of the world. Investments in emerging markets in-vestments should be made only by sophisticated investors or experienced pro-fessionals who have independent knowledge of the relevant markets, are able to consider and weigh the various risks presented by such investments, and have the financial resources necessary to bear the substantial risk of loss of investment in such investments. It is your responsibility to manage the risks which arise as a result of investing in emerging markets investments and the allocation of assets in your portfolio. You should seek advice from your own advisers with regard to the various risks and factors to be considered when investing in an emerging markets investment.
Alternative investments Hedge funds are not subject to the numerous investor protection regulations that apply to regulated authorized collective investments and hedge fund man-agers are largely unregulated. Hedge funds are not limited to any particular investment discipline or trading strategy, and seek to profit in all kinds of mar-kets by using leverage, derivatives, and complex speculative investment strat-egies that may increase the risk of investment loss.
Commodity transactions carry a high degree of risk, including the loss of the entire investment, and may not be suitable for many private investors. The performance of such investments depends on unpredictable factors such as natural catastrophes, climate influences, hauling capacities, political unrest, seasonal fluctuations and strong influences of rolling-forward, particularly in futures and indices.
Investors in real estate are exposed to liquidity, foreign currency and other risks, including cyclical risk, rental and local market risk as well as environ-mental risk, and changes to the legal situation.
Private Equity Private Equity (hereafter “PE”) means private equity capital investment in com-panies that are not traded publicly (i.e. are not listed on a stock exchange), they are complex, usually illiquid and long-lasting. Investments in a PE fund
generally involve a significant degree of financial and/or business risk. Invest-ments in PEfunds are not principal-protected nor guaranteed. Investors will be required to meet capital calls of investments over an extended period of time. Failure to do so may traditionally result in the forfeiture of a portion or the entirety of the capital account, forego any future income or gains on invest-ments made prior to such default and among other things, lose any rights to participate in future investments or forced to sell their investments at a very low price, much lower than secondary market valuations. Companies or funds may be highly leveraged and therefore may be more sensitive to adverse busi-ness and/or financial developments or economic factors. Such investments may face intense competition, changing business or economic conditions or other developments that may adversely affect their performance.
Interest rate and credit risks The retention of value of a bond is dependent on the creditworthiness of the Issuer and/or Guarantor (as applicable), which may change over the term of the bond. In the event of default by the Issuer and/or Guarantor of the bond, the bond or any income derived from it is not guaranteed and you may get back none of, or less than, what was originally invested.
Investment Strategy Department Investment Strategists are responsible for multi-asset class strategy formation and subsequent implementation in CS’s discretionary and advisory busi-nesses. If shown, Model Portfolios are provided for illustrative purposes only. Your asset allocation, portfolio weightings and performance may look signifi-cantly different based on your particular circumstances and risk tolerance. Opinions and views of Investment Strategists may be different from those ex-pressed by other Departments at CS. Investment Strategist views may change at any time without notice and with no obligation to update. CS is under no obligation to ensure that such updates are brought to your attention.
From time to time, Investment Strategists may reference previously published Research articles, including recommendations and rating changes collated in the form of lists. The recommendations contained herein are extracts and/or references to previously published recommendations by Credit Suisse Re-search. For equities, this relates to the respective Company Note or Company Summary of the issuer. Recommendations for bonds can be found within the respective Research Alert (bonds) publication or Institutional Research Flash/Alert – Credit Update Switzerland. These items are available on request or from https://investment.credit-suisse.com. Disclosures are available from www.credit-suisse.com/disclosure.
Global disclaimer/Important Information The information provided herein constitutes marketing material; it is not invest-ment research.
This document is not directed to, or intended for distribution to or use by, any person or entity who is a citizen or resident of or located in any locality, state, country or other jurisdiction where such distribution, publication, availability or use would be contrary to law or regulation or which would subject CS to any regis-tration or licensing requirement within such jurisdiction.
References in this document to CS include Credit Suisse AG, the Swiss bank, its subsidiaries and affiliates. For more information on our structure, please use the following link: http://www.credit-suisse.com
NO DISTRIBUTION, SOLICITATION, OR ADVICE: This document is provided for information and illustrative purposes and is intended for your use only. It is not a solicitation, offer or recommendation to buy or sell any security or other financial instrument. Any information including facts, opinions or quotations, may be condensed or summarized and is expressed as of the date of writing. The information contained in this document has been provided as a general market commentary only and does not constitute any form of regulated investment re-search financial advice, legal, tax or other regulated service. It does not take into account the financial objectives, situation or needs of any persons, which are necessary considerations before making any investment decision. You should seek the advice of your independent financial advisor prior to taking any invest-ment decisions based on this document or for any necessary explanation of its contents. This document is intended only to provide observations and views of CS at the date of writing, regardless of the date on which you receive or access the information. Observations and views contained in this document may be dif-ferent from those expressed by other Departments at CS and may change at any time without notice and with no obligation to update. CS is under no obliga-tion to ensure that such updates are brought to your attention. FORECASTS & ESTIMATES: Past performance should not be taken as an indication or guar-antee of future performance, and no representation or warranty, express or im-plied, is made regarding future performance. To the extent that this document contains statements about future performance, such statements are forward looking and subject to a number of risks and uncertainties. Unless indicated to the contrary, all figures are unaudited. All valuations mentioned herein are subject

60 Swiss Real Estate Market 2021 | March 2021
to CS valuation policies and procedures. CONFLICTS: CS reserves the right to remedy any errors that may be present in this document. CS, its affiliates and/or their employees may have a position or holding, or other material interest or ef-fect transactions in any securities mentioned or options thereon, or other invest-ments related thereto and from time to time may add to or dispose of such in-vestments. CS may be providing, or have provided within the previous 12 months, significant advice or investment services in relation to the investments listed in this document or a related investment to any company or issuer men-tioned. Some investments referred to in this document will be offered by a single entity or an associate of CS or CS may be the only market maker in such invest-ments. CS is involved in many businesses that relate to companies mentioned in this document. These businesses include specialized trading, risk arbitrage, mar-ket making, and other proprietary trading. TAX: Nothing in this document con-stitutes investment, legal, accounting or tax advice. CS does not advise on the tax consequences of investments and you are advised to contact an independent tax advisor. The levels and basis of taxation are dependent on individual circum-stances and are subject to change. SOURCES: Information and opinions pre-sented in this document have been obtained or derived from sources which in the opinion of CS are reliable, but CS makes no representation as to their accu-racy or completeness. CS accepts no liability for a loss arising from the use of this document. WEBSITES: This document may provide the addresses of, or contain hyperlinks to, websites. Except to the extent to which the document re-fers to website material of CS, CS has not reviewed the linked site and takes no responsibility for the content contained therein. Such address or hyperlink (in-cluding addresses or hyperlinks to CS’s own website material) is provided solely for your convenience and information and the content of the linked site does not in any way form part of this document. Accessing such website or following such link through this document or CS’s website shall be at your own risk. DATA PRIVACY: Your Personal Data will be processed in accordance with the Credit Suisse privacy statement accessible at your domicile through the official Credit Suisse website https://www.credit-suisse.com. In order to provide you with mar-keting materials concerning our products and services, Credit Suisse Group AG and its subsidiaries may process your basic Personal Data (i.e. contact details such as name, e-mail address) until you notify us that you no longer wish to receive them. You can opt-out from receiving these materials at any time by informing your Relationship Manager. Distributing entities Except as otherwise specified herein, this report is distributed by Credit Suisse AG, a Swiss bank, authorized and regulated by the Swiss Financial Market Su-pervisory Authority. Austria: This report is either distributed by CREDIT SUISSE (LUXEMBOURG) S.A. Zweigniederlassung Österreich (the “Austria branch”) or by Credit Suisse (Deutschland) AG. The Austria branch is a branch of CREDIT SUISSE (LUX-EMBOURG) S.A., a duly authorized credit institution in the Grand Duchy of Lux-embourg with registered address 5, rue Jean Monnet, L-2180 Luxembourg. The Austria branch is subject to the prudential supervision of the Luxembourg supervisory authority, the Commission de Surveillance du Secteur Financier (CSSF), 283, route d’Arlon, L-1150 Luxembourg, Grand Duchy of Luxem-bourg, as well as of the Austrian supervisory authority, the Financial Market Au-thority (FMA), Otto-Wagner Platz 5, A-1090 Vienna, Austria. Credit Suisse (Deutschland) Aktiengesellschaft is supervised by the German supervisory au-thority Bundesanstalt für Finanzdienstleistungsaufsicht („BaFin“) in collaboration with the Austrian supervisory authority, the Financial Market Authority (FMA), Otto-Wagner Platz 5, A-1090 Vienna, Austria. Bahrain: This report is distrib-uted by Credit Suisse AG, Bahrain Branch, a branch of Credit Suisse AG, Zur-ich/Switzerland, duly authorized and regulated by the Central Bank of Bahrain (CBB) as an Investment Business Firm Category 2. Related financial services or products are only made available to Accredited Investors, as defined by the CBB, and are not intended for any other persons. The Central Bank of Bahrain has not reviewed, nor has it approved, this document or the marketing of any investment vehicle referred to herein in the Kingdom of Bahrain and is not re-sponsible for the performance of any such investment vehicle. Credit Suisse AG, Bahrain Branch is located at Level 21-22, East Tower, Bahrain World Trade Centre, Manama, Kingdom of Bahrain. Chile: This report is distributed by Credit Suisse Agencia de Valores (Chile) Limitada, a branch of Credit Suisse AG (in-corporated in the Canton of Zurich), regulated by the Chilean Financial Market Commission. Neither the issuer nor the securities have been registered with the Financial Market Commission of Chile (Comisión para el Mercado Financiero) pursuant to Law no. 18.045, the Ley de Mercado de Valores, and regulations thereunder, so they may not be offered or sold publicly in Chile. This document does not constitute an offer of, or an invitation to subscribe for or purchase, the securities in the Republic of Chile, other than to individually identified investors pursuant to a private offering within the meaning of article 4 of the Ley de Mer-cado de Valores (an offer that is not “addressed to the public in general or to a certain sector or specific group of the public”). DIFC: This information is being distributed by Credit Suisse AG (DIFC Branch). Credit Suisse AG (DIFC Branch) is licensed and regulated by the Dubai Financial Services Authority (“DFSA”). Related financial services or products are only made available to Professional Clients or Market Counterparties, as defined by the DFSA, and are not intended for any other persons. Credit Suisse AG (DIFC Branch) is located on Level 9 East, The Gate Building, DIFC, Dubai, United Arab Emirates. France: This re-port is distributed by Credit Suisse (Luxembourg) S.A. Succursale en France
(the “France branch”) which is a branch of Credit Suisse (Luxembourg) S.A., a duly authorized credit institution in the Grand Duchy of Luxembourg with regis-tered address 5, rue Jean Monnet, L-2180 Luxembourg. The France branch is subject to the prudential supervision of the Luxembourg supervisory authority, the Commission de Surveillance du Secteur Financier (CSSF), and of the French supervisory authorities, the Autorité de Contrôle Prudentiel et de Résolution (ACPR) and the Autorité des Marchés Financiers (AMF). Germany: This report is distributed by Credit Suisse (Deutschland) Aktiengesellschaft regulated by the Bundesanstalt für Finanzdienstleistungsaufsicht („BaFin“). Guernsey: This re-port is distributed by Credit Suisse AG Guernsey Branch, a branch of Credit Suisse AG (incorporated in the Canton of Zurich), with its place of business at Helvetia Court, Les Echelons, South Esplanade, St Peter Port, Guernsey. Credit Suisse AG Guernsey Branch is wholly owned by Credit Suisse AG and is regu-lated by the Guernsey Financial Services Commission. Copies of the latest au-dited accounts of Credit Suisse AG are available on request. India: This report is distributed by Credit Suisse Securities (India) Private Limited (CIN no. U67120MH1996PTC104392) regulated by the Securities and Exchange Board of India as Research Analyst (registration no. INH 000001030), as Port-folio Manager (registration no. INP000002478) and as Stock Broker (registra-tion no. INZ000248233), having registered address at 9th Floor, Ceejay House, Dr. Annie Besant Road, Worli, Mumbai – 400 018, India, T- +91-22 6777 3777. Israel: If distributed by Credit Suisse Financial Services (Israel) Ltd. in Israel: This document is distributed by Credit Suisse Financial Services (Israel) Ltd. Credit Suisse AG, including the services offered in Israel, is not supervised by the Supervisor of Banks at the Bank of Israel, but by the competent banking supervision authority in Switzerland. Credit Suisse Financial Services (Israel) Ltd. is a licensed investment marketer in Israel and thus, its investment marketing activities are supervised by the Israel Securities Authority. Italy: This report is distributed in Italy by Credit Suisse (Italy) S.p.A., a bank incorporated and regis-tered under Italian law subject to the supervision and control of Banca d’Italia and CONSOB. Lebanon: This report is distributed by Credit Suisse (Lebanon) Finance SAL (“CSLF”), a financial institution incorporated in Lebanon and regu-lated by the Central Bank of Lebanon (“CBL”) and having a financial institution license number 42. Credit Suisse (Lebanon) Finance SAL is subject to the CBL’s laws and circulars as well as the laws and regulations of the Capital Mar-kets Authority of Lebanon (“CMA”). CSLF is a subsidiary of Credit Suisse AG and part of the Credit Suisse Group (CS). The CMA does not accept any re-sponsibility for the content of the information included in this report, including the accuracy or completeness of such information. The liability for the content of this report lies with the issuer, its directors and other persons, such as experts, whose opinions are included in the report with their consent. The CMA has also not assessed the suitability of the investment for any particular investor or type of investor. It is hereby expressly understood and acknowledged that investments in financial markets may involve a high degree of complexity and risk of loss in value and may not be suitable to all investors. The suitability assessment per-formed by CSLF with respect to this investment will be undertaken based on information that the investor would have provided to CSLF as at the date of such assessment and in accordance with Credit Suisse internal policies and pro-cesses. It is understood that the English language will be used in all communi-cation and documentation provided by CS and/or CSLF. By accepting to invest in the product, the investor expressly and irrevocably confirms that he fully un-derstands, and has no objection to the use of the English language. Luxem-bourg: This report is distributed by Credit Suisse (Luxembourg) S.A., a duly authorized credit institution in the Grand Duchy of Luxembourg with registered address 5, rue Jean Monnet, L-2180 Luxembourg. Credit Suisse (Luxembourg) S.A. is subject to the prudential supervision of the Luxembourg supervisory au-thority, the Commission de Surveillance du Secteur Financier (CSSF). Mexico: This document represents the vision of the person who provides his/her services to C. Suisse Asesoría México, S.A. de C.V. (“C. Suisse Asesoría”) and/or Banco Credit Suisse (México), S.A., Institución de Banca Múltiple, Grupo Financiero Credit Suisse (México) (“Banco CS”) so that both C. Suisse Asesoría and Banco CS reserve the right to change their mind at any time not assuming any liability in this regard. This document is distributed for informational purposes only, and does not imply a personal recommendation or suggestion, nor the invitation to celebrate any operation and does not replace the communication you have with your executive in relation to C. Suisse Asesoría and/or Banco CS prior to taking any investment decision. C. Suisse Asesoría and/or Banco CS does not assume any responsibility for investment decisions based on information contained in the document sent, as the same may not take into account the context of the in-vestment strategy and objectives of particular clients. Prospectus, brochures, investment regimes of investment funds, annual reports or periodic financial in-formation contain all additional useful information for investors. These documents can be obtained free of charge directly from issuers, operators of investment funds, in the Internet page of the stock exchange in which they are listed or through its executive in C. Suisse Asesoría and/or Banco CS. Past performance and the various scenarios of existing markets do not guarantee present or future yields. In the event that the information contained in this document is incomplete, incorrect or unclear, please contact your Executive of C. Suisse Asesoría and/or Banco CS as soon as possible. It is possible that this document may suffer mod-ifications without any responsibility for C. Suisse Asesoría and/or Banco CS. This document is distributed for informational purposes only and is not a substi-tute for the Operations Reports and/or Account Statements you receive from C. Suisse Asesoría and/or Banco CS in terms of the General Provisions Applicable to Financial Institutions and other Legal Entities that Provide Investment Services
Swiss Real Estate Market 2021 | March 2021 61
issued by the Mexican Banking and Securities Commission (“CNBV”). Given the nature of this document, C. Suisse Asesoría and/or Banco CS does not assume any responsibility derived from the information contained therein. Without preju-dice to the fact that the information was obtained from or based on sources believed to be reliable by C. Suisse Asesoría and/or Banco CS, there is no guar-antee that the information is either accurate or complete. Banco CS and/or C. Suisse Asesoría does not accept any liability arising from any loss arising from the use of the information contained in the document sent to you. It is recom-mended that investor make sure that the information provided is in accordance to his/her personal circumstances and investment profile, in relation to any par-ticular legal, regulatory or fiscal situation, or to obtain independent professional advice. C. Suisse Asesoría México, S.A. de C.V. is an investment adviser created in accordance with the Mexican Securities Market Law ("LMV"), registered with the CNBV under the folio number 30070. C. Suisse Asesoría México, S.A. de C.V. is not part of Grupo Financiero Credit Suisse (México), S.A. de C.V., or any other financial group in Mexico. C. Suisse Asesoría México, S.A. de C.V. is not an independent investment adviser as provided by LMV and other applicable regulations due to its direct relationship with Credit Suisse AG, a foreign financial institution, and its indirect relationship with the entities that make up Grupo Fi-nanciero Credit Suisse (México), S.A. de C.V. Netherlands: This report is dis-tributed by Credit Suisse (Luxembourg) S.A., Netherlands Branch (the “Nether-lands branch”) which is a branch of Credit Suisse (Luxembourg) S.A., a duly authorized credit institution in the Grand Duchy of Luxembourg with registered address 5, rue Jean Monnet, L-2180 Luxembourg. The Netherlands branch is subject to the prudential supervision of the Luxembourg supervisory authority, the Commission de Surveillance du Secteur Financier (CSSF), and of the Dutch supervisory authority, De Nederlansche Bank (DNB), and of the Dutch market supervisor, the Autoriteit Financiële Markten (AFM). Portugal: This report is dis-tributed by Credit Suisse (Luxembourg) S.A., Sucursal em Portugal (the “Portu-gal branch”) which is a branch of Credit Suisse (Luxembourg) S.A., a duly au-thorized credit institution in the Grand Duchy of Luxembourg with registered ad-dress 5, rue Jean Monnet, L-2180 Luxembourg. The Portugal branch is subject to the prudential supervision of the Luxembourg supervisory authority, the Com-mission de Surveillance du Secteur Financier (CSSF), and of the Portuguese supervisory authorities, the Banco de Portugal (BdP) and the Comissão do Mer-cado dos Valores Mobiliários (CMVM). Qatar: This information has been distrib-uted by Credit Suisse (Qatar) L.L.C., which is duly authorized and regulated by the Qatar Financial Centre Regulatory Authority (QFCRA) under QFC License No. 00005. All related financial products or services will only be available to Eli-gible Counterparties (as defined by the QFCRA) or Business Custormers (as defined by the QFCRA), including individuals, who have opted to be classified as a Business Customer, with net assets in excess of QR 4 million, and who have sufficient financial knowledge, experience and understanding to participate in such products and/or services. Therefore this information must not be delivered to, or relied on by, any other type of individual. Saudi Arabia: This document is being distributed by Credit Suisse Saudi Arabia (CR Number 1010228645), duly licensed and regulated by the Saudi Arabian Capital Market Authority pursuant to License Number 08104-37 dated 23/03/1429H corresponding to 21/03/2008AD. Credit Suisse Saudi Arabia’s principal place of business is at King Fahad Road, Hay Al Mhamadiya, 12361-6858 Riyadh, Saudi Arabia. Web-site: https://www.credit-suisse.com/sa. Under the Rules on the Offer of Secu-rities and Continuing Obligations this document may not be distributed in the Kingdom except to such persons as are permitted under the Rules on the Offer of Securities and Continuing Obligations issued by the Capital Market Authority. The Capital Market Authority does not make any representation as to the accu-racy or completeness of this document, and expressly disclaims any liability what-soever for any loss arising from, or incurred in reliance upon, any part of this document. Prospective purchasers of the securities offered hereby should con-duct their own due diligence on the accuracy of the information relating to the securities. If you do not understand the contents of this document, you should consult an authorised financial advisor. Under the Investment Fund Regulations this document may not be distributed in the Kingdom except to such persons as are permitted under the Investment Fund Regulations issued by the Capital Mar-ket Authority. The Capital Market Authority does not make any representation as to the accuracy or completeness of this document, and expressly disclaims any
liability whatsoever for any loss arising from, or incurred in reliance upon, any part of this document. Prospective subscribers of the securities offered hereby should conduct their own due diligence on the accuracy of the information relating to the securities. If you do not understand the contents of this document you should consult an authorised financial adviser. South Africa: This information is being distributed by Credit Suisse AG which is registered as a financial services pro-vider with the Financial Sector Conduct Authority in South Africa with FSP num-ber 9788 and / or by Credit Suisse (UK) Limited which is registered as a financial services provider with the Financial Sector Conduct Authority in South Africa with FSP number 48779. Spain: This document is a marketing material and is pro-vided by Credit Suisse AG, Sucursal en España, legal entity registered at the Comisión Nacional del Mercado de Valores for information purposes. It is exclu-sively addressed to the recipient for personal use only and, according to current regulations in force, by no means can it be considered as a security offer, per-sonal investment advice or any general or specific recommendation of products or investment strategies with the aim that you perform any operation. The client shall be deemed responsible, in all cases, for taking whatever decisions on in-vestments or disinvestments, and therefore the client takes all responsibility for the benefits or losses resulting from the operations that the client decides to perform based on the information and opinions included in this document. This document is not the result of a financial analysis or research and therefore, nei-ther it is subject to the current regulations that apply to the production and dis-tribution of financial research, nor its content complies with the legal require-ments of independence of financial research. Turkey: The investment infor-mation, comments and recommendations contained herein are not within the scope of investment advisory activity. The investment advisory services are pro-vided by the authorized institutions to the persons in a customized manner taking into account the risk and return preferences of the persons. Whereas, the com-ments and advices included herein are of general nature. Therefore recommen-dations may not be suitable for your financial status or risk and yield preferences. For this reason, making an investment decision only by relying on the information given herein may not give rise to results that fit your expectations. This report is distributed by Credit Suisse Istanbul Menkul Degerler Anonim Sirketi, regulated by the Capital Markets Board of Turkey, with its registered address at Levazim Mahallesi, Koru Sokak No. 2 Zorlu Center Terasevler No. 61 34340 Besiktas/ Istanbul-Turkey. United Kingdom: This material is distributed by Credit Suisse (UK) Limited. Credit Suisse (UK) Limited, is authorized by the Prudential Regu-lation Authority and regulated by the Financial Conduct Authority and the Pru-dential Regulation Authority. Where this material is distributed into the United Kingdom by an offshore entity not exempted under the Financial Services and Markets Act 2000 (Financial Promotion) Order 2005 the following will apply: To the extent communicated in the United Kingdom (“UK”) or capable of having an effect in the UK, this document constitutes a financial promotion which has been approved by Credit Suisse (UK) Limited which is authorized by the Prudential Regulation Authority and regulated by the Financial Conduct Authority and the Prudential Regulation Authority for the conduct of investment business in the UK. The registered address of Credit Suisse (UK) Limited is Five Cabot Square, London, E14 4QR. Please note that the rules under the UK’s Financial Services and Markets Act 2000 relating to the protection of retail clients will not be appli-cable to you and that any potential compensation made available to “eligible claimants” under the UK’s Financial Services Compensation Scheme will also not be available to you. Tax treatment depends on the individual circumstances of each client and may be subject to changes in future. UNITED STATES: NEITHER THIS REPORT NOR ANY COPY THEREOF MAY BE SENT, TAKEN INTO OR DISTRIBUTED IN THE UNITED STATES OR TO ANY US PERSON (within the meaning of Regulation S under the US Securities Act of 1933, as amended). This report may not be reproduced either in whole or in part, without the written permission of Credit Suisse. Copyright © 2021 Credit Suisse Group AG and/or its affiliates. All rights reserved. 21C014A_IS

62 Swiss Real Estate Market 2021 | March 2021

Swiss Real Estate Market 2021 | March 2021 63
Other publications from Credit Suisse
Retail Outlook 2021
The annual study on the Swiss retail sector explores the eco-nomic prospects for the sector as well as current challenges.
January 6, 2021
Swiss Construction Index Q1 2021
The quarterly Swiss Construction Index provides up-to-date in-formation about the economy in the construction industry and contains estimates and background information regarding sales performance in the construction sector.
February 25, 2021
Monitor Switzerland Q1 2021
The Monitor Switzerland contains analysis and forecasts for the Swiss economy.
March 16, 2021
Swiss Real Estate Monitor Q2 2021
The Real Estate Monitor provides an update on all market de-velopments related to the real estate sector three times a year, thereby supplementing the fundamental analyses and special topics addressed in the annual Credit Suisse Real Estate Study.
June 2, 2021
The next Real Estate Market study will be published in March 2022. Subscribe to our publications directly from your relationship manager.

02/2020 credit-suisse.com/novum
Asset Management
Novum07
510
0D
Seite 06
UrbanisierungChance und Herausforderung.
Seite 34
Prestigeobjekt in MünchenElementum – Bürozukunft im Bahnhofsviertel.
Hotspot Stadt: die Kunst der urbanen Verdichtung
Seite 12
Verdichtetes BauenMenschen wollen in der Stadt wohnen. Wichtig ist, wieweit und wie verdichtet wird.
Scope
credit-suisse.com/scope
02/2020
Asset Management
Page 28
Page 20
Page 06
0755
19E
Logistics real estateE-commerce is driving up
demand for logistics and
warehousing facilities.
Family firmsTheir strengths and the reasons for their
outperformance.
Staying level-headed beats hectic day trading
Scope interview with Alexandre Bouchardy.
Subscribe to new perspectives.
Copyright © 2021 CREDIT SUISSE GROUP AG and/or its affiliates. All rights reserved.
Read about exciting real estate topics in Novum and expand your knowledge on current investment themes with Scope from Asset Management. credit-suisse.com/publications
Subscribe now:
Asset Management