home stretch - wordpress.com · home stretch: comparing housing ... , here are the 10 most- and...
TRANSCRIPT

1
Home Stretch: Comparing housing affordability in B.C.’s hottest markets
June 2017
Highlights• TheoverallaffordabilityofresidentialpropertiessoldinthecityofVancouverworsened2.9%inthe12months
endedFebruary28,2017,butothermunicipalitiessawmoredramaticdeclines:affordabilitydropped38%inNorthVancouver(district),31%inDelta;29%inLangley(township)and23%inMapleRidge.
• ThemedianpriceofadetachedhomeinthecityofVancouverpeakedat$2.7millioninJuly2016;thispricerequired182%oftheregion’smedianhouseholdincometopurchase.
• Themedianannualhouseholdincomeforinthe12monthsendedFebruary28,2017was$79,498inVancouverCensusMetropolitanArea(CMA);$73,800inAbbostford-MissionCMA;$74,637inChilliwackCMA;$90,361inVictoriaCMA.
• ThemedianpriceofallpropertiessoldinMetroVancouverrose9%inthe12monthsendedFebruary28,2017,versusa7%increaseayearearlier.
• DetachedpropertiesinMetroVancouversawthegreatestincreaseinprice,withthemedianrising18%.
• Themedianpriceofacondoapartmentrose5%andanattachedpropertyrose13%inMetroVancouver.
• InAugust2016,B.C.introduceda15%propertytransfertaxonforeignnationals’purchasesofresidentialrealestateinMetroVancouver.Combinedwitha3%propertytransfertaxonthevalueofhomesmorethan$2million,thetopendofthemarketmainlycooled.
• TheaveragenumberofpropertiesthatsoldeachmonthinMetroVancouverfor$4millionormore(mostlydetachedhomes)decreased68%intheeightmonthsfollowingintroductionofthenewtax.Bycomparison,thenumberofunitsinMetroVancouverthatsoldforlessthan$500,000(mostoftencondoapartments)declined38%.
• DespitethepressureonaffordabilityintheLowerMainland,someareassawaffordabilityimproveinthe12monthsendedFebruary28,2017.Overallaffordabilityimprovedby1%inbothRichmondandWhiteRock.
• Usingmedianhouseholdincomesandthemedianpriceforallpropertytypes(detached,attachedandapartments)foreachregion,herearethe10most-andleast-affordablemunicipalitiesforthe12monthsendedFebruary28,2017,bygrossdebtservice(GDS)ratio.*
Make Good Money (TM) is a trademark of Vancouver City Savings Credit Union.
* Grossdebtserviceratio(GDS)isthepercentageofahousehold’sgrossmonthlyincomerequiredtocovermortgagecosts,propertytaxesandmaintenance (suchasstratafeesandheating).**Basedonallsalesforthe12monthsendedFebruary28,2017usingrealestatedatafromLandcorDataCorp.
Most affordable **Median price GDS ratio Least affordable **Median price GDS ratio
1.Langley(city) $271,250 18.4% 1. WestVancouver $2,821,500 191.8%
2. Sooke $405,000 24.2% 2.LionsBay $1,425,000 96.9%
3. Victoria $429,950 25.7% 3.NorthVancouver(district) $1,360,000 92.5%
4. Esquimalt $449,450 26.9% 4. OakBay $1,045,000 62.5%
5. Chilliwack $385,000 27.9% 5. Delta $855,000 58.1%
6. NewWestminster $430,250 29.3% 6.BowenIsland $780,000 53.0%
7. Sidney $495,000 29.6% 7. Vancouver $715,000 48.6%
8. PittMeadows $450,000 30.6% 8.NorthSaanich $800,000 47.9%
9. PortCoquitlam $470,950 32.0% 9. Squamish $535,000 42.8%
10. Abbotsford $472,870 34.6% 10.Langley(township) $625,000 42.5%
Most and least affordable properties by municipality: overall

2
Beyond a buyer’s reachMetroVancouver’ssky-highpropertyvalueshavebeenarecurringissuesincethe1880s,withthecostofhousingbeingoneofthefundamentaltruthsofVancouverinparticular.“Why,theworkingmencannotaffordtopayattheratedemandedforthesetinyoutsidelots,”BC Magazine reportedthelocalssayingin1911.“Thesamethingwassaidhere20yearsago,answerthepioneers;othersofusknowthatitwasrepeated10yearsagoandfiveyearsago,andourchildrenandourchildren’schildrenwillhearthesametaleofwoedecadeshence.”1Today,theissueisnolongersimplyaVancouverproblembutonethatconfrontstheentireregion.CondomarketerBobRennie,whohasenjoyedhugesuccessmarketingnewdevelopments,haswarnedthatcostlyhousingrisksbecomingintrinsictotheregion’sidentity,itsbrand.2
ThemedianpriceofallpropertiessoldinMetroVancouverforthe12monthsendedFebruary28,2017was$575,000,accordingtoLandcorDataCorp.,9%higherthanayearearlier.Theincreasewasgreatestfordetachedproperties,whichrose18%toreach$988,000.3ThescaleoftheincreaseshasfuelledtalkofacrisisofaffordabilityinthecityofVancouver,theregion’scoreandlongaposterchildforhighhousingcosts.Themedianpriceofadetachedhomeinthecitypeakedat$2.7millioninJuly2016,asumthatwouldrequire182%oftheregion’smedianhouseholdincometopurchase–morethanfive-and-a-halftimesthe32%proportionthatCanadaMortgageandHousingCorp.considersaffordable.4It’snotjustatraditionaldetachedhomethat’sbeyondthereachofbuyers.Attachedpropertiesinthecityremainextremelyunaffordable,withamedianpriceof$1.1millionthatrequires75%oftheregion’smedianhouseholdincome.Apartments,5byfarthecity’s
mostaffordable–andthereforepopular–formofhousing,soldforamedianpriceof$550,000.Whilethiswouldrequirejust37%oftheregion’smedianhouseholdincome,it’shardlyaffordablebyanystandardmeasure.
Yetaffordablehousing,whilescarce,doesexist.Variousgovernmentpoliciesimplementedoverthepastyearhaveevenhelpedslowitsdisappearance.Thisreportmeasuresshiftsinaffordability,bothdeclinesandimprovements,inB.C.’shottestrealestatemarkets,andidentifieswherepocketsofaffordabilityremainforbuyersseekingahome.Unlikethemonthlystatisticalreportsreleasedbylocalrealestateboards,thisreportusesthemostcomprehensivedataavailablefromLandcorDataCorp.,whichgathersdatafromtransactionsofallproperties,bothnewandresale.Processingthisdata,whichisbasedonlandtransferrecords,takesabouttwomonths.
Roots and remedies
ThecausesofMetroVancouver’saffordabilitycruncharemany,andsolutionshaveeludedtheexperts.Historicallylowinterestrateshavegivenmanypeoplethemeanstospendmoreforaprincipalresidencethantheymightotherwisepurchase,helpingthemsecurepropertiesbutalsofuellingcompetitivebiddingprocesses.Yetlocalsourcesareoftenunabletocompetewithforeigncapitaltomakeattractiveofferstolong-timehomeowners,andbuyersbackedsolelybylocalincomesfindthemselvespricedout.
In2016,thecombinationoffactorspromptedgovernmentstointervene.
ThefirstinterventioncamewiththeFebruary2016provincialbudget,whichincreasedthepropertytransfertaxpayableonthevalueofhomesabove$2millionto3%from2%.6Then,inMay,tighterrulesgoverningtheassignmentofcontracts
Chart 1: MLS Sales January 2016 - March 2017, Vancouver CMA
Source:REBGV,FVREB,CMHCcalculations
<$500K
$500Kto$750K
$750Kto$1M
$1Mto$2M
$2Mto$4M
$4M+
8,000
6,000
4,000
2,000
0Jan 2016
Mar 2016
May 2016
July 2016
Sept 2016
Nov 2016
% Change
Pre-taxvs.
Post-tax
-68%
-63%
-56%
-48%
-35%
-38%Jan 2017
Mar 2017
ForeignBuyersTax

3
Chart 2: Metro Vancouver median prices and affordability, 12 months ended February 28, 2017
Affordability–apartment
Affordability–attachedAffordability–all
Affordability–detached
Source:Vancity,usingrealestatedatafromLandcorDataCorp.andmedianhouseholdincomeforMetroVancouver;12monthsendedFebruary28,2017.
$1,200,000
$1,000,000
$800,000
$600,000
$400,000
$200,000
$0
80%
70%
60%
50%
40%
30%
20%
10%
0%
Price–all
Price–detached
Price–attached
Price–apartment
GDS
March 2016
April 2016
May 2016
June 2016
July 2016
Aug 2016
Sept 2016
Oct 2016
Nov 2016
Dec 2016
Jan 2017
Feb 2017
tookeffectinresponsetowidespreadconcernaboutthepracticeofshadow-flippingandtheeffectitwashavingonhousingprices.7Summer2016sawtheprovincebegintrackingtheparticipationofforeignbuyersintheprovince’srealestatemarkets.Theresult,inAugust,wasanew15%propertytransfertaxonforeignnationals’purchasesofresidentialrealestateinMetroVancouver.8Withinamonth,foreignparticipationintheMetroVancouvermarketvirtuallydisappeared.9
Thecombinedeffectofthevariousmeasureswasadramaticcoolingatthetopendofthemarket.CanadaMortgageandHousingCorp.reportstheaveragenumberofpropertiesthatsoldeachmonthinMetroVancouverfor$4millionormoredecreased68%intheeightmonthsfollowingimplementationofthetax.Similarly,thosesellingfor$2millionto$4millionsawsalesdeclineby63%.Thevastmajorityoftheseweredetachedhomes.Bycontrast,salesofunits$500,000orless–mostoftencondoapartments–declinedjust38%.10
ThedataLandcorprovidedforthisstudybearsoutthesetrends.Inthesevenmonthssincethepropertytransfertaxonforeignpurchasestookeffect,averagemonthlysalesofdetachedhomesfellinallbutoneofthemunicipalitiesthisreportconsiderscomparedtothesevenmonthsbefore
theincrease(Sidney,onVancouverIsland,wastheexception).Bycontrast,averagemonthlyapartmentsalesincreasedin11municipalities,includingNorthVancouvercityanddistrict,Richmond,Surrey,andbothLangleycityandtownship.
Meanwhile,theBankofCanada’sbenchmarkfive-yearfixedmortgageratedroppedinSeptember2016to4.64%from4.74%.InOctober2016,thefederalgovernmentbeganrequiringthoseseekinginsuredmortgagestomeetastresstestdemonstratingtheirabilitytomakepaymentsintheeventofinterestratehikes.11Themovewasseenascreatinganewhurdlethatwouldbenefitsomewhilemakingitmoredifficultformanyotherstoachievehomeownership.
Tofurtherassistfirst-timehomebuyers,B.C.announcedathree-yearprograminDecemberthatwouldprovidefirst-timebuyerswithloansofupto$37,500towardsadownpayment.Theloanswouldbeinterest-freeandpayment-freeforthefirstfiveyears.12AsofApril2017,inthefirstthreemonthsoftheprogramtheprovincereceived1,200applicationsalthoughjustaquarteroftheapplicationshadresultedinpurchases.13Intheinterim,pricesinmanymunicipalitiesinMetroVancouverbegantopickupwheretheyleftoff.

4
Chart 4: Vancouver median prices and affordability, 12 months ended February 28, 2017
Affordability–apartment
Affordability–attachedAffordability–all
Affordability–detached
Source:VancityusingrealestatedatafromLandcorDataCorp.andthemedianhouseholdincomecalculationforMetroVancouverforthe12monthsendedFebruary28,2017.
$3,000,000
$2,500,000
$2,000,000
$1,500,000
$1,000,000
$500,000
$0
200%
180%
160%
140%
120%
100%
80%
60%
40%
20%
0%
Price–all
Price–detached
Price–attached
Price–apartment
GDS
March 2016
April 2016
May 2016
June 2016
July 2016
Aug 2016
Sept 2016
Oct 2016
Nov 2016
Dec 2016
Jan 2017
Feb 2017
Chart 3: Vancouver median prices and affordability, 2013-2017
Affordability–apartment
Affordability–attached
Affordability–all
Affordability–detached
Source:VancityusingrealestatedatafromLandcorDataCorp.andthemedianhouseholdincomecalculationforMetroVancouver.
$2,500,000
$2,000,000
$1,500,000
$1,000,000
$500,000
$02016201520142013 2017
Price–all
Price–detached
Price–attached
Price–apartment
GDS
180%
160%
140%
120%
100%
80%
60%
40%
20%
0%
5
The ripple effect
Buyingahomeisn’ttheonlyoptionwhenitcomestoshelter,norisitforeveryone.Yetformanypeopleit’stheideal,aswellasakindofforcedsavingsplanthatallowsthemtobuildanesteggonwhichtheycanretire.Italsoholdsthepromiseofstablehousing,aplacetoraiseafamily,storeupmemoriesandbuildalife.Itmaynotbeacastle,butit’saplacetheycancalltheirown,freefromthedemandsoflandlordsand–inadetachedhome,anyway–ceilingsandwallssharedwithneighbours.
Thehighcostofhousingintheregion’scorehassentmanypeoplefurtherafieldinsearchofaffordableoptions.It’snotjustfirst-timebuyerswhoareaffected;thosewhomanagedtoenterthemarketinpreviousyearslackoptionswithintheirownneighbourhoodsiftheydecidetosellandseekmorespaceforafamily.Withthecostofhousingoptionsincreasinglybeyondthereachoflocalhouseholdsandnoclearsolutioninsight,manypeoplearelookingforalternativesinamarketwhereeventhecostofrentinghasrisenbeyondthereachofmanypeople.
ThequestforaffordablehousinghascreatedaninfluxofbuyersintoBurnaby,SurreyandLangleycityandtownship,withpricesrisinginstepwithdemand.ArippleeffectisbeingfeltwellintotheFraserValley,withmediansalepricesforthe12monthsendedFebruary28,2017up32%inDelta,30%inLangley(township),24%inAbbotsfordand14%inChilliwack.
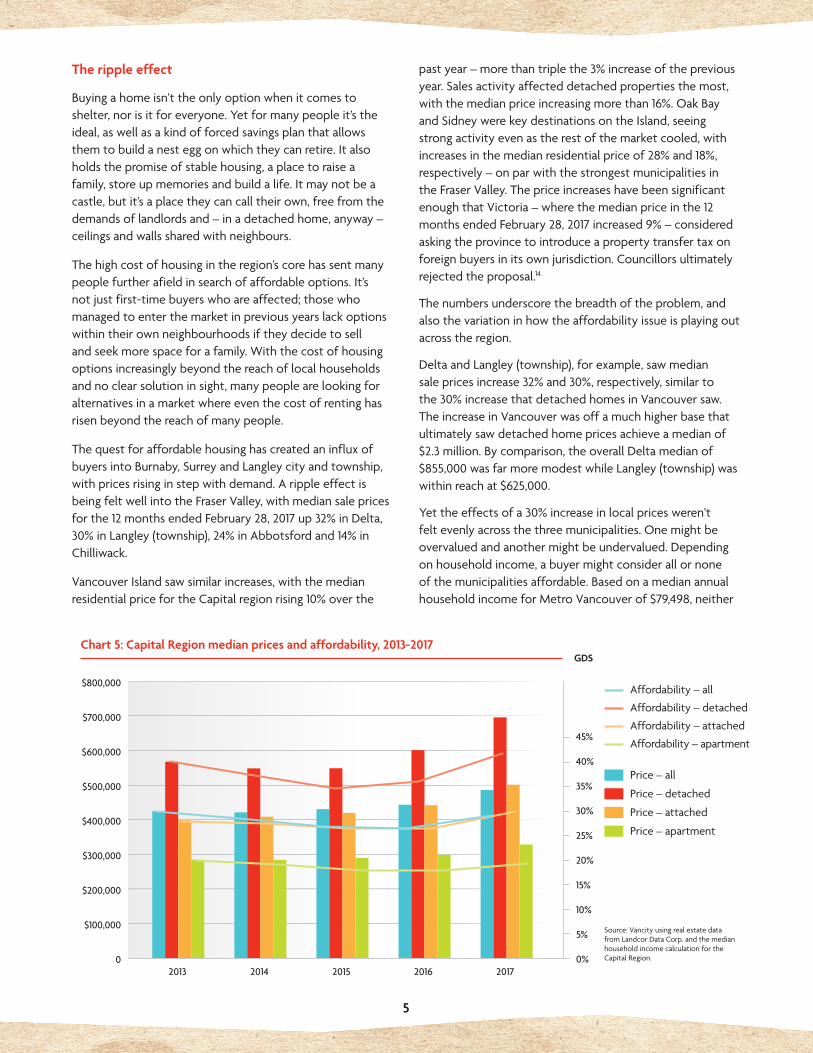
VancouverIslandsawsimilarincreases,withthemedianresidentialpricefortheCapitalregionrising10%overthe
pastyear–morethantriplethe3%increaseofthepreviousyear.Salesactivityaffecteddetachedpropertiesthemost,withthemedianpriceincreasingmorethan16%.OakBayandSidneywerekeydestinationsontheIsland,seeingstrongactivityevenastherestofthemarketcooled,withincreasesinthemedianresidentialpriceof28%and18%,respectively–onparwiththestrongestmunicipalitiesintheFraserValley.ThepriceincreaseshavebeensignificantenoughthatVictoria–wherethemedianpriceinthe12monthsendedFebruary28,2017increased9%–consideredaskingtheprovincetointroduceapropertytransfertaxonforeignbuyersinitsownjurisdiction.Councillorsultimatelyrejectedtheproposal.14
Thenumbersunderscorethebreadthoftheproblem,andalsothevariationinhowtheaffordabilityissueisplayingoutacrosstheregion.
DeltaandLangley(township),forexample,sawmediansalepricesincrease32%and30%,respectively,similartothe30%increasethatdetachedhomesinVancouversaw.TheincreaseinVancouverwasoffamuchhigherbasethatultimatelysawdetachedhomepricesachieveamedianof$2.3million.Bycomparison,theoverallDeltamedianof$855,000wasfarmoremodestwhileLangley(township)waswithinreachat$625,000.
Yettheeffectsofa30%increaseinlocalpricesweren’tfeltevenlyacrossthethreemunicipalities.Onemightbeovervaluedandanothermightbeundervalued.Dependingonhouseholdincome,abuyermightconsiderallornoneofthemunicipalitiesaffordable.BasedonamedianannualhouseholdincomeforMetroVancouverof$79,498,neither
Chart 5: Capital Region median prices and affordability, 2013-2017
Affordability–apartment
Affordability–attached
Affordability–all
Affordability–detached
Source:VancityusingrealestatedatafromLandcorDataCorp.andthemedianhouseholdincomecalculationfortheCapitalRegion.
$800,000
$700,000
$600,000
$500,000
$400,000
$300,000
$200,000
$100,000
02016201520142013 2017
45%
40%
35%
30%
25%
20%
15%
10%
5%
0%
Price–all
Price–detached
Price–attached
Price–apartment
GDS

6
DeltanorLangley(township)areaffordable.InthecaseofDelta,buyingahomeatthemedianpricerequires58%ofahousehold’smonthlyincome;inLangley,the$230,000dollardifferenceinpricestillrequires43%ofatypicalhousehold’smonthlyincome.AhouseholdwithanincomewellabovetheregionalmedianwouldlikelyoptforDelta,sinceit’sclosertoVancouverbutallhouseholdswouldfindLangleythemoreaffordablechoice.
TheresultisthatLangleyhasbecomeemblematicofthedilemmafacingmanybuyersintheregion:it’smoreaffordablethanmanyothermunicipalitiesclosertoVancouver,butit’sfarfromthejobopportunitiesandamenitieslocatedintheregion’score.Buyersarelikelytogetadecent-sizedhousefortheirhard-earnedcash,butitrequiresrelinquishinganurbanlifestyle.
However,evenifahouseholdmakesthechoicetoleavethecore,fewpeoplewouldsayspending43%ofone’smonthlyincomeonhousingisaffordable.Itmightnotbefarofftheregionalaverageof39%,butit’sstillwellabove32%–andnotlikelytoimprove.Whileaffordabilityfluctuates,rangingfrom35%to39%overthepastfiveyears,it’seasytogetdiscouraged.
Thepastyearhasbeenaparticularlytoughoneforhouseholds,notwithstandingallthegovernmentmovestomakethingseasier.Affordabilityrangednearly12percentagepointsoverthepast12months,fromahighof44%inJulytoalowof32%inDecember.Withinafewshortmonths,thetypicalbuyermighthavefoundthemselvesstretched
totheiraffordabilitylimitorcomfortablywithinit.Whilethere’snotypicalbuyer,andnotypicalproperty,themessageisclear:findingahomethatfitsyourbudgettakeswork,andthemarketdoesn’talwaysrewardpatience.
Windows of opportunity
Fluctuationsoverthepastyearhaveshownthatchangeispossible,however,andtheyhavegivenbuyerswindowsofopportunity.
Whiletheregionaltrendsince2012hasbeenoneofdecreasinghousingaffordability,thebruntofpriceincreaseshasfallendisproportionatelyondetachedhomes.Regionally,themedianpriceofadetachedhomeincreasednearly50%since2012,andnowstandsat$988,000,whilethepriceofanattachedhomeincreased24%overthesameperiodto$482,000.Meanwhile,themedianpriceofapartmentsrosejust13%to$390,000.
Thepriceincreaseshavesolidifiedthestatusofadetachedhomeastheleastaffordablepropertyforthetypicalfamily,requiring67%ofmedianhouseholdincome.Bycontrast,attachedpropertiesrequire33%.Thehands-downwinnerswhenitcomestoaffordabilityareapartments,whichtypicallydemandabout27%ofhouseholdincome.
However,noteveryonewantstoliveinanapartment.So,what’safamilytodo?WhatoptionsareopentothetypicalfamilylookingforhousingwithinMetroVancouver?
Chart 6: Metro Vancouver median prices and affordability, 2013-2017
Affordability–apartment
Affordability–attached
Affordability–all
Affordability–detached
Source:VancityusingrealestatedatafromLandcorDataCorp.andthemedianhouseholdincomecalculationforMetroVancouver.
$1,200,000
$1,000,000
$800,000
$600,000
$400,000
$200,000
$02016201520142013 2017
80%
70%
60%
50%
40%
30%
20%
10%
0%
Price–all
Price–detached
Price–attached
Price–apartment
GDS

7
Affordable alternativesAyearaftertheprovincebegantweakingitstaxpoliciestomitigatetheimpactofrisinghomeprices,themostrecentsalesdataforMetroVancouverandsurroundingmunicipalitiesrevealseveralpocketsofaffordability.WhiletheleastaffordablemunicipalitiesincludesuchusualsuspectsasVancouverandWestVancouver,neighbouringmunicipalitieshavebeendrawnintothevortexofdiminishingaffordability.NorthVancouvercityanddistrict,RichmondandBurnaby,forexample,allrankamongtheregion’s10leastaffordableneighbourhoodsfordetached,attachedandcondoapartmentproperties.Allare
Table 1: Detached properties
Municipality Median price GDS ratio
1. Sooke $431,640 25.8%
2.Chilliwack $480,950 34.8%
3.Sidney $599,500 35.9%
4.Esquimalt $620,000 37.1%
5.Mission $540,000 39.6%
6.CentralSaanich $686,500 41.1%
7. Victoria $725,000 43.4%
8.Abbotsford $615,000 45.0%
9.MapleRidge $700,000 47.6%
10.Langley(city) $715,000 48.6%
Source:VancityusingrealestatedatafromLandcorDataCorp.andthemedianhouseholdincomecalculationfortherespectiveregions;12monthsendedFebruary28,2017.
Table 2: Attached properties
Municipality Median price GDS ratio
1. Sooke $321,500 19.2%
2.Mission $315,000 23.1%
3. Langley(city) $344,250 23.4%
4.Chilliwack $324,132 23.5%
5.CentralSaanich $420,000 25.1%
6.Abbotsford $351,850 25.8%
7. MapleRidge $382,050 26.0%
8.LionsBay $388,000 26.4%
9.Esquimalt $475,000 28.4%
10.Langley(township) $439,900 29.9%
Source:VancityusingrealestatedatafromLandcorDataCorp.andthemedianhouseholdincomecalculationfortherespectiveregions;12monthsendedFebruary28,2017.
Table 3: Apartments
Municipality Median price GDS ratio
1. Chilliwack $174,500 12.6%
2.Sooke $219,000 13.1%
3.Abbotsford $189,900 13.9%
4.Mission $193,250 14.2%
5.Langley(city) $225,000 15.3%
6.MapleRidge $229,000 15.6%
7. NorthSaanich $290,000 17.4%
8.CentralSaanich $294,950 17.6%
9.Esquimalt $295,000 17.7%
10.Surrey $259,900 17.7%
Source:VancityusingrealestatedatafromLandcorDataCorp.andthemedianhouseholdincomecalculationfortherespectiveregions;12monthsendedFebruary28,2017.
sandwichedbetweentheGeorgiaStraitandthePortMannbridge;theregion’smostaffordablemunicipalitiesextendahandofwelcomeacrossthesekeygeographicbarriers.
WithintheLowerMainland,anattacheddwellingstartstobecomeaffordableinSurrey,increasingeastthroughtheFraserValley.ApartmentsareaffordableanywhereeastofBoundaryRoad,theborderbetweenVancouverandtherestoftheregion.OnVancouverIsland,Sidney,theSaanichPeninsulaandEsquimaltawait.
Whenitcomestodetachedhomes,MetroVancouver’smostaffordableoptionsexistinChilliwack,thoughtheonlyreallyaffordablehousesarefoundinSooke.
Most affordable communities based on GDS (12 months ended February 28, 2017)

8
Table 4: Detached properties
Municipality Median price GDS ratio
1. WestVancouver $3,240,000 220.3%
2. Vancouver $2,280,000 155.0%
3.Richmond $1,670,000 113.6%
4. NorthVancouver(district) $1,668,427 113.4%
5. Burnaby $1,600,000 108.8%
6. NorthVancouver(city) $1,550,000 105.4%
7. LionsBay $1,450,000 98.6%
8. WhiteRock $1,437,500 97.7%
9. Coquitlam $1,245,000 84.7%
10.PortMoody $1,221,000 83.7%
Source:VancityusingrealestatedatafromLandcorDataCorp.andthemedianhouseholdincomecalculationfortherespectiveregions;12monthsendedFebruary28,2017.
Table 5: Attached properties
Municipality Median price GDS ratio
1. WestVancouver $1,838,000 125.0%
2. Vancouver $1,100,000 74.8%
3. NorthVancouver(city) $925,000 62.9%
4. NorthVancouver(district) $839,985 57.1%
5. Richmond $739,000 50.3%
6. LionsBay $737,500 50.1%
7. OakBay $820,000 49.1%
8. Burnaby $671,525 45.7%
9. Coquitlam $670,000 45.6%
10.Delta $660,500 44.9%
Source:VancityusingrealestatedatafromLandcorDataCorp.andthemedianhouseholdincomecalculationfortherespectiveregions;12monthsendedFebruary28,2017.
Table 6: Apartments
Municipality Median price GDS ratio
1. WestVancouver $855,000 58.1%
2.Vancouver $550,000 37.4%
3. NorthVancouver(city) $510,215 34.7%
4. NorthVancouver(district) $480,000 32.6%
5.PortMoody $443,000 30.4%
6.Langley(township) $439,900 29.9%
7. OakBay $490,000 29.3%
8. Burnaby $425,900 29.0%
9. Richmond $419,900 28.6%
10.Esquimalt $475,000 28.4%
Source:VancityusingrealestatedatafromLandcorDataCorp.andthemedianhouseholdincomecalculationfortherespectiveregions;12monthsendedFebruary28,2017.
Least affordable communities based on GDS (12 months ended February 28, 2017)

9
Local 12-month trendsNorth Fraser
AmodesterosioninaffordabilityacrosshousingtypesinBurnabyinthe12monthsendedFebruary28,2017wasaccentuatedbyasteepdropintheaffordabilityofdetachedhouses,whichnowdemand109%ofhouseholdincome.Arobustsupplyofapartmentshasdrawnbuyers,however,withunitsrequiringjust29%ofhouseholdincome.
CompletionoftheEvergreenrapidtransitlineinDecember2016madeCoquitlammoreaccessiblethanever,andaffordabilityisfeelingthepressure.Allhousingtypessawaffordabilitydeclineoverthepastyearbutapartmentsremainthemostaffordableoptionhere,requiringjust27%ofhouseholdincome.
Source:VancityusingrealestatedatafromLandcorDataCorp.andthemedianhouseholdincomecalculationforMetroVancouver.
TheonlycommunitynorthoftheFraserwherethetypicalhomerequireslessthan30%ofhouseholdincome,NewWestminstersawaffordabilitydecline14%in2016.Apartmentssetthepacehere,requiring26%ofhouseholdincome.
PortCoquitlamsawoverallaffordabilitydeteriorate4%in2016,butwithaGDSofjust32%itremainsamongthemostaffordablemunicipalitiesinMetroVancouver.Sharpdropsintheaffordabilityofdetachedandattachedpropertieshavebuyerslookingatapartments,whichrequirejustafifthofhouseholdincome.
PortMoodyhaswelcomedbuyersdrawnbytheEvergreenLine.Affordabilityfell14%in2016,butthetypicalhomestillrequireslessthan40%ofhouseholdincome.Indeed,whiledetachedhomesrequirenearly84%,bothattachedhomesandapartmentsremainmorethantwiceasaffordable–andmorearebeingbuilt.
Chart 7: North Fraser median price and affordability, 2013-2017
45%
40%
35%
30%
25%
20%
15%
10%
5%
0%
$700,000
$600,000
$500,000
$400,000
$300,000
$200,000
$100,000
02016201520142013 2017
Burnaby
Coquitlam
NewWestminster
PortCoquitlam
PortMoody
Median Price
BurnabyCoquitlam
PortCoquitlamNewWestminster
PortMoody
Affordability
GDS
Chart 8: North Fraser affordability, 12 months ended February 28, 2017
60%
50%
40%
30%
20%
10%
0%March 2016
April 2016
May 2016
June 2016
July 2016
Aug 2016
Sept 2016
Oct 2016
Nov 2016
Dec 2016
Jan 2017
Feb 2017
Source:VancityusingrealestatedatafromLandcorDataCorp.andthemedianhouseholdincomecalculationforMetroVancouverforthe12monthsendedFebruary28,2017.
BurnabyCoquitlamNewWestminsterPortCoquitlamPortMoody
GDS
10
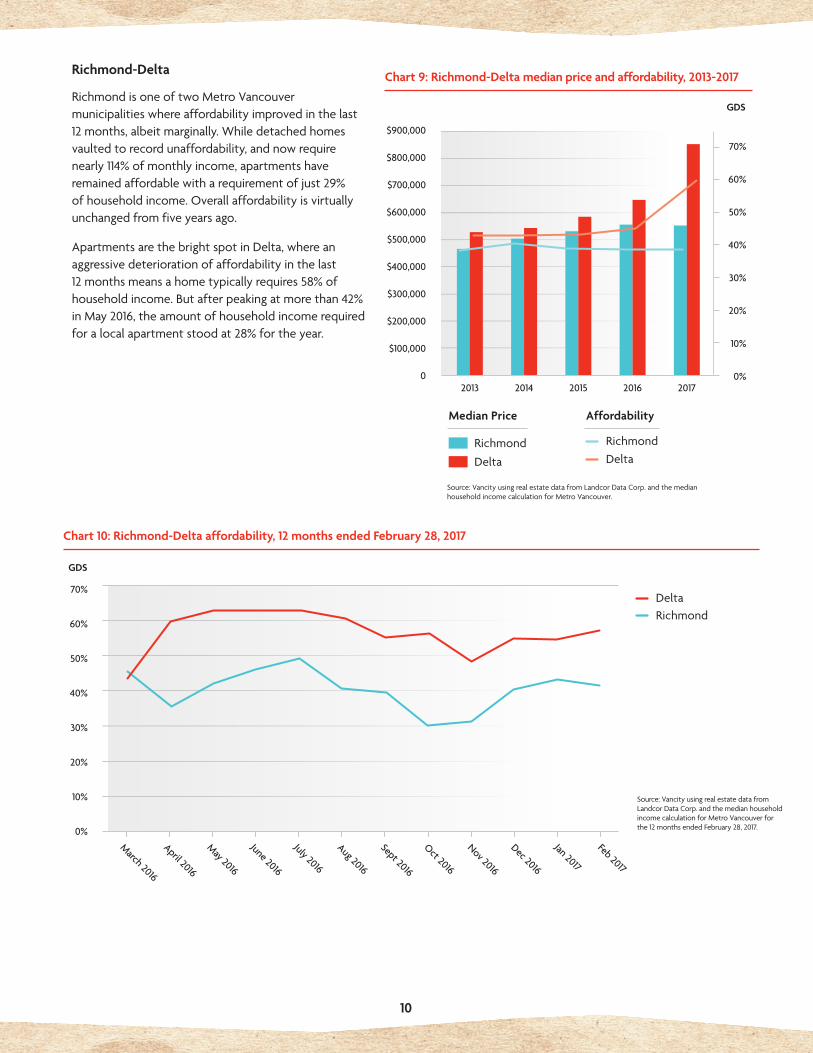
Richmond-Delta
RichmondisoneoftwoMetroVancouvermunicipalitieswhereaffordabilityimprovedinthelast12months,albeitmarginally.Whiledetachedhomesvaultedtorecordunaffordability,andnowrequirenearly114%ofmonthlyincome,apartmentshaveremainedaffordablewitharequirementofjust29%ofhouseholdincome.Overallaffordabilityisvirtuallyunchangedfromfiveyearsago.
ApartmentsarethebrightspotinDelta,whereanaggressivedeteriorationofaffordabilityinthelast12monthsmeansahometypicallyrequires58%ofhouseholdincome.Butafterpeakingatmorethan42%inMay2016,theamountofhouseholdincomerequiredforalocalapartmentstoodat28%fortheyear.
Chart 9: Richmond-Delta median price and affordability, 2013-2017
2016201520142013 2017
Source:VancityusingrealestatedatafromLandcorDataCorp.andthemedianhouseholdincomecalculationforMetroVancouver.
Richmond
Delta
Median Price
RichmondDelta
Affordability
$900,000
$800,000
$700,000
$600,000
$500,000
$400,000
$300,000
$200,000
$100,000
0
GDS
70%
60%
50%
40%
30%
20%
10%
0%
RichmondDelta
Chart 10: Richmond-Delta affordability, 12 months ended February 28, 2017
70%
60%
50%
40%
30%
20%
10%
0%March 2016
April 2016
May 2016
June 2016
July 2016
Aug 2016
Sept 2016
Oct 2016
Nov 2016
Dec 2016
Jan 2017
Feb 2017
Source:VancityusingrealestatedatafromLandcorDataCorp.andthemedianhouseholdincomecalculationforMetroVancouverforthe12monthsendedFebruary28,2017.
GDS

11
Surrey-White Rock
Surrey,theregion’slargestcitybyarea,isoftenthereferencepointforaffordabilityinMetroVancouver.Yetthetypicalhomehererequires37%ofhouseholdincome.Asurgeinnewtownhomesandapartments–thelattertypicallyrequiringjust18%ofhouseholdincome–offsetsthepriceofdetachedhomes,whichrequires61%.
WhiteRocksawamarginalimprovementinaffordabilityoverthepastyear,despitea43%increaseinthepriceofdetachedhomes,thecity’smostcommonhousingtype.
Chart 11: Surrey-White Rock median price and affordability, 2013-2017
2016201520142013 2017
Source:VancityusingrealestatedatafromLandcorDataCorp.andthemedianhouseholdincomecalculationforMetroVancouver.
Surrey
WhiteRock
Median Price
SurreyWhiteRock
Affordability
GDS$700,000
$600,000
$500,000
$400,000
$300,000
$200,000
$100,000
0
45%
40%
35%
30%
25%
20%
15%
10%
5%
0%
Chart 12: Surrey-White Rock affordability, 12 months ended February 28, 2017
March 2016
April 2016
May 2016
June 2016
July 2016
Aug 2016
Sept 2016
Oct 2016
Nov 2016
Dec 2016
Jan 2017
Feb 2017
SurreyWhiteRock
60%
50%
40%
30%
20%
10%
0%
Source:VancityusingrealestatedatafromLandcorDataCorp.andthemedianhouseholdincomecalculationforMetroVancouverforthe12monthsendedFebruary28,2017.
GDS

12
North Shore-Squamish
NorthVancouver(city)hasembracedhigh-densitydevelopment,knowingthatapartmentsarethemostaffordablehousingtype.Thelocaloptionsrequirejust35%ofmonthlyincome.Bycomparison,detachedhomesrequire105%.Amplesupplymayhavekeptaffordability’sdeclinetojust12%–athirdoftherateofchangeseenintheneighbouringdistrict.
TheDistrictofNorthVancouver’s2011OfficialCommunityPlan(OCP)pledgedtoencouragemoretownhomesaspartofastrategytoimprovehousingaffordabilityinthemunicipality.Atypicalhomehereneverthelessrequires93%ofmonthlyincome–adeteriorationof38%fromayearearlier.
WestVancouverishardlysynonymouswithaffordability,withatypicalhome–think,spaciousdetachedproperty–requiringmorethantwicetheregion’smedianincome.Despitegovernmentintervention,thetypicalhomestillrequires192%ofhouseholdincome.Apartmentsseemlikeastealincomparison,requiringjust58%.Despitefluctuations
overthepastyear,themoreincrediblefactisthatapartmentaffordabilityhereactuallyimprovedversusayearago.
Withoutasignificantstockofapartmentsorattachedhousing,affordabilityinLionsBayhingesondetachedhomes–whichsawpricesdropinthelatterhalfof2016beforerecovering.Adetachedpropertynowrequires99%ofhouseholdincome.Wereanattachedhomeavailable,itmightrequire50%.
BowenIslandlackstheapartmentsthatdriveaffordabilityacrosstheregion,butanattachedhomeisthealternative,requiringjustathirdofthemedianmonthlyincome.Detachedhomessetthepace,requiring53%ofhouseholdincome.Overallaffordabilitydeclinedamodest14%inthe12monthsendedFebruary28,2017.
AffordabilityexperiencedanetdeclineacrosstheboardinSquamishoverthepastyear.Thetypicalhomerequires43%ofhouseholdincome,a24%shiftfromayearago.Themostaffordablehousingtypesareattachedpropertiesandapartments,requiring32%and22%ofhouseholdincome,respectively.
Chart 13: North Shore-Squamish median price and affordability, 2013-2017
$3,000,000
$2,500,000
$2,000,000
$1,500,000
$1,000,000
$500,000
02016201520142013 2017
Source:VancityusingrealestatedatafromLandcorDataCorp.andthemedianhouseholdincomecalculationforMetroVancouver.
NorthVancouvercityNorthVancouver(district)
LionsBayWestVancouver
BowenIsland
Affordability
Squamish
NorthVancouvercity
NorthVancouver(district)
WestVancouver
LionsBay
BowenIsland
Median Price
Squamish
250%
200%
150%
100%
50%
0%
GDS
Chart 14: North Shore-Squamish affordability, 12 months ended February 28, 2017
March 2016
April 2016
May 2016
June 2016
July 2016
Aug 2016
Sept 2016
Oct 2016
Nov 2016
Dec 2016
Jan 2017
Feb 2017
GDS
NorthVancouvercityNorthVancouver(district)WestVancouverLionsBayBowenIslandBowenIsland
250%
200%
150%
100%
50%
0%
Source:VancityusingrealestatedatafromLandcorDataCorp.andthemedianhouseholdincomecalculationforMetroVancouverforthe12monthsendedFebruary28,2017.
12

13
Fraser Valley
Langley(city)isaveritablepocketofaffordability.Detachedhomesrequire49%ofahousehold’sincome,butattachedandapartmentpropertiesdrivethemedianaffordabilityof18%.
Langley(township)sawaffordabilitydropsharplyin2016,withthetypicalhomenowrequiring43%ofhouseholdincome.Apartmentswerethemostresilientintermsofaffordability,becomingjust10%lessaffordable.Evenso,theyrequirejust21%ofhouseholdincome.
ThetypicalMapleRidgepropertyrequires39%ofhouseholdincome–evenwithCoquitlamandonlyslightlymoredemandingthanRichmond.Detachedhomesrequire48%,whileattachedandapartmentpropertiesrequire26%and16%,respectively.
DeterioratingaffordabilityofdetachedandattachedpropertiespushedtheamountofhouseholdincomerequiredforthetypicalPittMeadowshometo31%overthepastyear.However,alongwithneighbouringPortCoquitlam,
itremainsoneofthemostaffordablemunicipalitiesintheregion.Apartmentsarethemostaffordablepropertytype,requiringjust20%ofhouseholdincome.
AhomeinAbbotsfordtypicallyrequires35%ofmonthlyincome.Youngfamiliesgravitatetodetachedhomes,whichrequire45%ofhouseholdincome–amiddlegroundbetweenMapleRidgeandVictoria.Theattachedpropertiesandapartmentsnearthecitycentredemand26%and14%ofhouseholdincome,respectively.
DetachedandattachedpropertiessetthepaceforaffordabilityinMission.DetachedhomesareonlyslightlylessaffordablethantheoverallmedianGDSof37%.Attachedhomesandapartmentsrequire23%and14%ofhouseholdincome,respectively.
Theeasternmostofthemunicipalitiesinthisreport,Chilliwackislargelyaffordable,withevenadetachedhomerequiringjust35%ofhouseholdincome.Apartmentsrequire13%,butareinshortsupplyandsawaffordabilitydecline28%in2016–themostofanylocalhousingtype.
Chart 15: Fraser Valley median price and affordability, 2013-2017
$700,000
$600,000
$500,000
$400,000
$300,000
$200,000
$100,000
02016201520142013 2017
Source:VancityusingrealestatedatafromLandcorDataCorp.andthemedianhouseholdincomecalculationforMetroVancouver.
GDS
Langley(city)
Langley(township)
MapleRidge
PittMeadows
Abbotsford
Median Price
Mission
Chilliwack
Langley(city)
Langley(township)
PittMeadowsMapleRidge
Abbotsford
Affordability
MissionChilliwack
45%
40%
35%
30%
25%
20%
15%
10%
5%
0%
Chart 16: Fraser Valley affordability, 12 months ended February 28, 2017
LangleycityLangley(township)MapleRidge
AbbotsfordMissionChilliwack
PittMeadows
March 2016
April 2016
May 2016
June 2016
July 2016
Aug 2016
Sept 2016
Oct 2016
Nov 2016
Dec 2016
Jan 2017
Feb 2017
60%
50%
40%
30%
20%
10%
0%
Source:VancityusingrealestatedatafromLandcorDataCorp.andthemedianhouseholdincomecalculationforMetroVancouverforthe12monthsendedFebruary28,2017.
GDS
14
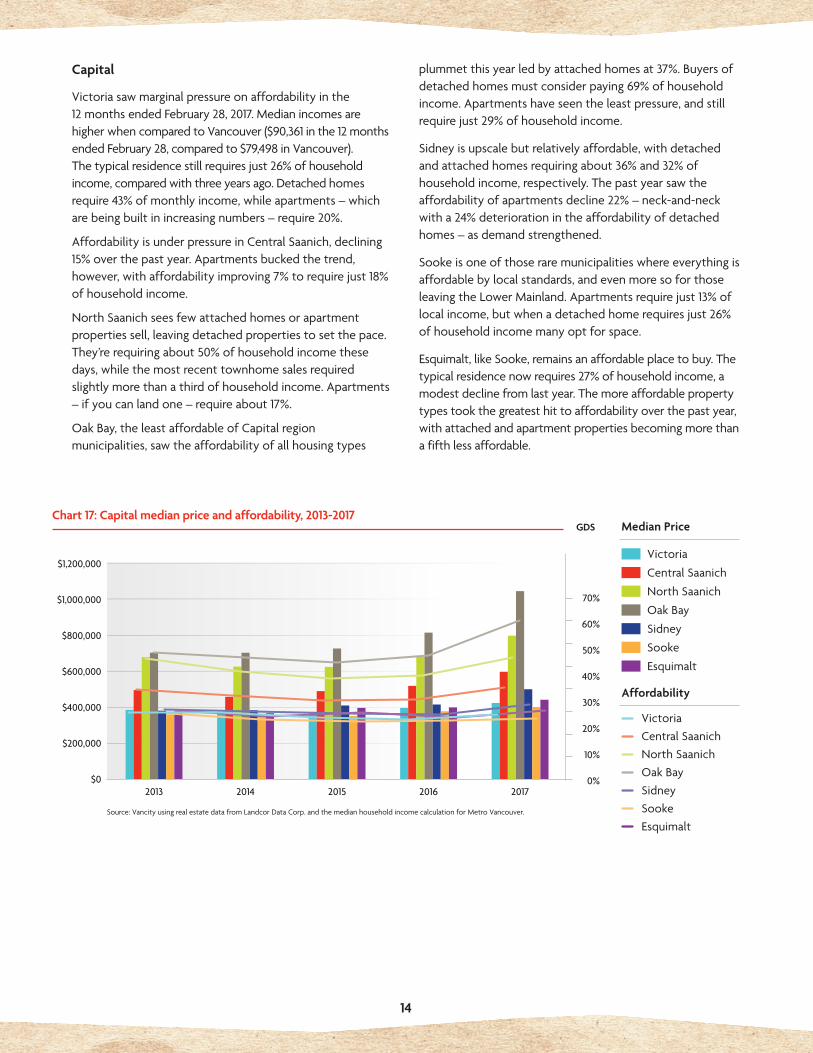
Capital
Victoriasawmarginalpressureonaffordabilityinthe12monthsendedFebruary28,2017.MedianincomesarehigherwhencomparedtoVancouver($90,361inthe12monthsendedFebruary28,comparedto$79,498inVancouver).Thetypicalresidencestillrequiresjust26%ofhouseholdincome,comparedwiththreeyearsago.Detachedhomesrequire43%ofmonthlyincome,whileapartments–whicharebeingbuiltinincreasingnumbers–require20%.
AffordabilityisunderpressureinCentralSaanich,declining15%overthepastyear.Apartmentsbuckedthetrend,however,withaffordabilityimproving7%torequirejust18%ofhouseholdincome.
NorthSaanichseesfewattachedhomesorapartmentpropertiessell,leavingdetachedpropertiestosetthepace.They’rerequiringabout50%ofhouseholdincomethesedays,whilethemostrecenttownhomesalesrequiredslightlymorethanathirdofhouseholdincome.Apartments–ifyoucanlandone–requireabout17%.
OakBay,theleastaffordableofCapitalregionmunicipalities,sawtheaffordabilityofallhousingtypes
plummetthisyearledbyattachedhomesat37%.Buyersofdetachedhomesmustconsiderpaying69%ofhouseholdincome.Apartmentshaveseentheleastpressure,andstillrequirejust29%ofhouseholdincome.
Sidneyisupscalebutrelativelyaffordable,withdetachedandattachedhomesrequiringabout36%and32%ofhouseholdincome,respectively.Thepastyearsawtheaffordabilityofapartmentsdecline22%–neck-and-neckwitha24%deteriorationintheaffordabilityofdetachedhomes–asdemandstrengthened.
Sookeisoneofthoseraremunicipalitieswhereeverythingisaffordablebylocalstandards,andevenmoresoforthoseleavingtheLowerMainland.Apartmentsrequirejust13%oflocalincome,butwhenadetachedhomerequiresjust26%ofhouseholdincomemanyoptforspace.
Esquimalt,likeSooke,remainsanaffordableplacetobuy.Thetypicalresidencenowrequires27%ofhouseholdincome,amodestdeclinefromlastyear.Themoreaffordablepropertytypestookthegreatesthittoaffordabilityoverthepastyear,withattachedandapartmentpropertiesbecomingmorethanafifthlessaffordable.
Chart 17: Capital median price and affordability, 2013-2017
$1,200,000
$1,000,000
$800,000
$600,000
$400,000
$200,000
$02016201520142013 2017
Source:VancityusingrealestatedatafromLandcorDataCorp.andthemedianhouseholdincomecalculationforMetroVancouver.
GDS
Victoria
CentralSaanich
NorthSaanich
OakBay
Sidney
Median Price
Sooke
Esquimalt
VictoriaCentralSaanich
OakBayNorthSaanich
Sidney
Affordability
SookeEsquimalt
70%
60%
50%
40%
30%
20%
10%
0%

15
80%
70%
60%
50%
40%
30%
20%
10%
0%
Chart 18: Capital affordability, 12 months ended February 28, 2017
March 2016
April 2016
May 2016
June 2016
July 2016
Aug 2016
Sept 2016
Oct 2016
Nov 2016
Dec 2016
Jan 2017
Feb 2017
VictoriaCentralSaanichNorthSaanich
SidneySookeEsquimalt
OakBay
Source:VancityusingrealestatedatafromLandcorDataCorp.andthemedianhouseholdincomecalculationforMetroVancouverforthe12monthsendedFebruary28,2017.
GDS

16
RecommendationsDespiteattemptsbyvariouslevelsofgovernmenttocoolthemarketandimprovehousingaffordability,pricesincreasedsignificantlythroughoutmanymunicipalitiesinB.C.includingintraditionallyaffordablesuburbanareas.Thisreportrecognizesthatformany,ownershipmeansallocatingthemajorityofhouseholdincometowardhousingcostsandhavinglessfundsthanisadvisabletoputtowardspayingdowndebt,savingsorotherlivingexpenses.Residentsareencouragedtoseriouslyconsiderthefinancialcostsandbenefitsofownership.Forthosewhoarestillinterestedinpursuingownershipoverrenting,thefollowingpointsmaybeusefultoconsiderandalsoservetoassistalllevelsofgovernment,financialinstitutionsandbusinessestohelpbettertheaffordabilityprobleminB.C.
Individuals
• Meetwithafinancialplaner(first-timebuyersespecially)todiscusssavingsinlightofthenewmortgagerules,ratesandmortgageinsurancerequirementsannouncedbythefederalgovernment.AsofOctober2016,buyerswithadownpaymentofatleast5%ofthepurchaseprice(butlessthan20%)mustbebackedbymortgageinsurance.Inadditiontorateslistedintheirmortgagecontract,newbuyersmustqualifyforhigher,five-yearfixedratessetbytheBankofCanada.
•Considernewformsofmulti-familylivingandowningarrangements,suchashousingco-operatives,co-housingandco-ownership.
•Reduceyourfootprint:considerasmallerhomeorapartmentwithmulti-functionalspaceandfurnishings.
•Ifownershipdoesnotcurrentlymakefinancialsense,instituteanautomatedsavingsandinvestmentplanthatcanbuildequityoverthelongterm.
Financial institutions
•Encouragecurrentrenterstolookbeyondhomeownershiptolong-terminvestmentvehicles,suchasindexedmutualfunds.
• Includesupplementaryincome,suchasrentalincomefromabasementunitintoapprovalcalculationsandmaximizeaccesstodownpaymentloansforfamiliesenteringthemoresustainablecondominiummarket.
Businesses
• Allowemployeestheflexibilityofworkingfromhomeastheymaybetravellingfartherdistances.
Governments (all)
• Placepubliclyownedlandintoatrusttodeliverpurpose-builtandaffordablerentalhousing.Thesemayprovideaffordablerentals,allowingrenterstosaveforadownpayment(ifhomeownershipisagoal).
Municipal government
• Increasezoningforhigh-densitymulti-unitbuildingsandstipulatethatnewcondosmustincludeasetpercentageofaffordablerentals.Createincentivesfordeveloperstobuildaffordableworkforceandfamilyhousing.
•Designgrowthcentreswithadensecore,withsecuredsitesforaffordablerentalhousinginproximitytomasstransitandimprovetransitfromsuburbanareastocentralVancouver,aswellasinter-citytransitthroughouttheregion.
Provincial government
•Encourageeverymunicipalitytohaveanaffordablehousingplanthatistiedtoprovidingsafe,decentandaffordablehousingtoitsresidents.
•Encouragecommunitiestopermanentlyzoneland(similartotheAgriculturalLandReserve)toprovidecapacityforaffordablehousingdevelopmentinconjunctionwithregionalhousingtrusts.
•DedicateaportionofthePropertyTransferTaxannuallytosupportthecreationofperpetuallyaffordablehomeownershipoptionsacrosstheprovince.
Federal government
•CMHCcouldconsiderbuildingapolicyframeworktosupportthedoublingofthedensitythatcurrentlysitsonpropertiesitfinancedinthepastthatisheldbynonprofitsandco-opsforaffordablehousing.
•Implementaprogramofnewhousingdevelopmenttaxcreditsforpermanentlyaffordablehousing(rental,co-opsandownedhomes)ofthreebedroomsormore.Thiscanbeachievedbyprovidingdeveloperswithmulti-yeartaxcreditswhentheyinvestinlong-termaffordablehousing.
•Createmoreprogramstohelpfamiliesandindividualssaveadownpayment.OneexampleistheU.S.DepartmentofHousingandUrbanDevelopment’sFamilySelf-Sufficiencyprogramforlower-incomefamilies.Undertheprogram,ifafamily’srentincreasesbecausethefamilyisearningmoreincome,therentincreaseiscreditedtoaninterest-bearingescrowaccountforsavingstheycanuseasadownpayment.

17
Municipality All Detached Attached Apartments
2016 2017 Affordabilityshift*
2016 2017 Affordabilityshift*
2016 2017 Affordabilityshift*
2016 2017 Affordabilityshift*
Abbotsford $383,000 $472,870 -22.6% $475,000 $615,000 -28.6% $292,000 $351,850 -19.6% $157,000 $189,900 -20.1%
BowenIsland $679,000 $780,000 -14.1% $711,500 $780,389 -8.9% $445,600 $495,000 -10.3% NA NA NA
Burnaby $480,000 $549,400 -13.7% $1,250,000 $1,600,000 -27.1% $565,000 $671,525 -18.0% $385,000 $425,900 -9.9%
CentralSaanich $520,000 $600,500 -14.7% $575,000 $686,500 -18.6% $393,755 $420,000 -5.9% $314,107 $294,950 6.8%
Chilliwack $337,000 $385,000 -13.4% $405,000 $480,950 -17.9% $270,000 $324,132 -19.2% $135,000 $174,500 -28.3%
Coquitlam $540,000 $580,000 -6.7% $929,129 $1,245,000 -33.1% $547,000 $670,000 -21.6% $319,900 $389,000 -20.8%
Delta $648,001 $855,000 -31.0% $730,000 $960,000 -30.6% $479,950 $660,500 -36.7% $348,500 $405,950 -15.7%
Esquimalt $400,000 $449,450 -11.6% $530,000 $620,000 -16.2% $382,000 $475,000 -23.5% $242,000 $295,000 -21.1%
Langley(city) $268,200 $271,250 -0.4% $542,500 $715,000 -30.9% $296,500 $344,250 -15.3% $195,000 $225,000 -14.6%
Langley(township) $480,000 $625,000 -29.3% $678,000 $895,000 -31.1% $347,175 $439,900 -25.8% $275,597 $304,000 -9.5%
LionsBay $1,160,000 $1,425,000 -22.0% $1,200,000 $1,450,000 -20.0% $503,500 $737,500 46.5% NA NA NA
MapleRidge $469,489 $580,000 -22.7% $559,930 $700,000 -24.1% $317,900 $382,050 -19.3% $200,500 $229,000 -13.4%
Mission $407,661 $510,000 -24.2% $433,554 $540,000 -23.7% $235,000 $315,000 -33.1% $189,500 $193,250 -1.2%
NewWestminster $375,000 $430,250 -13.9% $818,500 $1,082,500 -31.3% $472,000 $615,014 -29.4% $318,650 $380,000 -18.4%
NorthSaanich $680,000 $800,000 -16.8% $715,000 $830,000 -15.3% $492,672 $575,000 -15.9% $537,750 $290,000 46.4%
NorthVancouver(city)
$549,950 $620,000 -12.0% $1,250,000 $1,550,000 -23.1% $749,000 $925,000 -22.6% $395,500 $510,215 -28.1%
NorthVancouver(district)
$982,500 $1,360,000 -37.5% $1,361,063 $1,668,427 -21.7% $679,000 $839,985 -22.8% $421,950 $480,000 -13.0%
OakBay $814,900 $1,045,000 -27.3% $867,500 $1,160,000 -32.8% $595,000 $820,000 -36.9% $435,000 $490,000 -11.9%
PittMeadows $431,505 $450,000 -3.6% $595,000 $755,000 -26.0% $369,000 $444,000 -19.5% $264,200 $293,250 -10.2%
PortCoquitlam $447,900 $470,950 -4.4% $671,000 $865,000 -28.0% $431,500 $518,050 -19.2% $249,000 $289,800 -15.5%
PortMoody $485,000 $550,000 -13.5% $969,000 $1,221,000 -26.1% $477,000 $592,800 -24.4% $393,000 $443,000 -12.8%
Richmond $558,000 $555,000 1.2% $1,275,000 $1,670,000 -30.1% $589,900 $739,000 -24.4% $390,000 $419,900 -6.9%
Sidney $420,250 $495,000 -17.0% $480,000 $599,500 -24.0% $453,750 $535,517 -17.2% $275,000 $339,000 -22.4%
Sooke $380,577 $405,000 -5.7% $389,677 $431,640 -10.0% $320,000 $321,500 0.3% $255,985 $219,000 15.0%
Squamish $505,000 $535,000 -23.8% $695,000 $870,000 -20.0% $425,000 $486,000 -10.5% $265,000 $336,500 -20.9%
Surrey $531,875 $544,000 -1.6% $701,000 $900,000 -27.5% $359,000 $450,000 -24.5% $238,950 $259,900 -8.0%
Vancouver $689,900 $715,000 -2.9% $1,760,000 $2,280,000 -28.6% $855,000 $1,100,000 -27.8% $478,000 $550,000 -14.3%
Victoria $395,000 $429,950 -8.1% $580,500 $725,000 -24.0% $495,000 $608,950 -22.2% $305,000 $330,000 -7.5%
WestVancouver $2,200,000 $2,821,500 -27.4% $2,568,000 $3,240,000 -25.3% $1,529,215 $1,838,000 -19.4% $854,000 $855,000 0.6%
WhiteRock $602,000 $601,000 0.9% $1,003,781 $1,437,500 -42.2% $523,809 $624,000 -18.3% $330,000 $318,000 4.3%
Source:Vancity,usingrealestatedatafromLandcorDataCorp.andregionalmedianhouseholdincomecalculations.
*Theaffordabilityshiftiscalculatedbycomparingtheyear-over-yearchangeinGDSratio.Forexample,ifapropertyrequired25%ofmedianhouseholdincomein2016and30%in2017,theaffordabilityofthat particularpropertydeclined20%.
Appendix I – Median price and change in affordability by municipality 2016-2017
18
Most affordable municipalities Least affordable municipalities
Municipality Medianprice GDS Municipality Medianprice GDS
Langley(city) $271,250 18.4% WestVancouver $2,821,500 191.8%
Sooke $405,000 24.2% LionsBay $1,425,000 96.9%
Victoria $429,950 25.7% NorthVancouver(district) $1,360,000 92.5%
Esquimalt $449,450 26.9% OakBay $1,045,000 62.5%
Chilliwack $385,000 27.9% Delta $855,000 58.1%
NewWestminster $430,250 29.3% BowenIsland $780,000 53.0%
Sidney $495,000 29.6% Vancouver $715,000 48.6%
PittMeadows $450,000 30.6% NorthSaanich $800,000 47.9%
PortCoquitlam $470,950 32.0% Squamish $535,000 42.8%
Abbotsford $472,870 34.6% Langley(township) $625,000 42.5%
CentralSaanich $600,500 35.9% NorthVancouver(city) $620,000 42.2%
Surrey $544,000 37.0% WhiteRock $601,000 40.9%
Burnaby $549,400 37.4% Coquitlam $580,000 39.4%
Mission $510,000 37.4% MapleRidge $580,000 39.4%
PortMoody $550,000 37.7% Richmond $555,000 37.7%
Richmond $555,000 37.7% PortMoody $550,000 37.7%
Coquitlam $580,000 39.4% Burnaby $549,400 37.4%
MapleRidge $580,000 39.4% Mission $510,000 37.4%
WhiteRock $601,000 40.9% Surrey $544,000 37.0%
NorthVancouver(city) $620,000 42.2% CentralSaanich $600,500 35.9%
Langley(township) $625,000 42.5% Abbotsford $472,870 34.6%
Squamish $535,000 42.8% PortCoquitlam $470,950 32.0%
NorthSaanich $800,000 47.9% PittMeadows $450,000 30.6%
Vancouver $715,000 48.6% Sidney $495,000 29.6%
BowenIsland $780,000 53.0% NewWestminster $430,250 29.3%
Delta $855,000 58.1% Chilliwack $385,000 27.9%
OakBay $1,045,000 62.5% Esquimalt $449,450 26.9%
NorthVancouver(district) $1,360,000 92.5% Victoria $429,950 25.7%
LionsBay $1,425,000 96.9% Sooke $405,000 24.2%
WestVancouver $2,821,500 191.8% Langley(city) $271,250 18.4%
Source:Vancity,usingrealestatedatafromLandcorDataCorp.andregionalmedianhouseholdincomecalculations.
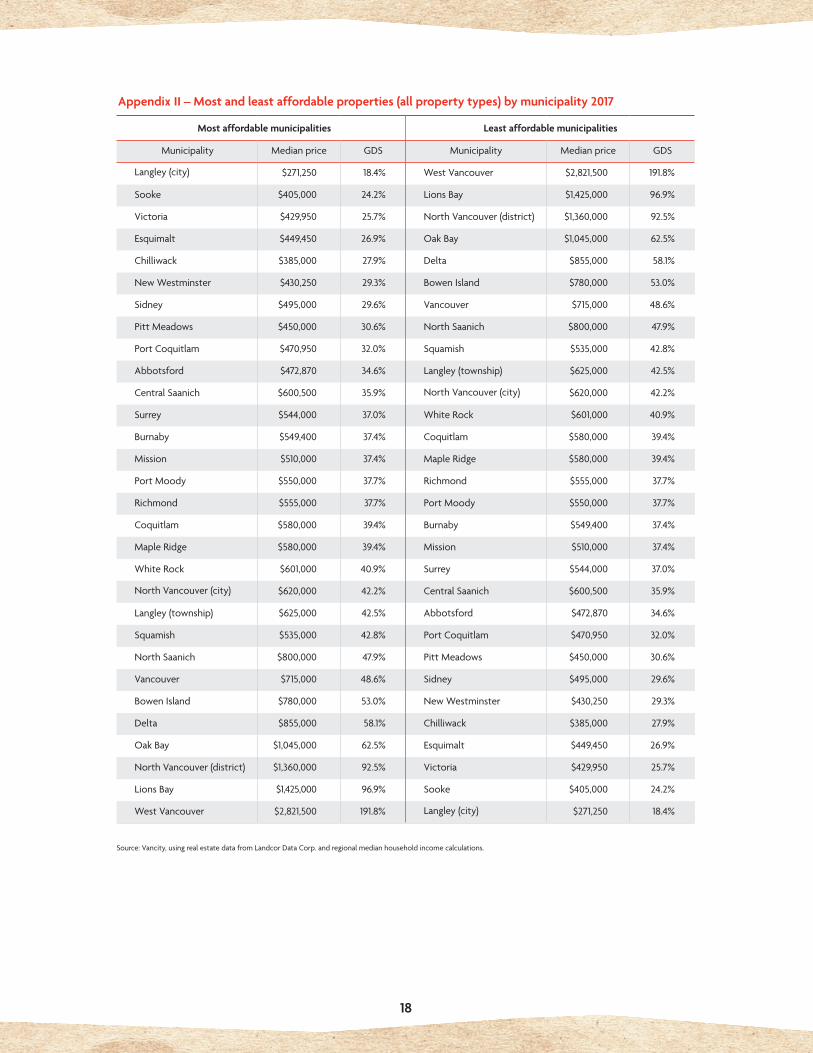
Appendix II – Most and least affordable properties (all property types) by municipality 2017

19
MethodologyLandcorDataCorp.calculatedmediansalepricesforeachareaexaminedbasedonallvalidsalesoffee-simpleresidentialproperties,bothnewandresale,ineachjurisdiction.BCAssessmentconsidersavalidsaleasatransactionbetweentwowillingpartieswithanarm’s-lengthrelationship.
CertainjurisdictionswithinMetroVancouverwereexcluded,however,owingtoahighproportionoflease-holdproperties.TheanalysisspecificallyomitsintheirentiretyElectoralDistrictA,whichincludestheUniversityofBritishColumbiaandUniversityEndowmentLands,andTsawwassenFirstNation.
Annualmedianpricesarecalculatedbasedonallreportedsalesinthe12monthsendedFebruary28/29oftheyearinquestion;forexample,themedianpricefor2013reflectsdatafromMarch1,2012toFebruary28,2013.Analysesforeachofthe12monthsendingFebruary28,2017,reflectreportedsalesforthecalendarmonthinquestion.
Affordabilitycalculationscorrelatemediansalepricesingivenmunicipalitieswiththemedianhouseholdincomeforthelargermetropolitanareainwhichthemunicipalitieslie;forexample,themedianhouseholdincomeofbothSurreyandRichmondareidenticalbecausebothareintheVancouverCMA(CensusMetropolitanArea)definedbyStatisticsCanada.Sincemanyresidentsliveinonecommunityandworkinanother,medianincomeforeachcommunitywasnotconsidered.
Medianincomefiguresfor2012-2014arefromStatisticsCanada;theyreflecttheincomesofcensusfamilies,whichincludeallmarriedandcommon-lawcouplesandtheirchildren(ifany),aswellassingleparentsandtheirchildren.15Todeterminemediantotalincomefor2015,2016and2017,BCStats’estimateofannualwageincreaseswereappliedtothe2014figure(BCStatspreparesitsestimatesusingStatisticsCanada’sLabourForceSurveydata).Theapplicableincreaseswere3.6%(2015),0.8%(2016)and0.1%(forthe12monthsendedFebruary28,2017).16
StatisticsCanada’smedianincomefiguresarehelpful,butmerelyprovideasnapshotthatdoesn’treflectthefullrangeofresourcesahouseholdhasatitsdisposalorwhichapurchaserorlendermightconsider.Ahouseholdwithhealthycashflowmaybeabletoclaiminvestmentlossesthatreducetotalincome,whileotherhouseholdsmaytapintosavingsorreceiveassistancefromparentstofacilitateahomepurchaseandtherebybringmortgagepaymentswithinwhattheydeemamanageablerange.
Grossdebtserviceratioswerecalculatedbydividingannualmortgagecarryingcostsatoriginationbymedianincome.Annualmortgagecarryingcostswerecalculatedusingthemediansalepriceineachperiodforeachpropertytypeandassumesthatbuyersmadeadownpaymentof20%andentereda25-yearmortgageattheBankofCanada’sfive-yearfixedratefortheperiod.Thiscalculationwasmadeunderstandingthatforhigherpricedproperties,adownpaymentof20%wouldberequiredandtheinterestrateofferedtomanywouldbelowerthantheBankofCanada’slendingrequirements.
Period 2013 2014 2015 2016 2017
Rate 5.27% 5.24% 4.80% 4.65% 4.66%
Table 8: Bank of Canada five-year fixed mortgage rate; 12-month average
Source:BankofCanada
PeriodMarch2016
April2016
May2016
June2016
July2016
Aug2016
Sept2016
Oct2016
Nov20;
Dec2016
Jan2017
Feb2017
Rate 4.64% 4.64% 4.64% 4.64% 4.74% 4.74% 4.64% 4.64% 4.64% 4.64% 4.64% 4.64%
Table 9: Bank of Canada five-year fixed mortgage rate; monthly average
Source:BankofCanada
2012 2013 2014 2015 2016 2017
Abbotsford-MissionCMA $66,550 $68,310 $70,590 $73,131 $73,716 $73,800
ChilliwackCMA $66,210 $69,160 $71,390 $73,960 $74,552 $74,637
VancouverCMA $71,140 $73,390 $76,040 $78,777 $79,408 $79,498
VictoriaCMA $81,580 $84,500 $86,430 $89,541 $90,258 $90,361
Table 7: Median total income, all families
Source:StatisticsCanada;VancitybasedonB.C.Statsreport.

20
References1. JesseDonaldson,“Vancouver’s128yearsofAffordabilityFears,”The Tyee,November24,2012;accessedMay1,2017at
https://thetyee.ca/Life/2012/11/24/Affordability-Crisis/
2. RennieMarketingSystems,“BobRennie’s2016AnnualUDIAddress:WeHavetoChangetheNarrative,”June17,2016;accessedMay1,2017at
http://about.rennie.com/video/2016-bob-rennie-udi-keynote/
3. Forthepurposesofthisreport,MetroVancouverrefersto23municipalitiesincludingAbbotsford,BowenIsland,Burnaby,Chilliwack,
Coquitlam,Delta,Langley(city),Langley(township),LionsBay,MapleRidge,Mission,NewWestminster,NorthVancouver(city),North
Vancouver(district),PittMeadows,PortCoquitlam,PortMoody,Richmond,Squamish,Surrey,Vancouver,WestVancouverandWhiteRock.
4. CanadaMortgageandHousingCorp.,“HowMuchCanYouAfford?”accessedMay1,2017atwww.cmhc-schl.gc.ca/en/co/moloin/moloin_004.cfm.CMHCconsidershousingaffordableifmortgagecosts,propertytaxesandmaintenance(suchasstratafeesand
heating)require32%orlessofahousehold’smonthlyincome,afigurealsoknownasthegrossdebtserviceratio.Thisreportdiverges
slightlyfromCMHC’sstandardinthatitdeemsaresidentialpropertyaffordableifmonthlymortgagepaymentsrequirenomorethan
32%ofthemedianhouseholdincomefortheparticularregionwherethehomeislocated.Stratafees,propertytaxes,andinsuranceand
othercostshomeownerstypicallyhavetopaymayconsumeafurther1%to2%ofmonthlyhouseholdincome.Furtherinformationis
availableintheMethodologysectionofthisreport.
5. Colloquiallyknownascondos,apartmentsarejustonepropertytypeheldascondominiumsinB.C.Thisreportusestheterm
“apartment”todistinguishthemfromattached,detachedandothertypesofcondos.
6. BCMinistryofFinance,Budget and Fiscal Plan, 2016/17-2018/19,February16,2016;accessedMay1,2017at
http://bcbudget.gov.bc.ca/2016/bfp/2016_budget_and_fiscal_plan.pdf#page=63
7. BCMinistryofFinance,“NewContractRulesProtectSellers,”May10,2016;accessedMay1,2017at
https://news.gov.bc.ca/releases/2016FIN0018-000756
8. OfficeofthePremier,“Actiononforeigninvestment,consumerprotectionandvacancyputsBritishColumbiansfirst,”July25,2016;
accessedMay1,2017athttps://news.gov.bc.ca/releases/2016PREM0080-001346
9. PropertyTransferTaxreport,June10toAug.31,2016;accessedMay24,2017at
https://news.gov.bc.ca/files/Property_Transfer_Tax_Report_June_10_to_Aug_31_2016.pdf
10.CanadaMortgageandHousingCorp.,Preliminary Impacts of the Foreign Buyers Tax on the Vancouver Housing Market (Oct.2016);
accessedMay1,2017atwww.cmhc-schl.gc.ca/odpub/esub/68556/68556_2016_M10.pdf.CorrespondencewithCMHCduringthe
preparationofthisreportconfirmsthattheinitialtrendcontinuedthroughMarch2017.
11. DepartmentofFinanceCanada,“MinisterMorneauAnnouncesPreventativeMeasuresforaHealthy,CompetitiveandStableHousing
Market,”October3,2016;accessedMay1,2017atwww.fin.gc.ca/n16/16-117-eng.asp
12.OfficeofthePremier,“Newprogrampartnerswithfirst-timehomebuyersastheyenterthehousingmarket,”December15,2016;
accessedFebruary24,2017athttps://news.gov.bc.ca/releases/2016PREM0154-002782
13.AndyRamlo,“4/20:FeelingPrettyHIGHAboutGrowth,”presentationtotheUrbanDevelopmentInstitute,Vancouver,BC,April20,2017;
accessedMay24,2017athttp://about.rennie.com/wp-content/uploads/2017/04/AndyRamlo_UDI-April-20-2017.pdf
14.CBCNews,“Victoriacitycouncilholdsbackonforeignbuyerstax,”May1,2017;accessedMay1,2017at
www.cbc.ca/news/canada/british-columbia/victoria-city-council-holds-back-on-foreign-buyers-tax-1.4093330
15.StatisticsCanada,Familycharacteristics,summary.CANSIMTable111-0009;accessedMay1,2017at
http://www5.statcan.gc.ca/cansim/a26?lang=eng&id=1110009
16.BCStats,Earnings & Employment Trends(February2017);currenteditionsareavailableat
www.bcstats.gov.bc.ca/StatisticsBySubject/LabourIncome/Earnings.aspx